the use of dris for nutritional diagnosis in oil palm in
TRANSCRIPT

ArticleRev Bras Cienc Solo 2017;41:e0150466
1https://doi.org/10.1590/18069657rbcs20150466
* Corresponding author: E-mail: [email protected]
Received: November 12, 2015Approved: September 27, 2016
How to cite: Matos GSB, Fernandes AR, Wadt PGS, Pina AJA, Franzini VI, Ramos HMN. The use of DRIS for nutritional diagnosis in oil palm in the state of Pará. Rev Bras Cienc Solo. 2017;41:e0150466. https://doi.org/10.1590/18069657rbcs20150466
Copyright: This is an open-access article distributed under the terms of the Creative Commons Attribution License, which permits unrestricted use, distribution, and reproduction in any medium, provided that the original author and source are credited.
The Use of DRIS for Nutritional Diagnosis in Oil Palm in the State of ParáGilson Sergio Bastos de Matos(1)*, Antonio Rodrigues Fernandes(1), Paulo Guilherme Salvador Wadt(2), Antônio José de Abreu Pina(3), Vinícius Ide Franzini(4) and Helen Monique Nascimento Ramos(5)
(1) Universidade Federal Rural da Amazônia, Instituto de Ciências Agrárias, Belém, Pará, Brasil.(2) Empresa Brasileira de Pesquisa Agropecuária, Embrapa Acre, Rio Branco, Acre, Brasil.(3) Marborges Agroindústria S.A., Gerência Agrícola, Moju, Pará, Brasil.(4) Empresa Brasileira de Pesquisa Agropecuária, Embrapa Amazônia Oriental, Belém, Pará, Brasil.(5) Universidade Federal Rural da Amazônia, Programa de Pós-Graduação em Agronomia, Belém, Pará, Brasil.
ABSTRACT: The oil palm crop has expanded significantly in the state of Pará, which has not been followed in a proportional manner by studies aiming at increasing yield through plant nutrition. The objective of this study was to evaluate general and specific norms of the Diagnosis and Recommendation Integrated System (DRIS) for genetic materials of oil palm (African and interspecific hybrid) at two ages (young and adult plants) and evaluate possible deficiencies in fertilization and soil correction practices. The DRIS norms were composed of means, standard deviations, and coefficients of variation of bivariate, specific, and general relationships among nutrients of 144 leaf samples. The DRIS norms specific for genetic material did not differ from the general norms; however, a large number of differences were found between specific bivariate relationships for age groups, among themselves, and in relation to the general norms. The regression analysis between the nutritional balance index and yield were better explained when age groups were discriminated. In the young plants, the number of cases of stands with deficiencies followed the order Ca > Fe > B > S > Mn > K > Mg = Cu > Zn > N > P; and for adults, this order was Ca > Mn > Zn > Fe > S = B > N = Cu > K > Mg > P. The DRIS norms can be utilized in diagnostics regardless of genetic material; however, they must be specified for the age of the plant. Most of the stands showed deficiency in Ca and micronutrients, coinciding with the least used nutrients in oil palm crops in the state of Pará, as well as emphasizing the need for soil liming.
Keywords: Elaeis guineensis Jacq., E. oleifera × E. guineensis, eastern Amazonia, plant nutrition.
Division – Soil Use and Management | Commission – Soil Fertility and Plant Nutrition
Matos et al. The Use of DRIS for Nutritional Diagnosis in Oil Palm...
2Rev Bras Cienc Solo 2017;41:e0150466
INTRODUCTIONAfrican oil palm (Elaeis guineensis Jacq.) is the most productive oleaginous plant, occupying an estimated area of 16.4 million hectares worldwide (Potts et al., 2014). Expansion in cultivation of this palm, combined with management practices aiming at achieving high yields, could completely satisfy the vegetable oil market for food and even satisfactorily meet the demands of the biofuel market (Fairhurst and Härdter, 2003). However, the demand for mineral fertilizers by this crop can reach 60 % of the production cost variable, leading researchers to concur in the importance of studies on fertilization and plant nutrition (Viégas and Müller, 2000; Rodrigues et al., 2006; Franzini et al., 2012), which are scarce in Brazil.
The use of leaf nutritional assessment based on the Diagnosis and Recommendation Integrated System (DRIS), in addition to the traditional methods such as the levels or critical ranges, is an important tool because it mitigates the distortions of diagnoses caused by the effect of dilution, concentration, age, or plant organ (Mourão Filho, 2004). For the calculation of DRIS, all ratios between nutrients are considered. They are then compared to the ratios of a reference population or standards, allowing calculation of indices that point to nutritional balance of the plant on a dimensionless scale (Beaufils, 1973).
The DRIS theory was developed with a universal character to make accurate diagnoses, regardless of the growing region, plant part, or phenological stage of the plant (Jones Jr, 1993) and cultivar (Reis Jr and Monerat, 2002), but the studies have diverged from these premises (Silva et al., 2005; Carvalho et al, 2011;. Martín et al, 2013). The need for studies to validate the scope of DRIS norms is now clear; therefore, the specific effect of the genetic material and plant age should be taken into account (Mourão Filho, 2004).
The most common sources of oil palm genetic material are the Tenera type African cultivar, which have been drastically affected by the anomaly of lethal yellowing (LY) that has no identified etiologic agent. As a result, such species have been replaced in areas of higher rainfall by interspecific hybrids (E. guineensis × E. oleifera), ISH, which are not affected by LY (Cunha et al., 2012).
Nutritional diagnoses for oil palm have been widely interpreted for African species and the ISH based on sufficiency ranges (Viégas and Müller, 2000). However, in addition to non-susceptibility to LY, ISH have distinct characteristics when compared to African palms, such as one third the speed of vertical stalk growth (0.20 m yr-1), tolerance to insect pests, and greater content of unsaturated oil (Lopes et al., 2012). Moreover, they have tolerance to waterlogged soils and water stress (Gomes Junior et al., 2014), a low rate of natural pollination (Lopes et al., 2012), and apparently higher nutritional requirements, especially for magnesium (Franzini et al., 2012) and boron.
Differences in performance among palm cultivars in the field should be considered in nutritional assessment in order to enhance the accuracy of leaf diagnostics and to contribute to proper fertilization management. It should also be noted that the natural increase in yield according to the age of the plant will be reflected in different nutritional requirements. Oil palms younger than six years old have higher leaf nutrient content than older palms (Fairhurst and Härdter, 2003), showing different nutrient relocation patterns. In addition, more accurate nutritional diagnostics can be used for calibrating fertilization of the crop, as well as for giving direction to the need for soil correction through liming, which is not a common practice for oil palm and it is questioned by producers (Franzini et al., 2012).
Variations in nutritional patterns diagnosed through DRIS were observed for different genetic materials and ages of Eucalyptus spp. (Wadt et al., 1999; Silva et al., 2005), suggesting the use of specific DRIS. However, for some cotton cultivars (Gossypium hirsutum) (Singh et al., 2012) and for two age groups of cupuaçu trees Theobroma

Matos et al. The Use of DRIS for Nutritional Diagnosis in Oil Palm...
3Rev Bras Cienc Solo 2017;41:e0150466
grandiflorum (Dias et al., 2010), the general DRIS, regardless of the genetic material or age, was successful for nutritional diagnosis of these species.
In this context, the hypothesis was that Specific DRIS norms are more suitable for diagnosis than general ones and are able (through the DRIS indices) to highlight the major nutritional limitations of the oil palm. The objective of this study was to evaluate the use of preliminary norms of DRIS as a tool to carry out nutritional diagnoses in oil palm according to the genetic material and plant age, and to identify possible deficiencies in soil correction practices and fertilization adopted for this crop in the state of Pará, Brazil.
MATERIALS AND METHODS
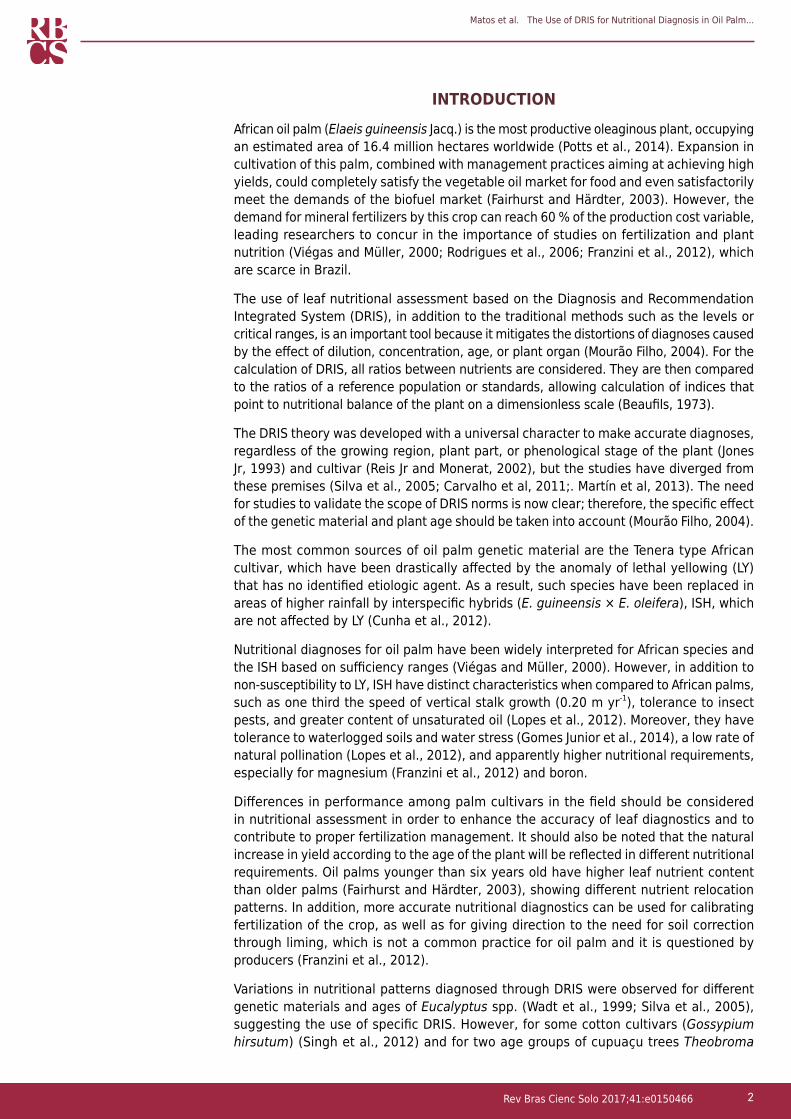
We monitored 33 commercial stands of African oil palms (Elaeis guineensis Jaqc.) and their interspecific hybrid (E. oleifera × E. guineensis) - ISH, distributed in the municipalities of Moju and Tomé-Açu, in the northeast of the state of Pará (Figure 1). In this region, the average annual temperatures were 26 °C, with average annual rainfall of 2,500 mm in Moju and 2,300 mm in Tomé-Açu, with less rain in the months of July and August.
In the routine commercial collections, performed over a maximum of 30 days in the least rainy period of the year (November/2011; December/2012; September/2013; November/2015), the eight central leaflets of leaf number 17 were considered from about 24 to 30 plant from rows located from ¼ to ¾ of the east-west extension of the stand (Rodrigues et al., 2006). Leaf number 17 corresponds to the index leaf for nutritional diagnosis considering that oil palm phyllotaxis is arranged in spirals where counting begins at the apex after the arrow-leaf and ends at the leaf nearest the soil. A total
49°6’40”W 46°50’50”W 48°35’0”W 48°19’10”W 48°3’20”W 47°47’30”
2°55
’0”S
2°42
’30”
S2°
30’0
”S2°
17’3
0”S
2°5’
0”S
1°52
’30”
S1°
40’0
”S1°
27’3
0”S
2°55
’0”S
2°42
’30”
S2°
30’0
”S2°
17’3
0”S
2°5’
0”S
1°52
’30”
S1°
40’0
”S1°
27’3
0”S
49°6’40”W 46°50’50”W 48°35’0”W 48°19’10”W 48°3’20”W 47°47’30”
PARÁ
Brazil N
S
W EPONTA DE PEDRAS
MUANA BARCARENA
ABAETETUBA
LIMOEIRO DO AJURU
IGARAPE-MIRI
CAMETA
MOCAJUBA
MOJU
ACARA
AURORA DO PARA
TOME-ACU
TOME-ACU PIXUNADO PARA
PARAGOMINAS
0 75 150m48°25’50”W 48°25’0”W 48°24’10”W
48°25’50”W 48°25’0”W 48°24’10”W
2°32
’0”S
2°31
’0”S
2°32
’0”S
2°31
’0”S
48°37’20”W 48°36’0”W 48°34’40”W
2°0’
0”S
1°58
’0”S
2°1’
20”S
2°0’
0”S
1°58
’0”S
2°1’
20”S
48°37’20”W 48°36’0”W 48°34’40”W
MOJU
Coordinate System: SIRGAS 2000 UTM Zone 22SProjection: Transverse Mercator
Datum: SIRGAS 2000
Figure 1. Location of commercial oil palm stands in the municipalities of Moju and Tomé-Açu in northeastern Pará, Eastern Amazon, Brazil.
Matos et al. The Use of DRIS for Nutritional Diagnosis in Oil Palm...
4Rev Bras Cienc Solo 2017;41:e0150466
of 144 collected samples were washed in distilled water; the leaflets were dried in a forced-air circulation oven at 65 °C and subsequently passed through a 20-mesh sieve. After that, the samples were subjected to chemical analysis of the total content of N, P, K, Ca, Mg, S, B, Cu, Fe, Mn, and Zn, according to the method described in Malavolta et al. (1997). Composite soil samples were formed from 25 individual samples in 35 stands containing both African palm and ISH (at different ages) for chemical and particle size (0.00-0.20 m) characterization. These samples were collected from under the canopy projection between the rows of plants whose leaves were sampled. Soil analysis was performed according to Donagema et al. (2011) (Table 1).
Using the results of leaf analysis and yield data from fresh fruit bunches in Mg ha-1 accumulated each year, the means and standard deviations of nutritional relationships (bivariate) of the reference populations were calculated. The general population (not discriminating genetic material and age) consisted of African oil palm, interspecific hybrid oil palm (ISH), young oil palm (≤6 years of age), and adult oil palm (>6 years of age).
Following common practice in the areas evaluated, soil correction through liming was not performed and palm tree seedlings were planted in holes spaced in an equilateral triangle (9 × 9 × 9 m) along with 300 g of natural reactive phosphate (10 % of P2O5 soluble in citric acid).
In young crops, maintenance mineral fertilization was performed with NPK+Mg+S formulations according to recommendations made on the basis on leaf analysis. The use of natural phosphate in topdressing was common in all areas in the first five years after planting, on average. Organic waste from agricultural industry was applied on young
Table 1. Chemical properties and particle size of soil samples (0.00-0.20 m)Property Mean MedianpH(CaCl2) 4.29 4.20P (mg dm-3) 5.5 2.0K+ (cmolc dm-3) 0.09 0.07Ca2+ (cmolc dm-3) 0.96 0.90Mg2+ (cmolc dm-3) 0.25 0.20Na+ (cmolc dm-3) 0.04 0.03Al3+ (cmolc dm-3) 0.36 0.30H+Al (cmolc dm-3) 3.97 4.00CEC pH 7.0 (cmolc dm-3) 5.28 5.36SB (cmolc dm-3) 1.34 1.27V (%) 25.70 25.88m (%) 22.04 19.11S (mg dm-3) 20.1 21.0B (mg dm-3) 0.5 0.5Cu (mg dm-3) 0.4 0.3Fe (mg dm-3) 232 195Mn (mg dm-3) 7.0 5.0Zn (mg dm-3) 2.1 1.7Sand (g kg-1) 594 590Silt (g kg-1) 130 150Clay (g kg-1) 277 270OM (%) 2.0 2.0
Methods of extraction and determination in according with Donagema et al. (2011). pH(CaCl2): pH in CaCl2 solution; H+Al: potential acidity; CEC: cation exchange capacity; SB: sum of bases; V: bases saturation; m: aluminum saturation; OM: organic matter.

Matos et al. The Use of DRIS for Nutritional Diagnosis in Oil Palm...
5Rev Bras Cienc Solo 2017;41:e0150466
plants as follows: 6 Mg ha-1 of empty fruit or stems (containing 9.8 kg of N, 1.1 kg of P, 16.4 kg of K, 8.4 kg of Ca, 2.6 kg of Mg, 1.1 kg of S, 15.2 g of B, 15.1 g of Cu, 28 g of Zn, 41.9 g of Mn, and 430.8 g of Fe for each Mg of dry weight), 2 Mg ha-1 of mesocarp fiber (containing 12.1 kg of N, 1.9 kg of P, 4.7 kg of K, 7.6 kg of Ca, 1.8 kg of Mg, 1.1 kg of S, 16.6 g of B, 23 g of Cu, 19.7 g of Zn, 25.3 g of Mn, and 415 g of Fe per Mg of dry matter), and 65 Mg ha-1 of effluent (with 28 g m-3 of N; 13.5 g m-3 of P; 1,157 g m-3 of K; 365 g m-3 of Ca; 335 g m-3 of Mg; and 166 g m-3 of S).
In crops where productive maturity started at 6 to 7 years, 91 kg N, 22 kg of P2O5, 175 kg K2O, 28 kg of MgO, 25 kg of CaO, and 12 kg of S were applied per hectare for a yield of 25 Mg ha-1 of fresh fruit bunches. These older plantations receive the micronutrients Cu, Mn, and Zn along with NPK formulations seasonally. Additionally, about 100 g per plant of Ulexite or Borax has been applied as a source of B. In both young and adult plants, the Mg source is magnesium oxide and especially kieserite. Fungicides based on Cu were not applied on the crops, a factor that could influence its content in the plant.
In the database containing the content of each nutrient and the yield of reference subpopulations (satisfactory yield), the Lilliefors test (p<0.05) was applied according to Barbosa et al. (2006), for verification of normality. From that, the following stands were selected:
(a) The general population consisted of 19 stands that showed high yield, over 24 Mg ha-1, which is a reference value for mature palms considered as having satisfactory yield (PalmElit, 2014). In bivariate relationships, for the specific reference population of African oil palms and ISH, the areas selected were those with yield higher than 19 Mg ha-1, which represented 23 and 21 samples, respectively; and
(b) The reference population for the age groups were composed of stands with yields above 9 Mg ha-1 in young plants (31 samples) and 19 Mg ha-1 for the adult plants (37 samples). The separation value of population set for young plants was the mean yield of all stands, which, in turn, is regarded as very high for crops at this age in the region.
Yield values established to separate specific reference populations were similar to those used in irrigated plantations of oil palm in India (Behera et al., 2015). In this study, stands with yield higher than 20 Mg ha-1 were characterized as high yielding for generation of DRIS norms.
The reference populations above had a low number of samples in their composition, which is due to the low yield of most stands according to the standards published for oil palm (PalmElit, 2014). However, the number of samples used as a reference in this study, around 20 or more, is considered sufficient for DRIS diagnosis according to Partelli et al. (2006) and Dias et al. (2010). The low yield of the plots evaluated is mainly due to fertilizer application rates that were not consistent with the nutritional requirements of the species. In this respect, a key factor was the low value of Ca in the soil (Table 1) as a result of not using liming in this crop.
The bivariate relationship groups resulting from the general and specific reference population from plots with African palm or with ISH were compared to each other (in a paired manner), in which the number of samples that formed the norms corresponded to the number of replications for each population. Similarly, the bivariate relationships of the general control and specific populations with young and adult palms were also compared.
Comparisons were performed by means of their variances using the F test, and their means, using the Student t test, both at 5 % probability. According to Dias et al. (2010), use of the t test complementing this type of comparison was necessary since the lack of a significant F test only indicates that the relationships were obtained in relatively homogeneous environments, but this did not avoid the occurrence of different averages, considering that the resulting variances of the DRIS method come from a variety of uncontrolled factors, not only from the availability of nutrients.

Matos et al. The Use of DRIS for Nutritional Diagnosis in Oil Palm...
6Rev Bras Cienc Solo 2017;41:e0150466
When a large number of significant differences was found among the reference populations through their relationships, they were used to calculate the DRIS indices and nutritional balance index (NBI). The paired ratios of the most important nutrients (norms) were chosen according to the criterion of the highest variance ratio (Letzsch, 1985), and DRIS indices were calculated according to Beaufils (1973). From the DRIS indices, the NBI was calculated according to the expression NBI = | N Index | + | P index | + ... + | Index Zn |, as well as its mean value, which corresponds to the value of NBI divided by the number of nutrients of analysis (NBIm). The DRIS and NBI indices make up the dimensionless values.
The indices calculated for all samples (reference and non-reference subpopulation) were interpreted in two manners. First, regressions were adjusted between NBI and yield in the general and specific populations. Then, the potential response to fertilization (PRF) was calculated, in which three nutritional classes were established: poor, adequate, or excessive (Wadt et al., 1999). The nutrient was considered appropriate when the nutritional content, in module, was lower than the NBIm; poor, when the negative nutritional content, in module, was also higher than NBIm; and excessive, when the positive nutritional content was, in module, greater than the NBIm. The PRF was presented graphically according to the nutritional status of the DRIS indices (deficient, adequate, or excessive).
The nutritional evaluation methods and F and t statistical tests were calculated using electronic spreadsheets.
RESULTS AND DISCUSSION The values of the means, standard deviations, and coefficients of variation of the paired ratios of nutrient factors in the stands with satisfactory production of the general or specific population of palm oil for age and genetic material (Tables 2 and 3) may be diagnostic parameters of this crop. Regarding oil palm, the ratios between N and P, N and K, K and Mg, and K and B are considered the most important ones in the field (Fairhurst and Härdter, 2003). The N/P ratio is a well-known index for this crop; and it should be around 16 to characterize balanced P and N nutrition (Rodrigues et al., 2006). Thus, all the N/P ratios found in this study are balanced.
Such nutritional ratios also provide support for obtaining DRIS norms, which can be calculated by the F method (Letzsch, 1985) or by the R method of Nick (1997), which selects only the orders of the most important ratios (half of the ratios). The DRIS norms can also be composed of all ratios (direct or inverse), as was done for the ‘Pera’ orange (Citrus sinensis) crop (Dias et al., 2013).
For oil palm crops, locally or regionally developed DRIS norms may provide greater accuracy in the diagnosis of nutritional imbalances (Wadt et al., 2012). For this crop, DRIS norms were established recently, but under the conditions of Colombia (Herrera Peña, 2015) and India (Behera et al., 2015), where cultivars or ages were not distinguished.
Regardless of the reference population, the highest coefficients of variations are around 30 % and appear more frequently in the ratios containing Cu and Zn. The ratios with higher coefficients of variations have less influence on obtaining DRIS indices since the reduced functions are weighted by this variable (Santana et al., 2008). These values can also indicate higher nutritional imbalances for these nutrients.
For genetic materials, only the ratios N/Ca, N/Mn, K/Ca, Ca/Mg, Ca/N, Ca/K, S/Mn, S/N, S/ K, S/Mg, and Mn/S, out of the total of 110, showed significant differences (Table 4). Such relationships correspond to 10 % of the total, when the general reference population was compared to the ISH reference population. Most of these discrepant relationships involve Ca and S. By comparing the reference population of African palm with that of ISH, only the ratios N/Ca, Ca/Zn, Ca/N, Mg/Fe, S/Mn, B/Mn, Mn/Zn, and Mn/S were different (p<0.05).

Matos et al. The Use of DRIS for Nutritional Diagnosis in Oil Palm...
7Rev Bras Cienc Solo 2017;41:e0150466
Table 2. Average (x), standard deviation (s), and coefficient of variation (CV) of the macro (g kg-1) and micronutrients (g kg-1) contents and nutritional relationships for a general control population (indiscriminately for genetic material and age) and for specific reference populations with African type oil palm and interspecific hybrids (IHE)
General CV African CV IHE CV General CV African CV IHE CVx s x s x s x s x s x s% % % % % %
N 27.9 2.5 9 27.3 2.6 10 26.5 2.4 9 B 24.4 5.1 21 24.4 5.16 21 24.3 5.1 21N/P 17.68 2.51 14 16.98 2.36 14 16.54 3.14 19 B/Cu 4.45 1.5 33 4.39 1.49 34 4.9 1.51 31N/K 3.95 0.95 24 4.05 0.85 21 3.95 0.66 17 B/Fe 0.29 0.1 29 0.27 0.07 26 0.3 0.06 21N/Ca 3.98 0.83 21 3.78 0.80 21 3.30 0.69 21 B/Mn 0.10 0.0 23 0.09 0.02 21 0.1 0.04 36N/Mg 13.67 2.57 19 13.22 2.05 15 13.12 2.45 19 B/Zn 1.51 0.3 21 1.47 0.33 22 1.6 0.45 27N/S 23.84 5.76 24 22.72 6.09 27 21.16 6.86 32 B/N 8.41 1.4 16 8.37 1.49 18 9.2 1.95 21N/B 0.12 0.02 17 0.12 0.02 19 0.11 0.02 19 B/P 148 30.8 21 142 31.01 22 152 35.16 23N/Cu 0.53 0.13 25 0.52 0.15 28 0.53 0.15 28 B/K 33.49 10.7 32 33.9 9.45 28 36.4 8.42 23N/Fe 0.03 0.01 24 0.03 0.01 21 0.03 0.01 25 B/Ca 33.15 7.5 23 31.3 7.41 24 30.2 7.58 25N/Mn 0.01 0.00 18 0.01 0.00 18 0.01 0.00 22 B/Mg 115 29.2 25 109.9 21.76 20 120.5 29.65 25N/Zn 0.18 0.04 23 0.18 0.04 23 0.18 0.03 20 B/S 202 60.7 30 191.1 65.18 34 195.2 77.11 40P 1.70 0.03 2 1.80 0.29 16 1.70 0.20 12 Cu 5.87 1.3 22 5.97 1.30 22 5.7 1.31 23P/K 0.23 0.06 28 0.24 0.05 22 0.24 0.05 20 Cu/Fe 0.07 0.0 35 0.07 0.02 34 0.1 0.03 38P/Ca 0.23 0.05 20 0.22 0.05 21 0.20 0.04 20 Cu/Mn 0.03 0.0 35 0.02 0.01 36 0.0 0.01 32P/Mg 0.78 0.16 21 0.79 0.14 17 0.81 0.14 17 Cu/Zn 0.37 0.1 31 0.36 0.11 30 0.3 0.10 28P/S 1.37 0.35 26 1.37 0.40 29 1.31 0.43 33 Cu/N 2.02 0.5 25 2.05 0.51 25 2.0 0.47 23P/B 0.01 0.00 21 0.01 0.00 23 0.01 0.00 26 Cu/P 35.63 9.4 26 34.86 9.47 27 33.7 10.83 32P/Cu 0.03 0.01 32 0.03 0.01 37 0.03 0.01 41 Cu/K 7.90 2.3 29 8.30 2.50 30 8.0 2.51 31P/Fe 0.00 0.00 23 0.00 0.00 21 0.00 0.00 20 Cu/Ca 8.19 3.0 37 7.92 2.98 38 6.8 2.61 38P/Mn 0.00 0.00 20 0.00 0.00 21 0.00 0.00 27 Cu/Mg 27.63 9.1 33 27.2 8.72 32 26.4 7.40 28P/Zn 0.01 0.00 29 0.01 0.00 29 0.01 0.00 26 Cu/S 48.1 16.8 35 46.4 17.37 37 43.0 19.3 45P/N 0.06 0.01 15 0.06 0.01 14 0.06 0.01 18 Cu/B 0,25 0.1 32 0.3 0.09 34 0.2 0.08 35K 7.70 1.50 19 7.80 1.49 19 7.50 1.60 21 Fe 90.00 21.8 24 89.0 23.51 26 91.4 19.50 21K/Ca 1.04 0.25 24 0.96 0.20 21 0.86 0.27 31 Fe/Mn 0.38 0.1 29 0.4 0.10 28 0.4 0.12 35K/Mg 3.61 0.94 26 3.39 0.85 25 3.37 0.61 18 Fe/Zn 5.73 2.1 36 5.8 1.90 33 5.7 1.48 26K/S 6.38 2.27 36 5.88 2.01 34 5.60 2.35 42 Fe/N 30.9 7.2 23 32.2 6.58 20 32.6 8.16 25K/B 0.03 0.01 32 0.03 0.01 30 0.03 0.01 28 Fe/P 543 144 26 544.4 136 25 524 106.8 20K/Cu 0.14 0.06 42 0.14 0.06 46 0.14 0.05 36 Fe/K 122 38.4 32 128.9 32 25 128 35.05 27K/Fe 0.01 0.00 36 0.01 0.00 31 0.01 0.00 29 Fe/Ca 121 30.0 25 120.6 30 25 105 25.25 24K/Mn 0.00 0.00 30 0.00 0.00 29 0.00 0.00 32 Fe/Mg 414 82.1 20 416.8 68 16 418.7 93.59 22K/Zn 0.05 0.02 38 0.05 0.02 36 0.05 0.01 32 Fe/S 733 233 32 731.0 237 32 675 242 36K/N 0.27 0.07 27 0.26 0.06 25 0.26 0.05 18 Fe/B 3.78 1.1 29 3.9 1.01 26 3.6 0.73 21K/P 4.70 1.20 25 4.34 0.91 21 4.28 1.01 24 Fe/Cu 16.19 5.2 32 16.8 5.78 34 17.5 7.28 42Ca 7.70 1.70 22 7.70 1.85 24 7.80 1.60 21 Mn 258 74.2 29 260.0 76.00 29 255 72.00 28Ca/Mg 3.53 0.76 21 3.60 0.71 20 4.10 0.90 22 Mn/Zn 15.13 3.3 22 15.9 3.09 19 17.1 4.79 28Ca/S 6.14 1.64 27 6.11 1.65 27 6.61 2.40 36 Mn/N 84.16 16.2 19 91.0 16.44 18 97 20.03 21Ca/B 0.03 0.01 22 0.03 0.01 22 0.03 0.01 22 Mn/P 1477 304 21 1540 328 21 1597 437 27Ca/Cu 0.14 0.06 43 0.15 0.07 46 0.17 0.08 46 Mn/K 331 94.9 29 367 96 26 384 105 27Ca/Fe 0.01 0.002 27 0.01 0.00 28 0.01 0.00 23 Mn/Ca 330 72.7 22 338 68 20 314 73.4 23Ca/Mn 0.00 0.001 20 0.00 0.00 20 0.00 0.00 21 Mn/Mg 1136 248 22 1194 249 21 1256 288 23Ca/Zn 0.05 0.01 30 0.05 0.01 29 0.06 0.02 32 Mn/S 1969 449 23 2024 506 25 2064 798 39Ca/N 0.26 0.06 21 0.28 0.06 20 0.32 0.06 20 Mn/B 10.22 2.3 23 11.1 2.37 21 11.0 3.21 29Ca/P 4.57 0.90 20 4.63 0.96 21 5.12 1.02 20 Mn/Cu 44.81 16.2 36 47.7 16.53 35 51.7 20.0 39Ca/K 1.01 0.23 22 1.09 0.23 21 1.24 0.31 25 Mn/Fe 2.87 0.9 31 2.9 0.81 27 3.1 0.92 29Mg 2.44 0.5 20 2.50 0.52 21 2.40 0.50 21 Zn 17.12 4.6 27 17.1 4.20 25 17.2 5.2 30Mg/S 1.80 0.53 30 1.76 0.55 31 1.69 0.66 39 Zn/N 5.75 1.3 23 5.9 1.27 22 5.9 1.33 23Mg/B 0.01 0.00 23 0.01 0.00 21 0.01 0.00 24 Zn/P 103 32.4 32 101.1 31.48 31 98.2 31.06 32Mg/Cu 0.04 0.01 30 0.04 0.01 32 0.04 0.02 37 Zn/K 23.2 9.3 40 24.3 9.05 37 23.7 7.66 32Mg/Fe 0.00 0.001 23 0.00 0.00 15 0.00 0.00 25 Zn/Ca 23.2 9.5 41 22.5 8.43 38 19.8 6.89 35Mg/Mn 0.00 0.000 19 0.00 0.00 20 0.00 0.00 23 Zn/Mg 79 22.8 29 77.9 21.06 27 77.8 23.22 30Mg/Zn 0.01 0.004 29 0.01 0.00 28 0.01 0.00 27 Zn/S 136 48.8 36 132.1 47.21 36 121.1 36.57 30Mg/N 0.08 0.013 17 0.08 0.01 15 0.08 0.01 16 Zn/B 0.69 0.2 24 0.71 0.16 23 0.7 0.20 29Mg/P 1.33 0.27 20 1.31 0.22 17 1.28 0.22 17 Zn/Cu 3.02 1.1 35 3.04 1.00 33 3.1 0.81 27Mg/K 0.29 0.07 24 0.31 0.06 21 0.31 0.06 19 Zn/Fe 0.20 0.1 39 0.19 0.07 34 0.2 0.06 32Mg/Ca 0.30 0.07 24 0.29 0.06 22 0.26 0.07 26 Zn/Mn 0.07 0.0 26 0.07 0.02 24 0.1 0.02 31S 1.3 0.050 4 1.4 0.54 39 1.3 0.5 38S/B 0.01 0.002 38 0.01 0.00 38 0.01 0.00 42S/Cu 0.02 0.009 37 0.02 0.01 39 0.03 0.01 48S/Fe 0.00 0.001 36 0.00 0.00 45 0.00 0.00 45S/Mn 0.00 0.000 30 0.00 0.00 32 0.00 0.00 55S/Zn 0.01 0.003 31 0.01 0.00 31 0.01 0.00 40S/N 0.04 0.013 30 0.048 0.016 34 0.054 0.02 44S/P 0.80 0.286 36 0.826 0.35 42 0.883 0.38 43S/K 0.18 0.062 35 0.196 0.085 44 0.217 0.11 50S/Ca 0.18 0.052 30 0.177 0.053 30 0.176 0.07 42S/Mg 0.61 0.219 36 0.640 0.257 40 0.725 0.38 52

Matos et al. The Use of DRIS for Nutritional Diagnosis in Oil Palm...
8Rev Bras Cienc Solo 2017;41:e0150466
Table 3. Average (x), standard deviation (s), and coefficient of variation (CV) of the macro (g kg-1) and micronutrients (g kg-1) contents and nutritional relationships of reference populations with young (≤6 years after planting) and adult (>6 years after planting) palms
≤6 years CV >6 years CV ≤6 years CV >6 years CVx s x s x s x s% % % %
N 26.9 2.33 9 26.9 2.66 10 B 24.7 5.68 23 24.2 4.6 19N/P 15.91 2.46 15 16.74 2.85 17 B/Cu 4.69 0.96 21 4.61 1.59 34N/K 3.82 1.11 29 4.06 0.74 18 B/Fe 0.27 0.07 25 0.27 0.07 26N/Ca 3.18 0.50 16 3.60 0.82 23 B/Mn 0.09 0.03 38 0.09 0.02 26N/Mg 11.68 2.50 21 13.21 2.35 18 B/Zn 1.51 0.59 39 1.49 0.35 23N/S 20.45 7.29 36 21.92 6.34 29 B/N 0.89 0.24 27 0.86 0.15 17N/B 1.19 0.27 23 1.20 0.22 18 B/P 13.94 3.14 23 14.27 3.16 22N/Cu 5.44 1.20 22 5.35 1.57 29 B/K 3.33 0.98 29 3.49 0.91 26N/Fe 0.31 0.07 22 0.32 0.07 23 B/Ca 2.82 0.83 30 3.04 0.70 23N/Mn 0.10 0.03 26 0.11 0.02 20 B/Mg 10.23 2.61 26 11.27 2.66 24N/Zn 1.66 0.36 22 1.76 0.39 22 B/S 18.52 8.28 45 18.67 6.30 34P 1.77 0.27 15 1.73 0.25 14 Cu 5.71 1.17 20 5.98 1.41 24P/K 0.24 0.06 23 0.25 0.05 21 Cu/Fe 0.06 0.02 29 0.07 0.02 38P/Ca 0.20 0.03 14 0.22 0.05 22 Cu/Mn 0.02 0.01 34 0.02 0.01 35P/Mg 0.74 0.13 18 0.80 0.14 18 Cu/Zn 0.32 0.10 32 0.35 0.11 30P/S 1.32 0.49 37 1.34 0.41 30 Cu/N 0.19 0.04 22 0.20 0.05 26P/B 0.08 0.02 22 0.07 0.02 24 Cu/P 3.04 0.70 23 3.39 1.06 31P/Cu 0.35 0.08 24 0.33 0.14 41 Cu/K 0.72 0.21 29 0.82 0.26 31P/Fe 0.02 0.01 26 0.02 0.004 20 Cu/Ca 0.61 0.17 28 0.75 0.30 40P/Mn 0.01 0.00 26 0.01 0.002 24 Cu/Mg 2.25 0.70 31 2.67 0.87 32P/Zn 0.11 0.03 30 0.11 0.03 28 Cu/S 3.91 1.61 41 4.44 1.86 42P/N 0.06 0.01 14 0.06 0.01 17 Cu/B 0.22 0.05 21 0.25 0.09 36K 8.14 1.45 18 7.37 1.49 20 Fe 88 24.28 28 91.5 19.8 22K/Ca 0.88 0.25 28 0.91 0.21 24 Fe/Mn 0.34 0.11 32 0.36 0.11 29K/Mg 3.15 0.62 20 3.34 0.75 23 Fe/Zn 5.62 1.60 29 5.72 1.70 30K/S 5.84 2.59 44 5.57 1.86 33 Fe/N 3.42 0.80 23 3.25 0.71 22K/B 0.33 0.10 30 0.31 0.09 29 Fe/P 54.66 18.22 33 53.61 12.46 23K/Cu 1.50 0.44 29 1.39 0.61 44 Fe/K 13.20 5.87 44 13.10 3.42 26K/Fe 0.09 0.03 31 0.08 0.03 30 Fe/Ca 10.99 3.72 34 11.48 2.83 25K/Mn 0.03 0.01 31 0.03 0.01 27 Fe/Mg 39.92 12.39 31 42.10 8.29 20K/Zn 0.48 0.18 37 0.46 0.15 33 Fe/S 68.66 24.83 36 69.99 22.07 32K/N 0.28 0.06 23 0.26 0.05 21 Fe/B 3.99 1.19 30 3.87 0.93 24K/P 4.37 1.01 23 4.22 0.86 20 Fe/Cu 18.62 6.59 35 17.54 6.83 39Ca 8 1.82 23 7.53 1.67 22 Mn 275 80 29 24.5 67 273Ca/Mg 3.71 0.74 20 3.80 0.86 23 Mn/Zn 17.66 5.98 34 16.34 4.03 25Ca/S 6.64 2.57 39 6.27 2.03 32 Mn/N 10.48 2.37 23 9.36 1.82 19Ca/B 0.38 0.10 27 0.35 0.07 22 Mn/P 165.8 41.8 25 156.1 38.98 25Ca/Cu 1.76 0.50 28 1.62 0.79 49 Mn/K 39.50 12.90 33 37.79 9.48 25Ca/Fe 0.10 0.03 31 0.09 0.02 25 Mn/Ca 32,97 8.02 24 33.07 7.54 23Ca/Mn 0.03 0.01 25 0.03 0.01 22 Mn/Mg 119,9 29.02 24 122.01 25.61 21Ca/Zn 0.54 0.18 33 0.52 0.17 33 Mn/S 212,5 78.74 37 203.67 63.72 31Ca/N 0.32 0.05 16 0.29 0.07 22 Mn/B 12,54 4.30 34 11.21 2.66 24Ca/P 5.06 0.67 13 4.81 1.06 22 Mn/Cu 57,62 20.13 35 50.37 18.95 38Ca/K 1.22 0.31 26 1.16 0.27 23 Mn/Fe 3,23 1.06 33 3.00 0,82 27Mg 2.64 0.51 19 2.29 0.43 19 Zn 16,6 4.4 27 17.5 4,7 27Mg/S 1.87 0.76 41 1.72 0.59 34 Zn/N 0.64 0.16 26 0.59 0.13 23Mg/B 0.11 0.03 30 0.09 0.02 23 Zn/P 10.31 3.70 36 10.03 3.23 32Mg/Cu 0.49 0.15 32 0.42 0.15 36 Zn/K 2.56 1.37 54 2.44 0.83 34Mg/Fe 0.03 0.01 33 0.02 0.01 21 Zn/Ca 2.06 0.72 35 2.17 0.83 38Mg/Mn 0.01 0.002 24 0.01 0.00 20 Zn/Mg 7.71 3.51 46 7.86 2.25 29Mg/Zn 0.15 0.05 36 0.14 0.04 28 Zn/S 12.72 6.13 48 12.81 4.47 35Mg/N 0.09 0.02 21 0.08 0.01 16 Zn/B 0.78 0.32 42 0.71 0.17 25Mg/P 1.40 0.25 18 1.29 0.23 18 Zn/Cu 3.50 1.33 38 3.12 0.95 31Mg/K 0.33 0.07 21 0.31 0.06 20 Zn/Fe 0.20 0.07 34 0.19 0.06 33Mg/Ca 0.28 0.06 20 0.28 0.07 25 Zn/Mn 0.07 0.03 49 0.07 0.02 29S 1.34 0.55 41 1.34 0.54 40S/B 0.07 0.03 51 0.06 0.02 37S/Cu 0.30 0.12 39 0.27 0.12 45S/Fe 0.02 0.01 44 0.02 0.01 41S/Mn 0.01 0.003 51 0.01 0.003 47S/Zn 0.09 0.03 30 0.09 0.03 38S/N 0.06 0.02 37 0.05 0.02 39S/P 0.90 0.42 47 0.85 0.35 41S/K 0.22 0.12 55 0.21 0.09 43S/Ca 0.18 0.08 44 0.18 0.06 35S/Mg 0.67 0.37 55 0.68 0.32 46

Matos et al. The Use of DRIS for Nutritional Diagnosis in Oil Palm...
9Rev Bras Cienc Solo 2017;41:e0150466
Table 4. Probability values (p-value) obtained from the F and Student’s t test for comparison of relationships calculated in a general reference population (indiscriminately for genetic material and ages) and for specific reference populations with African type oil palm and interspecific hybrids (ISH)
RelationshipGeneral ×
AfricanGeneral ×
ISH African × ISH Relationship General × African General × ISH African × ISH
F t F t F t F t F t F tN/P 0.78 0.36 0.34 0.21 0.20 0.61 S/N 0.39 0.49 0.02* 0.13 0.10 0.33N/K 0.64 0.74 0.13 0.98 0.26 0.66 S/P 0.39 0.76 0.23 0.42 0.69 0.61N/Ca 0.85 0.43 0.42 0.01* 0.52 0.04* S/K 0.18 0.40 0.02* 0.15 0.28 0.48N/Mg 0.31 0.54 0.83 0.49 0.41 0.89 S/Ca 0.95 0.94 0.15 0.99 0.14 0.96N/S 0.82 0.54 0.46 0.19 0.59 0.43 S/Mg 0.49 0.74 0.03* 0.26 0.09 0.39N/B 0.69 0.87 0.93 0.15 0.75 0.11 B/Cu 0.92 0.89 0.89 0.37 0.96 0.29N/Cu 0.62 0.94 0.62 0.93 0.99 0.88 B/Fe 0.51 0.51 0.22 0.78 0.53 0.26N/Fe 0.44 0.48 0.95 0.58 0.39 0.93 B/Mn 0.44 0.21 0.09 0.84 0.01* 0.45N/Mn 0.72 0.18 0.89 0.04* 0.60 0.41 B/Zn 0.91 0.65 0.16 0.36 0.17 0.19N/Zn 0.78 0.70 0.35 0.61 0.49 0.89 B/N 0.75 0.93 0.15 0.12 0.23 0.11P/K 0.48 0.46 0.32 0.33 0.75 0.79 B/P 0.98 0.51 0.57 0.76 0.56 0.35P/Ca 0.90 0.88 0.56 0.08 0.46 0.10 B/K 0.59 0.89 0.31 0.36 0.61 0.37P/Mg 0.46 0.94 0.46 0.65 0.99 0.67 B/Ca 0.95 0.43 0.97 0.22 0.91 0.61P/S 0.61 0.97 0.39 0.59 0.70 0.62 B/Mg 0.19 0.54 0.95 0.55 0.16 0.19P/B 0.62 0.47 0.47 0.92 0.80 0.44 B/S 0.76 0.59 0.31 0.77 0.44 0.85P/Cu 0.44 0.73 0.14 0.39 0.44 0.59 Cu/Fe 0.77 0.77 0.90 0.78 0.66 0.99P/Fe 0.77 0.92 0.66 0.78 0.87 0.68 Cu/Mn 0.79 0.54 0.29 0.20 0.40 0.47P/Mn 0.93 0.57 0.31 0.53 0.32 0.89 Cu/Zn 0.75 0.85 0.46 0.61 0.66 0.72P/Zn 0.99 0.88 0.84 0.66 0.82 0.77 Cu/N 0.91 0.84 0.76 0.95 0.66 0.78P/N 0.94 0.39 0.23 0.14 0.17 0.42 Cu/P 0.97 0.79 0.54 0.54 0.54 0.70K/Ca 0.31 0.23 0.75 0.03* 0.17 0.20 Cu/K 0.77 0.60 0.76 0.91 0.98 0.69K/Mg 0.63 0.43 0.07 0.36 0.15 0.94 Cu/Ca 0.95 0.77 0.53 0.14 0.56 0.21K/S 0.59 0.47 0.89 0.29 0.48 0.67 Cu/Mg 0.86 0.87 0.38 0.64 0.46 0.74K/B 0.60 0.74 0.25 0.23 0.50 0.32 Cu/S 0.90 0.76 0.56 0.38 0.63 0.54K/Cu 0.83 0.82 0.48 0.90 0.34 0.91 Cu/B 0.74 0.81 0.94 0.41 0.68 0.28K/Fe 0.31 0.39 0.22 0.45 0.80 0.89 Fe/Mn 0.79 0.67 0.64 0.44 0.45 0.68K/Mn 0.52 0.23 0.69 0.14 0.81 0.70 Fe/Zn 0.72 0.94 0.16 0.90 0.26 0.82K/Zn 0.59 0.60 0.28 0.56 0.56 0.97 Fe/N 0.70 0.57 0.58 0.50 0.33 0.86K/N 0.56 0.66 0.05 0.68 0.16 0.94 Fe/P 0.80 0.98 0.20 0.64 0.28 0.59K/P 0.22 0.29 0.46 0.24 0.64 0.82 Fe/K 0.44 0.53 0.69 0.62 0.71 0.90Ca/Mg 0.78 0.78 0.45 0.04* 0.28 0.05 Fe/Ca 0.98 0.95 0.45 0.08 0.41 0.07Ca/S 0.98 0.95 0.11 0.48 0.09 0.44 Fe/Mg 0.39 0.90 0.58 0.86 0.14 0.94Ca/B 0.88 0.40 0.65 0.16 0.74 0.53 Fe/S 0.94 0.97 0.88 0.44 0.93 0.44Ca/Cu 0.64 0.73 0.25 0.16 0.46 0.27 Fe/B 0.68 0.62 0.08 0.46 0.15 0.15Ca/Fe 0.79 0.91 0.91 0.09 0.70 0.11 Fe/Cu 0.65 0.73 0.16 0.51 0.29 0.72Ca/Mn 0.83 0.64 0.72 0.42 0.54 0.19 Mn/Zn 0.78 0.45 0.11 0.14 0.05* 0.35Ca/Zn 0.94 0.83 0.37 0.12 0.30 0.15 Mn/N 0.95 0.19 0.37 0.03* 0.37 0.30Ca/N 0.95 0.44 0.64 0.01* 0.58 0.03* Mn/P 0.76 0.53 0.13 0.32 0.19 0.63Ca/P 0.81 0.83 0.60 0.08 0.76 0.11 Mn/K 0.96 0.23 0.67 0.10 0.69 0.58Ca/K 0.95 0.26 0.19 0.01* 0.18 0.07 Mn/Ca 0.76 0.70 0.97 0.50 0.73 0.27Mg/S 0.93 0.83 0.36 0.55 0.38 0.67 Mn/Mg 1.00 0.46 0.52 0.17 0.50 0.45Mg/B 0.76 0.66 0.93 0.53 0.83 0.26 Mn/S 0.61 0.71 0.02* 0.64 0.04* 0.84Mg/Cu 0.66 0.83 0.27 0.61 0.46 0.75 Mn/B 0.96 0.23 0.18 0.41 0.17 0.87Mg/Fe 0.06 0.69 0.79 0.97 0.03* 0.72 Mn/Cu 0.95 0.57 0.37 0.23 0.38 0.47Mg/Mn 0.99 0.42 0.62 0.18 0.60 0.54 Mn/Fe 0.64 0.76 0.90 0.35 0.55 0.47Mg/Zn 0.77 0.99 0.69 0.95 0.91 0.94 Zn/N 0.88 0.73 0.94 0.69 0.82 0.94Mg/N 0.66 0.61 0.86 0.47 0.79 0.79 Zn/P 0.88 0.88 0.85 0.66 0.96 0.76Mg/P 0.40 0.79 0.42 0.53 0.99 0.67 Zn/K 0.89 0.70 0.40 0.85 0.46 0.81Mg/K 0.73 0.44 0.47 0.54 0.69 0.85 Zn/Ca 0.60 0.78 0.17 0.20 0.37 0.25Mg/Ca 0.61 0.72 0.75 0.08 0.84 0.11 Zn/Mg 0.71 0.92 0.95 0.92 0.65 0.99S/B 0.71 0.55 0.40 0.51 0.62 0.91 Zn/S 0.87 0.78 0.21 0.28 0.26 0.39S/Cu 0.66 0.64 0.06 0.16 0.12 0.30 Zn/B 0.90 0.66 0.48 0.62 0.38 0.35S/Fe 0.26 0.79 0.16 0.33 0.74 0.50 Zn/Cu 0.80 0.94 0.27 0.87 0.37 0.92S/Mn 0.81 0.88 0.00* 0.52 0.01* 0.45 Zn/Fe 0.44 0.78 0.26 0.70 0.68 0.91S/Zn 0.91 0.74 0.10 0.26 0.10 0.37 Zn/Mn 0.63 0.47 0.63 0.33 0.32 0.71
*: significant (p<0.05) by the F test or by Student’s t test.

Matos et al. The Use of DRIS for Nutritional Diagnosis in Oil Palm...
10Rev Bras Cienc Solo 2017;41:e0150466
The small number of differences indicates that the general reference population may represent both African oil palm and ISH. This means that some features of ISH, such as their distinct patterns of environmental resistance and vegetative growth (Gomes Junior et al., 2014), at least initially, they were not remarkable enough to express different nutritional relationships from African species, a fact that facilitates the application of DRIS in areas with these cultivars. Similarly, it was found, in cotton (Gossipium hirsutum) crops, that DRIS can be applied regardless of the cultivar used (Singh et al., 2012). These results are in agreement with the proposed DRIS calculation, which, in theory, transcends the effect of the cultivar when nutrient norms are set in maximum performance populations (Reis Jr and Monerat, 2002).
There were a large number of significant differences among the bivariate relationships of the evaluated reference populations as a function of age groups (general reference population, young and adult plants) (Table 5). This indicates that the DRIS norms should be applied distinctly (specificly) for the phases of the productive life of this crop in order to increase the accuracy of diagnoses made by this method. These results disagree with the premises of DRIS, which were created as supporting diagnostics by means of nutritional relationships regardless of the part or age of the sampled plant (Jones Jr, 1993). According to Mourão Filho (2004), the use of general DRIS norms, to the detriment of specific ones, has relevance only when they are derived from databases with as much variability as possible (different locations, ages, genetic material, and soil fertilities, among other factors), which was not the case for the data used in this study. However, to oil palm, more results of analysis and yield should be inserted in the preliminary set norms to increase the number of samples within control populations for greater accuracy of DRIS calculations.
The differences detected by the nutritional relationships of age ranges are due to the fact that nutrients are largely located for leaf dry matter production in the young palms; however, in adult palms, a constant reallocation of nutrients occurs to the bunch (Fairhurst and Härdter, 2003), generating different leaf patterns.
For cupuaçu (Theobroma grandiflorum) crops in the Amazon, DRIS norms were not differentiated between the two age ranges tested (Dias et al., 2010). In contrast, higher accuracy with the use of specific norms considering different ages or plant stages was observed for crops such as eucalypt (Eucalyptus spp.) (Wadt et al., 1999) and passion fruit (Passiflora edulis) (Carvalho et al., 2011). Diverging results in the literature reinforce the need to evaluate DRIS norms according to plant development stages before applying these standard relationships to commercial diagnostics.
In relating the nutrient balance index (NBI) with the yield of the general populations of young and adult palms, the correlation coefficient was significant in all cases (Figure 2). The coefficient of the general population, which was significantly lower, indicates that there are other factors besides plant nutrition that strongly affect yield (Hernandes et al., 2014); that is, when considering other sources of variation, such as the age of the plant, the models will be accurate.
According to the potential response to fertilization, the diagnosis of N, P, K, and Mg, the nutrients considered most important for oil palm, most often were balanced (Figure 3). Regarding the number of cases of nutritional deficiency in stands of young crops, the decreasing order was Ca > Fe > B > Mn > S > K = Mg > Cu > Zn > N > P; and in the adult plants, the order was Ca > Mn = Zn > Fe > S = B > N = Cu > K > Mg > P. In both age groups, micronutrient deficiencies were more expressive than those of primary macronutrients; however, Ca and P were the nutrients with highest and lowest occurrences of deficiencies, respectively. For frequencies of nutritional excess, Cu and B stand out in young plants (20 cases each) and Cu in adult plants (32 cases).

Matos et al. The Use of DRIS for Nutritional Diagnosis in Oil Palm...
11Rev Bras Cienc Solo 2017;41:e0150466
Table 5. Probability values (p-value) obtained in F test and Student’s t test for comparison of relationships calculated in a general reference population (indiscriminately for genetic material and ages) and for specific reference populations with young (≤6 years after planting) and adult (>6 years after planting) palms
General vs ≤6 years
General vs > 6 years
≤6 years vs >6 years
General vs ≤6 years
General vs >6 years
≤6 years vs >6 years
F t F t F t F t F t F tN/P 0.02* 0.89 0.20 0.21 0.41 0.20 S/N 0.03* 0.06 0.37 0.18 0.87 0.37N/K 0.65 0.49 0.32 0.69 0.02* 0.32 S/P 0.31 0.09 0.60 0.56 0.28 0.60N/Ca 0.00* 0.01* 0.01* 0.11 0.01* 0.01* S/K 0.10 0.00* 0.61 0.15 0.08 0.61N/Mg 0.01* 0.86 0.01* 0.52 0.73 0.01* S/Ca 0.88 0.07 0.99 0.86 0.20 0.99N/S 0.07 0.30 0.38 0.26 0.42 0.38 S/Mg 0.48 0.02* 0.94 0.37 0.37 0.94N/B 0.00* 0.00* 0.81 0.00* 0.21 0.81 B/Cu 0.53 0.04* 0.78 0.72 0.01* 0.78N/Cu 0.00* 0.00* 0.78 0.00* 0.14 0.78 B/Fe 0.43 0.33 0.75 0.58 0.86 0.75N/Fe 0.00* 0.00* 0.39 0.00* 0.71 0.39 B/Mn 0.14 0.10 0.57 0.24 0.05 0.57N/Mn 0.00* 0.00* 0.09 0.00* 0.41 0.09 B/Zn 0.98 0.01* 0.89 0.83 0.00* 0.89N/Zn 0.00* 0.00* 0.25 0.00* 0.71 0.25 B/N 0.00* 0.00* 0.46 0.00* 0.01* 0.46P/K 0.43 0.56 0.65 0.24 0.64 0.65 B/P 0.00* 0.00* 0.67 0.00* 0.97 0.67P/Ca 0.04* 0.02* 0.08 0.49 0.01* 0.08 B/K 0.00* 0.00* 0.52 0.00* 0.67 0.52P/Mg 0.29 0.26 0.05 0.70 0.58 0.05 B/Ca 0.00* 0.00* 0.26 0.00* 0.33 0.26P/S 0.66 0.16 0.88 0.73 0.31 0.88 B/Mg 0.00* 0.00* 0.11 0.00* 0.93 0.11P/B 0.00* 0.00* 0.73 0.00* 0.73 0.73 B/S 0.00* 0.00* 0.93 0.00* 0.12 0.93P/Cu 0.00* 0.00* 0.62 0.00* 0.01* 0.62 Cu/Fe 0.14 0.08 0.19 0.67 0.04* 0.19P/Fe 0.00* 0.00* 0.83 0.00* 0.16 0.83 Cu/Mn 0.03* 0.17 0.10 0.29 0.34 0.10P/Mn 0.00* 0.00* 0.37 0.00* 0.91 0.37 Cu/Zn 0.16 0.62 0.26 0.60 0.91 0.26P/Zn 0.00* 0.00* 0.90 0.00* 0.73 0.90 Cu/N 0.00* 0.00* 0.44 0.00* 0.22 0.44P/N 0.02* 0.84 0.25 0.16 0.43 0.25 Cu/P 0.00* 0.00* 0.10 0.00* 0.03* 0.10K/Ca 0.03* 0.97 0.68 0.05 0.37 0.68 Cu/K 0.00* 0.00* 0.08 0.00* 0.22 0.08K/Mg 0.07 0.04* 0.26 0.28 0.26 0.26 Cu/Ca 0.00* 0.00* 0.03* 0.00* 0.00* 0.03*K/S 0.45 0.57 0.63 0.19 0.06 0.63 Cu/Mg 0.00* 0.00* 0.03* 0.00* 0.23 0.03*K/B 0.00* 0.00* 0.43 0.00* 0.54 0.43 Cu/S 0.00* 0.00* 0.22 0.00* 0.42 0.22K/Cu 0.00* 0.00* 0.39 0.00* 0.07 0.39 Cu/B 0.21 0.01* 0.17 0.90 0.00* 0.17K/Fe 0.00* 0.00* 0.55 0.00* 0.66 0.55 Fe/Mn 0.25 0.96 0.53 0.51 0.86 0.53K/Mn 0.00* 0.00* 0.82 0.00* 0.46 0.82 Fe/Zn 0.84 0.23 0.81 0.97 0.75 0.81K/Zn 0.00* 0.00* 0.60 0.00* 0.35 0.60 Fe/N 0.00* 0.00* 0.37 0.00* 0.51 0.37K/N 0.62 0.50 0.11 0.49 0.34 0.11 Fe/P 0.00* 0.00* 0.79 0.00* 0.03* 0.79K/P 0.33 0.41 0.52 0.13 0.34 0.52 Fe/K 0.00* 0.00* 0.94 0.00* 0.00* 0.94Ca/Mg 0.42 0.90 0.64 0.23 0.42 0.64 Fe/Ca 0.00* 0.00* 0.55 0.00* 0.12 0.55Ca/S 0.41 0.05 0.52 0.81 0.17 0.52 Fe/Mg 0.00* 0.00* 0.41 0.00* 0.02* 0.41Ca/B 0.00* 0.00* 0.10 0.00* 0.08 0.10 Fe/S 0.00* 0.00* 0.82 0.00* 0.50 0.82Ca/Cu 0.00* 0.00* 0.38 0.00* 0.01* 0.38 Fe/B 0.52 0.77 0.64 0.76 0.16 0.64Ca/Fe 0.00* 0.00* 0.25 0.00* 0.09 0.25 Fe/Cu 0.16 0.29 0.51 0.42 0.85 0.51Ca/Mn 0.00* 0.00* 0.83 0.00* 0.41 0.83 Mn/Zn 0.06 0.01* 0.30 0.23 0.02* 0.30Ca/Zn 0.00* 0.00* 0.55 0.00* 0.73 0.55 Mn/N 0.00* 0.00* 0.03* 0.00* 0.13 0.03*Ca/N 0.00* 0.70 0.03* 0.08 0.21 0.03* Mn/P 0.00* 0.00* 0.33 0.00* 0.68 0.33Ca/P 0.05 0.15 0.24 0.39 0.01* 0.24 Mn/K 0.00* 0.00* 0.54 0.00* 0.08 0.54Ca/K 0.01* 0.14 0.46 0.03* 0.38 0.46 Mn/Ca 0.00* 0.00* 0.96 0.00* 0.08 0.07Mg/S 0.72 0.11 0.38 0.61 0.15 0.38 Mn/Mg 0.00* 0.00* 0.75 0.00* 0.72 0.96Mg/B 0.00* 0.00* 0.08 0.00* 0.02* 0.08 Mn/S 0.00* 0.00* 0.62 0.00* 0.47 0.75Mg/Cu 0.00* 0.00* 0.07 0.00* 0.88 0.07 Mn/B 0.02* 0.01* 0.14 0.16 0.22 0.62Mg/Fe 0.00* 0.00* 0.12 0.00* 0.00* 0.12 Mn/Cu 0.02* 0.34 0.13 0.26 0.01* 0.14Mg/Mn 0.00* 0.00* 0.54 0.00* 0.19 0.54 Mn/Fe 0.21 0.45 0.35 0.58 0.72 0.13Mg/Zn 0.00* 0.00* 0.22 0.00* 0.05 0.22 Zn/N 0.00* 0.00* 0.25 0.00* 0.13 0.35Mg/N 0.00* 0.12 0.00* 0.51 0.03* 0.00* Zn/P 0.00* 0.00* 0.74 0.00* 0.24 0.25Mg/P 0.34 0.79 0.06 0.59 0.57 0.06 Zn/K 0.00* 0.00* 0.69 0.00* 0.43 0.74Mg/K 0.08 0.92 0.30 0.32 0.64 0.30 Zn/Ca 0.00* 0.00* 0.56 0.00* 0.00* 0.69Mg/Ca 0.39 0.28 0.86 0.33 0.32 0.86 Zn/Mg 0.00* 0.00* 0.84 0.00* 0.43 0.56S/B 0.00* 0.00* 0.33 0.00* 0.02* 0.33 Zn/S 0.00* 0.00* 0.95 0.00* 0.01* 0.84S/Cu 0.00* 0.00* 0.34 0.00* 0.82 0.34 Zn/B 0.23 0.00* 0.30 0.74 0.07 0.95S/Fe 0.00* 0.00* 0.65 0.00* 0.51 0.65 Zn/Cu 0.16 0.30 0.19 0.71 0.00* 0.30S/Mn 0.00* 0.00* 0.96 0.00* 0.65 0.96 Zn/Fe 0.86 0.39 0.83 0.73 0.06 0.19S/Zn 0.00* 0.00* 0.95 0.00* 0.17 0.95 Zn/Mn 0.64 0.01* 0.91 0.42 0.77 0.83*: significant (p<0.05) by the F test or by Student’s t test.

Matos et al. The Use of DRIS for Nutritional Diagnosis in Oil Palm...
12Rev Bras Cienc Solo 2017;41:e0150466
The occurrence of samples with N, and particularly K, predominantly in nutritional status of adequate is not common in evaluations of oil palm crops. When evaluated for sufficiency ranges, the appearance of more cases of deficiency is normal since these nutrients are the most exported via bunches (Viégas and Müller, 2000). In irrigated oil palm in India, Behera et al. (2015) observed K as having the most and N as the second most occurrences of deficiencies in palm stands by means of evaluation by DRIS indices. In contrast, similar to the results of this study, K and N indices rates, with few cases of deficiency were also observed in DRIS diagnosis of oil palm in Colombia; this was attributed to a regular supply of these nutrients (Herreira Peña, 2015).
Deficiency of Ca and the micronutrients B, Fe, Mn, and Zn is due to scant attention given to these elements in nutritional management of oil palm in the state of Pará. In this crops, soil is not corrected by liming, due to the low response of this species in other countries (Fairhurst and Härdter, 2003), which explains the low Ca content in the soils of the stands studied (Table 1). Values lower than 1.5 cmolc dm-3 for the state of Pará are considered low, according to Brasil and Cravo (2010). Nevertheless, the absence of liming has been questioned for oil palm crops in the Amazon; therefore, further local studies should be carried out (Franzini et al., 2012). It is important to highlight that Ca deficiency has been reported as a possible cause of the disorder known as lethal yellowing in oil palm (Laing, 2012), a problem that has decimated several commercial crops in the state.
In general, fertilization in this region is carried out by replacing the nutrients N, P, and K. Secondary macronutrients (Ca, Mg, and S) are rarely included in the formulations of commercial fertilizers, and micronutrients are seldom applied, except for B. In addition, when soil correction is not carried out, micronutrient availability is restricted (Franzini et al., 2012).
Figure 2. Relationship between nutritional balance indices (NBI) and yields of oil palm stands considering DRIS norms composed by oil palms of all ages (a), young palms (≤6 years) (b), and adult palms (>6 years) (c) in the state of Pará, Brazil. *: significant (p<0.05) by Student’s t test.
ŷ = 32.673 - 0.7396 x + 0.0047 x2
r = - 0.57*
(b)
Yiel
d (M
g ha
-1)
05
10152025303540
ŷ = 34.612 - 0.5228 x + 0.0021 x2
r = - 0.50*
(a)
120100806040200120100806040200NBI
120100806040200
ŷ = 23.817 + 0.0539 x - 0.0035 x2
r = - 0.57*
(c)
Figure 3. Response potential to fertilization in stands with young (≤6 years) (a) and adult (>6 years) (b) oil palm plants in the northeast of the state of Pará, Brazil.
0
10
20
30
40
50
60
70 Excessive Adequate Deficient
Freq
uenc
y
(a)
ZnMnFeCuBSMgCaKPNZnMnFeCuBSMgCaKPN0
102030405060708090
(b)

Matos et al. The Use of DRIS for Nutritional Diagnosis in Oil Palm...
13Rev Bras Cienc Solo 2017;41:e0150466
Deficiency of B has been identified as the most common deficiency in oil palm crops around the world. This is due to the low clay content in the soil commonly used for growing this palm, excessive rainfall in the production regions, and correlation of B with high yielding genetic materials when they are well supplied with N, P, and K (Gutiérrez-Soto and Torres-Acuña, 2013). This last situation is not applicable to the crops studied here since the optimal levels of N fertilization and especially potassium fertilization have not been achieved in practice.
Leaf diagnostics for Fe showed several cases of deficiency even in the soils of the stands studied that had Fe content higher than 45 mg dm-3 (Table 1), which is a value considered adequate for the state of Pará (Brasil and Cravo, 2010). This Fe deficiency can be related to Ca in soil and plant deficiency that affect negatively the plasmalem integrity decreasing another cation and the anion uptake (Silva e Trevisan, 2015).
The high incidence of cases of deficiency and excess of B and Cu indicate that those nutrients are in greatest imbalance in the crops evaluated. For B, this is because the boundary between its deficiency and excess is very narrow (Silva et al., 2015). However, the excess of Cu in the leaves, which was more representative in adult plants, may be related to deficiencies of Ca. This macronutrient has the role of regulating Cu uptake by the plant, regardless of its concentration in the soil, which is due to ionic antagonism (Silva and Trevizan, 2015).
In oil palm crops in Colombia, Fe and Zn were the most and second most deficient nutrients, respectively, according to DRIS indices, surpassing the primary macronutrients (Herrera Peña, 2015), as in this study. In commercial areas evaluated by those authors, it was reported that Fe and Zn negatively influenced production since the other elements were relatively well supplied.
CONCLUSIONS Regardless of genetic material, general DRIS norms have an effect similar to that of specific norms considering the type of African oil palms and their interspecific hybrids for nutritional diagnosis.
Evaluation of the nutritional status of oil palm using DRIS should consider the age of the plants, separating the young (≤6 years) from the adult (>6 years) plants for greater accuracy of diagnoses.
Oil palm stands, regardless of age, showed high numbers of deficiency of Ca, Fe, and Mn. In addition, B and Zn were limiting in the young and adult plants, respectively.
Absence of liming on oil palm should be reviewed, and fertilization in the state of Pará should be stricter in providing Ca and micronutrients to increase yield.
REFERENCES Barbosa DHSG, Vieira HD, Partelli FL, Souza RM. Estabelecimento de normas DRIS e diagnóstico nutricional do cafeeiro arábica na região noroeste do Estado do Rio de Janeiro. Cienc Rural. 2006;36:1717-22. https://doi.org/10.1590/S0103-84782006000600008
Beaufils ER. Diagnosis and recommendation integrated system (DRIS). Soil Sci Bull Univ Natal (Sudafrica). 1973;1:1-132.
Behera SK, Rao BN, Suresh K, Manoja K. Soil nutrient status and leaf nutrient norms in oil palm (Elaeis guineensis Jacq.) plantations grown on southern plateau of India. Proc Natl Acad Sci India Sect B Biol Sci. 2015;85:1-7. https://doi.org/10.1007/s40011-015-0508-y
Brasil EC, Cravo MS. Interpretação de análise de solos. In: Cravo MS, Viégas IJM, Brasil EC, editores. Recomendações de adubação e calagem para o estado do Pará. Belém: Embrapa Amazônia Oriental; 2010. p.153-5.

Matos et al. The Use of DRIS for Nutritional Diagnosis in Oil Palm...
14Rev Bras Cienc Solo 2017;41:e0150466
Carvalho AJC, Fontes PSF, Freitas MSM, Monnerat PH, Fontes AG. Yellow passion fruit plant nutritional diagnosis at different phenological stages by the diagnosis and recommendation integrated system method. J Plant Nutr. 2011;34:614-26. https://doi.org/ 10.1080/01904167.2011.538558
Cunha RNV, Lopes R, Rocha RNC, Lima WAA, Teixeira PC, Barcelos E, Rodrigues MRL, Rios SA. Domestication and breeding of the American oil palm. In: Borém A, Lopes MTG, Clement CR, Noda H, editors. Domestication and breeding: Amazon species. Viçosa, MG: Suprema; 2012. p.275-96.
Dias JRM, Wadt PGS, Sampaio FAR, Pittelkow FK, Miotti AA, Rosa MR. Estabelecimento de normas DRIS para cupuaçuzeiro na região amazônica. Rev Caatinga. 2010;23:121-8.
Dias JRM, Wadt PGS, Tucci CAF, Santos JZL, Silva SV. Normas DRIS multivariadas para avaliação do estado nutricional de laranjeira ‘Pera’ no Estado do Amazonas. Rev Cienc Agron. 2013;44:2519.
Donagema GK, Campos DVB, Calderano SB, Teixeira WG, Viana JHM, organizadores. Manual de métodos de análise do solo. 2a ed. rev. Rio de Janeiro: Embrapa Solos; 2011.
Fairhurst T, Härdter R. Oil palm - Management for large and sustainable yields. Singapore: Potash & Phosphate Institute (PPI), Potash & Phosphate Institute of Canada (PPIC), and International Potash Institute (IPI, Basel); 2003.
Franzini VI, Silva ARB, Gomes Junior RA. Acidez do solo e sua correção em palma de óleo. Belém: Embrapa Amazônia Oriental; 2012. (Embrapa Amazônia Oriental, Documentos, 386).
Gomes Junior RA, Gurgel FL, Peixoto LA, Bhering LL, Cunha RNV, Ricardo L, Pina AJA, Veiga AS. Evaluation of interspecific hybrids of palm oil reveals great genetic variability and potential selection gain. Ind Crops Prod. 2014;52:512-8. https://doi.org/10.1016/j.indcrop.2013.10.036
Gutiérrez-Soto MV, Torres-Acuña J. Síntomas asociados a la deficiencia de boro en la palma aceitera (Elaeis guineensis Jacq.) en Costa Rica. Agron Mesoam. 2013;24:441-9.
Hernandes A, Souza HA, Amorim DA, Natale W, Lavres Junior J, Boaretto AE, Camacho MA. DRIS norms for pêra orange. Commun Soil Sci Plant Anal. 2014;45:2853-67. https://doi.org/10.1080/00103624.2014.956933
Herrera Peña GE. Obtención del sistema integrado de diagnóstico y recomendación integral (DRIS) en el cultivo de palma de aceite (Elaeis guineensis Jacq.) [dissertação]. Bogotá: Universidad Nacional de Colombia; 2015.
Jones Jr JB. Modern interpretation systems for soil and plant analysis in the USA. Aust J Exp Agric. 1993;33:1039-43. https://doi.org/10.1071/EA9931039
Laing D. Deficiência temporária de cálcio como causa primária do amarelecimento fatal do dendezeiro. Piracicaba: IPNI; 2012. (Informações agronômicas, 137).
Letzsch WS. Computer program for selection of norms for use in the diagnosis and recommendation integrated system (DRIS). Commun Soil Sci Plant Anal. 1985;16:339-47. https://doi.org/10.1080/00103628509367609
Lopes R, Cunha RNV, Resende MDV. Produção de cachos e parâmetros genéticos de híbridos de caiaué com dendezeiro. Pesq Agropec Bras. 2012;47:1496-503. https://doi.org/10.1590/S0100-204X2012001000012
Malavolta E, Vitti GC, Oliveira SA. Avaliação do estado nutricional de plantas: princípios e aplicações. São Paulo: Potafos; 1997.
Martín I, Benito A, Romero I, Domínguez N, García-Escudero E. Preliminary diagnosis and recommendation integrated system norms for leaf nutrient diagnosis of tempranillo grapevine in the rioja appellation. Commun Soil Sci Plant Anal. 2013;44:655-67. https://doi.org/10.1080/00103624.2013.745388
Mourão Filho FAA. DRIS: Concepts and applications on nutritional diagnosis in fruit crops. Sci Agric. 2004;61:550-60. https://doi.org/10.1590/S0103-90162004000500015
Nick JA. DRIS para cafeeiros podados [dissertação]. Piracicaba: Universidade de São Paulo, Escola Superior de Agricultura “Luiz de Queiroz”; 1998.
PalmElit. Plant material solutions for the tropics. [Accessed: 10 Dec. 2014]. Available at: http://www.palmelit.com/en/literature.

Matos et al. The Use of DRIS for Nutritional Diagnosis in Oil Palm...
15Rev Bras Cienc Solo 2017;41:e0150466
Partelli FL, Vieira HD, Monnerat PH, Viana AP. Estabelecimento de normas DRIS em cafeeiro conilon orgânico e convencional no Estado do Espírito Santo. Rev Bras Cienc Solo. 2006;30:443-51. https://doi.org/10.1590/S0100-06832006000300006
Potts J, Lynch M, Wilkings A, Huppé G, Cunningham M, Voora V. The state of sustainability initiatives review 2014. State of Sustainability Initiatives. [Accessed: 20 Jan 2014]. Available at: https://www.iisd.org/pdf/2014/ssi_2014.pdf.
Reis Jr RA, Monnerat PH. Sugarcane nutritional diagnosis with DRIS norms established in Brazil, South Africa and United States. J Plant Nutr. 2002;30:2831-51. https://doi.org/10.1081/PLN-120015542
Rodrigues MRL, Amblard P, Barcelos E, Macedo JLV, Cunha RNV, Tavares AM. Avaliação do estado nutricional do dendezeiro: análise foliar (Reformulada). Manaus: Embrapa Amazônia Oriental; 2006. (Circular técnica, 26).
Santana JG, Leandro WM, Naves RV, Cunha PP. Normas DRIS para interpretação de análises de folha e solo, em laranjeira pêra, na região central de Goiás. Pesq Agropec Trop. 2008;38:109-17.
Silva GGC, Neves JCL, Alvarez V VH, Leite FP. Avaliação da universalidade das normas DRIS, M-DRIS e CND. Rev Bras Cienc Solo. 2005;29:755-61. https://doi.org/10.1590/S0100-06832005000500011
Silva MLS, Trevisan AR. Interações iônicas e seus efeitos na nutrição de plantas. Piracicaba: IPNI; 2015. (Informações agronômicas, 49).
Silva MR, Assmann TS, Martin TN, Caldas TS. Adubação bórica na produção de forragem e componentes radiculares de trevo branco. Biosci J. 2015;31:65-72. https://doi.org/10.14393/BJ-v31n1a2015-18142
Singh D, Singh K, Hundal HS, Sekhon KS. Diagnosis and recommendation integrated system (DRIS) for evaluating nutrient status of cotton (Gossipium hirsutum). J Plant Nutr. 2012;35:192-202. https://doi.org/10.1080/01904167.2012.636122
Viégas IJM, Müller AA. A cultura do dendezeiro na Amazônia brasileira. Belém: Embrapa Amazônia Oriental; 2000.
Wadt PGS, Novais RF, Alvarez V VH, Barros NF, Dias LE. Variações no estado nutricional de eucaliptos por influência do material genético e da idade da árvore. Pesq Agropec Bras. 1999;34:1797-803. https://doi.org/10.1590/S0100-204X1999001000005
Wadt PGS, Dias JRM. Normas DRIS regionais e inter-regionais na avaliação nutricional de café Conilon. Pesq Agropec Bras. 2012;47:822-30. https://doi.org/10.1590/S0100-204X2012000600013