the top line challenge – how to grow revenue from here · the top line challenge – how to grow...
TRANSCRIPT

20 June 2012
National Australia Bank Limited ABN 12 004 044 937
Lisa Gray, Group Executive Personal Banking
The Top Line Challenge –How to Grow Revenue from Here

2
For further information visit www.nabgroup.com.au or contact:
Ross Brown
Brian Walsh
Executive General Manager, Investor Relations General Manager, Media and Public Affairs Mobile | +61 (0) 477 302 010 Mobile | +61 (0) 411 227 585
Natalie Coombe
/ Clare Nickson-Havens
Meaghan Telford
Senior Managers, Investor Relations Head of Group Media (02) 9376 5430 Mobile | +61 (0) 457 551 211
Note: Information in this document is presented on a cash earnings basis, unless otherwise stated.
Cash earnings is a key financial performance measure used by NAB, the investment community and NAB’s Australian peers with a similar business portfolio. NAB also uses cash earnings for its internal management reporting as it better reflects what NAB considers to be the underlying performance of the Group. It is not a statutory financial measure and is not presented in accordance with Australian Accounting Standards nor audited or reviewed in accordance with Australian Auditing Standards. “Cash earnings” is calculated by excluding some items which are included within the statutory net profit attributable to owners of the company. A definition of cash earnings is set out on page 150 of the 2012 Half Year Results Announcement. A discussion of non-cash earnings items and a full reconciliation of the cash earnings to statutory net profit attributable to owners of the Company for the March 2012 half year is included on pages 22 and 141 of the 2012 Half Year Results Announcement. The Group's financial statements, prepared in accordance with the Corporations Act 2001 (Cth) and Australian Accounting Standards, and reviewed by the auditors in accordance with Australian Auditing Standards, are included in section 5 of the 2012 Half Year Results Announcement.
Disclaimer: This document is a presentation of general background information about the Group’s activities current at the date of the presentation, 20 June 2012. It is information in a summary form and does not purport to be complete. It is to be read in conjunction with the National Australia Bank Limited Half Year Results filed with the Australian Securities Exchange on 10 May 2012. It is not intended to be relied upon as advice to investors or potential investors and does not take into account the investment objectives, financial situation or needs of any particular investor. These should be considered, with or without professional advice, when deciding if an investment is appropriate.
This presentation does not constitute an offer or invitation for the sale or purchase of securities or of any of the assets, business or undertaking described herein, nor does it form part of the prospectus or offering document relating to any securities for which any investor may subscribe. Distribution of this presentation may be restricted or prohibited by law. Recipients are required to inform themselves of, and comply with, all such restrictions or prohibitions and NAB does not accept liability to any person in relation thereto.
This presentation does not constitute an offer of securities for sale in the United States, or to any person that is, or is acting for the account or benefit of, any U.S. person (as defined in Regulation S under the United States Securities Act of 1933, as amended (Securities Act)) (U.S. Person), or in any other jurisdiction in which such an offer would be illegal. Securities may not be offered or sold in the United States or to, or for the account or benefit of, U.S. Persons without registration under the Securities Act or an exemption from registration.
This announcement contains certain "forward-looking statements". The words "anticipate", "believe", "expect", "project", "forecast", "estimate", “outlook”, “upside”, "likely", "intend", "should", "could", "may", "target", "plan" and other similar expressions are intended to identify forward-looking statements. Indications of, and guidance on, future earnings and financial position and performance are also forward-looking statements. Such forward-looking statements are not guarantees of future performance and involve known and unknown risks, uncertainties and other factors, many of which are beyond the control of the Group, that may cause actual results to differ materially from those expressed or implied in such statements. There can be no assurance that actual outcomes will not differ materially from these statements.

333
Australian housing lending and household deposit market share1
33
Personal Banking at a glance 2008/2009
12.8%
13.8%
13.1%13.4%
Sep0 4
Sep0 5
Sep0 6
Sep0 7
Sep0 8
Sep0 9
Sep0 4
Sep0 5
Sep0 6
Sep0 7
Sep0 8
Sep0 9
Housing lend ing Ho useho ld d ep o sit s
(1)
RBA Financial System, APRA Banking System(2)
As at 30 Sept 2008 for NAB; Avg
of 3 majors based on ANZ, CBA and WBC publicly reported data, as at 30 Sept 2008 for ANZ and WBC, and as at 30 June 2008 for CBA. Includes securitisation and acceptances.
Concentration & capital intensity2
46%71%
54% 58%
H o me lo ans % gro upGLA s
C R WA / GLA s
N A B Group A vg 3 majors ( ex N A B )
Challenging economic environment
Mortgage growth half system –constraining growth in Business Banking
Deposit market share falling
Emerging scale disadvantage following acquisitions by peers
Customer satisfaction lowest of major banks
Industry reputation poor, increased consumer and political scrutiny
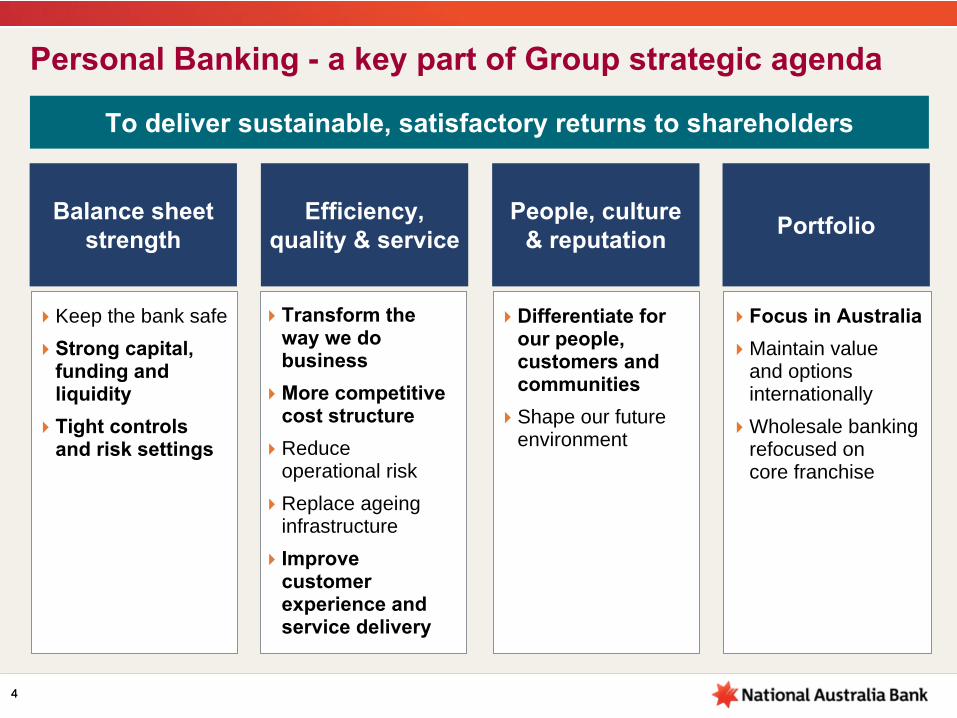
4
Efficiency, quality & service
Transform the way we do businessMore competitive cost structureReduce operational riskReplace ageing infrastructureImprove customer experience and service delivery
Balance sheet strength
Keep the bank safeStrong capital, funding and liquidityTight controls and risk settings
People, culture & reputation
Differentiate for our people, customers and communitiesShape our future environment
Portfolio
Focus in AustraliaMaintain valueand options internationallyWholesale banking refocused on core franchise
To deliver sustainable, satisfactory returns to shareholders
4
Personal Banking -
a key part of Group strategic agenda
5
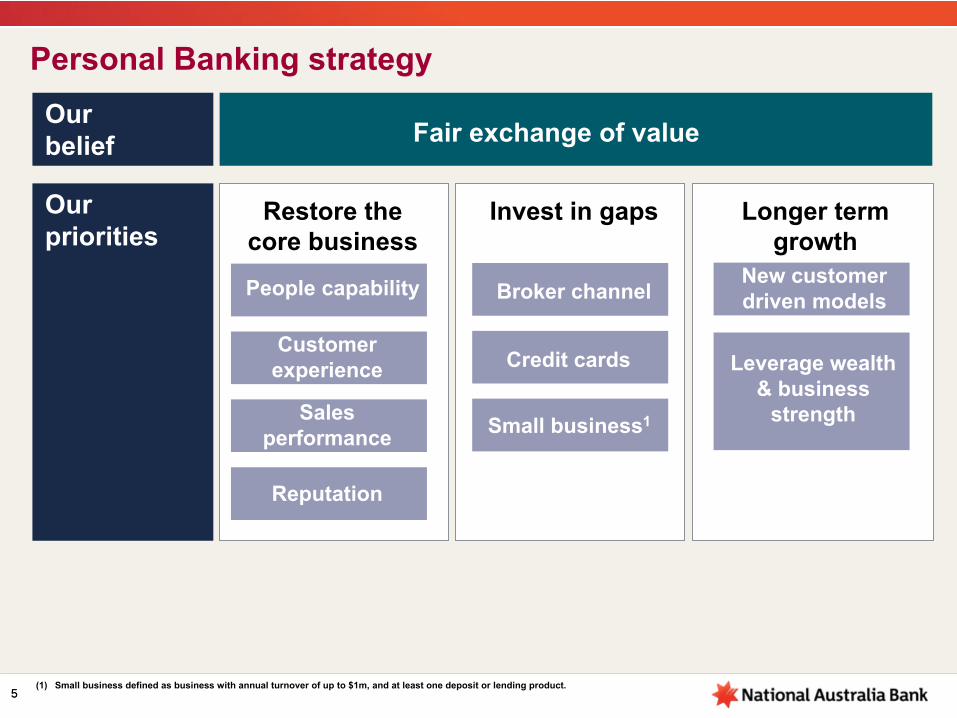
Personal Banking strategy
5
Our belief
Our priorities
Fair exchange of value
Restore the core business
Invest in gaps Longer term growth
People capability
Customer experience
Sales performance
Reputation
Broker channel
Credit cards
Small business1
New customer driven models
Leverage wealth & business
strength
(1)
Small business defined as business with annual turnover of up to
$1m, and at least one deposit or lending product.
6
0%
10%
20%
30%
40%
50%
60%
Sep 09 Mar 10 Sep 10 Mar 11 Sep 11 Mar 12
0.0%0.5%1.0%1.5%2.0%2.5%3.0%3.5%4.0%4.5%
0 3 6 9 12 15 18 21 24
2006 2007 2008 2009 2010 2011 2012
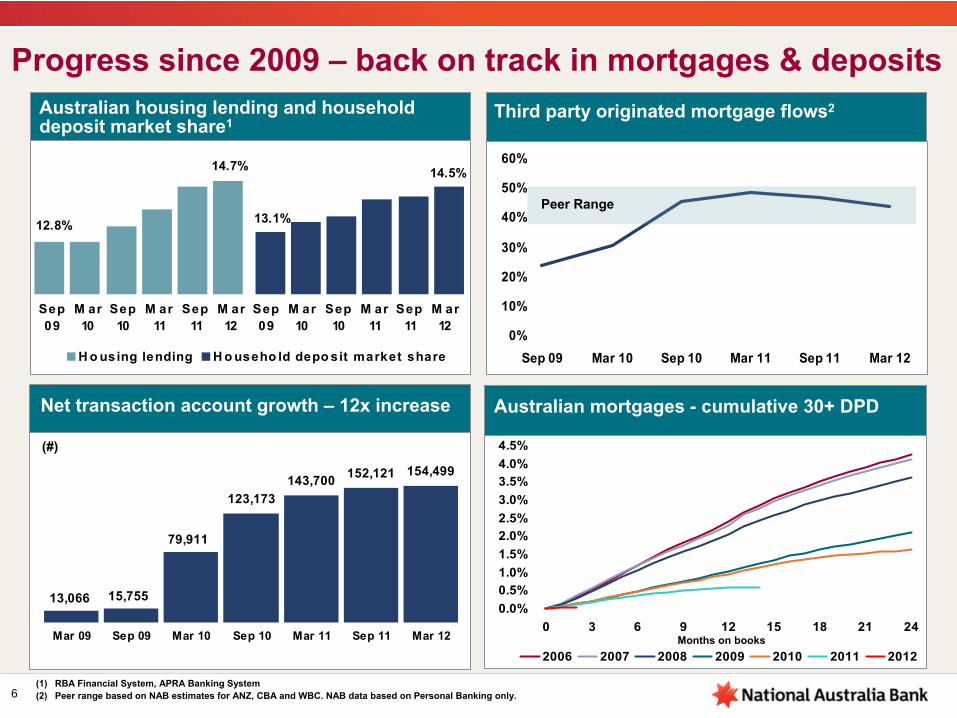
123,173143,700 152,121 154,499
13,066 15,755
79,911
Mar 09 Sep 09 Mar 10 Sep 10 Mar 11 Sep 11 Mar 12
12.8%
14.7%
13.1%
14.5%
Sep09
M ar10
Sep10
M ar11
Sep11
M ar12
Sep09
M ar10
Sep10
M ar11
Sep11
M ar12
H o using lending H o useho ld depo sit market share
Australian housing lending and household deposit market share1
Progress since 2009 –
back on track in mortgages & deposits
(1)
RBA Financial System, APRA Banking System(2)
Peer range based on NAB estimates for ANZ, CBA and WBC. NAB data
based on Personal Banking only.
Third party originated mortgage flows2
Australian mortgages -
cumulative 30+ DPD
Months on books
Net transaction account growth –
12x increase
(#)
Peer Range
7
Jan 09 Jul 09 Jan 10 Jul 10 Jan 11 Jul 11 Jan 12
Fee Non-Fee
7777
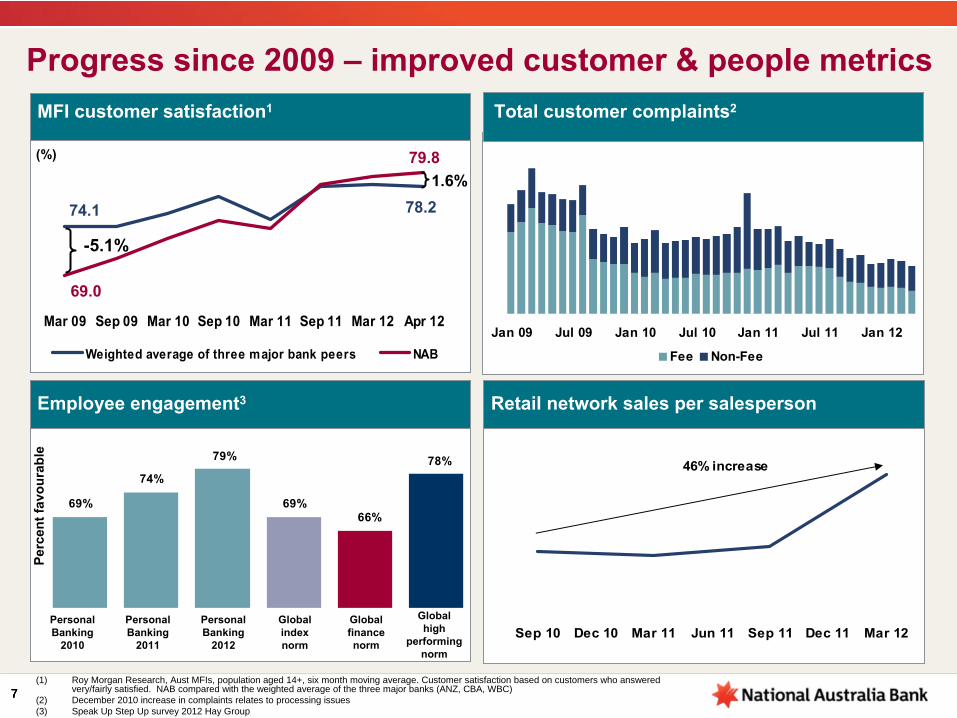
Progress since 2009 –
improved customer & people metrics
(1) Roy Morgan Research, Aust MFIs, population aged 14+, six month moving average. Customer satisfaction based on customers who answered very/fairly satisfied. NAB compared with the weighted average of the three major banks (ANZ, CBA, WBC)
(2) December 2010 increase in complaints relates to processing issues(3) Speak Up Step Up survey 2012 Hay Group
MFI customer satisfaction1 Total customer complaints2
Retail network sales per salesperson
Sep 10 Dec 10 Mar 11 Jun 11 Sep 11 Dec 11 Mar 12
46% increase
Employee engagement3
74%
69%
78%79%
66%69%
Personal Banking
2010
Personal Banking
2011
Personal Banking
2012
Global index norm
Global finance norm
Global high
performing norm
Perc
ent f
avou
rabl
e
(%)
Mar 09 Sep 09 Mar 10 Sep 10 Mar 11 Sep 11 Mar 12 Apr 12
Weighted average of three major bank peers NAB
-5.1%
78.2
79.8
69.0
74.1
1.6%

8
2.46% 2.29%
1.81%2.27% 2.18%
Mar 10 Sep 10 Mar 11 Sep 11 Mar 12
Group1.67%
Shareholder returns reflect business repositioning
Jan 09 Jul 09 Jan 10 Jul 10 Jan 11 Jul 11 Jan 12
PB shareholder return metrics
Earnings growth since 1H09 impacted by fee reductionsKey driver of NIM has been mix change (mortgages vsunsecured)Personal Banking returns improving and above GroupLowest SVR of majors (for 36 months, committed to lowest for 2012) has delivered several benefits:
• improved retention• ~600,000 net Personal Banking customer growth
since Break Up campaign launched in Feb 2011• less front book discounting
Mortgage retention3
First month of lowest SVR
Break Up kicks off
(1) NIM, RoRWA and BDD/CRWA are annualised.(2) Average RWA based on spot opening and closing RWA. (3) NabRetail and Homeside only, excludes Advantedge and UBank. Proportion of mortgage customers that were with NAB a year ago and still with NAB
1H09 1H10 1H12 Δ
1H09-1H12
Δ1H10-1H12
Cash earnings
$m 408 317 464 4% CAGR 21% CAGR
Underlying profit $m 825 682 829 0% CAGR 10% CAGR
NIM % 2.49 2.34 2.02 -47bps -32bps
RoRWA
% 2.45 1.81 2.29 -16bps +48bps
BDD / CRWA % 1.76 1.40 0.92 -84bps -48bps
Personal Banking key shareholder metrics1
Personal Banking Return on average RWAs2
(%)
262bps increase

9
Personal Banking –
building on strong foundations
9
Our priorities …from investments made
in restoring the core and portfolio gaps
… by focusing on high value segments, clear
customer value proposition, leverage 3rd
party advantage
… building comparative advantage through optimal distribution mix and a step
change in productivity
Integrate customer experience across
channels
Uplift cross sell
Leverage investment in people
Drive efficient, effective operations
Bias includes small business1, mortgage
and deposit rich segments
Help, Guidance & Advice
Innovate in 3rd
party and digital
Optimise channel mix
Drive step change in productivity
(1)
Small business defined as business with annual turnover of up to
$1m, and at least one deposit or lending product.
Realise
value Be different Build for the future
Next Gen & Process Transformation
Fair exchange of valueOur belief
Key enablers

10
Personal Banking –
building on strong foundations
(1) When Roy Morgan collect satisfaction survey data they gather additional data that allows customers to be categorised in to five socio-economic groupings, or quintiles. These quintiles are based on the customers education level, income and occupation. NAB refers to individual brand. Three peers includes ANZ Bank, Commonwealth Bank (inc. Bankwest) and Westpac Bank (inc. St George Bank). Australian Financial Services includes Accounts, Cards, Loans, Managed Investments and Superannuation. 12 months to March 2012.
(2) Conversion from completed mortgage application to loan drawdown, for the month of December 2011. (3) BCG Retail Banking Process & Productivity Benchmarking 2011; includes outsourced FTE. Covers a sample of top retail banks across America, Europe,
APAC.
Mortgage conversion rates 2
N abR etail H o meside
New to bank cross-sell
1.4
1.5
1.6
1.7
1.8
Mar 11 May 11 Jul 11 Sep 11 Nov 11 Jan 12 Mar 12 May 12
Ave
rage
pro
duct
s he
ld
19%8%
18%20%
11%
20%20%
17%
25%
17%
20%21%
24%
20%
41%
NAB Avg 3 majors (exNAB)
% of Australian FinServ footings
MFI customer socio economic distribution1
Higher
Lower
Customer “Value”
46% 40%
1.11.31.7
4 .7
2 .8 2 .52 .1 2 .1
1.4
0
2
4
6
A B C D E F G H I
Benchmarking average
Personal Banking customers per operations FTE 3
27%

11
Summary
Personal Banking back in the game
Peer-leading customer and people metrics
Earnings rebased in 1H10
Upside from improved mortgage conversion ratios, cross-sell and efficiency
Continue to provide a fair exchange of value for all stakeholders
Positioned to meet ‘top line challenge’ and improve returns

Questions
Appendix
14
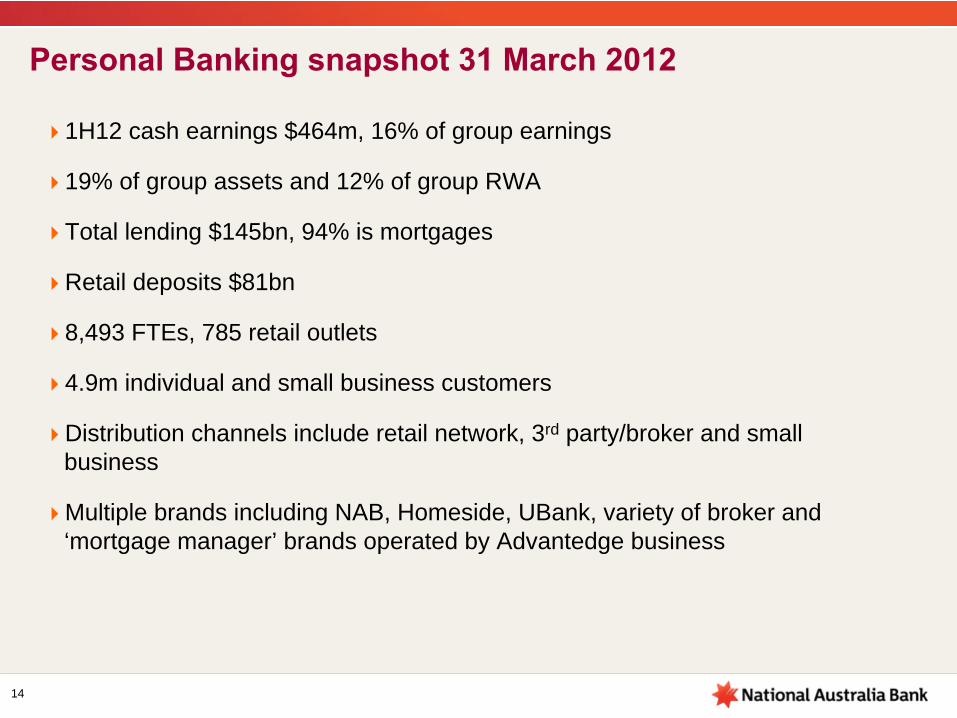
Personal Banking snapshot 31 March 2012
1H12 cash earnings $464m, 16% of group earnings
19% of group assets and 12% of group RWA
Total lending $145bn, 94% is mortgages
Retail deposits $81bn
8,493 FTEs, 785 retail outlets
4.9m individual and small business customers
Distribution channels include retail network, 3rd party/broker and small business
Multiple brands including NAB, Homeside, UBank, variety of broker and ‘mortgage manager’ brands operated by Advantedge business

15
Experienced leadership team
•
Customer Contact Centre
•
ATM•
Online/Digital•
Telephone Banking
•
People & Culture•
Efficiency & Quality•
Customer Resolution
•
NextGen readiness•
Technology•
Corporate Affairs•
Strategy, Marketing
•
Credit risk•
Operational risk•
Compliance
•
Physical /proprietary distribution channels
•
Mobile bankers
•
Mortgages•
Deposits•
Credit Cards•
Personal Loans•
Collections
•
Small business (micro business)
•
Finance•
Capital Management
•
Funding / Transfer Pricing
•
Advantedge•
nabbroker (Homeside)
Group Executive, Personal Banking
Lisa Gray
EGM, NabRetailVicki Carter
<1 Yr in Role26 Yrs in Industry
EGM, Small Business
Cindy Batchelor
1 Yr in Role10 Yrs in Industry
EGM, Growth PartnershipsAntony Cahill
>1 Yrs in Role14 Yrs in Industry
EGM, Direct Banking
Sam Plowman
>2 Yrs in Role20 Yrs in Industry
Chief Risk Officer
Lionel Lopez
>2 Yrs in Role20 Yrs in Industry
Chief Financial Officer
Michelle Grocock
2 Yrs in Role18 Yrs in Industry
EGM, ConsumerProduct
SolutionsJohn Salamito
>3 Yrs in Role26 Yrs in Industry
EGM, BusinessOperations
Anthony Waldron
<1 Yr in Role20 Yrs in Industry
Distribution Enabling functionsShared channels
Product manufacturing
16
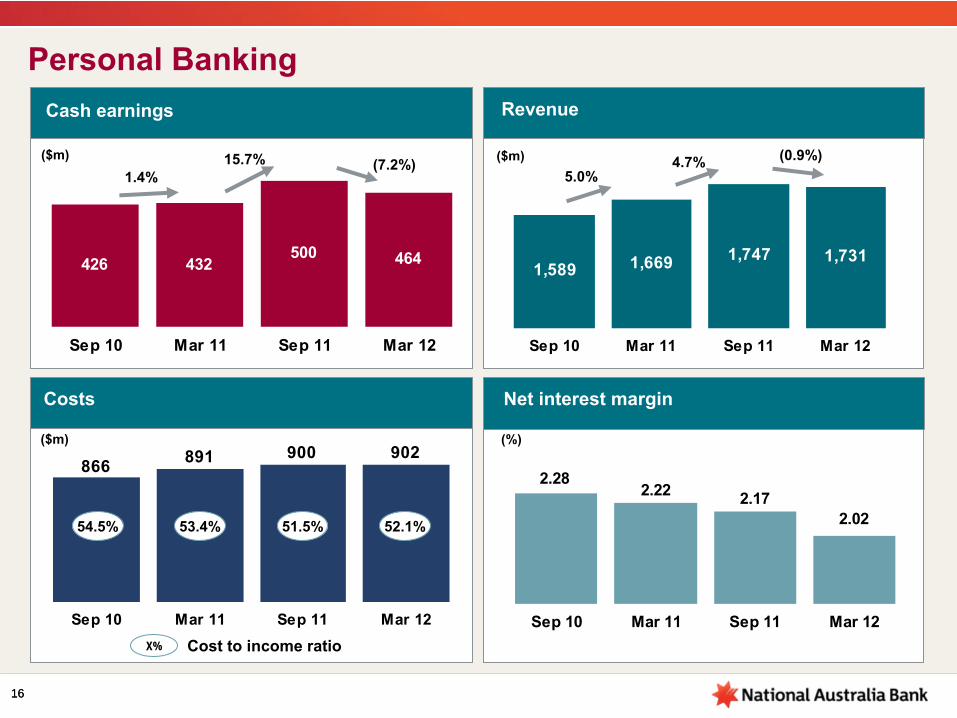
426 432500 464
Sep 10 Mar 11 Sep 11 Mar 12
Personal Banking
1,589 1,669 1,747 1,731
Sep 10 Mar 11 Sep 11 Mar 12
Revenue
($m)
Costs
902900891866
Sep 10 Mar 11 Sep 11 Mar 12
($m)
52.1%54.5%
Cost to income ratioX%
Net interest margin
(%)
Cash earnings
2.02
2.282.22 2.17
Sep 10 Mar 11 Sep 11 Mar 12
53.4%
5.0%
51.5%
($m)1.4%
15.7% 4.7%(7.2%) (0.9%)
16

17
Personal Banking
68 72 7861
Sep 10 Mar 11 Sep 11 Mar 12
104115 125 133
Sep 10 Mar 11 Sep 11 Mar 12
Customer deposits
($bn)
Housing loans
($bn)
(1) RBA Financial System
10.5% 11.5%8.7% 5.9%6.4% 8.3%
17
Increased cost of funding an Australian variable rate mortgage
0
20
40
60
80
100
120
140
160
Pre-crisis Dec 07 Jun 08 Dec 08 Jun 09 Dec 09 Jun 10 Dec 10
Term Funding
Customer Deposits
Bank Bill/Overnight Index Swap Spread
Dec 11 Mar 12
Recovery via repricing
Liquidity Portfolio Costs
Funding cost over the RBA cash rate (bps)
Jun 11
(%)
Australian credit growth % change year-on-
year 1
-10
-4
2
8
14
20
Apr 02 Apr 04 Apr 06 Apr 08 Apr 10 Apr 12
Total Credit Housing CreditOther Personal Credit
18
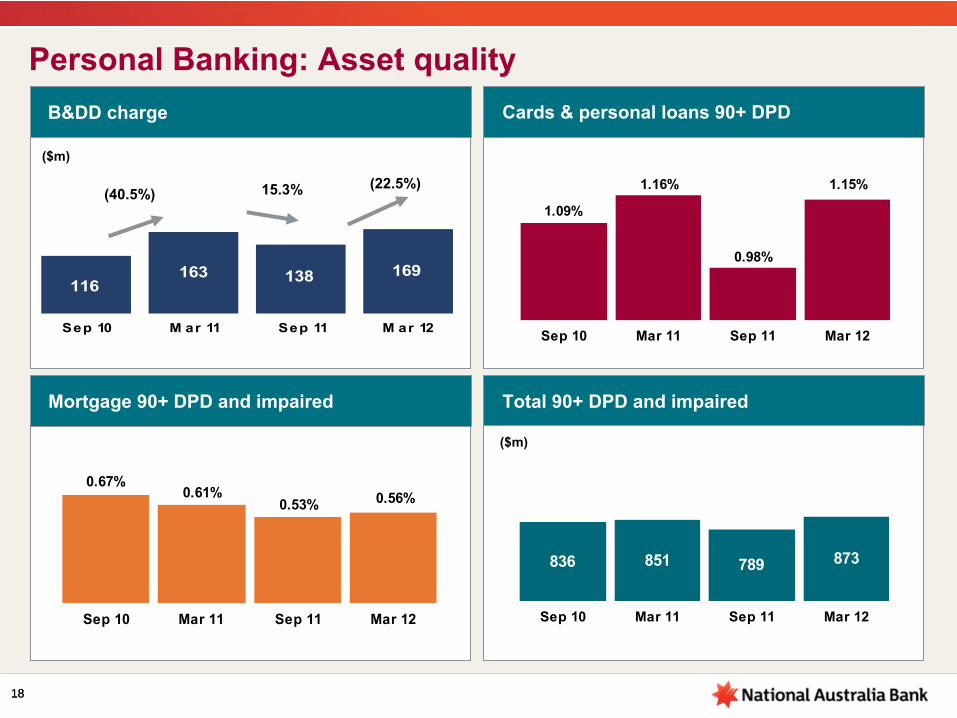
169138163116
Sep 10 M ar 11 Sep 11 M ar 12
Personal Banking: Asset quality
Mortgage 90+ DPD and impaired
B&DD charge
($m)
Cards & personal loans 90+ DPD
Total 90+ DPD and impaired
($m)
(40.5%) 15.3% (22.5%) 1.15%
0.98%
1.16%
1.09%
Sep 10 Mar 11 Sep 11 Mar 12
0.56%0.67%
0.61%0.53%
Sep 10 Mar 11 Sep 11 Mar 12
873836 851 789
Sep 10 Mar 11 Sep 11 Mar 12
18

19
2.22%
2.02%
(0.08%)
(0.06%)
(0.10%)
(0.08%)
0.04%
0.08%
Mar 11 Lending Margin Deposits Funding &Liquidity Costs
Liability Mix Lending Mix Other Mar 12
Personal Banking: Net interest margin
19
2.02%
2.17%
(0.02%)(0.04%)
0.07%
0.01%
Sep 11 Lending Margin Deposits Funding &Liquidity Costs
Liability Mix Lending Mix Other Mar 12
(0.06%)(0.11%)
Customer margin down 12bps
March 12 v September 11
March 12 v March 11
Customer margin down 16bps
20
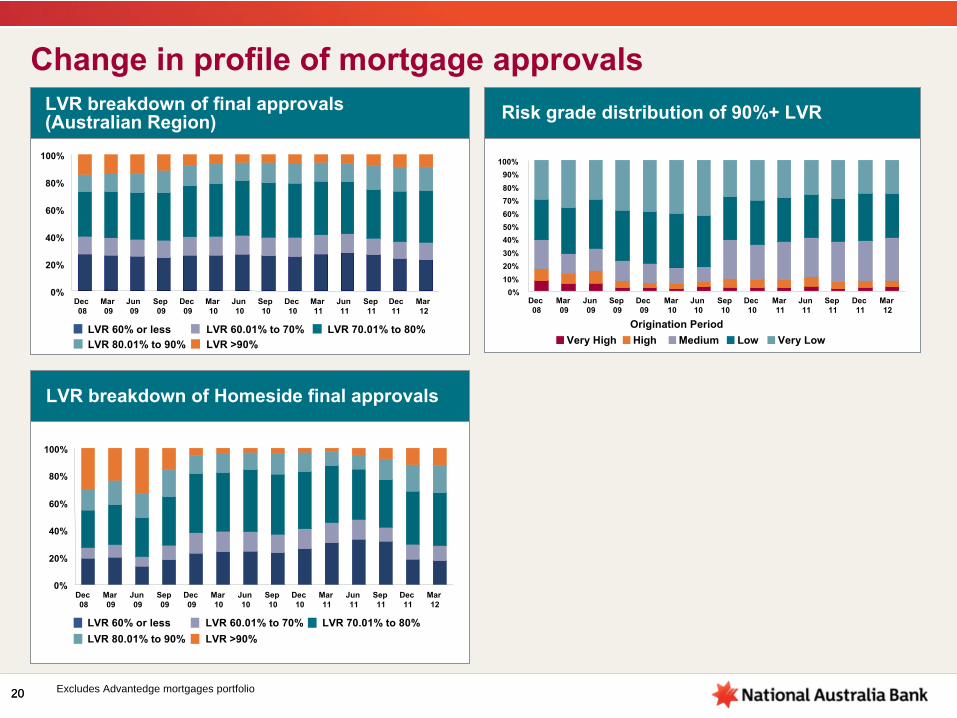
LVR breakdown of final approvals
(Australian Region) Risk grade distribution of 90%+ LVR
Change in profile of mortgage approvals
LVR breakdown of Homeside final approvals
Excludes Advantedge mortgages portfolio20
0%
20%
40%
60%
80%
100%
Dec 08
Mar 09
Jun 09
Sep 09
Dec 09
Mar 10
Jun 10
Sep 10
Dec 10
Mar 11
Jun 11
Sep 11
Dec
11Mar 12
LVR 60% or less LVR 60.01% to 70% LVR 70.01% to 80%LVR 80.01% to 90% LVR >90%
0%
20%
40%
60%
80%
100%
Dec 08
Mar
09Jun 09
Sep 09
Dec 09
Mar 10
Jun 10
Sep 10
Dec 10
Mar 11
Jun 11
Sep 11
Dec 11
Mar 12
LVR 60% or less LVR 60.01% to 70% LVR 70.01% to 80%LVR 80.01% to 90% LVR >90%
0%10%20%30%40%50%60%70%80%90%
100%
Dec 08
Mar 09
Jun 09
Sep 09
Dec 09
Mar 10
Jun 10
Sep 10
Dec 10
Mar 11
Jun 11
Sep 11
Dec 11
Mar 12
Very High High Medium Low Very LowOrigination Period

21
Term Loans - Business 24%
Credit Cards 2%
Other 1%
Personal Loans 1% Mortgages 59%
Bills 11%
Overdraft 2%
Business Banking, Personal Banking and NAB Wealth
(1) Ratio excludes Advantedge mortgages portfolio
Portfolio breakdown –
total $362.8bn as at March 2012
Australian Mortgages Mar 12 Sep 11 Mar 11
Owner Occupied 70.8% 70.2% 68.6%
Investment 29.2% 29.8% 31.4%
Low Document 2.4% 2.4% 2.0%
Proprietary 68.0% 69.0% 70.6%
Third Party Introducer 32.0% 31.0% 29.4%
LMI Insured % of Total HL Portfolio 14.7% 14.4% 14.7%
Current Loan to Value Ratio (CLVR)1 55.8% 52.4% 50.2%
Customers ahead 3 repayments or more1 45.4% 45.7% 46.0%
Average loan size $ (‘000) $258.4 $254.9 $247.5
90 + days past due 0.55% 0.48% 0.54%
Impaired loans 0.27% 0.29% 0.28%
Specific provision coverage 20.2% 19.6% 18.2%
Loss rate 0.06% 0.06% 0.06%
21

22
Australian Mortgages1
–
$213bn as at March 2012Geography
NSW 34%
Qld 20%
SA 5%
WA 11%
Vic 30%
Customer segment
Owner occupied
62%
First home buyer 9%
Investor 29%
$5.1bn outstanding (2.4% of housing book)LVR capped at 60% (without LMI)
Low doc loans
(1) Excludes Wholesale Banking
Origination source –
flows (Australia) Mar 12 Sep 11 Mar 11 Sep 10
Proprietary 64% 61% 60% 61%
Broker 29% 31% 32% 31%
Introducer 7% 8% 8% 8%
22

23
Australian housing prices and debt
House prices have fallen from their peak in mid-2010, though remain at relatively high levelsHouse price growth was most marked from mid 1990s to 2004, and also accelerated sharply through 2009 and the first half of 2010Expectations are now for a stabilisation of prices in coming months followed by only marginal appreciation into the medium termHousing affordability and the debt service burden have improved in the face of lower mortgage rates (with recent cuts to help further) and household deleveraging. That said, the debt burden remains at historically high levels
Note: Income is disposable income after tax and before interest payments Household sector excludes unincorporated enterprises23
Housing affordability
Household debt-to-income ratio
Real dwelling prices 1993 = 100
50
100
150
200
1986 1990 1994 1998 2002 2006 201050
100
150
200
Capital cities
Index
Source: ABS, deflated by private household consumption deflator
Index
0
10
20
30
40
50
1986 1990 1994 1998 2002 2006 20100
10
20
30
40
50
Australia
Index
Source: REIA
Index
Index
0
30
60
90
120
150
1986 1990 1994 1998 2002 2006 20100
10
20
30
40
50
Total (LHS)
Sources: ABS; NAB; RBA
%
Housing (LHS)
Household debt to housing assets (RHS)

24
Solid population growth combined with an insufficient expansion in Australia’s dwelling stock has led to a broad-based undersupply of housing in most locations
The latest NAB Australian Property Survey indicates that overall demand for existing property improved slightly in the March quarter. Resident owner occupiers continue to dominate the market for existing properties – with investors shying away in the more difficult economic climate – although there was a small decrease in first home buyer activity in the first quarter of 2012. Access to credit, employment security and interest rate uncertainty continue to be the biggest impediments to demand side housing credit growth
Around 80% of Australian mortgages are at variable rates, making the most common mortgage rate very sensitive to changes in monetary policy
24
Ratio of Dwellings to Resident Population State average = 100
Most common mortgage interest rates
96
98
100
102
1996 2002 200996
98
100
102
Sources: ABS; NAB
Index Index
QueenslandNew South Wales
Victoria
Western Australia
South Australia
Tasmania
2001 2005 2009
Australian standard variable rate
0
2
4
6
8
%
Sources: RBA; US Federal Reserve
0
2
4
6
8
%
US 30-year fixed interest rate
Characteristics of the Australian Mortgage Market
1996 2002 2009