harnessing total wellness to grow revenue
TRANSCRIPT
1 Copyright 2021 Nielsen Consumer LLC. All rights reserved.
Harnessing total wellness to grow revenueHow CPG brands can capture shoppers searching for trending product attributes
2 Copyright 2021 Nielsen Consumer LLC. All rights reserved.
Executive summary 3
Introduction 4
Values-based buying 5
Top 100+ missed revenue opportunities by brand 6
Today’s trending attributes across CPG categories 10
The opportunity: Activating trending attributes 14
A playbook for activating trending attributes 16
Gain a competitive advantage today and prepare for the future 17
How NielsenIQ Total Wellness can help 18
Who is NielsenIQ? 19
Contents

3 Copyright 2021 Nielsen Consumer LLC. All rights reserved.
Executive summary Health and wellness concerns are increasingly driving consumer buying decisions. Consumers want products based on their interest in sustainability, social impact, animal welfare, local sourcing, BIPOC-owned businesses, and more. Additionally, shoppers want to take charge of their health. They are looking to boost immunity, improve gut health, reduce sugar intake, and make other health-related lifestyle upgrades. Online and in-store, shoppers are searching for products with specific ingredients and functional benefits.
Because of the growing interest in total wellness, CPG brands are starting to recognize a multi-billion-dollar market opportunity. This opportunity exists for companies that deliver a customer experience optimized for product discovery that makes it easy for shoppers to find products with specific attributes. Brands and retailers that make these product attributes easy to identify and find in searches will be able to profit from this potential market growth.
The opportunity is significant: 95% of CPG products that qualify for the most frequently searched product attributes do not appear in search results. The consequence is dissatisfied, disengaged customers and missed revenue.1 A data-driven health and wellness personalization strategy will improve the customer experience and help brands and retailers grow revenue in the process.
This report explores proven and emerging trends in health and wellness product attribute searches and the opportunities available through identifying, recognizing, and activating product attributes. It also offers a playbook for how to engage shoppers who are searching for products with these attributes.
95% of CPG products that qualify for the
most frequently searched product attributes do not appear in search results for those
attributes
1 https://nielseniq.com/global/en/insights/infographic/2021/reliance-on-search-queries-makes-personalized-shopping-experience-a-necessity/

4 Copyright 2021 Nielsen Consumer LLC. All rights reserved.
Introduction Increasingly, today’s consumers make buying decisions with health and wellness in mind. From lifestyle choices to medical needs, the criteria that drive purchase behavior have shifted to prioritize health concerns. For this reason, consumers are increasingly motivated to purchase products with specific attributes that meet their health or lifestyle needs such as ketogenic, low-sugar, and peanut-free. According to new research by Walker Sands in collaboration with NielsenIQ, consumers shop for specific attributes for many reasons, ranging from specific dietary needs to general health and wellness lifestyle choices. Overall, they are primarily concerned with how the products they purchase will impact their health.2
The health and wellness segment is projected to accelerate from $175 billion in sales today to $203 billion in sales by 2023 in the U.S. alone.3 Because the majority of CPG products don’t claim qualifying attributes—either on-package or in their online product content—many CPG brands are missing out on this market growth. Their products simply aren’t being found by shoppers who search for the attributes that the products qualify for.
The problem is not only that CPG brands aren’t claiming the attributes their products qualify for but CPGs also often have a blind spot to their product’s ingredients and the needs that their products meet. For example, Protein is the number one specialty diet attribute across food and beverage e-commerce searches, with only 2/3 of products eligible to make a protein claim actually making one.
In many cases, brands don’t even know what attributes are trending or what trends are emerging. This lack of visibility means brands are unsure how to direct innovation, product launches, brand marketing and promotions, e-commerce experiences, personalization, or retail media campaigns. Manufacturers and retailers can improve existing product discoverability with deeper product attribute knowledge. They can get ahead of the latest trends in the marketplace by measuring and understanding the attributes that matter most to their shoppers.
The health and wellness segment
is projected to accelerate from
$175 billion in sales today to $203 billion in
sales by 2023 in the U.S. alone
2 NielsenIQ Label Insights/Activating Attributes Quick Poll Topline Findings 3 https://nielseniq.com/global/en/insights/infographic/2021/reliance-on-search-queries-makes-personalized-shopping-experience-a-necessity/
5 Copyright 2021 Nielsen Consumer LLC. All rights reserved.
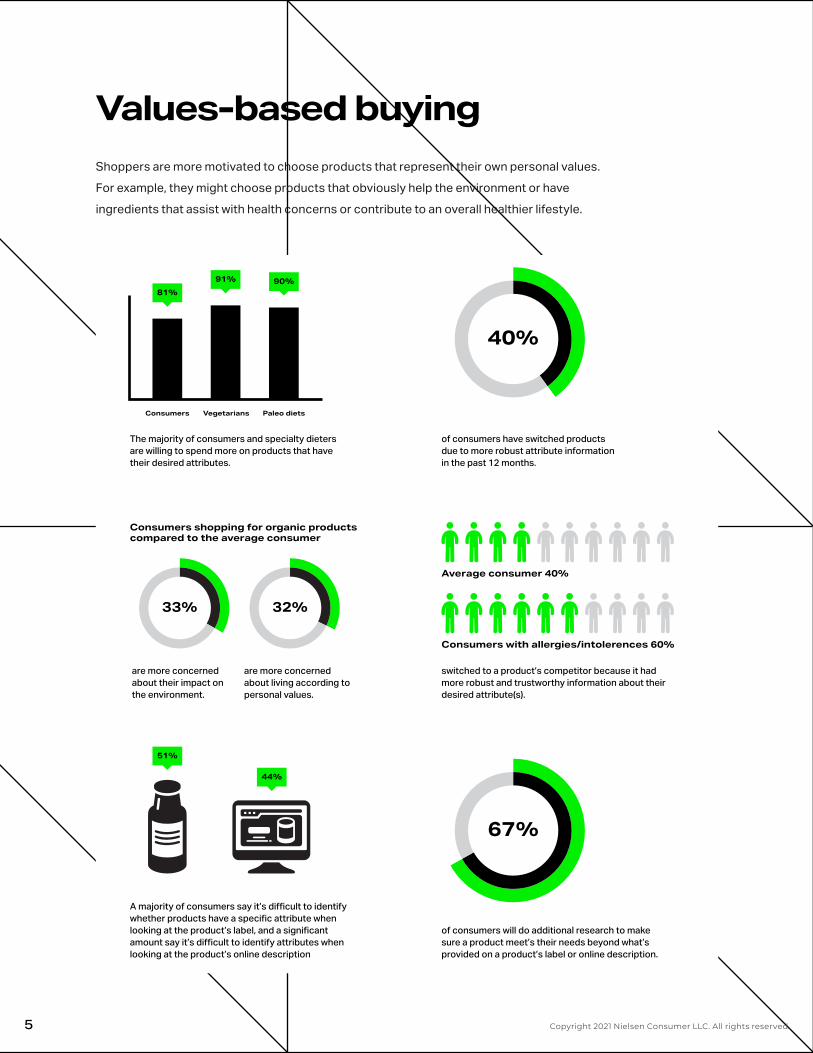
Values-based buying Shoppers are more motivated to choose products that represent their own personal values. For example, they might choose products that obviously help the environment or have ingredients that assist with health concerns or contribute to an overall healthier lifestyle.
of consumers will do additional research to make sure a product meet’s their needs beyond what’s provided on a product’s label or online description.
67%
switched to a product’s competitor because it had more robust and trustworthy information about their desired attribute(s).
Average consumer 40%
Consumers with allergies/intolerences 60%
40%
of consumers have switched products due to more robust attribute information in the past 12 months.
81%91% 90%
Consumers Vegetarians Paleo diets
The majority of consumers and specialty dieters are willing to spend more on products that have their desired attributes.
44%
51%
A majority of consumers say it’s difficult to identify whether products have a specific attribute when looking at the product’s label, and a significant amount say it’s difficult to identify attributes when looking at the product’s online description
Consumers shopping for organic productscompared to the average consumer
33% 32%
are more concerned about their impact on the environment.
are more concerned about living according to personal values.

6 Copyright 2021 Nielsen Consumer LLC. All rights reserved.
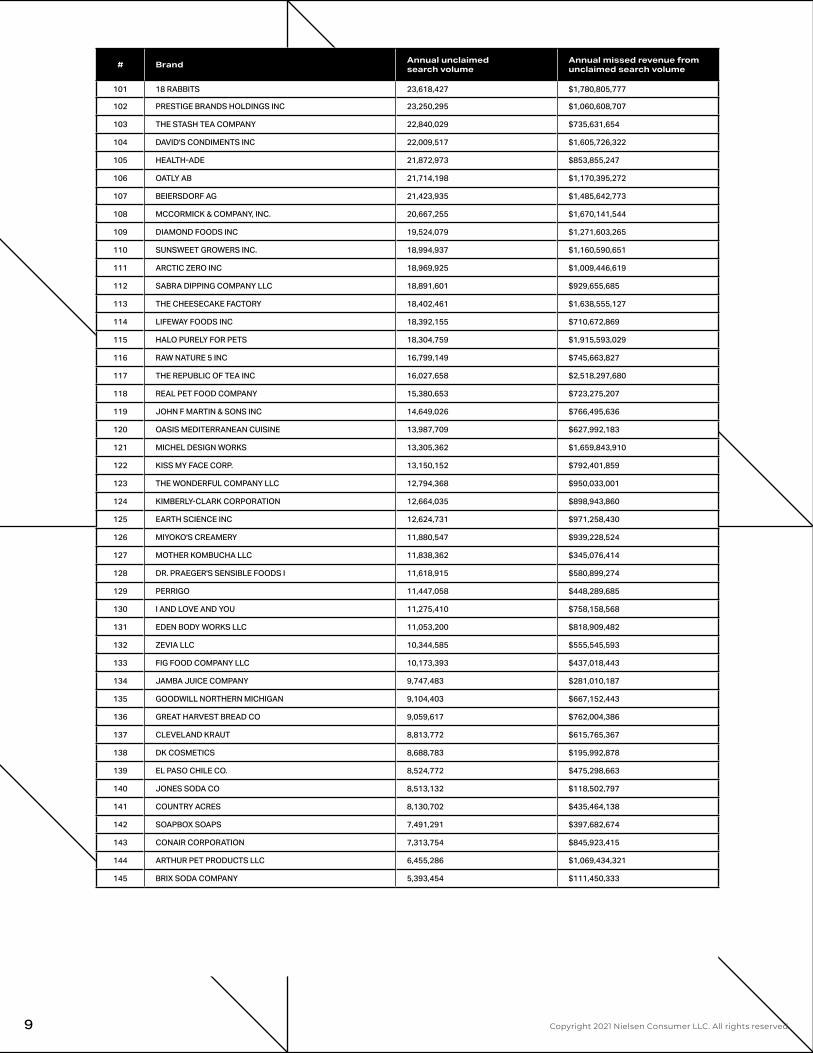
Top 100+ missed revenue opportunities by brandOne of the most revealing insights from the NielsenIQ Label Insight data collected is the dollar amount of e-commerce revenue each grocery CPG brand is missing out on by not optimizing for attributes. Here are the top 145 missed revenue opportunities by brand.
Methodology
• Trending Attributes are identified by aggregating long-tail category and attribute specific searches.
• Annual unclaimed search volume aggregates missed impressions across a brand’s portfolio for category searches products qualify for, but are not claiming on pack.
• Annual missed revenue from unclaimed search volume applies average unit price and actual keyword conversion rates and to quantify missed opportunity.

7 Copyright 2021 Nielsen Consumer LLC. All rights reserved.
# Brand Annual unclaimed search volume
Annual missed revenue from unclaimed search volume
1 PEPSICO INC 5,773,621,977 $188,393,285,110
2 CONAGRA INC 5,669,785,783 $156,973,689,188
3 ABBOTT LABORATORIES INC 4,140,294,399 $488,811,437,335
4 NESTLE HOLDINGS INC 3,714,278,902 $171,265,400,171
5 KELLOGG COMPANY 3,699,483,532 $132,256,536,269
6 GENERAL MILLS 3,209,402,362 $102,164,905,390
7 DAIRY FARMERS OF AMERICA INC. 2,830,460,305 $102,807,979,198
8 DOLE FOOD COMPANY INC 2,801,041,008 $89,972,238,218
9 CAMPBELL SOUP CO 2,758,549,525 $86,497,078,906
10 POST HOLDINGS INC 2,728,359,044 $122,489,679,280
11 B & G FOODS INC. 2,403,992,358 $77,543,177,500
12 DANONE NORTH AMERICA 2,364,260,575 $80,034,948,985
13 DEL MONTE FOODS COMPANY 1,671,619,393 $31,944,646,600
14 THE KRAFT HEINZ COMPANY 1,666,098,767 $61,112,502,774
15 H. P. HOOD INC. 1,588,945,086 $72,675,170,343
16 MCCORMICK & COMPANY INC. 1,362,258,840 $38,873,418,258
17 COCA-COLA COMPANY 1,279,119,496 $43,392,849,782
18 PRAIRIE FARMS DAIRY INC 1,207,989,111 $39,421,516,648
19 GLANBIA PLC 1,126,295,387 $71,382,349,037
20 KENT CORPORATION 1,041,142,211 $16,912,314,075
21 UNILEVER GROUP 945,252,388 $41,175,194,021
22 GOYA FOODS INC 943,255,917 $20,869,537,164
23 HORMEL FOODS CORPORATION 838,997,819 $42,727,641,928
24 KEURIG DR PEPPER 761,114,667 $27,027,181,825
25 UTZ QUALITY FOODS INC. 696,115,437 $24,532,500,231
26 GRUPO BIMBO S.A. DE C.V. 690,614,865 $27,022,378,438
27 BOB'S RED MILL NATURAL FOODS 631,799,225 $36,828,840,424
28 FLOWERS FOODS INC. 599,694,915 $21,828,894,906
29 J. M. SMUCKER COMPANY THE 544,476,586 $39,948,247,115
30 NATURE'S PATH FOODS INC. 527,066,850 $24,306,214,855
31 PROCTER & GAMBLE COMPANY THE 513,488,517 $30,841,147,308
32 CLIF BAR INC. 508,099,588 $19,836,207,916
33 RED GOLD INC. 456,834,443 $6,651,509,490
34 MIZKAN GROUP CORP 432,608,587 $11,694,275,324
35 MARS INCORPORATED 420,413,482 $16,963,263,585
36 HAIN CELESTIAL GROUP 396,306,296 $18,413,975,737
37 MONDELEZ INTERNATIONAL INC 385,644,828 $13,713,530,084
38 L'OREAL SA 345,924,014 $24,662,652,578
39 LA PREFERIDA INC 331,810,947 $6,647,500,512
40 THE HERSHEY CO 294,987,826 $7,665,553,646
41 STARBUCKS COFFEE CO 288,126,405 $12,360,622,775
42 CARGILL INCORPORATED 280,679,174 $21,717,551,088
43 JOHN B SANFILIPPO & SON INC 269,800,455 $17,396,733,338
44 CHOBANI INC 260,821,315 $4,791,026,735
45 SAPUTO INC. 232,696,884 $11,951,777,356
46 OCEAN SPRAY CRANBERRIES INC 230,372,504 $9,442,047,449
47 COLGATE-PALMOLIVE COMPANY 203,522,192 $9,296,486,686
48 NEWMAN'S OWN INC 188,630,141 $9,839,702,675
49 MCKEE FOODS CORPORATION 169,389,963 $4,158,862,372
50 SIMPLY 7 SNACKS LLC 162,410,751 $5,916,948,480

8 Copyright 2021 Nielsen Consumer LLC. All rights reserved.
# Brand Annual unclaimed search volume
Annual missed revenue from unclaimed search volume
51 EDEN FOODS INC. 155,795,146 $6,896,739,523
52 JOHNSON & JOHNSON 152,727,366 $10,671,977,427
53 SMITHFIELD FOODS INC 146,780,340 $6,387,880,397
54 JELLY BELLY CANDY COMPANY 134,701,156 $3,207,773,329
55 G L MEZZETTA INC. 129,068,933 $5,281,500,738
56 OLD DUTCH FOODS LTD 127,560,934 $4,875,761,580
57 TYSON FOODS INC 127,538,511 $7,749,239,928
58 TILLAMOOK 119,456,265 $5,560,689,136
59 FERRERO S.P.A 117,422,723 $2,909,735,076
60 AMY'S KITCHEN INC. 110,702,284 $5,375,260,102
61 CALIFIA FARMS LP 108,447,254 $5,200,804,960
62 BARILLA G & R F.LLI S.P.A. 97,967,793 $1,825,139,984
63 SARGENTO FOODS INC 96,107,862 $4,265,266,916
64 LAND O'LAKES INC 95,845,592 $4,934,131,076
65 PACIFIC COAST PRODUCERS 92,536,497 $1,464,575,138
66 THE CLOROX COMPANY 91,811,107 $3,914,458,358
67 KIND LLC 91,165,821 $3,386,992,582
68 FERRARA CANDY COMPANY INC 78,926,722 $2,071,826,453
69 GLAXO SMITH KLINE PLC 76,446,656 $4,457,604,511
70 LINK SNACKS INC. 74,522,971 $3,681,434,767
71 OLE MEXICAN FOODS INC. 66,686,935 $2,193,066,544
72 S C JOHNSON & SON INC 63,794,675 $3,686,375,295
73 BUSH BROTHERS & COMPANY 62,254,416 $1,281,942,934
74 HENKEL KGAA 59,695,868 $2,789,946,087
75 SPICEOLOGIST 56,667,519 $4,433,893,357
76 PARFUMS DE COEUR LTD 55,307,027 $2,789,465,214
77 RICH PRODUCTS CORPORATION 54,408,989 $5,307,923,331
78 HOSTESS BRANDS LLC 50,559,837 $1,327,549,640
79 KING'S HAWAIIAN BAKERY WEST 45,449,538 $2,104,540,857
80 BONE BROTH CO 43,466,023 $3,878,690,562
81 TOO GOOD GOURMET INC 39,970,223 $1,843,746,447
82 KEN'S FOODS INC. 39,813,583 $1,231,832,258
83 PAMELA'S PRODUCTS INC. 39,362,890 $2,462,542,398
84 SUNKIST GROWERS INC 34,705,303 $1,882,207,403
85 RUDI'S ORGANIC BAKERY 34,242,656 $2,161,362,204
86 EVOLVE BRANDS LLC 34,162,497 $1,284,407,400
87 BLUE DIAMOND GROWERS 32,794,949 $1,607,411,630
88 SUN-MAID GROWERS OF CALIFORNIA 32,148,804 $1,364,523,837
89 SARATOGA CHIPS LLC. 31,979,565 $1,244,516,752
90 CANIDAE CORPORATION 31,117,385 $6,153,027,240
91 DIETZ & WATSON INC 28,800,352 $1,824,358,297
92 CALIFORNIA FLAVORED NUTS 28,253,336 $1,884,299,738
93 THE HONEST COMPANY INC 27,295,581 $2,788,079,826
94 YES TO LTD 26,100,921 $1,127,011,668
95 NATURESWEET LIMITED 25,264,062 $1,248,044,663
96 JOHNSONVILLE SAUSAGE INC 25,202,700 $1,168,800,415
97 DAIYA FOODS INC 25,189,685 $1,566,647,269
98 PACIFICA BEAUTY LLC 25,070,444 $2,172,554,536
99 FAGE DAIRY INDUSTRY SA 24,559,605 $615,365,463
100 CHURCH & DWIGHT COMPANY INC. 24,370,163 $1,043,871,562
9 Copyright 2021 Nielsen Consumer LLC. All rights reserved.
# Brand Annual unclaimed search volume
Annual missed revenue from unclaimed search volume
101 18 RABBITS 23,618,427 $1,780,805,777
102 PRESTIGE BRANDS HOLDINGS INC 23,250,295 $1,060,608,707
103 THE STASH TEA COMPANY 22,840,029 $735,631,654
104 DAVID'S CONDIMENTS INC 22,009,517 $1,605,726,322
105 HEALTH-ADE 21,872,973 $853,855,247
106 OATLY AB 21,714,198 $1,170,395,272
107 BEIERSDORF AG 21,423,935 $1,485,642,773
108 MCCORMICK & COMPANY, INC. 20,667,255 $1,670,141,544
109 DIAMOND FOODS INC 19,524,079 $1,271,603,265
110 SUNSWEET GROWERS INC. 18,994,937 $1,160,590,651
111 ARCTIC ZERO INC 18,969,925 $1,009,446,619
112 SABRA DIPPING COMPANY LLC 18,891,601 $929,655,685
113 THE CHEESECAKE FACTORY 18,402,461 $1,638,555,127
114 LIFEWAY FOODS INC 18,392,155 $710,672,869
115 HALO PURELY FOR PETS 18,304,759 $1,915,593,029
116 RAW NATURE 5 INC 16,799,149 $745,663,827
117 THE REPUBLIC OF TEA INC 16,027,658 $2,518,297,680
118 REAL PET FOOD COMPANY 15,380,653 $723,275,207
119 JOHN F MARTIN & SONS INC 14,649,026 $766,495,636
120 OASIS MEDITERRANEAN CUISINE 13,987,709 $627,992,183
121 MICHEL DESIGN WORKS 13,305,362 $1,659,843,910
122 KISS MY FACE CORP. 13,150,152 $792,401,859
123 THE WONDERFUL COMPANY LLC 12,794,368 $950,033,001
124 KIMBERLY-CLARK CORPORATION 12,664,035 $898,943,860
125 EARTH SCIENCE INC 12,624,731 $971,258,430
126 MIYOKO'S CREAMERY 11,880,547 $939,228,524
127 MOTHER KOMBUCHA LLC 11,838,362 $345,076,414
128 DR. PRAEGER'S SENSIBLE FOODS I 11,618,915 $580,899,274
129 PERRIGO 11,447,058 $448,289,685
130 I AND LOVE AND YOU 11,275,410 $758,158,568
131 EDEN BODY WORKS LLC 11,053,200 $818,909,482
132 ZEVIA LLC 10,344,585 $555,545,593
133 FIG FOOD COMPANY LLC 10,173,393 $437,018,443
134 JAMBA JUICE COMPANY 9,747,483 $281,010,187
135 GOODWILL NORTHERN MICHIGAN 9,104,403 $667,152,443
136 GREAT HARVEST BREAD CO 9,059,617 $762,004,386
137 CLEVELAND KRAUT 8,813,772 $615,765,367
138 DK COSMETICS 8,688,783 $195,992,878
139 EL PASO CHILE CO. 8,524,772 $475,298,663
140 JONES SODA CO 8,513,132 $118,502,797
141 COUNTRY ACRES 8,130,702 $435,464,138
142 SOAPBOX SOAPS 7,491,291 $397,682,674
143 CONAIR CORPORATION 7,313,754 $845,923,415
144 ARTHUR PET PRODUCTS LLC 6,455,286 $1,069,434,321
145 BRIX SODA COMPANY 5,393,454 $111,450,333

10 Copyright 2021 Nielsen Consumer LLC. All rights reserved.
Today’s trending attributes across CPG categories What are the current proven and growing trends we can expect over the next year? Here are the top findings based on an analysis of Q2 2021 search and attribute data from NielsenIQ Label Insight’s platform and market measurement data from NielsenIQ.
Health and beauty
• Across all health and beauty: Aluminum free — 120% growth in search volume in 6 months. 446K annual searches. 63K personal care products qualify for this attribute and aren’t claiming on package.
• Across all health and beauty: Biodegradable — Shows strong sales growth vs a year ago at 7.1% and huge growth vs pre-covid (2 years ago) at 73%. 36% growth in search volume. 35K annual searches.
• In haircare: Free from sulfates — Sales growth 3.2% current period vs year ago, 10.0% vs 2 years ago. 510K annual e-commerce searches. $4B in sales in the last 52-week period.
• In bath and body wash: Not tested on animals — Sales growth 15.6% current period vs year ago, 48.6% vs 2 years ago. $1.1B in sales in the last 52-week period.
• In eye makeup: Cruelty free — Sales growth 25.2% current period vs year ago, 29.4% vs 2 years ago. 8K annual e-commerce searches. $125M in sales in the latest 52-week period.
• In makeup: Oil-free — 8K annual e-commerce searches. 3,500 qualifying products not claiming on pack.
67kannual searches
49kannual searches
292kannual searches
528kannual searches
35kannual searches
6.5%conversion rate
8.7%conversion rate
5.1%conversion rate
6.2%conversion rate
5.2%conversion rate
SLS free Humane Vegan Sulfate free Biodegradable
$23.1bdollar sales
$2.6bdollar sales
$2.0bdollar sales
$17.1bdollar sales
$567.1mdollar sales
1.3%dollar growth
8.9%dollar growth
20.2%dollar growth
2.5%dollar growth
7.1%dollar growth
Source: NielsenIQ Retail Measurement Services, Product Insight, powered by Label Insight, Total US xAOC L52W ending 7/30/21; Beauty & Personal Care

11 Copyright 2021 Nielsen Consumer LLC. All rights reserved.
Forward looking beauty consumers are looking for long-term sustainable solutions and products that do no harm.
305% Reef safe
130% Plastic free
38% Refillable
36% Biodegradable
Next-generation sustainability searches in HBC
330% Renewable resource
542% Family farmed
15.6% Not tested on animals
22.3% Cruelty free
“Better for we” sales growth in body wash
Label Insight e-commerce trends data from Amazon, Instacart, Shipt, Target, Walmart, Kroger, powered by SimilarWeb. Last 6 months, March 2021 - September 2021
Food and beverage
• In all food and beverage: Plant based — Sales growth 12.4% current period vs year ago, 36.9% vs 2 years ago. 55K annual e-commerce searches. $312M in sales in the last 52-week period. 296 qualifying products not claiming on pack.
• In all food and beverage: Low fat — Sales growth 28.2% current period vs year ago, 76.5% vs 2 years ago. 2,472 qualifying products not claiming on pack.
• In all food and beverage: Non dairy — Sales growth 9.7% current period vs year ago, 32.0% vs 2 years ago. $4B in sales in the last 52-week period. 70 qualifying products not claiming on pack.
• In yogurt: Vegan — Sales growth 9.7% current period vs year ago, 28.5% vs 2 years ago. 330K annual e-commerce searches. $265M in sales in the last 52-week period. 18 qualifying products not claiming on pack.
• In cakes and desserts: Ketogenic — Sales growth 39.1% current period vs year ago, 917% vs 2 years ago. 177K annual e-commerce searches. $130M in sales in the last 52-week period.
• In cereals: Free from grain — Sales growth 61.3% current period vs year ago, 239.5% vs 2 years ago. 61K annual e-commerce searches. $49M in sales in the last 52-week period.
3.2mannual searches
2.2mannual searches
6.9mannual searches
750kannual searches
5.1mannual searches
6.8%conversion rate
7.8%conversion rate
6.4%conversion rate
7.5%conversion rate
5.4%conversion rate
Ketogenic Raw Vegan Grass fed Sugar free
$70.1bdollar sales
$2.7bdollar sales
$77.9bdollar sales
$906mdollar sales
$45.2bdollar sales
5.0%dollar growth
13.0%dollar growth
4.1%dollar growth
5.1%dollar growth
5.0%dollar growth
19% search growth
Source: NielsenIQ Retail Measurement Services, Product Insider, powered by Label Insight, Total US xAOC L52W ending 7/30/21; Food & Beverage

12 Copyright 2021 Nielsen Consumer LLC. All rights reserved.
From clean label to sustainability in food and beverage
Sustainability claims continue strong double-digit growth across the board when comparing to pre-COVID period.
+27.1%
Social responsibility
+16.4%
Sustainable farming
+13.2%
Sustainable resource
management
+18.0%
Sustainable forestry
+16.1%
Sustainable packaging
+23.8%
Animal welfare
B corporation+26%
Ethical+23%
Fair trade +21%
Sustainable farming +16%
Carbon footprint +12%
Renewable energy +7%
Palm oil free +16%
Forest stewardship council +22%
Rainforest alliance certified +8%
Recyclable +15%
Recycled packaging content +7%
Terracycle+17%
Farm raised +36%
Cage free +22%
Grass fed +21%
Free range +25%
Pasture raised +22%
Source: NielsenIQ Retail Measurement Services, Product Insight, powered by Label Insight, Total Food & Beverage; Total US xAOC L52W ending 8/14/21 vs 2YA
Household cleaners
• Hypoallergenic — Sales growth 2.7% current period vs year ago, 93.3% vs 2 years ago. 40K annual searches.
• Bleach-free — Sales growth 21.8% current period vs year ago, 75.5% vs 2 years ago. 48K annual searches.
• Unscented / naturally scented — Growth in searches for unscented or naturally scented (i.e. contains lavender essential oils) laundry detergent and dryer sheets. 83K annual searches, 5% growth in search volume in last year. 4.8% sales growth in last year, 18.5% sales growth in the last 2 years.
$179m $103m$202m$217m
42% of green HH cleaners are plant based
Plant based
39% of green HH cleaners are naturally derived
Naturally derived
35% of green HH cleaners are non-toxic
Non-toxic
20% of green HH cleaners are EPA safer choice
EPA safer choice
Top claims in green household cleaners
13 Copyright 2021 Nielsen Consumer LLC. All rights reserved.
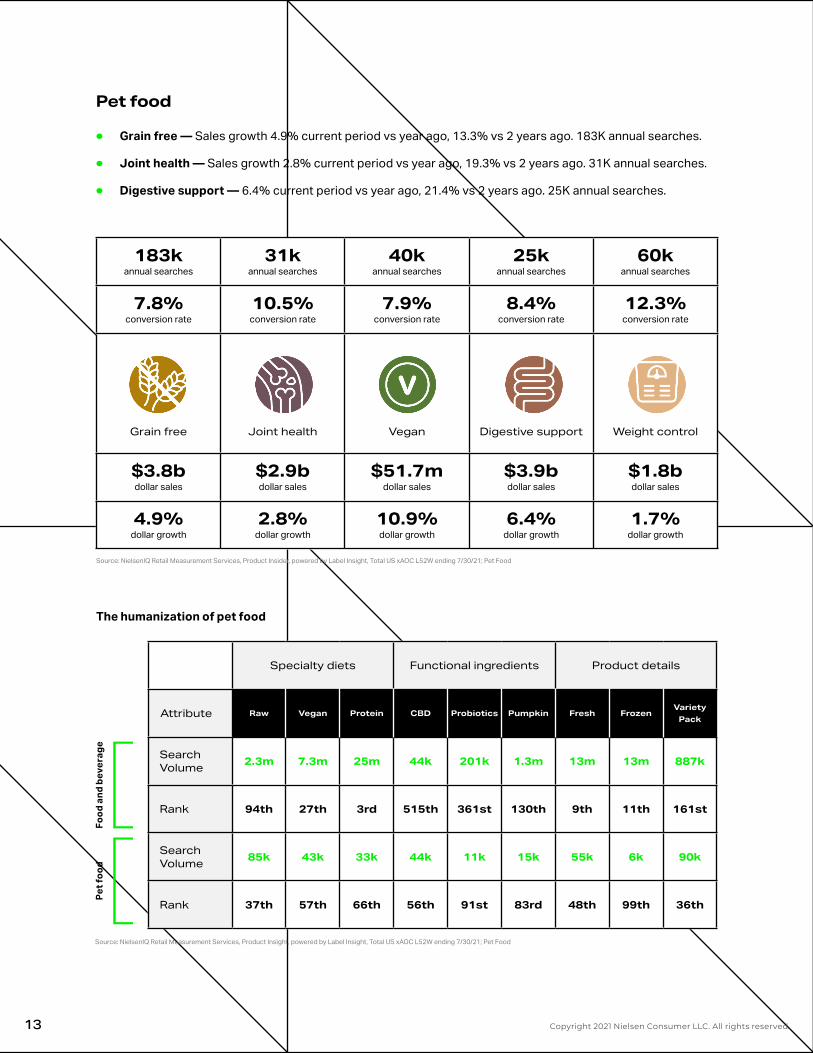
Pet food
• Grain free — Sales growth 4.9% current period vs year ago, 13.3% vs 2 years ago. 183K annual searches.
• Joint health — Sales growth 2.8% current period vs year ago, 19.3% vs 2 years ago. 31K annual searches.
• Digestive support — 6.4% current period vs year ago, 21.4% vs 2 years ago. 25K annual searches.
183kannual searches
31kannual searches
40kannual searches
25kannual searches
60kannual searches
7.8%conversion rate
10.5%conversion rate
7.9%conversion rate
8.4%conversion rate
12.3%conversion rate
Grain free Joint health Vegan Digestive support Weight control
$3.8bdollar sales
$2.9bdollar sales
$51.7mdollar sales
$3.9bdollar sales
$1.8bdollar sales
4.9%dollar growth
2.8%dollar growth
10.9%dollar growth
6.4%dollar growth
1.7%dollar growth
Specialty diets Functional ingredients Product details
Attribute Raw Vegan Protein CBD Probiotics Pumpkin Fresh FrozenVariety
Pack
Search Volume 2.3m 7.3m 25m 44k 201k 1.3m 13m 13m 887k
Rank 94th 27th 3rd 515th 361st 130th 9th 11th 161st
Search Volume 85k 43k 33k 44k 11k 15k 55k 6k 90k
Rank 37th 57th 66th 56th 91st 83rd 48th 99th 36th
Food
and
bev
erag
ePe
t foo
d
Source: NielsenIQ Retail Measurement Services, Product Insider, powered by Label Insight, Total US xAOC L52W ending 7/30/21; Pet Food
Source: NielsenIQ Retail Measurement Services, Product Insight, powered by Label Insight, Total US xAOC L52W ending 7/30/21; Pet Food
The humanization of pet food

14 Copyright 2021 Nielsen Consumer LLC. All rights reserved.
The opportunity: Activating trending attributes Today’s consumers are committed to their health and lifestyle choices and they’re aligning purchasing decisions with these commitments. 200 million shoppers say they adhere to a particular diet or health-related eating program. Also, 180 million shoppers say a food allergy or intolerance affects their purchasing decisions.4
Additionally, 40% of consumers say that they seek products and services aligned with their values, while only 13% are brand-driven.5 But before shoppers can buy, they must be able to find the products that align with their lifestyle, values, and wellness needs.
More CPG brands are recognizing the current opportunity to improve the shopping experience and capture searches for the attributes their products qualify for. Right now, this opportunity represents a competitive advantage, but it won’t be long before activating product attributes becomes table stakes.
The business case for changeAs health and wellness rises as a category from the current $175 billion in sales to $203 billion by 2023, we can expect to see increasing demand for shopping experiences that make it easier for consumers to find the products they want based on the attributes they’re searching for. And this opportunity isn’t only available to niche boutique brands—conventional retail represents 44% of health and wellness product sales.
Ingredient deep dive:
ErythritolErythritol is currently winning in the sweeteners space, likely due to the low-carbohydrate lifestyle and keto trend.
• Erythritol is the only zero-calorie sugar alcohol.
• Erythritol does not affect blood sugar levels, making it ideal for individuals following both keto and diabetic diets.
• While 26% of products containing erythritol qualify for the keto diet, only 20% of these are making a ketogenic claim.
• In the cereal & granola and cookies & crackers categories alone, this represents a $15.7 million and $7.24 million opportunity, respectively.
4 Transparency Trends Report, FMI & Label Insight, 2020 5 https://www.ibm.com/downloads/cas/EXK4XKX8
15 Copyright 2021 Nielsen Consumer LLC. All rights reserved.
How to win missed revenue opportunities To capture this missed revenue opportunity, CPG brands need to adapt to how the modern consumer searches for products, including their strategies for search, taxonomy, and product detail page content. Here are four ways brands can win missed revenue opportunities.
1. Use data to understand your customer: Consumer behavior is constantly changing. New fads develop. New information comes to light. Language shifts. These changes happen quickly—the relative rank of the most-searched attributes on a product changes every month and a half. For example, there might be a high volume of searches for “keto” one month that is replaced by “low carb” the next. Search terms vary by platform as well, adding to the complexity.
Keeping up can be a daunting task, but having a thorough understanding of your customer is crucial to capitalize on shopping trends. Today’s CPG brands need a central source of up-to-date data relevant to their customers. This data provides insight on what terms customers are searching now and illuminates trends that will influence demand in the future.
2. Develop an attribute-based keyword strategy: Every product has specific product attribute keywords associated with it, like gluten-free, low-fat, organic, natural, kosher, sugar-free, etc. CPG brands need to optimize their SKUs for search. To do so, they must first know which attributes apply to which products. Brands need to include attribute keywords in the retailer set-up process for each SKU, which will tie the product to those keywords in the retailer taxonomy, and embed the keywords in the back-end content.
3. Use attributes in imagery on the physical and digital shelves: Consumers looking through product images—whether on a physical store shelf or an e-commerce image carousel—should be able to quickly see relevant attributes that they value. Adding relevant product attribute information (like gluten-free or sugar-free) to hero images will encourage shoppers to click. Additionally, product detail pages should include relevant terms that incentivize the consumer to convert or scroll down the page for more details that will lead to a conversion.
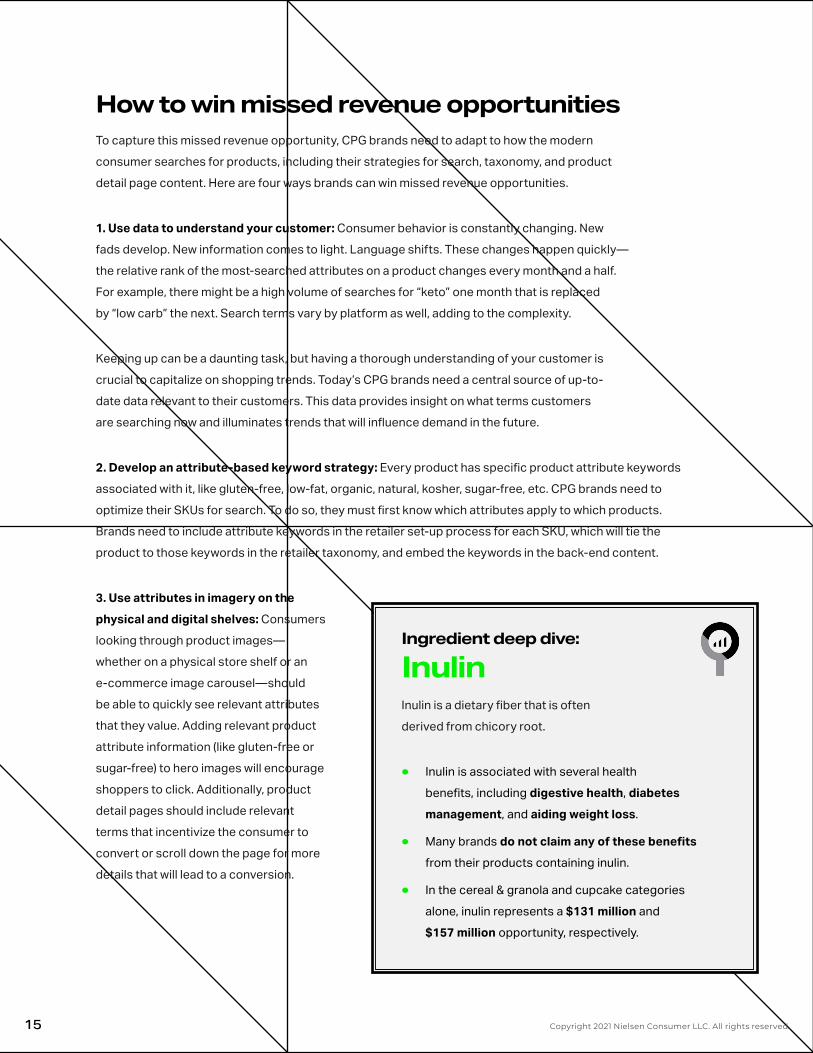
Ingredient deep dive:
InulinInulin is a dietary fiber that is often derived from chicory root.
• Inulin is associated with several health benefits, including digestive health, diabetes management, and aiding weight loss.
• Many brands do not claim any of these benefits from their products containing inulin.
• In the cereal & granola and cupcake categories alone, inulin represents a $131 million and $157 million opportunity, respectively.
16 Copyright 2021 Nielsen Consumer LLC. All rights reserved.
A playbook for activating trending attributes40% of consumers have switched products in the past 12 months due to more robust attribute information. Brands that provide comprehensive product information have an opportunity to capture market share from their competitors.6 Let’s look now at a playbook that CPG brands can follow to improve the shopping experience, ensure qualifying products appear in relevant attribute searches, and increase conversions.
Identify missed opportunities
Chances are high that your CPG brand is missing many opportunities to capture shoppers searching for products that align with their health and wellness needs. In a recent NielsenIQ Label Insight audit of the 21 retailers who offered attribute-related search filters, 80% of a consumer’s need-states and preferences were overlooked.7 If you are missing these kinds of opportunities, only a portion of your qualifying products may be claiming relevant attributes, and you may be missing trending terms altogether. Use third-party data to uncover available opportunities to claim product attributes for qualifying products.
Determine which attributes to focus on
Different audiences have different health and wellness priorities and use their own terminology to describe their needs. Using NielsenIQ Product Insight (NPI) data, you can identify which product attributes will be the most advantageous to focus on. Once you’ve optimized for the most valuable attributes in the most valuable categories, you can then begin another, more granular round of research. Consumers are becoming more educated, searching for product attributes down to specific ingredients.
Position products to highlight attributes
Product attributes can be featured in a variety of ways to attract shoppers.
• Advertising messages: Target your product marketing messages to focus on the most popular attributes a product qualifies for.
• Product packaging text and graphics: Feature trending attributes on your product packaging via text and graphics.
• Product detail web page content: Highlight the attributes a product qualifies for on the product detail page online. Product titles and descriptions should prioritize relevant popular attributes. According to our research, products that include an attribute in the first 40 characters of their title received twice as many clicks as products where the attribute appeared later in the title.
6 NielsenIQ Label Insights/Activating Attributes Quick Poll Topline Findings7 https://nielseniq.com/wp-content/uploads/sites/4/2021/06/2021_LI-Empty-Aisles-Report_NIQ.pdf
17 Copyright 2021 Nielsen Consumer LLC. All rights reserved.
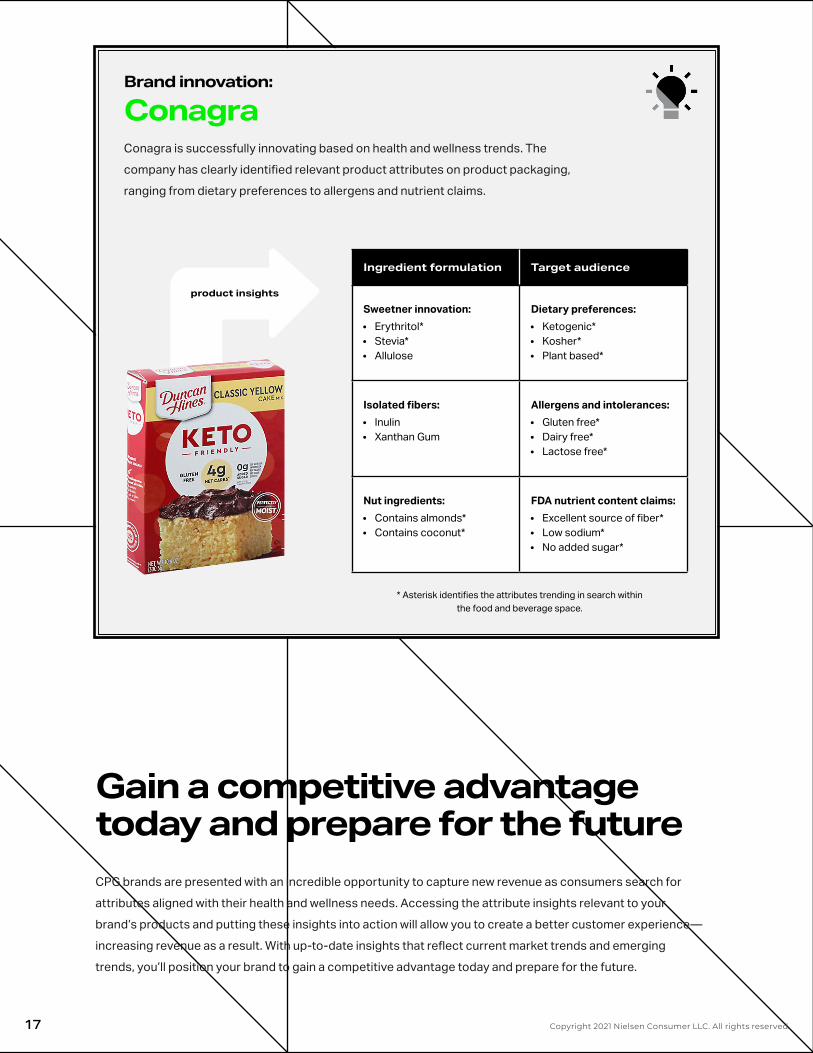
Brand innovation:
ConagraConagra is successfully innovating based on health and wellness trends. The company has clearly identified relevant product attributes on product packaging, ranging from dietary preferences to allergens and nutrient claims.
Gain a competitive advantage today and prepare for the futureCPG brands are presented with an incredible opportunity to capture new revenue as consumers search for attributes aligned with their health and wellness needs. Accessing the attribute insights relevant to your brand’s products and putting these insights into action will allow you to create a better customer experience—increasing revenue as a result. With up-to-date insights that reflect current market trends and emerging trends, you’ll position your brand to gain a competitive advantage today and prepare for the future.
Ingredient formulation Target audience
Sweetner innovation:• Erythritol*• Stevia*• Allulose
Dietary preferences:• Ketogenic*• Kosher*• Plant based*
Isolated fibers:• Inulin• Xanthan Gum
Allergens and intolerances:• Gluten free*• Dairy free*• Lactose free*
Nut ingredients:• Contains almonds*• Contains coconut*
FDA nutrient content claims:• Excellent source of fiber*• Low sodium*• No added sugar*
product insights
* Asterisk identifies the attributes trending in search within the food and beverage space.
18 Copyright 2021 Nielsen Consumer LLC. All rights reserved.
How NielsenIQ Total Wellness can helpNielsenIQ Total Wellness solutions are designed to help CPG brands and retailers boost revenue. Clients can tap into the most robust and comprehensive product attribute data available in the wellness category in tandem with NielsenIQ’s global market measurement data to:
• Deliver data-driven insights: Gain actionable insights like the ones revealed in this report. Leveraging machine learning, NielsenIQ Label Insight technology covers 99% of consumer queries and provides 24,000 attributes per product.
• Size the market opportunity: Which emerging trends are winning in your category? Who are your competitors in wellness? Take analytics-driven snapshots of your marketplace to inform better decisions.
• Understand consumer intent: What are shoppers searching for? What specific attributes are most important for your brand? See why consumers are choosing to buy one brand over another and define actionable search content to optimize the shopping journey.
• Retail digital discovery: Tap into an API feed of every product carried and every attribute associated with the product. As monthly online grocery sales grow over $9 billion, it’s essential to have insightful attribute data, ensuring product discoverability and building consumer loyalty in an omnichannel marketplace.
• Tracking for better ad targeting and product development: Track what customers are buying to more effectively target your advertising and gain important insights for developing new products.
• Opportunity-cost analysis: Evaluate the opportunity cost of including “gray-area” attributes (such as “healthy”), so you know what your risk is compared to the reward.
• Prepare for the future: Ensure that customers will be able to find your products for any term searched in the future, including new fad diets, via algorithms that automatically identify which attributes are applicable. Deliver future growth with highly informed product enhancements aligned with emerging health and wellness trends.
Put attribute data to work for your brandRequest a curated data audit of your product portfolio to see how we can help you take advantage of missed revenue opportunities.
nielseniq.com/wellness
Request your audit
19 Copyright 2021 Nielsen Consumer LLC. All rights reserved.
Who is NielsenIQ?
NielsenIQ is the leader in providing the most complete, unbiased
view of consumer behavior, globally. Powered by a groundbreaking
consumer data platform and fueled by rich analytic capabilities,
NielsenIQ enables bold, confident decision-making for the
world’s leading consumer goods companies and retailers.
Using comprehensive data sets and measuring all transactions equally,
NielsenIQ gives clients a forward-looking view into consumer behavior
in order to optimize performance across all retail platforms. Our open
philosophy on data integration enables the most influential consumer
data sets on the planet. NielsenIQ delivers the complete truth.
NielsenIQ, an Advent International portfolio company, has operations
in nearly 100 markets, covering more than 90% of the world’s
population. For more information, visit nielseniq.com.