the sustainable freight railway: designing the freight ... · pdf file1.2.2 new and...
TRANSCRIPT

[CO–v2]
The sustainable freight railway: Designing the freight vehicle – track system for higher delivered tonnage with
improved availability at reduced cost
SUSTRAIL Grant Agreement n°: 265740 FP7 - THEME [SST.2010.5.2-2.] Project Start Date: 2011-06-01 Duration: 48 months
[DELIVERABLE 2.2]
[FUTURE LOGISTICS REQUIREMENTS]
Due date of deliverable: 29/02/2012
Actual submission date: 29/03/2012
Work Package Number: [WP 2] Dissemination Level: [CO] Status: [Draft] Leader of this deliverable: [Tilman Platz, MARLO] Prepared by: [Tilman Platz, MARLO][Roland Frindik, MARLO]
[Roberto Loiero, Universidad Politécnica de Madrid] [Juan Andrés Brunel Vázquez, Universidad Politécnica de Madrid] [Dewan Islam, Newcastle University] [John Nellthorp, University of Leeds]
Verified by: [Andrew Jablonski, Network Rail]
Dissemination Level
PU Public PP Restricted to other programme participants (including the Commission Services) RE Restricted to a group specified by the consortium (including the Commission Services) CO Confidential, only for members of the consortium (including the Commission Services)

Page 2 of 73
[Deliverable D2.2] [CO–v2]
Document History Version Date Author/s Description [v1] [2011-09-12] [Tilman Platz] [Working document to
specify the input of the partners]
[v2a] [2011-12-15] [Tilman Platz, Roberto Loiero] [First drafting on Bulgarian and UK routes, introduction to Chapter 2]
[v2b] [2012-01-17] [Tilman Platz, revision by John Nellthorp]
[Logistics trends, future freight flows in UK and Bulgaria, first review]
[v2c] [2012-01-18] [Tilman Platz, Dewan Islam, revision by Roland Frindik]
[First drafting on Spanish route, information on freight logistics based on previous EC projects]
[v2d] [2012-01-24] [Roberto Loiero, Juan Andrés Brunel Vázquez, Dewan Islam, Tilman Platz, revision by Juan de Dios Sanz Bobi, Andrew Jablonski]
[Draft on current freight flows along the Mediterranean corridor, introduction text to draft deliverable, additional facts on UK routes]
[v2e] [2012-02-20] [Tilman Platz, revision by Ulla Juntti]
[Freight operator´s perspective, additional information on the Bulgarian route]
[v2f] [2012-02-24] [Tilman Platz] [Annex, additional information on the Bulgarian route]
[v2g] [2012-02-29] [Tilman Platz, revision by Roland Frindik]
[Physical requirements on rail vehicle characteristics]
[v2h] [2012-03-06] [Roland Frindik] [Alterations on current and future freight flows, revision]
[v2i] [2012-03-07] [John Nellthorp, Tilman Platz] [EU and national freight market trends, workshop outcome, editorial work]
[Draft Deliverable D2.2-V1]
[2012-03-08] [John Nellthorp, Tilman Platz] [Conclusions, editorial changes]
[Draft Deliverable D2.2-V2]
[2012-03-29] [John Nellthorp, Tilman Platz] [Changes based upon review comments, editorial changes, minor alterations]
Disclaimer
The information in this document is provided as is and no guarantee or warranty is given that the information is fit for any particular purpose. The user thereof uses the information at its sole risk and liability.
The document reflects only the author’s views and the Community is not liable for any use that may be made of the information contained therein.

Page 3 of 73
[Deliverable D2.2] [CO–v2]
Table of contents
1. INTRODUCTION ............................................................................................................................. 6
1.1 OBJECTIVE .................................................................................................................................................... 6 1.2 BACKGROUND ............................................................................................................................................... 6
1.2.1 European Transport Policy .................................................................................................................. 6 1.2.2 New and sustainable design of the vehicle-track system ...................................................................... 7
1.3 METHODOLOGY ............................................................................................................................................ 7 1.4 STRUCTURE OF THE DELIVERABLE ................................................................................................................ 8
2. EUROPEAN FREIGHT MARKET DEVELOPMENT AND CHARACTERISTICS ............... 9
2.1 EU AND NATIONAL FREIGHT MARKET TRENDS .............................................................................................. 9 2.2 VALUE OF FREIGHT ..................................................................................................................................... 10 2.3 GENERAL LOGISTICS TRENDS ...................................................................................................................... 11 2.4 FUTURE MARKET OPPORTUNITIES ................................................................................................................ 13
2.4.1 Hinterland transport of maritime containers ...................................................................................... 13 2.4.2 Continental intermodal freight ........................................................................................................... 14 2.4.3 Automotive .......................................................................................................................................... 14 2.4.4 Urban construction materials ............................................................................................................. 15 2.4.5 Biomass .............................................................................................................................................. 15 2.4.6 Recyclates ........................................................................................................................................... 15 2.4.7 Rail freight carried on high speed rail lines ....................................................................................... 15 2.4.8 Piggyback freight services .................................................................................................................. 16
2.5 RAIL FREIGHT FORECASTS ........................................................................................................................... 16 2.5.1 EU27 ................................................................................................................................................... 16 2.5.2 OECD countries and global forecasts ................................................................................................ 18
2.6 EUROPEAN RESEARCH CONTEXT ON RAIL FREIGHT LOGISTICS ..................................................................... 18
3. PHYSICAL REQUIREMENTS .................................................................................................... 27
3.1 REQUIREMENTS OF CURRENT FREIGHT FLOWS ............................................................................................. 27 3.1.1 Route 1 – Bulgaria .............................................................................................................................. 27 3.1.2 Route 2 – Spain ................................................................................................................................... 35 3.1.3 Route 3 – United Kingdom ................................................................................................................. 43
3.2 REQUIREMENTS FROM THE FREIGHT OPERATOR PERSPECTIVE ..................................................................... 48 3.3 SYNTHESIS: REQUIREMENTS OF CURRENT AND FUTURE FREIGHT FLOWS .................................................... 49
3.3.1 Route 1 – Bulgaria .............................................................................................................................. 50 3.3.2 Route 2 – Spain ................................................................................................................................... 51 3.3.3 Route 3 – United Kingdom ................................................................................................................. 53
4. CONCLUSIONS AND NEXT STEPS ........................................................................................... 58
4.1 IMPLICATIONS FOR FUTURE RAIL VEHICLE AND TRACK REQUIREMENTS ...................................................... 58 4.2 MARKET TRENDS AND OPPORTUNITIES TO BE SUPPORTED ........................................................................... 61 4.3 RELEVANT INPUT FOR SUBSEQUENT SUSTRAIL TASKS AND WP5 ............................................................. 63
GLOSSARY ......................................................................................................................................... 64
REFERENCES .................................................................................................................................... 66
APPENDIX A – QUESTIONNAIRE ................................................................................................ 70
APPENDIX B – WORKSHOP ATTENDANCE .............................................................................. 72
APPENDIX C – WORKSHOP AGENDA ........................................................................................ 73

Page 4 of 73
[Deliverable D2.2] [CO–v2]
List of Figures
FIGURE 2.1: EU AND NATIONAL FREIGHT FLOWS SINCE 1990 (DATA SOURCES: EUROPEAN COMMISSION, 2010,
SECTION 3.2.5) ............................................................................................................................................... 9 FIGURE 2.2: RECENT EVOLUTION OF THE VALUE OF FREIGHT (TRANSVISIONS, 2009) .......................................... 10 FIGURE 2.3: EU27 FREIGHT FORECASTS 2005-2050, TRANSVISIONS SCENARIOS (PETERSEN, 2009).................... 17 FIGURE 2.4: EU27 FREIGHT FORECASTS BY GEOGRAPHICAL ORGIN-DESTINATION, 2005-2050, BASELINE SCENARIO
(TRANSVISIONS, 2009) ............................................................................................................................... 17 FIGURE 3.1: MASS TRANSPORTED BY RAIL IN BULGARIA ....................................................................................... 28 FIGURE 3.2: RAIL FREIGHT TRANSPORT PERFORMANCE IN BULGARIA (BDZ) ........................................................ 28 FIGURE 3.3: GROSS HAULED TONNE-KILOMETRES IN BULGARIA (BDZ) ................................................................ 28 FIGURE 3.4: AVERAGE TRANSPORT DISTANCE (KM): BULGARIA (BDZ)................................................................. 29 FIGURE 3.5: MOVEMENT OF FREIGHT TRAINS IN BULGARIA (BDZ) ....................................................................... 29 FIGURE 3.6: INTERMODAL TRANSIT TRANSPORT IN BULGARIA (TEU) (EUROSTAT, 2011) ..................................... 33 FIGURE 3.7: MODAL SHARE OF RAILWAY BY YEAR (MINISTERIO DEL FOMENTO, 2010) ........................................ 36 FIGURE 3.8: TOTAL FREIGHT TRANSPORTATION (MINISTERIO DEL FOMENTO, 2010) ............................................. 37 FIGURE 3.9: MODAL SPLIT OF INLAND FREIGHT TRANSPORT IN SPAIN, 2008. (MT X KM) (MINISTERIO DEL
FOMENTO, 2010) .......................................................................................................................................... 37 FIGURE 3.10: RAIL FREIGHT TRANSPORT PERFORMANCE OF RENFE (MILL. TON-KM) (MINISTERIO DEL FOMENTO,
2010) ............................................................................................................................................................ 38 FIGURE 3.11: UK RAIL FREIGHT TRANSPORT PERFORMANCE (WORONIUK ET AL., 2011, P. 16, BASED ON DATA
FROM ORR NATIONAL RAIL TRENDS YEARBOOK 2010-11) ........................................................................ 44 FIGURE 3.12: UK INTERMODAL RAIL FREIGHT TRANSPORT PERFORMANCE (WORONIUK ET AL., 2011, P. 17, BASED
ON DATA FROM ORR NATIONAL RAIL TRENDS YEARBOOK 2010-11) ......................................................... 45 FIGURE 3.13: LINE SPEED VERSUS FREIGHT TRAIN SPEED LIMITS (SOURCE: OWN ANALYSIS OF NETWORK RAIL
DATA) ........................................................................................................................................................... 47 FIGURE 3.14: GOODS STRUCTURE EFFECT IN BULGARIAN RAIL FREIGHT (ONLY BDZ) .......................................... 50 FIGURE 3.15: PREDICTION FOR FREIGHT RAILWAY TRANSPORTATION IN SPAIN (MINISTERIO DEL FOMENTO, 2010)
..................................................................................................................................................................... 52 FIGURE 3.16: GOODS STRUCTURE IN UK RAIL FREIGHT, BASED UPON TRANSPORT PERFORMANCE (SOURCE: OFFICE
OF RAIL REGULATION ORR) ........................................................................................................................ 54 FIGURE 3.17: W10 CLEARANCE ROUTES (NR) ...................................................................................................... 55

Page 5 of 73
[Deliverable D2.2] [CO–v2]
List of Tables
TABLE 2.1: VALUE OF RAIL FREIGHT BY COMMODITY (SOURCES: NETWORK RAIL/RAIL FREIGHT OPERATIONS’
ASSOCIATION, 2010) .................................................................................................................................... 11 TABLE 2.2: MOTOR VEHICLE PRODUCTION IN EU COUNTRIES, 2010 ...................................................................... 14 TABLE 2.3: EUROPEAN GDP FORECAST ASSUMPTIONS (SESSA, 2009) ................................................................... 16 TABLE 2.4: EU27 RAIL FREIGHT FORECASTS, 2005&2050 MARKET SHARE (TRANSVISIONS, 2009) ..................... 18 TABLE 2.5: MOST IMPORTANT COUNTRIES/REGIONS WHERE TRANSPORT OF SELECTED GOODS TAKES PLACE (BASED
ON TRANSPORTED TONNAGE BY ROAD IN 2009) ........................................................................................... 19 TABLE 2.6: SHARE OF DISTANCE CLASSES (IN KM) PER TYPE OF LDHV GOODS (BASED ON ESTIMATED TONNAGE
TRANSPORTED BY ROAD IN 2009) ................................................................................................................. 20 TABLE 2.7: GAPS IN CO-MODALITY, VEHICLES AND LOGISTICS .............................................................................. 25 TABLE 3.1: RAIL FREIGHT MARKET IN BULGARIA [CARRIED TONNES × 100,000] ................................................. 30 TABLE 3.2: STRUCTURE OF FREIGHT WAGONS IN BULGARIA IN 2009 ..................................................................... 30 TABLE 3.3: ESTIMATED AVERAGE DATA (WORONIUK ET AL., 2011, PP. 35-49) ..................................................... 33 TABLE 3.4: BULGARIAN ROUTE SECTION CHARACTERISTICS (ERLINGER, 2012) .................................................... 35 TABLE 3.5: TARRAGONA-VANDELLÓS SECTION CHARACTERISTICS. SOURCES (INECO-ADIF, 2011)(ADIF, 2011) 40 TABLE 3.6: VANDELLÓS-CASTELLÓN SECTION CHARACTERISTICS. SOURCES (INECO-ADIF, 2011)(ADIF, 2011) 40 TABLE 3.7: CASTELLÓN-VALENCIA SECTION CHARACTERISTICS. SOURCES (INECO-ADIF, 2011)(ADIF, 2011) ... 41 TABLE 3.8: TARRAGONA – VALENCIA FREIGHT TRAINS PER DAY (WORONIUK ET AL., 2011) ................................ 42 TABLE 3.9: GOODS TRANSPORTED BY TYPE. SOURCE (INECO-ADIF, 2011) ........................................................... 42 TABLE 3.10: GOODS TRANSPORTED BY WAGON. SOURCE (INECO-ADIF, 2011) .................................................... 43 TABLE 3.11: MAIN TYPES OF INTERMODAL PLATFORM WAGONS USED ON THE BRITISH NETWORK (MDS
TRANSMODAL, 2007, P. 26; WAGON DESCRIPTION GE/KOCKUMS) ............................................................... 48 TABLE 3.12: RAIL FREIGHT FORECASTS BY COMMODITY, GB, 2006-30 (MDS TRANSMODAL, 2007B) .................. 57 TABLE 4.1: SYSTEM TRENDS AND OPPORTUNITIES FOR SUSTAINABLE AND COMPETITIVE RAIL FREIGHT ............... 59 TABLE 4.2: MARKET TRENDS AND OPPORTUNITIES FOR THE SUSTRAIL ROUTES ................................................. 61

Page 6 of 73
[Deliverable D2.2] [CO–v2]
1. INTRODUCTION The SUSTRAIL Deliverable D2.2 was produced by MARLO and received contributions from the following members of the consortium:
Network Rail (NR)
University of Newcastle (UNEW)
Universidad Politécnica de Madrid (UPM)
University of Leeds (UNILEEDS)
This document should be referenced as:
“Platz et al. (2012), Future Logistics Requirements – Draft Deliverable D2.2. SUSTRAIL Project (The sustainable freight railway: Designing the freight vehicle – track system for higher delivered tonnage with improved availability at reduced cost), EC FP7 3rd Call Project SST.2010.5.2.2.”
1.1 Objective
The objectives of this task can be summarised in two main points:
To define the requirements of the freight flows that are currently operating on the line;
To define the future flows that can be converted in new opportunities (for the selected route as well as for the European network in general).
1.2 Background
SUSTRAIL will be developing infrastructure and freight vehicle modifications to enable higher delivered tonnage, whether through higher axle loads or higher speed operation. During this development, it is important to be aware of the current and future logistics requirements that may have an impact.
1.2.1 European Transport Policy
The European Union (EU), composed of currently 27 countries, has evolved from a simple economic union into an organisation spanning many areas such as transport. Due to the abolition of border controls both the movements of freight and passenger are free from many restrictions that were faced before. There are some regulatory and technical restrictions, for example, in rail freight transport driver certification and acceptance by member countries, driver language, different power sources, electric versus diesel engine locomotive, etc. These problems originated from the fact that the national rail networks of the individual European countries and their services were developed to serve primarily within the national boundary. The European Commission (EC) has been part-funding for research and development projects (such as RETRACK, CREAM, REORIENT, SPECTRUM, SUSTRAIL) through its Framework programme (in particular 6 and 7) to identify these problems and then to harmonise/rectify them so that a truly Europe wide transport system can run effectively and efficiently. For example the RETRACK project was part-funded to research, develop and demonstrate a commercial rail freight service run by new entrants on the East West corridor of Rotterdam to Constanza (RETRACK, 2012). After the completion of the research and development phase, the RETRACK consortium successfully conducted its pilot rail freight operation (run by new entrants) from February 2010 to February 2012 and the service is expected to continue beyond the RETRACK funding period. Also the Commission has

Page 7 of 73
[Deliverable D2.2] [CO–v2]
established the European Railway Agency (ERA, 2012) to help create an integrated railway area by reinforcing safety and interoperability. The Agency acts as the system authority for the European Rail Traffic Management System (ERTMS) project, which has been set up to create unique signalling standards throughout Europe. The Commission also adopted many policy documents, notably the 2001 Transport White Paper: ‘European transport policy for 2010: time to decide’; the mid-term review of the White Paper 2001: the 2006 Communication : Keep Europe moving – sustainable mobility for our continent; and recently adopted the Transport White Paper in 2011: ‘Roadmap to a Single European Transport Area – Towards a competitive and resource efficient transport system’, incorporating the key reviews, daughter documents and policies in between. One of the main focuses of the White Paper 2001 (European Commission, 2001) was modal-shift from highly congested road to other environment friendly modes such as rail. The mid-term review of this white paper 2001 adopted co-modality i.e. the ‘use of different modes on their own and in combination’ (European Commission, 2006) that ‘will result in an optimal and sustainable utilisation of resources.’ In a comparative scenario the mid-term review focus was less committed to modal-shift; rather it emphasised the market approach leaving the choice to the service users and providers. But, to make the rail and waterways transport competitive, in this policy review document the commission promised to ‘investment in viable alternatives to congested road corridors ---rail corridors and intermodal nodes for rail --.’ The 2011 White paper returned to the modal-shift policy (European Commission, 2011) with a more specific target that ‘30% of road freight over 300 km should shift to other modes such as rail or waterborne transport by 2030, and more than 50% by 2050, facilitated by efficient and green freight corridors.’ The latest policy document (European Commission, 2011) emphasises research and innovation. It recognises that the ‘EU research needs to address the full cycle of research, innovation and deployment in an integrated way through focusing on the most promising technologies and bringing together all actors involved’ in transport sector.
1.2.2 New and sustainable design of the vehicle-track system
SUSTRAIL aims at contributing to the rail freight system to allow it to regain position and market (SUSTRAIL, 2011). The proposed solution is based on a combined improvement in both freight vehicle and track components in a holistic approach, aimed at achieving a higher reliability and increased performance of the rail freight system as a whole, and profitability for all the stakeholders. The SUSTRAIL integrated approach is based on innovations in rolling stock and freight vehicles (with a targeted increase in speed and axle load) combined with innovations in the track components (for higher reliability and reduced maintenance). The benefits to freight and passenger users (since mixed routes are considered) are to be quantified through the development of an appropriate business case with estimation of cost savings on a life cycle basis. In fact, a holistic approach to vehicle and track sustainability has to be taken, since improvements in track design and materials alone are not enough as demands on the rail system increase. Contributions from the different topic areas (vehicles, track, operations) will be demonstrated on real routes, offering geographic dispersion as well as differences in type, speed, and frequency of traffic.
A strong multidisciplinary consortium committed to concrete actions aligned towards a common outcome has been grouped for the achievement of the challenging objectives of this project with a balanced combination of infrastructure managers, freight operators and industry, including large and small enterprises, with support from academia.
1.3 Methodology
The first step was to agree on a set of data to be collected to determine the current and future freight flows and the infrastructure features, such as axle load, maximum train length, loading

Page 8 of 73
[Deliverable D2.2] [CO–v2]
gauge, and average/maximum speed. So an adequate summary of data types required was produced, taking into account the data which was available, and previous research carried out in the context of SustRail WP1. A related questionnaire was developed by UPM, which was used for data collection from ADIF (Appendix A). Taking the questionnaire as a guideline, for the Bulgarian and UK routes, information from secondary sources as well as from draft deliverables D1.3 and D1.5 was used. As far as the future freight flows along the Mediterranean corridor are concerned, ADIF provided the document ‘Plan Estratégico Impulso Transporte Ferroviario Mercancías’ by the Spanish ministry of Public Work (Ministerio de Fomento). NR contributed the high-level document ‘Value of Freight’. Information about the future logistics requirements on the Bulgarian route was obtained from VTU and from a review of articles published in periodicals. MARLO conducted a review of literature to gather input in the field of general logistics trends, whereas UNEW studied current and recent EU projects on rail freight logistics. These findings were discussed with the SustRail partners and additional external experts at a workshop which took place 25 January 2012 in Madrid. The workshop was chaired by UNILEEDS, who also provided additional input on the freight market, and hosted by UPM. The agenda and attendance are included at Appendix B&C. The goal of the workshop was to focus on the freight market trends and opportunities SustRail should support in the course of the project. A freight operator perspective was obtained through the participation of Spanish rail operator RENFE, whilst NR and ADIF represented infrastructure manager (IM)’s perspective. The workshop considered the implications for rail vehicles´ characteristics, and next steps for the project.
1.4 Structure of the deliverable
An overview of the market trends and opportunities identified is given first in Section 2 of the report, then Section 3 analyses in more detail the current and future requirements of the freight flows on the three SUSTRAIL case study routes. Section 4 concludes the deliverable, including the links to Task 2.5 and Work Packages 3, 4 and 5 following from this work.
Page 9 of 73
[Deliverable D2.2] [CO–v2]
2. EUROPEAN FREIGHT MARKET DEVELOPMENT AND
CHARACTERISTICS
2.1 EU and national freight market trends
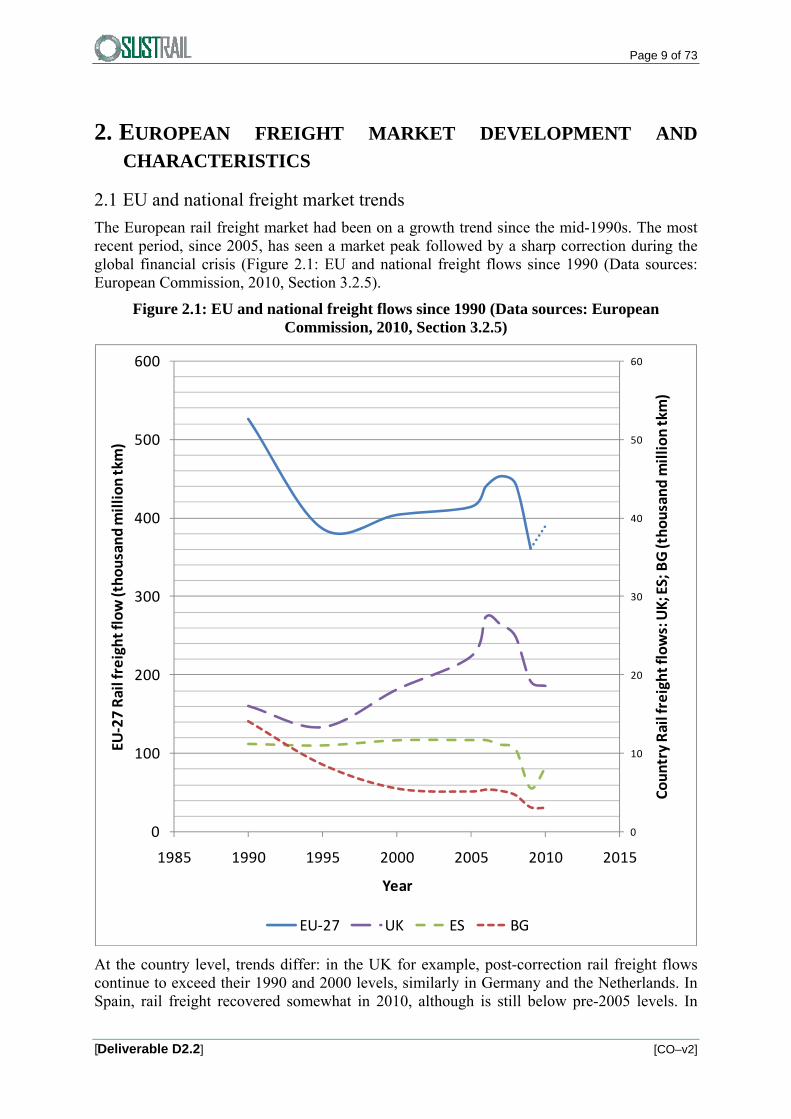
The European rail freight market had been on a growth trend since the mid-1990s. The most recent period, since 2005, has seen a market peak followed by a sharp correction during the global financial crisis (Figure 2.1: EU and national freight flows since 1990 (Data sources: European Commission, 2010, Section 3.2.5).
Figure 2.1: EU and national freight flows since 1990 (Data sources: European Commission, 2010, Section 3.2.5)
0
10
20
30
40
50
60
0
100
200
300
400
500
600
1985 1990 1995 2000 2005 2010 2015
Country Rail freight flows: UK; ES; BG (thousand million tkm
)
EU‐27 Rail freight flow (thousand million tkm
)
Year
EU‐27 UK ES BG
At the country level, trends differ: in the UK for example, post-correction rail freight flows continue to exceed their 1990 and 2000 levels, similarly in Germany and the Netherlands. In Spain, rail freight recovered somewhat in 2010, although is still below pre-2005 levels. In
Page 10 of 73
[Deliverable D2.2] [CO–v2]
Bulgaria, for example, there has been a long term declining trend, which has continued despite the overall EU peak and correction.
In the most recent year’s data, 2010, there is evidence of a resurgence in EU freight demand, by approximately 8% over 2009 levels, although the 2010 EU-27 total is not yet reported (Eurostat, 2012).
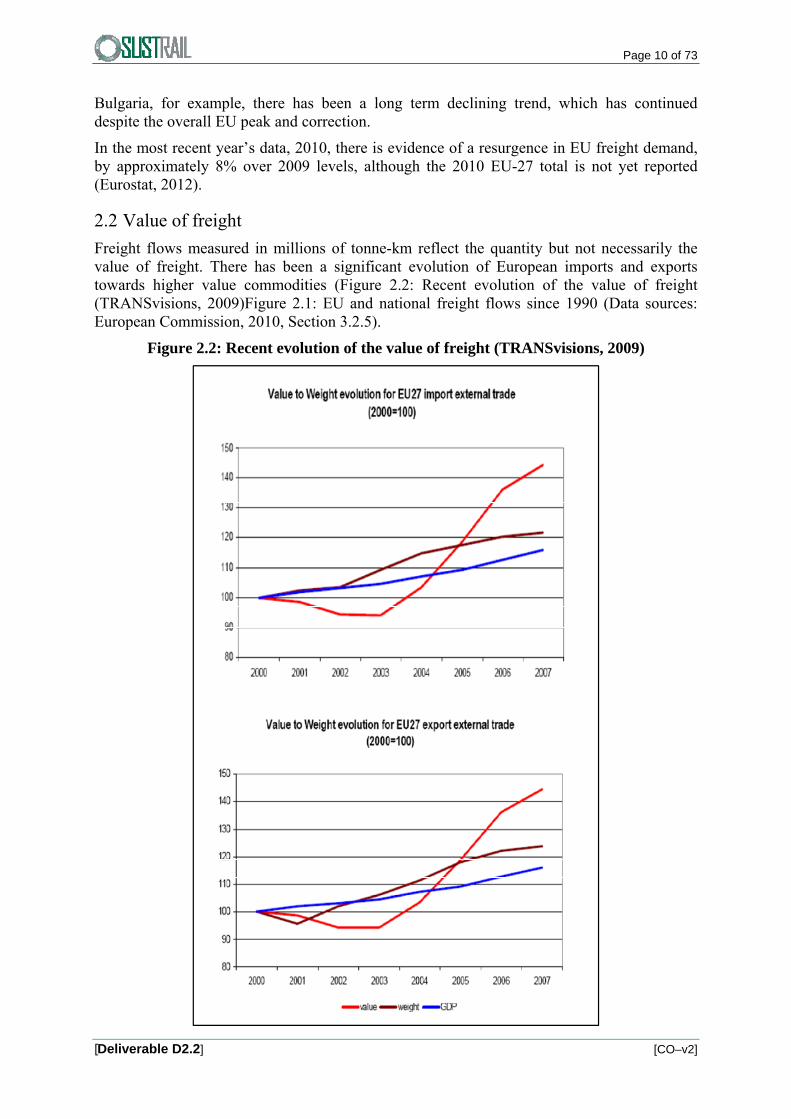
2.2 Value of freight
Freight flows measured in millions of tonne-km reflect the quantity but not necessarily the value of freight. There has been a significant evolution of European imports and exports towards higher value commodities (Figure 2.2: Recent evolution of the value of freight (TRANSvisions, 2009)Figure 2.1: EU and national freight flows since 1990 (Data sources: European Commission, 2010, Section 3.2.5).
Figure 2.2: Recent evolution of the value of freight (TRANSvisions, 2009)

Page 11 of 73
[Deliverable D2.2] [CO–v2]
Within the rail freight market, the value of freight per tonne covers a wide range across commodities: the highest value freight is in the consumer goods and ‘other’ categories; whilst metals and oil/petroleum products are lower-valued; and bulk coal and aggregates for construction are the lowest-valued freight. Table 2.1: Value of rail freight by commodity shows this, providing values of rail freight in the UK.
Table 2.1: Value of rail freight by commodity (Sources: Network Rail/Rail Freight Operations’ Association, 2010)
Commodities Value, €/tonne
Coal 55
Metals (steel) 385
Construction materials (aggregates) 22
Oil and petroleum 320
Consumer goods and other traffic 1870
There is a trend towards the higher value commodities, such that:
shipments have much lower weight per unit volume, but higher monetary value;
customers demand higher standards of service, since the higher-value commodity flows are more sensitive to service quality – in particular security in transit, in many cases reliability/on-time performance, and in some cases speed, where perishability is an issue;
volume continues to grow at a faster rate than tonnage.
Moreover, there is a global trend towards containerisation of freight, driven by the efficiencies created at transit points by a containerised system and the economies offered by hub-based systems in the freight sector. Containerisation has the advantage of allowing integrated freight transport across modes – maritime; inland waterways; rail and road – and this standardisation has further reduced the unit cost of shipping consumer and other finished/intermediate goods.
In turn, economic globalisation has increased demand for containerised freight services. Together the demand push and the cost efficiencies of containerised freight have caused it to gain share from dry & liquid bulk freight over a period of 50 years: in the maritime sector, containerised freight now exceeds liquid bulk freight by approximately ~20% (in tonnage) and exceeds dry bulk by approximately ~100% (in tonnage) (OECD, 2010, p59).
Consistent with these trends, increasing containerised share was found to be a common theme across the three case study countries, although against a backdrop of short term challenges in overall rail freight demand (see Section 3 below).
2.3 General logistics trends
Analysing general logistics trends and new logistical concepts as well as their implications for rail freight, new market opportunities for rail freight arise. There are general logistics trends that can be observed and that have an impact on the future opportunities for rail freight (Aberle, 2009, pp. 91-98):
Goods structure effect: Resulting from socio-economic development, a shift in the structure of goods being carried in the economy can be observed. The kind of goods whose volumes rise in a highly developed, service-oriented economy are individually packaged goods. These are smaller and more compact, and appear in more varieties, as they are more customised. They also have a higher value (see again section 2.2). For the transport sector, there is less bulk to be carried, and more unit load. In more detail,

Page 12 of 73
[Deliverable D2.2] [CO–v2]
as the steel industry, the primary industry, and the building industry have lost a notable part of their importance in the economy of most European countries, so the total transport volume consists of less coal, less ore, and less minerals. Instead, more goods are carried as containerised or general cargo, or as parcel shipments. Linked to this has been the ongoing process of containerisation of freight – today, even bulk is often shipped in unit loads. Also, as noted in section 2.2, more individual, more frequent, faster and more reliable deliveries are requested by customers.
Integration effect: As a consequence of e.g. European integration, the world trade regime (WTO initiatives), and the globalisation of markets, formerly separated geographical markets merge and develop, and new cohesive economic areas are created. This leads to more options with regard to sourcing. If there is increased sourcing from foreign countries, average transport distances will grow, as well as the demand for cross-border and international (meaning transit) transport services. Another important consequence is that the whole European freight transport market volume has risen, due to an increased number of transport processes (more outsourcing) and longer transport distances.
Substitution effect: This effect describes the substitution of publicly supplied transport services by individual transport means in line with the deregulation and liberalisation of the transport market and the socio-economic development. There is an individualisation of transport on the micro-logistics level. The need for an individual variety of transport vehicles (e.g. vehicle superstructures for refrigerated transport) and transport services (e.g. courier service) was in favour of the modal shift from railway and inland waterway to road transport that could be observed in Europe.
Logistics effect: Modern logistical concepts applied in the last decades by industry and commerce, e.g. just-in-time/just-in-sequence delivery, postponement, efficient replenishment, centralised inventory, or lean distribution, led to today´s time-based logistics, which focuses and demands shorter lead times and higher service reliability/ punctuality (J Eckhardt, 2010). In addition to that, application of these logistical concepts has caused shipment sizes to decrease, while frequencies of shipments have risen. Thus, the logistics effect has intensified the goods structure effect. Regarding service quality in logistics, flexibility became important, which, notably, has several dimensions: the frequency of departures, the situation of departure times, the possibility to deal with varying shipment sizes, the recoverability in case of delays, the availability of backups, or the easiness of switching in logistics chains. Another aspect of the logistics effect is that the readiness of information on shipments is gaining in importance, so that the requirements on information and communication (ICT) systems haver become higher.
Considering these trends, market opportunities for European rail freight can be found in the following segments of the transport market:
International (cross-border) or transit traffic, also across several borders e.g. to and from Asia.
Intermodal transport using maritime containers, swap bodies and semi-trailers.
Palletised loads, part-loads, groupage.
Parcel service.
Express services for urgent cargo, such as parcels containing spare parts or samples, or express consignments of the general cargo type (pallets, packages).

Page 13 of 73
[Deliverable D2.2] [CO–v2]
Cargo that needs special conditioning (e.g. refrigerated cargo, dangerous goods).
Cargo that has to be condition-monitored in its course, such as perishables, pharmaceuticals, chemicals (temperature, humidity etc.), or articles of value that have to be continuously followed to secure them from loss.
In practice, this means that to gain market share, rail freight has to address cargo currently carried by the other modes: road, air, and sea.
Aside from the changes in freight, two additional recent developments in the field of transport logistics should be taken into account when developing the sustainable freight railway:
Intelligent Transport Systems (ITS) integrate telecommunications, electronics and information technologies (telematics), which are applied to the transport system, in order to plan, design, operate, maintain and manage transport systems. Enhancement and application of ITS belongs to the goals of the European Commission in freight transport policy (European Commission, 2011). With regard to the rolling stock deployed in the railway sector, for example, ITS can support the maintenance of vehicles: by knowing the positions and by monitoring the course of wagons, information about the kilometric performance (mileage) can be collected.
Green logistics is another recent trend in the field of transport and logistics. The goal is to make logistics more sustainable and ecologically friendly. In transport logistics, this means that the negative impact of transport operations is to be reduced. As emissions caused by energy consumption for transport operation play an important part, these emissions of harmful substances and greenhouse gas should be avoided, to ”green” the transport chain. There are a lot of approaches. One aspect that seems to be relevant for railway vehicles is that less tare weight and an improved aerodynamic vehicle design support the reduction of energy consumption and, thus, the reduction of emissions.
2.4 Future market opportunities
A review of key sources1 identified a set of specific future market opportunities for consideration at this stage of the study, including:
Container hinterland transport to and from ports;
Continental intermodal freight;
Automotive (vehicles and components);
Urban construction materials (stone, cement, etc);
Biomass;
Recyclates;
Rail freight carried on high speed rail lines; and
Piggyback transport may also be a relevant opportunity.
2.4.1 Hinterland transport of maritime containers
For major ports, whilst container traffic has been increasing, rail share remains constrained by the land-side infrastructure (e.g. to less than 30% in the UK). Very specific measures being
1 including AECOM and Institute for Transport Studies, 2010; University of Westminster, 2010; Peter Brett Associates LLP, 2009.

Page 14 of 73
[Deliverable D2.2] [CO–v2]
taken to alleviate this constraint include: identifying further track paths; carrying-out works to relieve loading gauge limitations; and increasing port rail terminal capacity.
In the short-to-medium term, this offers a channel for rail to increase its share of international freight traffic, as part of an intermodal chain, and to tap into the continuing growth of international containerised freight.
2.4.2 Continental intermodal freight
Intermodal services also represent a market opportunity in continental transport, particularly for industrial shippers, major retailers and/or operated by major freight forwarding companies. As far as retailers are concerned, rail market share for these flows is low at present, however the recent experience of, for example, Tesco and Asda/WalMart in the UK (AECOM and Institute for Transport Studies, 2010; Network Rail/Rail Freight Operations’ Association, 2010), indicates that rail is a viable substitute for road freight on trunk hauls between distribution centres, as part of the retail supply chain. The consumer goods shipped on these services are relatively high in value/tonne.
Services operate similarly to maritime intermodal services, except that swapbodies are rather being employed instead of ISO containers.
2.4.3 Automotive
This market is of greatest importance to countries involved in automotive manufacture – a large group (Table 2.2: Motor vehicle production in EU countries, 2010) – but also to all countries importing vehicles and to countries participating in the supply of components. The dynamics of this market are for some shift of global market share from the EU towards the BRIC countries in particular, however the volumes produced in Europe are holding approximately constant over the last 20 years – with a dip then a resurgence since 2007 (European Automobile Manufacturers Association (ACEA), 2011, p41-2).
Table 2.2: Motor vehicle production in EU countries, 2010 (Source: Organisation Internationale des Constructeurs d’Automobiles (OICA), 2012)
Country Cars
Commercial
Vehicles Total
Position in
World Ranking
Germany 5,552,409 353,576 5,905,985 4
Spain 1,913,513 474,387 2,387,900 8
France 1,924,171 305,250 2,229,421 10
UK 1,270,444 123,019 1,393,463 15
Czech Rep. 1,069,518 6,867 1,076,385 17
Poland 785,000 84,376 869,376 18
Italy 573,169 265,231 838,400 19
Slovakia 556,941 ‐ 556,941 23
Belgium 528,996 26,306 555,302 24
Romania 323,587 27,325 350,912 26
Sweden 177,084 40,000 217,084 29
Hungary 208,571 2,890 211,461 30
Slovenia 201,039 10,301 211,340 31
Portugal 114,563 44,160 158,723 32
Austria 86,183 18,814 104,814 34
Netherlands 48,025 46,081 94,106 35
Finland 6,385 280 6,665 39

Page 15 of 73
[Deliverable D2.2] [CO–v2]
The traffic in finished vehicles usually requires specialised wagons, whilst the traffic in automotive components also offers rail freight growth potential, and could be handled using either conventional wagonload or intermodal vehicles.
2.4.4 Urban construction materials
The future growth of major cities, and the overall trend to urbanisation, will require continued large inbound flows of materials such as roadstone, aggregates, timber and cement, for which rail is relatively well placed. Urban freight terminals for transhipment from rail to road are expected to grow from their current base in this market.
2.4.5 Biomass
Whilst the rail market for transporting coal is generally considered to face long-term decline, for example in the UK, a new market in the rail transport of biomass has emerged. Substitution of coal by biomass at power stations results in a more than proportionate increase in rail traffic, because the biomass material is both less dense and burns more quickly than coal.
Wagons for biomass transport ideally need to be covered, to prevent the biomass for getting too wet, but present no special challenges for axle load given the lower density of the material.
2.4.6 Recyclates
Waste will increasingly need to be separated into different streams for environmentally-friendly disposal. This opens up possibilities for rail movement of, in particular:
Compacted paper and card;
Glass cullet;
Recyclable plastics;
Residual waste destined for incineration, or for combined heat and power plants;
Plus existing movements of scrap metals.
Urbanisation is expected to support this market, as cities increase in size and density, and create greater densities of recyclable waste.
2.4.7 Rail freight carried on high speed rail lines
A niche market for high speed rail freight currently exists in Europe. An example is TGV La Poste (France), which uses modified TGV Sud-Est trainsets to transport mail for La Poste. The top speed of the services is 270km/h.
La Poste and FedEx are further supporting a project (Euro Carex) linking a number of European airports which have large express freight operations. The project involves the construction of special rail freight facilities at Paris CDG and the other airports, and TGV trains equipped to carry standard airfreight containers. This project remains some time from completion, but is a good example of the potential to substitute rail for air in the express freight market. Kraan, 1997, studied this market and recommended development of a dedicated high speed rail shuttle service in a hub-and-spoke network pattern.
Trials in Germany with high speed operation of relatively heavily loaded cargo trains showed that these were difficult to co-ordinate with high speed passenger flows during day and with maintenance at night (as found on Hannover-Würzburg line).

Page 16 of 73
[Deliverable D2.2] [CO–v2]
2.4.8 Piggyback freight services
Finally, on a European scale, there is a demand for piggybacking of semi-trailers on rail. This is dependent on gauge restrictions, but is feasible across much of the European freight network. Specific opportunities at route level will be considered in Section 3. In addition to that, rolling motorways (carriage of rigid trucks, road trains or articulated trucks by rail) play an important part along certain routes.
2.5 Rail freight forecasts
2.5.1 EU27
Rail freight forecasts for Europe are provided by the TRANSvisions research, which builds on previous work using the ‛TRANS-TOOLS’ model (TRANSvisions, 2009). The underlying assumptions for the Baseline scenario are:
GDP growth on average at the rates shown in (Table 2.2: Motor vehicle production in EU countries, 2010) from 2004-2050, based on DG ECFIN calculations, with faster GDP growth in eastern Europe (EU10); and
oil and gas prices continuing to rise beyond 2004, although with some offsetting effects from new technology, new fuel types, reduction of fuel consumption in Europe, and better management of the supply chain. In fact out-turn fuel prices have risen substantially higher (+25% approximately) than the TRANSvisions assumptions since 2004. TRANSvisions however then assumed very rapid growth of oil prices (+50% in real terms) between 2012 and 2024 – other forecasters on the whole predict a lower growth rate going forward (DECC, 2011). By 2050 there is no overwhelming reason to believe that the TRANSvisions central fuel price assumptions will be biased, although clearly there is much uncertainty involved.
Table 2.3: European GDP forecast assumptions (Sessa, 2009)
EU25 EU15 Euro EU10
1.7 1.6 1.5 2.4
GDP Growth (average) 2004‐2050
TRANSvisions forecasts 1.2% per annum growth in Intra-EU freight from 2005-2030, and 2.9% per annum in Total freight including imports & exports (Petersen, 2009, Fig 5.15), in the Baseline scenario. Alternative policy/economy/mobility scenarios lead to substantially different forecastsTable 2.5: Most important countries/regions where transport of selected goods takes place (based on transported tonnage by road in 2009)).

Page 17 of 73
[Deliverable D2.2] [CO–v2]
Figure 2.3: EU27 freight forecasts 2005-2050, TRANSvisions scenarios (Petersen, 2009)
Figure 2.4: EU27 freight forecasts by geographical orgin-destination, 2005-2050, Baseline scenario (TRANSvisions, 2009)
Rail freight is forecast to gain substantial market share in the EU27, primarily from road freight (Table 2.4). Rail freight growth is expected to be driven most strongly by long distance transport – particularly by high growth of goods imported and exported overseas and across borders. Rail is expected to be competitive for overseas traffic moving from/to large ports and main consumption centres. Growth is expected to be strongest in the EFTA countries, the Balkans, Russia, Byelorussia, Ukraine and Turkey (TRANSvisions, 2009).

Page 18 of 73
[Deliverable D2.2] [CO–v2]
Table 2.4: EU27 rail freight forecasts, 2005&2050 market share (TRANSvisions, 2009)
%tkm 2005 %tkm 2050
%Road 47 40
%Rail 12 18
%Maritime 41 42
Although shorter-term freight forecasts would certainly require revision for the step-down in GDP during the global financial crisis, whether/how these long-term forecasts require revision – over a 45 year period – will become clearer as the European economy’s path out of the crisis emerges.
2.5.2 OECD countries and global forecasts
For context, the OECD (2010) (based on WBCSD World Business Council for Sustainable Development, 2004) predicted 3.0% per annum global growth in rail freight tonne-km from 2000-2030 and 2.7% per annum 2000-2050.
Meanwhile, for OECD countries in Europe, freight growth would be limited to 1.9% (2000-2030) / 1.4% (2000-2050), and for Eastern Europe 2.7% (2000-2030) and 2.8% (2000-2050).
The forecast for growth in cross-border rail freight traffic draws attention to those cases where interoperability issues may hinder growth if not addressed. In particular:
the use of standard track gauge (1.435m) in France, but 1.672m in Spain and 1.664m Portugal (except for the High Speed networks);
loading gauge differences; and
electrification system and voltage differences.
Given the increasing demand from rail freight customers for high levels of service quality – including speed and reliability – any technological or operational solutions to these known interoperability issues should enable faster market growth in practice (OECD, 2010).
2.6 European research context on rail freight logistics
Over recent years a number of freight and logistics studies have been completed that form part of the European Commission’s framework programmes 6 and 7. Many of which have attempted to identify the future freight market trends and requirements for rail freight services. The current subsection of this SUSTRAIL report aims to examine a number of these studies with a view to extracting future rail freight development information such as the likely types of goods transported and the types of rail freight wagon expected to transport them.
SPECTRUM
Traditionally rail freight operators transport high volumes of low value cargo such as coal and iron ores, etc (as above). Intermodal transport rail-road has been partly successful when it serves as a conveyor belt between main production centres especially for chemicals and other non-perishable goods over distance of more than 500km. Modern manufacturing techniques as well as the delivery of their products require reliable, time sensitive delivery of goods and raw materials which are increasingly of lower density and higher value. Currently this freight market is mainly captured by road transport. This presents a market opportunity for rail freight to grow, partly due to increasing congestion on roads, and also due to governmental focus on the need for the reliable and environmentally friendly transport of goods.
For example, the EC part-funded FP7 project SPECTRUM, which commenced in May 2011, aims to develop a rail freight train that provides a higher speed service for high value, low

Page 19 of 73
[Deliverable D2.2] [CO–v2]
density and time sensitive goods with the performance characteristics of a passenger train. SPECTRUM takes a longer term, radical and first principles approach to deliver a new rail freight offering that can compete with road and air in the growing sectors of logistics where rail freight has traditionally little to offer.
One of the first milestones of the SPECTRUM project was to develop a definition of low density, high value goods (LDHV). After the initial market segmentation process the following definition was derived:
Goods with a density of 230 kg/m3 or lower, including packaging (i.e. gross-weight), except live animals, transport equipment, tractors and explosives.
Goods with a density higher than 230 and lower than 300 kg/m3 and with a value of €0.50 per kg or higher (i.e. trade value, excluding taxes and not the retail value).
Perishable goods transported (even if the density is 300 kg/m3 or higher and the value is lower than €0.50/kg). Examples: dairy products, horticulture products, fresh and frozen fruits/vegetables and meat.
One of the EC objectives presented in the latest White paper (European Commission, 2011) is to shift 30% of current road freight transported over 300 km to other modes such as rail or waterborne transport by 2030 and more than 50 % by 2050.
Around 37% of the total LDHV goods transported in EU-27 and Switzerland are transported by road over a distance of 300 km or more.
The research under SPECTRUM project however, reports that rail freight transport is an attractive alternative to road for distances greater than 200km. This is supported by evidence from a rail freight transport study performed by NEA in 2011, which compared the costs for rail transportation with road haulage between Coevorden and different national and international locations. For the route Coevorden-Rotterdam (around 200km), rail transport was found to be financially attractive at distances of 0 to 90 km between the terminal and the clients (pre- and end-haulage) in the direction from origin to destination.
In the study “Towards a new strategy for policy on inland waterway transport (IWT) in the Netherlands” (Policy Research Corporation & NEA, Dutch Ministry of Transport and Public Works, 2006) it was concluded that modal shift between dry-dry locations on both sides of the chain pre- and end-haulage was only feasible at distances of 200 km or more.
Table 2.5: presents the share of selected LDHV goods by distance class. Around 37% of the total LDHV goods transported in EU-27 and Switzerland are transported by road over a distance of 300 km or more. The two tables below demonstrate the location and distance.
Table 2.5: Most important countries/regions where transport of selected goods takes place (based on transported tonnage by road in 2009)
Selected LDHV goods per NST/R category
Most important countries/regions where transport of selected goods takes place
0: Agricultural products France, Finland, Sweden, Poland and Spain
1: Foodstuffs Spain, France, Poland, UK and Germany
5: Metals (Northern) Italy, Spain and Germany (around the Ruhr area)
8: Chemicals The Netherlands, Germany, Poland and Italy
9: Other type of products UK, the Netherlands, France and Italy

Page 20 of 73
[Deliverable D2.2] [CO–v2]
Significantly, the share of LDHV goods transported over distances of 200 km or longer is about 49% as demonstrated in the table below.
Table 2.6: Share of distance classes (in km) per type of LDHV goods (based on estimated tonnage transported by road in 2009)
Selected LDHV goods per NST/R category
<50 50-100
100-150
150-200
200-300
300-400
400-500
>500 Total
0: Agricultural prod. 11% 26% 11% 7% 12% 9% 7% 17% 100%
1: Foodstuffs 15% 22% 9% 7% 12% 10% 8% 18% 100%
5: Metals 16% 21% 9% 7% 12% 10% 7% 20% 100%
8: Chemicals 30% 24% 9% 7% 10% 7% 4% 9% 100%
9: Other type of prod. 15% 21% 8% 7% 12% 10% 8% 20% 100%
Total LDHV goods 15% 21% 9% 7% 12% 10% 8% 19% 100%
ERRAC Roadmap
In May 2011 the European Rail Research Advisory Council (ERRAC) produced what was defined as a Freight Roadmap for “encouraging modal shift (long distance) and decongesting transport corridors” (ERRAC, 2011). The analysis is driven by the ambition of major customers to use the railways to transport freight. The study very much focussed on obtaining the views of key freight and logistics stakeholders through a series of consultation in the form of workshops and interviews with operators, shippers and infrastructure managers. In the view of these stakeholders it is price, reliability and extension of service that are the main drivers before the volume adaptation follow up and down capability.
Reliability and competitiveness in the complex environment of freight and logistics cannot be improved without addressing some or preferably all of the technical parameters influencing this efficiency before addressing the commercial and finally the behavioural ones.
Modern rail transportation is often reduced to a small part of the logistics chain. It is therefore of vital importance that European freight mobility systems and logistics chains are developed in a co-modal transport perspective where increased competitiveness is achieved through appropriate use of modes to ensure the strength of each is capitalised upon. To this end, any supply chain is only as strong as its weakest element.
It has already been noted that traditionally rail freight has been widely used to transport bulk cargo and low value cargo. Traffic volumes transporting these types of goods and materials are decreasing. New types of traffic are growing, namely, time sensitive logistics that require flexibility and reliability along long complex supply chains and with increasing amounts of visibility – that is the ability to track and trace transported goods. These developments are penalising the rail freight mode which was favoured by former large heavy bulk traffics. In order to capture more cargo volumes rail freight must offer significantly greater quality of service. Quality can be defined as properties of punctuality, safety and flexibility – amongst others.
Rail freight has been absent in a number of market segments for many years. Increased traffic congestion on roads and the increasing need for reliable and environmentally friendly modes of transport should help in providing the necessary incentive for modal shift. However, barriers remain and rail freight must improve its overall performance in the areas of solutions

Page 21 of 73
[Deliverable D2.2] [CO–v2]
for smaller consignments, for reliable transit times, for specialized transport segments, for automatic tracking and tracing, for flexibility, for price competitiveness, for service quality and for emergency response in case of incidents.
Currently Europe still relies heavily on road based logistics distribution. Over 70% of land transport inside the EU is captured by road. The congestion cost is often underestimated but is stated as around 0.5% -1% of EU GDP. Freight transport by road is still expected to be the dominant mode given its already highly developed infrastructure that interlaces urban centres, manufacturing districts and has currently unmatched levels of flexibility. Rail needs to develop as an integrated partner in supply chains, bringing its strengths alongside maritime, road, air and inland waterways; competing and co-operating where appropriate, often at the same time.
The Freight Roadmap (ERRAC, 2011) for “encouraging modal shift (long distance) and decongesting transport corridors” identified the following customer requirements in a transport value chain:
Price competitiveness for the rendered service products on sale
Price stability
Seamless international services
Frequencies in point-to-point services at scheduled times
Performance consistency
Reliable delivery times
Easy transport accessibility both physical and commercial
Wagons and intermodal units’ availability with a design suitable to fit the customers’ needs
Technology tools for cargo integrity and location provision, including automatic tracking and tracing
Emergency response in case of incidents
Direct ITC connectivity
Ability to handle less than Train Load consignments and introduction of SLA (service level agreements)
Private sidings and support facilities
Co-operative approach
Harmonization of the transport documents processed by IT systems and in real time
A faster response to queries
Efficient connection to freight centres in or near airports
More generally, ERRAC (2011) reports that over the course of the last 20 years the basic business philosophy has moved from “push” to “pull”. The “pull” philosophy implies that the production planning is driven by the demand side; there is customer-oriented production; and goods are made-to-order (instead of made-to-stock). This of course must be reflected in the customers’ supply chain. This is characterised by new business processes such as:

Page 22 of 73
[Deliverable D2.2] [CO–v2]
Rail freight competitiveness and price stability
Shorter cycle times
Real time information flows and emergencies response in case of incidents as well as faster response to customers’ needs
Transport planning
More frequent and reliable deliveries
More flexible delivery patterns reflecting short-term forecasting and order variations
Partnership relations with fewer suppliers and logistic outsourcing to third party logistics
Performance consistency over time
Reverse logistics for packaging, recycling, returned goods and waste in general
Harmonization of the transport documents
The European interoperability legislation and the European Railway Agency (ERA) have made big progress towards creating a single European railway area. There are still many technical, operational and administrative barriers between the EU member states and between EU and the Asian land mass that need to be removed. Coordination across member state networks of path allocations; cross border acceptance of train driving licences provide problems for rail but not for road.
The drive to harmonise the technical systems must be done at an acceptable economic level and in the end lead to lower costs and not vice versa. An open ICT standard for rail would facilitate the development of collaborative approaches where shippers can inform each other of available spare capacity that can be sold.
RETRACK
RETRACK studies (Uniresearch, 2012) suggest that modal shift from road to rail was, is and will remain a key EC policy objective. The RETRACK project aimed to: conduct research, develop, commission and implement pan-European privately operated rail freight services between Rotterdam, The Netherlands and Constanza, Romania, implying at least four border crossings if the entire route was used. The RETRACK rail freight (pilot) service kicked off commercial service in February 2010 and will continue until February 2012 (RETRACK, 2012). It offers single wagon load services covering major port and industrial complexes in The Netherlands (together with options into Belgium and North German ports), major industrial areas in Germany and Austria and links to major cities in Hungary and Romania with new port potential in the latter as a source of traffic. The inherent intention of the project was to demonstrate that private new entrant rail operators would be able to collaborate and co-operate in the development of new services that would be competitive, reliable and attractive compared with the existing rail freight services provided by incumbents or new entrants on national railways.
The model of operation adopted with two core hubs for the assembly and dispersal of traffic (Köln & Györ) and the operation on demand of satellite operations has proven to be a flexible option to demonstrate the potential capabilities of rail freight operation. The majority of rolling stock used in the operation is provided by the shipper either as owned equipment or leased items.
Page 23 of 73
[Deliverable D2.2] [CO–v2]
Of more serious strategic concern was the mass withdrawal of grain wagons that were found to be wholly defective. The RETRACK rail freight service suffered some problems at an early phase of the pilot that are summarised below:
Multiple power supply systems: During the research phase of the project we identified that the RETRACK corridor has multiple power supply systems. This implied a need to switch locomotives at certain borders with the likelihood of delay. The availability of multi-voltage locomotives has mitigated this problem for RETRACK service.
Driver issues: There were and still are driver related issues including language, inter-operability and cross border driver skill and competence recognition.
Wagon issues: There have been issues with some individual wagon failures that have exposed problems of responsibility for technical defects when and where located and for their redemption. The shipper-owned or leased equipment has to be compliant with industry inspections in transit. There have been concerns that some of the wagon inspection regimes are not consistent.
Discrimination from the incumbent: There are concerns over the preponderant power of the rail incumbent in some member states where the acquisition of private rail operators is in effect the reverse of the liberalization proposed by the EU. This trend in effect reduces incentives to compete on price and service levels and reduces competition.
The inconsistency of the wagon inspection regime at border crossings is a key issue and thus presents a real block to competitive, fast and effective transits. Lengthy inspection and compliance processes and transcription of data need to be reduced to one.
Securing train paths have not been a significant problem and most bids have normally been accepted.
Infrastructure upgrades: There have been problems of large scale infrastructure upgrades in Germany and these have been a limitation at times.
Train length has normally been less than the 750m maximum allowed on the main operational axis. Very heavy trains have been routinely operated between Köln & Rotterdam as required without major difficulties.
Grain wagon issues: The core business of grain shipments from Hungary to the Benelux area had provided the basis for the start up of the RETRACK pilot operations and underpinned wider commercial activities to secure other traffic on the main route and developing satellites. The grain traffic was being carried in older wagons that had not been used intensively on long haul applications. These were recognised as contributing to train delays. The key issue centred on the inadequate lubrication of the axle boxes leading to the complete withdrawal of the wagons used for this traffic until an adequate remedy was in place. Other problems that have beset this traffic have centred on problems with the locking of the doors on the wagons.
The following key commercial and operational partners are involved in the RETRACK pilot rail freight operations:
TransPetrol GmbH (TransPetrol) (from Germany)
LTE (from Austria); and
CER (from Hungary).
TransPetrol now leads the commercial and operational planning of the RETRACK train services including shipper contacts and pricing. LTE (Austria) provides traction (dedicated

Page 24 of 73
[Deliverable D2.2] [CO–v2]
locomotive) that is capable of operating across international (pan-European) borders and this eliminates one of the main stumbling blocks (multiple power supply systems) to rail freight’s generic competitiveness. Shunting services and local traction services are provided by the incumbent rail operator CER (Hungary). Specific traffic destined to Austrian receivers is also moved by the national incumbent to/from the RETRACK train when in transit. The concentration and distribution of wagons to/from Köln is now performed by a railway undertaking owned by TransPetrol/VTG and provides a greater measure of flexibility and control of this activity than that formerly provided by contractors.
TransPetrol have established a lead position within the project consortium in particular for the pilot train operation. There is very limited commercial involvement from LTE & CER. CER acts as a traditional railway with the principal focus on operational matters within Hungary. TransPetrol had and maintains a strategic position to become a major rail freight player in the emergent liberalised market beyond the traditional role of the parent company as a wagon supplier. TransPetrol is completely involved in the operational control and management of the RETRACK train including the build up of wagon load offerings and pricing, in transit monitoring, disruption and delay response. TransPetrol is also involved in the arrangement of personnel (train crews) and shunting. It is largely dealing with known operational and technical issues on train length, weight, hazardous cargo rules and cargo priorities. Cargo pricing is fully within TransPetrol’s remit.
From the operation of the pilot service it can be said that full operational and commercial integration has been achieved through the initiative of TransPetrol as the key partner. This has included equipment sourcing, pricing enquiry responses and operational intervention and planning. The relatively small TransPetrol operations and commercial activity has allowed rapid decision taking and intervention as required to sustain and plan train services. Access to the DB infrastructure information system on train location, schedule performance and delays has proved to be of value.
Commercially the RETRACK service has found favour on the basis of transit speed, service frequency, reliability and non-predatory pricing. Wagon provision for shippers is feasible but some shippers provide their own wagons for cargo movement.
A survey among the RETRACK service users reveals that some modal shift from road has been achieved.
The flexible response to traffic generation in the build up phase of RETRACK pilot has been characterised by:
The use of the traction for single wagons to maintain the round trip capability of the service;
A willingness to refuse, defer or cancel services if required;
A preparedness to use other existing train services if needed to maintain service integrity rather than lose the traffic or service round trip capability.
Use of the EU status of the train as a measure of protection against immediate predation by the incumbent train service providers.
Decision to maintain a minimal service profile until the grain wagon situation was resolved.
Maintenance of services despite issues such as weather delays, varying responses to national and public holidays along the line of route.
Flexible responses to varying crew availability together with traction and rolling stock.

Page 25 of 73
[Deliverable D2.2] [CO–v2]
Train monitoring in real time with the identification of problems and the ability to intervene to resolve disruption.
One partner (TransPetrol) is recognised as a railway undertaking.
Development of a range of shunting and feeder options.
The retro-fitting of energy consumption meters onto the assigned locomotive for the pilot has allowed greater precision in the monitoring of power used to move the train.
A number of lessons have been learned that should be considered in the SUSTRAIL project.
Complex operational and commercial environment surrounding rail can deter new market entrants without support to ensure a move to break even point
Need for collaboration, identification of key roles, cost and revenue share model
Start up delayed by partner differences
Possible to develop beyond Retrack Mk 1 with existing partners or to re-cycle the model on alternative routes possibly involving other partners
Valuable experience and expertise gained to use as a model for other new rail services involving private operators on long haul international services
Rail Freight Wagons
In May 2011 the European Rail Research Advisory Board (ERRAC) produced what was defined as a Freight Roadmap for “encouraging modal shift (long distance) and decongesting transport corridors.” This identified a number of gaps in current co-modality, vehicles and logistics. These are summarised in the Table 2.7: Gaps in co-modality, vehicles and logistics below.
Table 2.7: Gaps in co-modality, vehicles and logistics
Co-modality, vehicle and logistics gaps
Milestone 1: 2015 Milestone 2: 2020 Milestone 3: 2030
General Wagon issues
Lightweight rail cars for increased payload and energy efficiency
Modern wagon concepts with low noise, track friendly bogies
Minimum 15% of all goods transported using high efficiency wagons Improving freight wagon
designs for better usage of freight infrastructure conditions – at least along selected corridors
Implementing high efficiency trains along selected corridors
Preventative axle bearing condition monitoring, improved braking and common data exchange
Light weight rail car concepts will make it possible to increase the payload without increasing the axle loads. This will raise the capacity of the railway system to carry more goods and make it more profitable. It will also save energy.

Page 26 of 73
[Deliverable D2.2] [CO–v2]
Modern wagon concepts will offer low noise and track friendly bogies. Noise is a key problem for railways which must be mitigated if citizens are to accept more trains on existing and new lines. A lot of work has been done on that subject e.g. noise reducing rail dampers, tests with composite brake blocks and innovative noise screens. Transfer of noise reduction and compensation methods from other industries (i.e. car and truck engines) should be studied and considered. A specific problem to tackle in this context is the noise generated by wagons crossing steel bridges in cities.
New bogies and brakes should have low noise emission properties as a general requirement. They should also be less damaging to the track; track maintenance raises costs and disrupts traffic. Ways to minimize the track maintenance by deployment of better wagons must be studied.
Also, the whole complex of noise regulation, noise measurement in real time, noise initiated costs and its socio-economic dimension needs to be tackled in a holistic way.
Improving freight wagon designs is a need created by the need for logistics efficiency, and public acceptance. All new designs within an existing logistics network will start with test installations, demonstrators, pilots, regional deployments and then: deployments in a wider field of applications. New freight wagons with a perfect match of logistics requirements could become key for conquering new markets on first operations at specific corridors and applications.
Preventive monitoring of axle bearing condition aims at handling the problem with axle box defects which is a source of wheel flats, track damages and disruption of services. It is necessary to mitigate these problems before they happen i.e. with preventive service of the wagon. In that context, all wearing and material fatigue relevant parameters should be monitored.
In terms of the train in its entirety, attention should be given to more flexible freight train configurations – something that is currently being explored as part of the FP7 SPECTRUM project. Trains that are simultaneously able to carry containers, swap bodies and conventional cargo increase the flexibility of the use of rail freight and assist in achieving better utilisation of the available network capacity. This operation model suits mainly trains with container wagons for carrying ― optimisation load being served by small and fast (preferable remotely operated) container loading stations.
Conclusion
There currently exists an opportunity for rail freight to increase its market share substantially. Modern manufacturing techniques as well as the delivery of their products require reliable, time sensitive delivery of goods and raw materials which are increasingly of lower density and higher value. Rapidly increasing road congestion should encourage modal shift to rail but only if rail is able to provide a service that meets customer requirements. This is crucial if the targets of the latest EC white paper (European Commission, 2011) on transport - such as shifting 30% of current road freight transported over 300 km to other modes such as rail or waterborne transport by 2030 and more than 50 % by 2050 - are to be met. These new types of time sensitive freight cargo and logistics require flexibility and reliability along long complex supply chains and with increasing amounts of visibility. Rail freight should improve its overall performance in the areas of solutions for smaller consignments; for reliable transit times; for specialized transport segments; for automatic tracking and tracing; for flexibility; for price competitiveness; for service quality; and for emergency response in case of incidents. To this end trains that are able to simultaneously carry containers, swap bodies and conventional cargo can help to answer the customer requirements for flexibility and assist in achieving better utilisation of the network capacity.

Page 27 of 73
[Deliverable D2.2] [CO–v2]
3. PHYSICAL REQUIREMENTS The Description of Work (task 2.2.1) requires that, for each route defined in WP1, the physical requirements for mass, speed, axle load, train length and traction must be defined. Data should be collected for the freight flow types operating on the selected route today and for new flows as rail takes advantage of new market opportunities in the future.
Towards this aim, NR and ADIF supported respectively by UNEW, UPM, as well as VTU, provided input in terms of specific route information on current and future freight flows.
The most important features of the analysis are:
Goods transport.
Mass of train.
Speed.
Axle load.
Train Length.
Traction requirements.
Starting from the data gathered, a study will be performed in order to show the actual situation in the routes, and trying to define a trend for the next years.
3.1 Requirements of current freight flows
Some of the data regarding the actual situation have been collected in SUSTRAIL Task 1.5: Operation & Logistics, and are considered to be useful. Thus, these data were taken into account when carrying out the research in this task. The rest of the data has been taken from the Study for the Mediterranean Railway Corridor (Ineco-ADIF, 2011), a high-level document on the future of rail freight from a UK perspective (Network Rail/Rail Freight Operations’ Association, 2010), UIC and Eurostat statistics, as well as several additional sources.
In order to define a trend, data about the last years are needed. Due to the recent economic downturn, actual data does not totally represent a good reference for the study. For this reason the infrastructure managers provide data based on the last years (as a good data sample, a time interval of at least 5 years was be considered to be appropriate).
3.1.1 Route 1 – Bulgaria
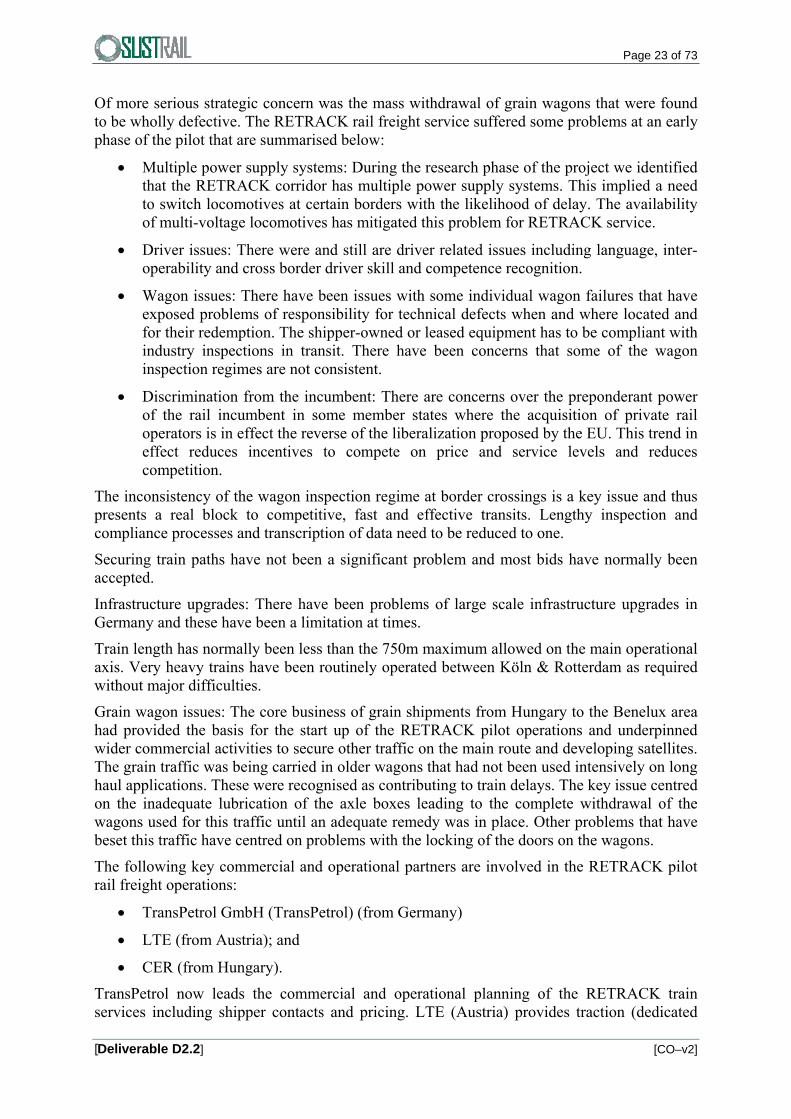
Figure 3.1: Mass transported by rail in Bulgaria indicates trends in freight traffic along the line from 2005-2010 (Woroniuk et al., 2011, p. 13). In addition to the negative impact of the 2008/2009 financial crisis, rail freight substantially decreased because of the closure of a metallurgic plant (see below).

Page 28 of 73
[Deliverable D2.2] [CO–v2]
Figure 3.1: Mass transported by rail in Bulgaria
20298 21183 2017517590
10633 10778
0
5000
10000
15000
20000
25000
2005 2006 2007 2008 2009 2010
ThousandTonnes
The figure demonstrates a steady decrease, with the steepest decrease between 2008 and 2009 with a loss of approximately 7 million tonnes in one year.
Figure 3.2: Rail freight transport performance in Bulgaria (BDZ) indicates a pattern in line with tonnes carried (Woroniuk et al., 2011, p. 13).
Figure 3.2: Rail freight transport performance in Bulgaria (BDZ)
5163 52254710
4031
2277 2352
0
1000
2000
3000
4000
5000
6000
2005 2006 2007 2008 2009 2010
MillionTonne‐Kilometres
Note: There are also competing freight operators operating in Bulgaria, such as BRC and Bulmarket, but they are focused on other routes, so the BDZ data on transport performance appears to be sufficient for the purpose of this study.
The gross hauled tonne-kilometres of the operator BDZ show the same development, as can be seen in Figure 3.3 (UIC International Union of Railways, 2011).
Figure 3.3: Gross hauled tonne-kilometres in Bulgaria (BDZ)
10273 104439291
8166
4900 4979
0
2000
4000
6000
8000
10000
12000
2005 2006 2007 2008 2009 2010
MillionTonne‐Kilometres
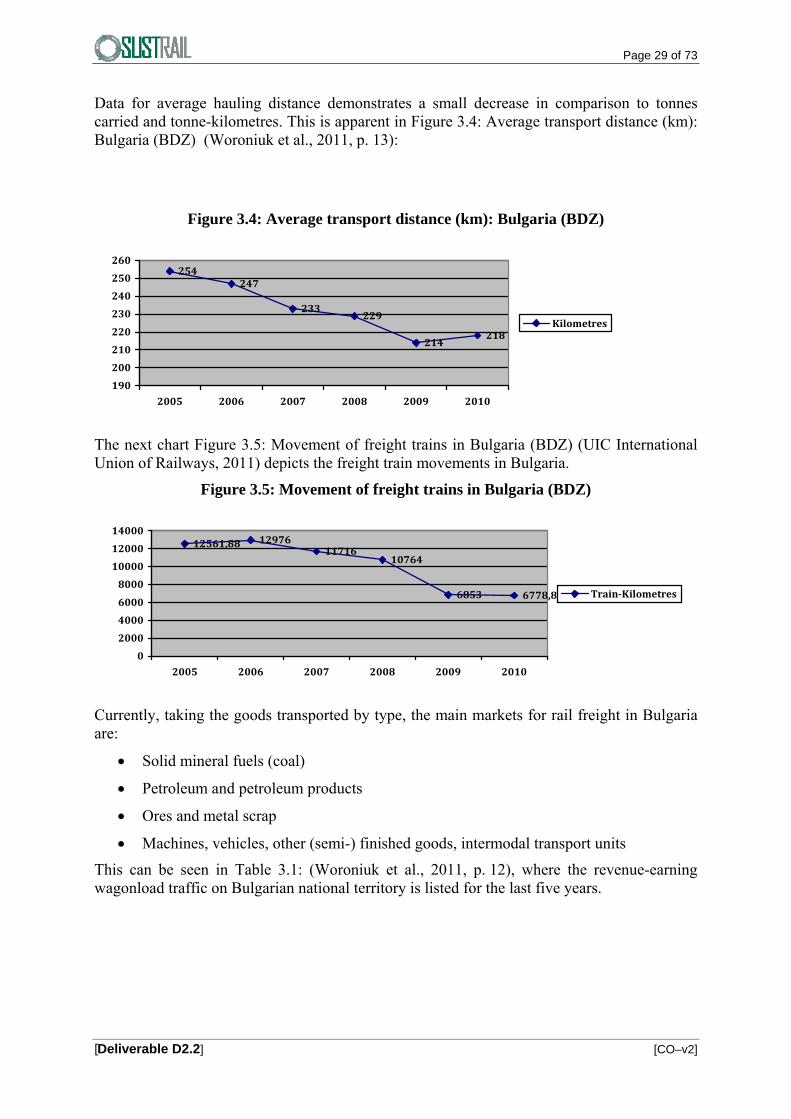
Page 29 of 73
[Deliverable D2.2] [CO–v2]
Data for average hauling distance demonstrates a small decrease in comparison to tonnes carried and tonne-kilometres. This is apparent in Figure 3.4: Average transport distance (km): Bulgaria (BDZ) (Woroniuk et al., 2011, p. 13):
Figure 3.4: Average transport distance (km): Bulgaria (BDZ)
254247
233229
214218
190
200
210
220
230
240
250
260
2005 2006 2007 2008 2009 2010
Kilometres
The next chart Figure 3.5: Movement of freight trains in Bulgaria (BDZ) (UIC International Union of Railways, 2011) depicts the freight train movements in Bulgaria.
Figure 3.5: Movement of freight trains in Bulgaria (BDZ)
12561,88 1297611716
10764
6853 6778,8
0
2000
4000
6000
8000
10000
12000
14000
2005 2006 2007 2008 2009 2010
Train‐Kilometres
Currently, taking the goods transported by type, the main markets for rail freight in Bulgaria are:
Solid mineral fuels (coal)
Petroleum and petroleum products
Ores and metal scrap
Machines, vehicles, other (semi-) finished goods, intermodal transport units
This can be seen in Table 3.1: (Woroniuk et al., 2011, p. 12), where the revenue-earning wagonload traffic on Bulgarian national territory is listed for the last five years.

Page 30 of 73
[Deliverable D2.2] [CO–v2]
Table 3.1: Rail Freight Market in Bulgaria [Carried tonnes × 100,000]
Code Name 2010 2009 2008 2007 2006 0 Agricultural products
and animals 158,00 237,90 418,06 200,00 212,00
1 Foodstuffs and fodders 314,00 374,30 458,79 433,00 495,00 2 Solid mineral fuels 3381,90 3453,70 4458,00 5030,00 4652,00 3 Petroleum and petroleum
products 2020,40 1922,60 2201,40 1754,00 1959,00
4 Ores and metal scrap 1332,50 1050,20 2132,67 3738,00 4414,00 5 Ferrous and non-ferrous
metallurgy produce 764,90 856,70 2030,18 2730,00 2690,00
6 Elaborated and non-elaborated non-metallic raw materials
885,60 1130,40 3116,15 3272,00 3484,00
7 Fertilizers 201,70 72,40 371,84 379,00 461,00 8 Chemical substances and
products 385,00 420,70 730,88 906,00 1425,00
9 Machines, Transport means, etc.
1333,90 1114,40 1672,45 1733,00 1391,00
TOTAL 10777,90 10633,30 17590,42 20175,00 21183,00
Along the Bulgarian rail route between the border stations of Dimitrovgrad (RS) and Kapikule (TR), 50% of rail freight traffic consists of block trains with mostly wagon-load consignments, and 50% of the rail freight traffic is transit traffic with different types of consignments (intermodal and wagon-load) to and from Turkey. This ratio has remained stable, as there has been a constant structure of rail freight (Karagyozov, 2011).
Block trains
The block trains consist of uniform types of vehicles (waggons). State-owned rail freight operator BDZ wants to deploy its rolling stock throughout the whole Bulgarian rail network, so there is no equipment especially dedicated to this route. By the end of the year 2010, freight operator BDZ had a rolling stock of 11,124 freight wagons for the standard gauge (UIC International Union of Railways, 2011). Table 3.2: Structure of freight wagons in Bulgaria in 2009 (Eurostat, 2011) indicates that more than half of the fleet of freight wagons is represented by high-sided open goods wagons. This dominance reflects the economic environment in the New Member States of Bulgaria and Romania. But there seems to be a decreasing trend of their utilisation (Ulianov et al., 2011, p. 17).
Table 3.2: Structure of freight wagons in Bulgaria in 2009
Name Number Payload (Tonnes x 1,000) Box cars (UIC class G) 1,108 54.3 High-sided open goods wagons (UIC classes E, F) 6,024 360.1 Low-sided open wagons (flat wagons; UIC classes R, S) 1,291 76.3 Intermodal wagons 0 0 Other wagons (UIC classes U, Z, I) 3,389 200.6 TOTAL 11,812 691.3

Page 31 of 73
[Deliverable D2.2] [CO–v2]
All the wagons of the BDZ fleet have four axles and bogies of the Y25 type. The maximum axle load of the BDZ wagons is as follows:
Ordinary covered wagon (UIC class G): 20 tonnes
Ordinary open high-sided wagon (UIC class E): 19.5/20 tonnes
Special open high-sided wagon (UIC class F): 20 tonnes
Ordinary flat wagon with bogies (UIC class R): 20 tonnes
Special flat wagon with bogies (UIC class S): 25 tonnes
Special wagons (UIC class U): 20 tonnes
Tank wagon (UIC class Z): 20 tonnes
Refrigerated van (UIC class I): 20 tonnes
Actually, BDZ has suffered from losing 40% of its rail freight business because a metallurgic plant has closed down. This can be also be seen when regarding the statistics in Table 3.1: Rail Freight Market in Bulgaria [Carried tonnes × 100,000], where the goods´ volumes of the codes 4, 5 and 6 diminished immediately after 2008. This effect overlaid the general effect of the economic downturn taking place after 2007, that resulted from the financial crisis and was reflected by the decline in volume in the transport market. Less transport for the metallurgic industry implies less utilisation of open high-sided wagons (UIC classes E, F) to carry coal and ore.
On the other hand, there will be a continued use of black coal as fossil fuel, which to a major extent currently originates in Bulgaria, to supply electricity. So the high-sided open wagons will still be needed.
Class Z tank wagons are used to carry petroleum and petroleum products.
On the Bulgarian route, Class G ordinary covered wagons are highly used in Bulgaria, compared to the other routes studied in SustRail. Interestingly, Class I refrigerated vans are also used, albeit to a limited extent. There is an increasing demand for flat wagons. This trend is mainly due to their utilisation for intermodal freight, and, also, to the alternative freight possibilities (wood, steel, auto, etc.) offered by the special models (Ulianov et al., 2011, p. 17 and p. 26).
Apart from transit traffic, intermodal traffic has been very rare in Bulgaria. This was due to a lack of suitable intermodal terminals to handle block trains. The only loading units carried were maritime containers, and the annual volumes were small (KombiConsult/K+P Transport Consultants, 2009, p. 14). Along the rail route observed in this study, single wagon loads of containers used to be handled in the Sofia-Tovarna facility. In 2010, the container terminal in Yana east of Sofia was opened. It is reported that the first ever block container train destined for Bulgaria arrived in Sofia on 17 September 2011, and the containers, that came from Slovenia, were handled at the Yana terminal (Ecologistics Ltd., 2010). Such a terminal had been highly demanded by the EU transport sector (CREAM Partners, 2009). It may be that the new terminal helps to stimulate the amount of international container carriage by rail, meaning inbound/outbound containerised cargo, which had almost disbanded (Eurostat, 2011).
Since 2007, near Stambolijski in the south of Bulgaria, pellets have been transported using special containers developed by Austrian company Innofreight. The containers named ”WoodTainer” are carried on block trains on behalf of the company Mondi and can be

Page 32 of 73
[Deliverable D2.2] [CO–v2]
handled by forklift trucks, so that they do not require cranes for transhipment purposes (Innofreight, 2008).
Transit traffic to and from Turkey
Throughout the last couple of years, Turkish economy has grown extraordinarily. The EU member countries are the most important trading partners for Turkish foreign trade. Especially between Germany and Turkey, there is a lot of exchange of goods. There are different trade lanes between these countries, and one of these, amongst others, relies on the Bulgarian rail corridor assessed in SustRail. Most of the transit traffic is intermodal traffic, as can be seen in the list of services:
Since 2008, Kombiverkehr in co-operation with Adria Kombi and their joint venture Europe Intermodal offer a direct train called ”Bosporus-Europe-Express” between Ljubljana (SI) and Halkali (Istanbul) (TR) at a frequency of currently 1-2 departures per week (Europe Intermodal, 2008). In Ljubljana, transport volume arriving by block trains from terminals in Ludwigshafen (DE), Duisburg (DE) and München (DE) is bundled (Ruschke, 2011). According to the operators, as loading units, containers of a length between 20’ and 40’ are transported; slots for piggyback semi-trailers are available on request. This train uses the whole Bulgarian rail route assessed in the SustRail project between the borders at Dimitrovgrad/Dragoman and Svilengrad/Kapikule.
There are also intermodal railway services to and from Turkey offered by operator Inter Ferry Boats. There is a link between Neuss/Frankfurt-Höchst/Mannheim (DE) and a hub in Sopron (HU), where there is onward connection to and from Halkali (Istanbul) (TR), crossing Bulgaria. In late 2010, this business was taken over from the dissolved operator Intercontainer that used to be very experienced in intermodal transport along the South-East European corridor. Currently, the loading units are 45’ high cube containers. On these intermodal trains, there is also cargo originating in the Benelux countries, including incoming short sea cargo from the port of Rotterdam (NL) that is routed via Antwerpen (BE), and cargo originating in Poland (Kloss, 2011).
Since 2003, there is an intermodal block train service between Lambach (AT) and Istanbul (TR). It is a company train service operated on behalf of Austrian freight forwarding company Gartner. The trains carry Gartner´s own intermodal equipment, which is pallet-wide 45’ containers and piggyback trailers, on its own account. Intercontainer Austria acts as a sales agent to sell the train operation on behalf of its parent company Rail Cargo Austria.
Since 2004, there is an intermodal block train service connecting Köln (DE) and Kösekoy. It was mainly launched to connect the Ford production facilities in Köln-Niehl (DE) and Gölcük-Kocaeli (TR). The route goes via Romania, Ruse, Svilengrad to Kapikule and further to Turkey, so it uses only a part of the transit corridor assessed in SustRail. In Köln, there are train departures three times a week. Each train has a length of 520m (usable line length at meeting stations is 550m) and consists of 32 articulated low-loader wagons with tight coupling. Each waggon has a capacity of two swap bodies. The ’Mega Combi’ swap bodies have an outer length of 13.6m and offer an inner height of 3m (98m3 loading capacity). To start this form of transport, operator Omfesa invested about 200 mill. EUR in 220 waggons and 400 swap bodies (Studiengesellschaft für den kombinierten Verkehr, 2004). The corridor allows for a max. payload of 20.5 t per swap body, which is sufficent for the automotive sector. In 2010, 105,000t of automotive materials and spare parts were carried along the corridor

Page 33 of 73
[Deliverable D2.2] [CO–v2]
on behalf of Omfesa, including motors, which are heavy, and empties, which are light (Iskan, 2011). Clients in the automotive sector are OEM (Ford, Renault, Tofas) as well as suppliers (Autoliv, Fritz Winter). In the westbound direction, the remaining capacity is marketed to carry textiles, oriental furniture, white goods and non-perishable food, to increase capacity usage (Trabert, 2011).
For 10 years, there is a system bundling single wagon loads originating in Western and Central Europe in shunting yards such as Sturovo (SK), Sopron (HU), Villach (AT), Ljubljana-Zalog (SI) and Kiskunhalas (HU) and forming block trains e.g. bound for Turkey via Bulgaria. The service product is called ’Balkan Train’. It is being offered by Austrian freight forwarding company Express-Interfracht, a subsidiary of state-owned Rail Cargo Austria. Daily departures are offered (Express-Interfracht, 2010). Various kinds of wagons belonging to the pool of Rail Cargo Austria can be accessed and dispatched. The rail route uses the whole Bulgarian transit corridor analysed in SustRail.
The intermodal transit services can be completely assigned to, and are geared towards, continental transport (KombiConsult/K+P Transport Consultants, 2009, p. 18). Loading units used are pallet-wide containers and swap bodies. No semi-trailers are currently being carried by the railways. Figure 3.6 shows that there was a high loss in volume in the year 2010, compared to 2009.
Figure 3.6: Intermodal transit transport in Bulgaria (TEU) (Eurostat, 2011)
24.78643.114
75.685
30.892
7.459
11.530
11.650
12.367
0
20.000
40.000
60.000
80.000
100.000
2007 2008 2009 2010
empty
laden
In all, for these transit trains, new and old wagon types are used. The intermodal wagons are owned by foreign freight operators.
Table 3.3: Estimated average data shows the average speed and the average train length along the sections of the Bulgarian route, which is, in total, 367.5 km long.
Table 3.3: Estimated average data (Woroniuk et al., 2011, pp. 35-49)
Section Average speed
Average train length
Average number of wagons per train
Dimitrovgrad S – Sofia 71 km/h 500 metres 17-24 Poduyane – Verinsko 72.5 km/h 500 metres 17-24 Ihtiman – Todor Kableshkov
77 km/h 500 metres 17-24
Plovdiv R – Parvomaj 80 km/h 500 metres 17-24 Jabalkovo – Kapikule 85 km/h 500 metres 17-24

Page 34 of 73
[Deliverable D2.2] [CO–v2]
The current route characteristics are:
Route maximum speed by sections for freight movement.
o Maximum speed of freight trains is 80 km/h. (Lekse, 2009) (Erlinger, 2012). Freight traffic has a typical line speed of 75 km/h apart from the section between Parvomaj – Jabalkovo during which freight can travel at up to 120 km/h (Woroniuk et al., 2011, p. 14).
Maximum length allowed to the freight train composition.
o 520m (Lekse, 2009).
Maximum weight allowed to the freight train composition.
o 1,200 t (Lekse, 2009).
Maximum axle load allowed to freight wagons.
o 22.5 t (Erlinger, 2012).
Maximum rail loading gauge.
o Bulgaria has signed the International Wagon Regulations RIV, of which Annex II defines the loading gauge. For the route considered, the loading gauge is UIC GB. The corridor throughout Bulgaria has an intermodal codification of P/C 59/389 which does not allow the transport of 4 meter high semi-trailers as just 3.89 meter is available (RailNetEurope Corridor C11).
Existing constraints on the line for the transportation of dangerous goods.
o The conditions for transportation are stipulated in details in Regulation No. 46 of 30 November 2001 on railway transportation of dangerous cargo. There are restrictions as to stations, as the dangerous cargo are accepted for transportation only as a separate wagon shipment from and to stations open for business and for operations with the particular cargo, determined by a carrier (art. 29, p. 1 of Regulation 46). Exceptions are possible only with the permission in writing of IARA (art. 29, p. 2 of Regulation 46) (NRIC, 2010).
Mass per unit length.
o 8 t. (Erlinger, 2012)
Line classification (according to EN 15528:2008 / UIC700).
o D4. (Erlinger, 2012)
The route section characteristics are shown in Table 3.4: Bulgarian route section characteristics.

Page 35 of 73
[Deliverable D2.2] [CO–v2]
Table 3.4: Bulgarian route section characteristics (Erlinger, 2012)
Actually in Bulgaria the current situation is such that there are several projects under examination, concerning modernization with increasing velocities, axle load, capacity and other technical parameters for the corridor under study. Some of these projects (for an important length of the corridor) are planned to be completed by 2013-2014, and other projects for the rest length of the corridor are planned to be finished 2015-2016, 2017. For the further research carried out in the context of SUSTRAIL, it is recommended to elaborate on these infrastructure projects, as there will be variation of the technical parameters.
3.1.2 Route 2 – Spain
Historical background
The most remarkable characteristic of Spanish railway is the Iberian gauge. Although there are some metric and standard gauge lines, a vast majority of the Spanish railway network is built using Iberian gauge. It was decided, at an early stage, that Spain's railways should be built to an unusual broad track gauge of 1,672 mm. Some believe that the gauge was chosen to prevent any French invasion. But the official explanation says that the decision was taken to allow bigger engines that could have enough power to climb the steep passes in the second most mountainous country of Europe. As a result, Portuguese railways were also built with the same gauge. Spain and Portugal have since rounded their gauge to 1.668 mm. The break-of-gauge at the French border has always troubled the movement of trains, both freight and passengers.
Renfe Operadora is the state-owned company which operates freight and passenger trains on the Iberian gauge and in the standard UIC gauge networks of the Spanish nationalized

Page 36 of 73
[Deliverable D2.2] [CO–v2]
infrastructure company ADIF (Administrador de Infraestructuras Ferroviarias). Both were formed from the break-up of the former national carrier RENFE (Red Nacional de los Ferrocarriles Españoles, "Spanish National Railway Network."). Renfe Operadora operates more than 90% of railway traffic in Spain (Ministerio del Fomento, 2010), and operates all international traffic. Renfe has historically operated the network subordinating freight to passenger services.
Actual situation
Among the larger Western European countries, Spain is the one in which railway has the lowest modal share in the freight transportation market. In the last decade, it has fallen from 10.3% in 1997 to 4.1% in 2008 (Ministerio del Fomento, 2010). Intermodal and conventional transportation have followed the same descending pattern as can be seen in the Figure 3.6.
Figure 3.7: Modal share of railway by year (Ministerio del Fomento, 2010)
Total goods transportation has risen indeed, as we can see in Figure 3.6. Almost all rises have been absorbed by road. Road has experienced the highest growth in volume and market share of inland freight transport in Spain. Between 1997 and 2007, road traffic multiplied by 2.3. Between 2003 and 2008, the road has increased by 28%.

Page 37 of 73
[Deliverable D2.2] [CO–v2]
Figure 3.8: Total freight transportation (Ministerio del Fomento, 2010)
Road transportation share has reached more than 95% in 2008, as we can see in the Figure 3.9: Modal split of inland freight transport in Spain, 2008. (Mt x km) (Ministerio del Fomento, 2010).
Figure 3.9: Modal split of inland freight transport in Spain, 2008. (Mt x km) (Ministerio del Fomento, 2010)
Freight transportation activity is mainly carried out by the public operator Renfe Operadora (93%) (Ministerio del Fomento, 2010), although new companies are entering the market following European deregulation directives. As can be seen in Figure 3.6, there was a reduction in tonne-kilometres carried by rail freight operator RENFE by 41% in the period 2004-2009. Conventional wagon-load as well as intermodal transport were affected.

Page 38 of 73
[Deliverable D2.2] [CO–v2]
Figure 3.10: Rail freight transport performance of RENFE (Mill. ton-km) (Ministerio del Fomento, 2010)
3884 4003 3981 3336 3322 2535
8043 7067 7031 7211 6415
4438
0
2000
4000
6000
8000
10000
12000
14000
2004 2005 2006 2007 2008 2009
Intermodal
Wagon‐load
Another important fact to mention is that there are some big ports in Spain. The ports of Valencia, Algeciras, and Barcelona are in the European Top 10 in containerized freight movement (5th, 7th and 9th) (Institute of Shipping Economics & Logistics, 2010), but only 5.2% of this cargo is transported by rail (Ministerio del Fomento, 2010). The rest goes by road. Some reasons for this are: inefficient rail access infrastructure, operational problems in rail infrastructure within the ports and an inefficient service scheme entailing extra cost for railway undertakings.
A lot of rail freight destined for, or originating in, Valencia is represented by hinterland transport for the port of Valencia. In 2009, the share of rail in the port of Valencia hinterland transport was 6%, or 1.5 mill. tonnes (Ministerio del Fomento, 2010). In the port of Tarragona, the share was higher (12%), whereas in the port of Barcelona, which is most important for Spanish foreign trade, it was much lower (1.5%).
In the port of Valencia mostly containerised cargo is handled. Liquid and dry bulk play a minor role. The port of Tarragona is in contrast used to handle bulk (presumably for the chemical industry). The port of Barcelona is a more a universal port, handling liquid and dry bulk, containerised loads and general cargo. It should not be forgotten that most of the rail cargo in the hinterland of the ports of Valencia originates, or ends, in the Madrid agglomeration, thus not playing a role on the Mediterranean corridor.
In Spanish domestic transport, rail´s share in 2008 was only 2.73% (base: all modes). This was before the economic downturn occurred.
In the international transportation between Spain and the rest of Europe, railway has a very weak position, most of the freight being moved using lorries. The main reason for this is the different rail gauge at the French border, but this is not the only one. Low investments or bad use of resources contribute to make railway less competitive against road.
Railway has lack of economic competitiveness: for medium and long distances (over 600km); however, the unit cost per ton transported by rail in normal operation should be below the cost of road transport. But in practice it is due to different reasons, such as operational deficiencies with negative impacts on productivity, or extra-costs that contribute to inefficiency of the rail system (unnecessary maneuvers terminal, gauge changing, etc).
The lack of quality/reliability of service is reflected in the decline of rail and in the perceptions of users and is mainly due to the rigidity and slowness of response to market needs.

Page 39 of 73
[Deliverable D2.2] [CO–v2]
Mediterranean Corridor: general route characteristics
The ’Mediterranean Corridor’ is located on the East coast of Spain (Woroniuk et al., 2011, p. 10). In the SustRail analysis, the focus is on the Tarragona-Valencia section. From a European perspective, the route is part of the FERRMED corridor. The rail freight network of the FERRMED Great Axis interconnects the Baltics and the Western Mediterranean region (FERRMED).
The Mediterranean Corridor could be defined by the following main points:
Route maximum speed by sections for freight movement.
o 120 km/h. There are currently no plans for freight trains to be scheduled at higher speed, and most of them run at 100 km/h. Local restrictions apply as shown on section descriptions.
Maximum length allowed for a freight train composition.
o Defined for each track section. The average is 450m.
Maximum weight allowed for a freight train composition.
o Given the 1:66 (15‰) maximal track grade, current locomotives, either electric or diesel, can pull up to 1200t to 1600 t. (ADIF, kein Datum)
Maximum weight allowed for a single freight wagon.
o Unrestricted. (ADIF, 2011)
Maximum axle load allowed for freight wagons.
o 22.5 t. (ADIF, 2011)
Maximum rail loading gauge.
o Iberian loading gauge (ADIF, 2011). Its dimensions are given in Appendix II, Volume 1 Table 21 of the International Wagon Regulations RIV. The Mediterranean corridor, as the whole Iberian penisular network, has an intermodal codification of P/C 45/364, which does not allow the transport of 4 meter high semi-trailers as just 3,64 meter is available (Interunit Technical Commission Codification map, 2007).
Existing constraints on the line for the transportation of dangerous goods.
o No. (ADIF, 2011)
Mass per unit length.
o 8 t. (ADIF, 2011)
Line classification (according to EN 15528:2008 / UIC700).
D4. (ADIF, 2011)

Page 40 of 73
[Deliverable D2.2] [CO–v2]
Table 3.5: Tarragona-Vandellós section characteristics. Sources (Ineco-ADIF, 2011)(ADIF, 2011)
Tarragona – Vandellós section
Length 39 km
Track number/gauge Single track; Iberian gauge 1,672 mm
Electrification 3kV CC
Communications system Radiotelephone
Cab signalling/Train protection ATP: EBICAB and ASFA
Block Signalling Automatic block system with CTC
Traffic characterisation Freight, and regional and long-distance passenger trains
Ruling grade 11‰ (Southbound)
12‰ (Northbound)
Freight train max length 450 m (basic) - 500 m (conditioned)
Freight max speed 120 km/h
Loading gauge Iberian loading gauge, codification P/C 45/364
Axle load 22.5 t
Line Classification D4
Table 3.6: Vandellós-Castellón section characteristics. Sources (Ineco-ADIF, 2011)(ADIF, 2011)
Vandellós – Castellón section
Length 147 km
Track number/gauge Double track; Iberian gauge 1,672 mm
Electrification 3kV CC
Communications system Radiotelephone
Cab signalling/Train protection ATP: EBICAB and ASFA
Block Signalling Automatic block system with CTC
Tipo de tráficos Freight, and regional and long-distance passenger trains
Ruling grade 14‰ (Southbound)
15‰ (Northbound)
Freight train max length 450 m (basic) - 500 m (conditioned)
/ 475 m (basic) - 550 m (conditioned)
Freight max speed 120 km/h
Loading gauge Iberian loading gauge, codification P/C 45/364
Axle load 22.5 t
Line Classification D4
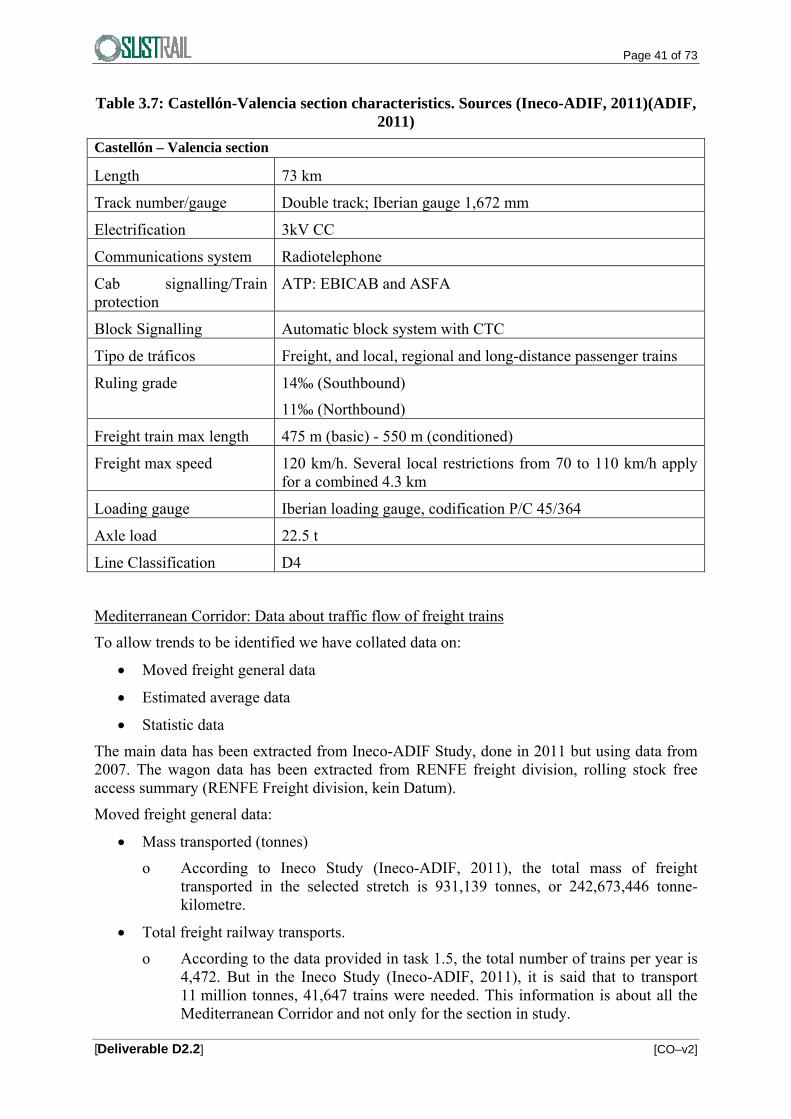
Page 41 of 73
[Deliverable D2.2] [CO–v2]
Table 3.7: Castellón-Valencia section characteristics. Sources (Ineco-ADIF, 2011)(ADIF, 2011)
Castellón – Valencia section
Length 73 km
Track number/gauge Double track; Iberian gauge 1,672 mm
Electrification 3kV CC
Communications system Radiotelephone
Cab signalling/Train protection
ATP: EBICAB and ASFA
Block Signalling Automatic block system with CTC
Tipo de tráficos Freight, and local, regional and long-distance passenger trains
Ruling grade 14‰ (Southbound)
11‰ (Northbound)
Freight train max length 475 m (basic) - 550 m (conditioned)
Freight max speed 120 km/h. Several local restrictions from 70 to 110 km/h apply for a combined 4.3 km
Loading gauge Iberian loading gauge, codification P/C 45/364
Axle load 22.5 t
Line Classification D4
Mediterranean Corridor: Data about traffic flow of freight trains
To allow trends to be identified we have collated data on:
Moved freight general data
Estimated average data
Statistic data
The main data has been extracted from Ineco-ADIF Study, done in 2011 but using data from 2007. The wagon data has been extracted from RENFE freight division, rolling stock free access summary (RENFE Freight division, kein Datum).
Moved freight general data:
Mass transported (tonnes)
o According to Ineco Study (Ineco-ADIF, 2011), the total mass of freight transported in the selected stretch is 931,139 tonnes, or 242,673,446 tonne-kilometre.
Total freight railway transports.
o According to the data provided in task 1.5, the total number of trains per year is 4,472. But in the Ineco Study (Ineco-ADIF, 2011), it is said that to transport 11 million tonnes, 41,647 trains were needed. This information is about all the Mediterranean Corridor and not only for the section in study.

Page 42 of 73
[Deliverable D2.2] [CO–v2]
Total wagons.
o Data has not been provided.
Categorisation of vehicles (according to EN 15528:2008 / UIC700).
o Data has not been provided.
Estimated average data:
Average speed of the freight train compositions.
o According to the data provided in task 1.5, the average speed of the trains is 52 km/h.
Average length of the freight train compositions.
o According to the data provided in task 1.5 (Woroniuk et al., 2011, p. 10), it is 420 metres.
Average axle load of the freight train compositions.
o Data is not provided.
All freight trains running on this route are direct trains. The total number of freight trains per day is indicated in the next table. while the average number of wagons per train is 18 (Woroniuk et al., 2011).
Table 3.8: Tarragona – Valencia freight trains per day (Woroniuk et al., 2011)
Monday Tuesday Wednesday Thursday Friday Saturday Sunday 15 18 17 14 17 3 2
Statistic Data:
A. Good transported by type (in tonnes and percentage of the total):
Table 3.9: Goods transported by type. Source (Ineco-ADIF, 2011)
Tonnes Percentage
Intermodal 401.062 43.07%
Automobiles 113.605 12.20%
Construction materials 11.927 1.28%
Common goods 285 0.03%
Steel materials 381.718 40.99%
Fuels, hydrocarbons 25.234 2.71%
Agricultural products 0 0.00%
Mining Products 585 0.06%
B. Wagons type (number or percentage of the total):
See Table 3.10:

Page 43 of 73
[Deliverable D2.2] [CO–v2]
C. Wagons classification (number or percentage of the total) (According to EN 15528:2008 / UIC700)
Table 3.10: Goods transported by wagon. Source (Ineco-ADIF, 2011)
Tonnes Percentage
Container 401.062 43.07%
Flatcars 381.718 40.99%
Autoracks 113.605 12.20%
Tank 25.234 2.71%
Hopper 12.512 1.34%
Covered wagons 285 0.03%
D. Wagons classification (number or percentage of the total) Data according to EN 15528:2008 / UIC700 and extracted from RENFE freight division, rolling stock free access summary (RENFE Freight division, kein Datum)
D4: 5%
D3: 5%
C3: 77%
Lower loads per axle or unit length: 13%
3.1.3 Route 3 – United Kingdom
The UK’s railways have approximately an 11% share of surface freight transport and the amount of rail freight carried has generally been increasing since the mid-1990s (see Figure 3.11: UK rail freight transport performance (Woroniuk et al., 2011, p. 16, based on data from ORR National Rail Trends Yearbook 2010-11)). Along the two UK corridors, from Felixstowe and Southampton to Nuneaton and then up the West Coast Mainline, studied in the SustRail project, around 75% of the rail traffic is freight trains, with 25% being passenger trains. This ranges from 96% freight on the line near Felixstowe to 42% on the mainline between Southampton and Basingstoke.

Page 44 of 73
[Deliverable D2.2] [CO–v2]
Figure 3.11: UK rail freight transport performance (Woroniuk et al., 2011, p. 16, based on data from ORR National Rail Trends Yearbook 2010-11)
There are 7 main markets for rail freight in the UK:
bulk commodities including coal, metals, construction traffic, oil and petroleum,
international traffic,
domestic intermodal,
railway infrastructure related.
In the rail freight market, the share of containers has risen, whereas the share of coal has decreased: ”Following a decline in primary and manufacturing industries rail freight’s traditional role in transporting bulk materials has shifted, revealing its potential to move consumer goods efficiently and serve the burgeoning global trade in these markets. Rail has already made huge inroads into this new market with over 25% of freight containers originating from the Far East shipped into ports like Southampton and Felixstowe being transported onwards by rail” (Network Rail/Rail Freight Operations’ Association, 2010, p. 5). In the year 2010-11, the transport performance in the intermodal segment (containers) augmented to 5.68 billion NTKm and overtook the coal segment (5.46 billion NTKm) (Woroniuk et al., 2011, p. 16), see also Figure 3.12: UK intermodal rail freight transport performance (Woroniuk et al., 2011, p. 17, based on data from ORR National Rail Trends Yearbook 2010-11).
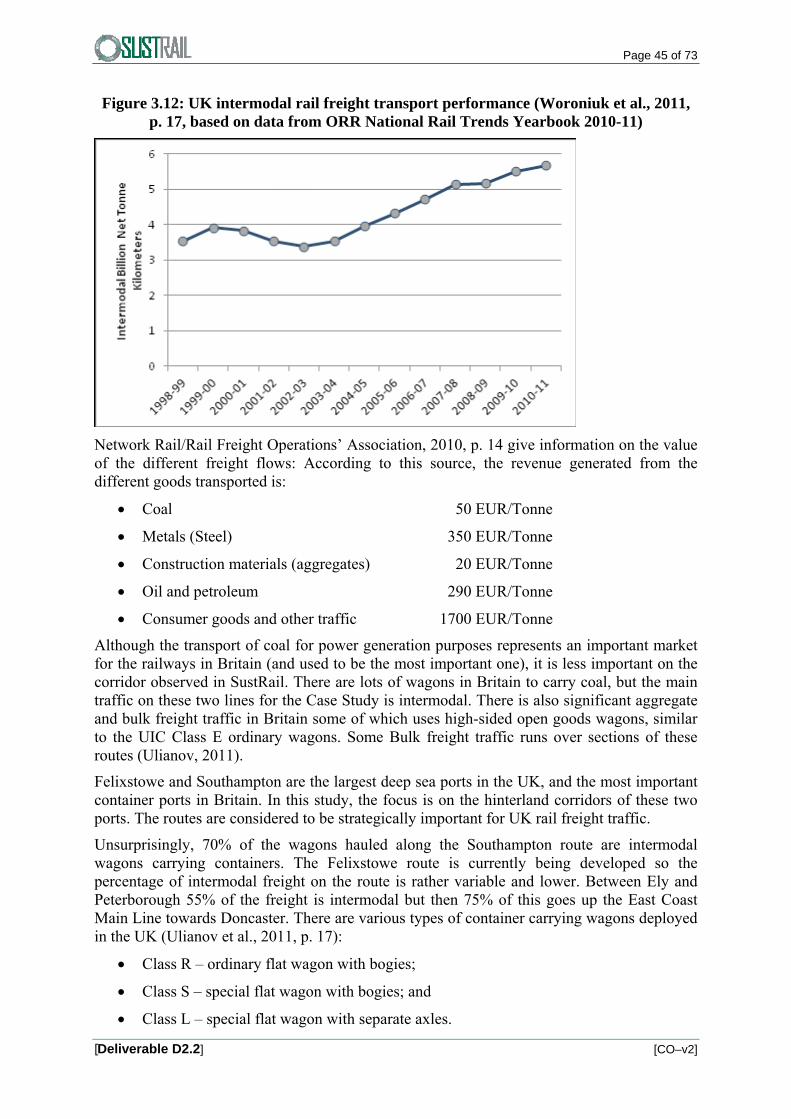
Page 45 of 73
[Deliverable D2.2] [CO–v2]
Figure 3.12: UK intermodal rail freight transport performance (Woroniuk et al., 2011, p. 17, based on data from ORR National Rail Trends Yearbook 2010-11)
Network Rail/Rail Freight Operations’ Association, 2010, p. 14 give information on the value of the different freight flows: According to this source, the revenue generated from the different goods transported is:
Coal 50 EUR/Tonne
Metals (Steel) 350 EUR/Tonne
Construction materials (aggregates) 20 EUR/Tonne
Oil and petroleum 290 EUR/Tonne
Consumer goods and other traffic 1700 EUR/Tonne
Although the transport of coal for power generation purposes represents an important market for the railways in Britain (and used to be the most important one), it is less important on the corridor observed in SustRail. There are lots of wagons in Britain to carry coal, but the main traffic on these two lines for the Case Study is intermodal. There is also significant aggregate and bulk freight traffic in Britain some of which uses high-sided open goods wagons, similar to the UIC Class E ordinary wagons. Some Bulk freight traffic runs over sections of these routes (Ulianov, 2011).
Felixstowe and Southampton are the largest deep sea ports in the UK, and the most important container ports in Britain. In this study, the focus is on the hinterland corridors of these two ports. The routes are considered to be strategically important for UK rail freight traffic.
Unsurprisingly, 70% of the wagons hauled along the Southampton route are intermodal wagons carrying containers. The Felixstowe route is currently being developed so the percentage of intermodal freight on the route is rather variable and lower. Between Ely and Peterborough 55% of the freight is intermodal but then 75% of this goes up the East Coast Main Line towards Doncaster. There are various types of container carrying wagons deployed in the UK (Ulianov et al., 2011, p. 17):
Class R – ordinary flat wagon with bogies;
Class S – special flat wagon with bogies; and
Class L – special flat wagon with separate axles.

Page 46 of 73
[Deliverable D2.2] [CO–v2]
The first route starts in Southampton and leads to the North via Reading and Birmingham. On the route originating in Southampton, there are 22-23 direct intermodal freight trains per day. The intermodal trains running there are 23 wagons in length on average. Average train length is 557 metres (Woroniuk et al., 2011). Freightliner and DB Schenker (EWS) operate the trains. While on this route, rail freight is typically represented by container trains, cars like Minis, Land Rovers and Jaguars manufactured in Britain and destined for export to other continents are transported by rail to the port of Southampton where they are shipped onto deep sea vessels. Jaguar operates railheads at both its Halewood and Castle Bromwich plants in the North-West enabling more than 70% of its production to travel by rail. Twenty-two cars can be transported in each rail wagon meaning that 176 cars can be carried on a typical 8 wagon train (Network Rail/Rail Freight Operations’ Association, 2010, p. 16).
The other selected route stretches from Felixstowe in the East westwards, towards Birmingham and the North West via Ipswich and Peterborough. It is termed the “cross country” route. On the route starting in Felixstowe, there are 16 daily container trains heading East, only three of which go further West than Peterborough. They are joined between Leicester and Nuneaton by 10 coal and aggregate trains/day. In total, there are currently 30 intermodal freight train services per direction per day, with services to and from the Felixstowe port operated by Freightliner, GB Railfreight and DB Schenker (EWS); half of these go via North London to then up to the North West. Once the new chords are completed at Ipswich, Ely and Nuneaton over the next 2 years then it is expected that by 2014, 24 intermodal trains might be taking this cross-country route towards the North West of Britain. Current maximum train length is limited to 24 wagons (max. train length 487m including locomotive). This is dictated by the length of passing loops and sidings. As far as axle loads are concerned, the whole route is cleared for RA8 which equates to a maximum axle load of 22.8 tonnes with some sections cleared to RA10 (25.4 tonnes).
The two routes meet just east of Birmingham at a place called Nuneaton, and they then run north on the slow line of the West Coast Main Line via Crewe towards Warrington, just to the west of Manchester and some continue on to Scotland.
The intermodal trains carrying containers inland are all direct trains.
Regarding the infrastructure, on the slow lines of the West Coast Main Line or other lines shared with passenger services, most of the route is laid out for running freight trains at a speed of 75mph (120km/h) max., but on other sections, freight runs at well below its potential speed (often averaging around 30mph, or 48km/h over some sections) due to going into loops or slow lines and because of being stopped for passenger services (Woroniuk et al., 2011). The average speed between Southampton and Warrington is considered to be 80km/h. Most container carrying wagons can be operated at a speed of 120km/h max. (laden or empty) (Ulianov et al., 2011, p. 29).
On the UK network, there are large proportions of the case study route where maximum freight operating speed is below the line speed for passenger trains. This is the case for 29% of the route Felixstowe-Nuneaton and 59% of the route Southampton-Nuneaton (Figure 3.11: UK rail freight transport performance (Woroniuk et al., 2011, p. 16, based on data from ORR National Rail Trends Yearbook 2010-11)). Raising freight speeds could expand the market for both rail freight and rail passenger service, by increasing the efficiency of track utilisation in congested parts of the network.

Page 47 of 73
[Deliverable D2.2] [CO–v2]
Figure 3.13: Line speed versus freight train speed limits (Source: own analysis of Network Rail data)
0%
10%
20%
30%
40%
50%
60%
70%
80%
90%
100%
0 20 40 60 80 100 120 140
% of route (cumulative)
Line speed, mph
Felixstowe‐Nuneaton
Southampton‐Nuneaton
Class 6 freight train72km/h= 45mph max
Class 4 freight train120km/h= 75mph max
Work was completed in April 2011 to increase the loading gauge to W10 from Southampton to Nuneaton. This allows deep sea containers of 9’6’’ (2.90m) height to be conveyed on standard wagons. This means a height above rail of 3.90m, when wagons with a 0.98m deck height are used (i.e. the large fleet of wagons employed by Freightliner and GB Railfreight on routes to/from Felixstowe, Southampton etc.). A loading gauge W10 also has sufficient width for all conventional freight wagons such as steel flatbeds, box wagons (with ‘arched roofs’) and trade car carriers (MDS Transmodal, 2007a, pp. 24-25). Work is also taking place to increase the loading gauge by 2014 of a diversionary route from Southampton to Basingstoke via Andover to W10 gauge. In the next financial period (CP5 2014-2019) it is planned to construct a flyover juncton at Reading so that freight trains can cross over the Great Western Main Line there without blocking the fast lines.
The West Coast Mainline (WCML) and a number of important branches from the WCML to intermodal terminals are cleared to W10 gauge. So too is the route down the Great Eastern Mainline from Felixstowe to London and around the North London Line and up the WCML to Warrington.
Work has also now been completed to increase the loading gauge to W10 on the cross-country route between Felixstowe and Nuneaton. The smallest loading gauge defined in Britain is W6A, not allowing for the transportation of containers of a height of 9’6’’, which often makes deviations of container trains more challenging or even impossible.
The East Coast Main Line (ECML) has also been route cleared for W10 gauge up to Doncaster so it is possible for a W10 container train to now travel from Southampton via Nuneaton and Peterborough and up to Doncaster.

Page 48 of 73
[Deliverable D2.2] [CO–v2]
The container trains do not exhaust the weight capacity of the rail routes.
The operator Freightliner deploys intermodal wagons with a capacity of 3 TEU (equalling 60’) (Studiengesellschaft für den kombinierten Verkehr, 2005). Very often, the capacity usage of these wagons is not optimal because many 40’ containers are carried. DB Schenker (EWS) uses ’Multifret’ as well as ’Megafret’ wagons. ”Megafret wagons are a standard European intermodal wagon design, they are in general use with EWS, GBRf and mainland European operators and they are 'licenced' to operate in Britain, mainland Europe and the Channel Tunnel. They are also available to lease in large numbers” (MDS Transmodal, 2007, p. 5). The ’Megafret’ wagons have UIC identification marking Sffggmrrss and belong to Class S special flat wagons with bogies. They have 8 axles, a tare of 39t and a loading capacity of 45t per double unit, and an axle load of 10.5t (Ulianov et al., 2011, p. 29). Freight operator GB Railfreight invested in the purchase of low-loader intermodal wagons Mega 3 with an extra low deck height (Studiengesellschaft für den kombinierten Verkehr, 2004).
Table 3.11: Main types of intermodal platform wagons used on the British network (MDS Transmodal, 2007, p. 26; wagon description GE/Kockums)
Wagon Type
Loading Height
Capacity Comment
Freightliner 980mm 3 TEU i.e. 1x40ft + 1x20ft or 3x20ft
Standard British platform that can operate on the British network only i.e. not through the Channel Tunnel
Multifret 945mm 4 TEU i.e. 2x40ft or 4x20ft
Standard European platform that can operate in Britain and through the Channel Tunnel
Megafret 825mm 2 x 13.6m swap body Standard European platform that can operate in Britain and through the Channel Tunnel
Lowliner 720mm 4 TEU i.e. 2x40ft or 4x20ft
Low deck height wagon. Can only be used on the British network i.e. not through the Channel Tunnel
'Well' Wagon
712mm 2 x 13.6m swap body Low deck height wagon. Can only be used on the British network i.e. not through the Channel Tunnel
Mega 3 Pocket Wagon
475mm 2 TEU i.e. 1x40ft or 2x20ft up to 9’6” hight
Pocket wagon with low floor. Can also run in the Channel tunnel to France but does normally operate only in Britain.
3.2 Requirements from the freight operator perspective
From the perspective of freight operator RENFE Mercancías, long-distance transport and transport across borders is becoming increasingly important. This leads to the issue of interoperability of the railway networks of Spain and France. Concerning the Mediterranean Corridor, the historically different track gauge is regarded as to be a minor factor.
Of course changing the axles or transferring intermodal loading units at the border station takes time, but lead times between Spain and Germany are reported to range from two days to one month, caused by a lack of co-ordination by the operators involved (one of the rail freight operators involved is the leader in the contract). Nevertheless the gauge change is one of the the crucial factors. For the new line from Perpignan to Barcelona journey times are much

Page 49 of 73
[Deliverable D2.2] [CO–v2]
reduced thanks to the elimination of the switching of loads between wagons at the border, or the changing of bogies. 750 m long trains can be run, up from 450 m, the main handicap in Spain being the limited length of many refuge and crossing loops. Train lengths will be increased from 20 to 28 wagons. The frontier costs incurred by a 16-wagon train at the break of gauge in Portbou amounted to €4700, while the cost of sending such a train via the new line is just €684 (Anon., 2011).
From the Spanish rail freight operator RENFE’s point of view, interoperability between the Spanish and the French railway network is said not to be an issue. Nevertheless, in the eyes of RENFE, there are other technical aspects to be harmonised along the Mediterranean Corridor:
The signalling system: because the dynamics of freight trains are different from the dynamics of passenger trains. Freight trains are stopped for a longer time, reducing average speed. ERTMS Level 1 has been implemented along the route; in Spain, there is a centralised traffic control.
Traction: Short-distance passenger traffic hampers rail freight operation and causes delays around urban areas.
The procedure for brake tests that should be automatic.
The coupling operation that should be automatic.
For RENFE Mercancías, it is important to increase average speed. On the other hand, for the carriage of bulk, the maximum axle load should be increased from 22.5 to 25 tonnes. So demands on rail infrastructure would become higher. There is a relationship between speed and axle load, which can help to partly solve the problem of the high demands on rail infrastructure that naturally results in the different views of freight and infrastructure operators: Intermodal trains require less axle load, but are to be run at a higher speed (container trains are already run at up to 120 km/h). With regard to the future requirements in the context of SustRail, maybe there will be a suitable trade-off.
The current practice that maintenance work on the rail infrastructure is carried out at night, so that passenger trains can run during the day without any disturbance, is critisised because this prevents freight trains from running at night.
The type of wagons that are expected to be used in the near future are, predominantly, flat wagons, container-carrying wagons, and covered wagons.
There seems to be a future market for the carriage of perishables, such as tulips, oranges, lemons, and food, by direct trains via France to Northern Europe. A challenge is regarded to be the cooling of the fruits and vegetables: Refrigerated vehicles are needed, and the vehicle-track interaction has to be considered when it comes to energy supply. A rolling motorway would provide the chance to use refrigerated semi-trailers fitted with cooling engines, but has some disadvantages e.g. that the drivers have to be accommodated on the train.
In former times, the freight trains connected cities, which represented the market. Today, the rail freight market is not aimed at linking cities, but at linking companies. This makes it necesssary to fit with the companies´ logistical strategies.
3.3 Synthesis: Requirements of current and future freight flows
Synthesizing the requirements for current and future freight flows on the vehicle-track system considering future logistics trends, as described in sections 3.1-3.2, the following subsections outline the future requirements for the specific corridors assessed in SustRail.
From the transport statistics provided in section 3.1 it can be seen that, along all routes, there was a steep decline in rail freight carried after the year 2008. Figure 2.1: EU and national

Page 50 of 73
[Deliverable D2.2] [CO–v2]
freight flows since 1990 (Data sources: European Commission, 2010, Section 3.2.5) puts this phenomenon in context to European rail freight as a whole. The figure shows that the decline in rail freight was not route-specific, but Europe-wide. The reduction in overall European rail freight highlights the impact of the economic downturn as a consequence of the financial crisis. So there are general and route-specific developments that have to be taken into account. This is important in order to not to draw the wrong conclusions from the development in rail freight along a certain route.
3.3.1 Route 1 – Bulgaria
For the future, following the trend of recent years, it can be expected that the share of goods transported to and from the plants of the heavy industry, especially the metalurgical industry, will further diminish. And, as Figure 3.14 ((Woroniuk et al., 2011) suggests, the share of semi-finished and finished goods carried in intermodal loading units will continue to increase. As far as bulk is concerned, there may be a slight increase in the share of coal and petroleum, as the economic development of the country of Bulgaria will go hand in hand with an increased use of energy.
Figure 3.14: Goods structure effect in Bulgarian rail freight (only BDZ)
0%10%20%30%40%50%60%70%80%90%100%
2006 2007 2008 2009 2010
Year
Share
Other:Inputandoutputoftheprimarysector
Vehicles,machinery,(semi‐)finishedproducts
Chemicals
Minerals
Goodsofthemetalurgicalindustry
Petroleumandpetroleumproducts
Coal
In Bulgaria, the prospects for domestic rail freight transport are not so good. There are considerations to better link up domestic railway transport to/from the port of Varna and the black sea Ro/Ro shipping service between Varna (BG) and Poti (GE) operated by UkrFerry. It is also thought that maritime containers can be carried in the hinterland of the port of Varna. In addition to this, the port of Constantza (RO) has shown a significant growth in cargo handling and continues to attract cargo. Bulgaria also belongs to the hinterland of this Romanian port, so that cross-border railway transport services can be developed (Karagyozov, 2011). Experts also believe that the port of Thessaloniki (GR) could remain important to serve the hinterland around Sofia. On the other hand, if the Greek economy recovers, improved transport links through Bulgaria will be important. As Sofia has now its new and efficient terminal, there might be a good chance to attract containerised cargo.
As part of the European TEN-T project, additional intermodal terminals are planned for construction at Plovdiv, followed by terminals at Svilengrad and Dragoman (Woroniuk et al., 2011, p. 14). So, concerning domestic and international (cross-border) transport, intermodal transport is expected to gain in importance. With regard to this certain corridor, it can be anticipated that the intermodal transport will be continental transport (KombiConsult/K+P Transport Consultants, 2009, p. 48).

Page 51 of 73
[Deliverable D2.2] [CO–v2]
The opportunities to develop internatonal transit traffic rail freight are much better. As is the case for today´s transit traffic in Bulgaria, Turkey will play the most important part. According to experts, the opening of a rail tunnel crossing the Bosporus around the year 2014 could offer good prospects. The transit route connecting Ukraine and Romania on the one hand and Greece on the other hand has a much smaller potential primarily due to poor economic situation of Greece (Karagyozov, 2011).
Generally speaking, there is more intermodal transport to be expected. As intermodal loading units, the following will dominate:
45’ pallet-wide high cube containers.
Semi-trailers suitable for vertical transhipment using top-lift by grappler arms.
Conventional semi-trailers without grappler-arm lifting devices carried in the ISU system.
Trucks, road trains, articulated trucks carried on a rolling motorway (AT/HU-TR).
In all, the intermodal traffic on the route observed in SustRail will continue to rely on these continental loading units. This confirms the results of the former analysis conducted in the context of the DIOMIS project (KombiConsult/K+P Transport Consultants, 2009, p. 48).
There can be more cargo expected to be carried on behalf of the automotive industry. In 2011, about 1.2 mill. vehicles were manufactured in Turkey. For 2012, in Turkey, a production record is being anticipated. The vehicle production volume will grow to 2 mill. vehicles by 2015. Especially buses and light commercial vehicles are exported to the EU, whereas Turkey represents Europe´s most important market for all types of light and heavy commercial vehicles (Iskan, 2011) (Trabert, 2011).
In addition to that, Turkey is one of the world´s most leading producers of textiles. In 2009, the clothes export volume was 12 bill. USD (Robert Kümmerlen, 2011). A lot of consumers live in Europe – the EU-27 is the world´s largest importer of clothes - so that there will be a high market potential for rail freight concerning textiles.
Another growing segment could be perishables (fruit, vegetables), which represent cargo with high demands on transit time and punctuality. There seems to be a potential for the carriage of dry fruits and nuts originating in Turkey and bound for Germany and The Netherlands (Rob Konings, no date). Likewise, today, flowers destined for The Netherlands leave Turkey in refrigerated trucks (Kloss, 2011).
3.3.2 Route 2 – Spain
Objectives for 2020
The Spanish Government shares the EU´s policy to promote rail freight transport and believes that increasing rail freight can contribute to realizing the potential of Spain as a logistical platform, reducing external costs and improving the competitiveness of the Spanish economy.
The mission of railway is to return its market position to that of a decade ago. The objective for 2020 is to reach 8-10% of modal share (Ministerio del Fomento, 2010). To reach it, some steps should be taken.
Efficiency should be improved, especially by intermodality and cooperation with other modes of transport. Also different governments and institutions should coordinate their policies. An efficient, integrated, transeuropean and multimodal network should be defined and correctly operated.

Page 52 of 73
[Deliverable D2.2] [CO–v2]
Figure 3.15: Prediction for freight railway transportation in Spain (Ministerio del Fomento, 2010)
Action plan
The action plan is divided in three categories: management, service quality and efficiency and improvement of infrastructure.
Management main actions are (Ministerio del Fomento, 2010):
New management model of Renfe-Operadora’s freight division to a liberalized market-oriented and organized by business areas.
Promoting liberalization, encouraging entry into rail transport agents, shippers and combined transport operators to promote intermodality.
Single management of port and border terminals
Promote the creation of the Agency for Land Transport Safety, with attributions on rail freight transport field.
Enhancement of Railway Regulation Committee.
Development of specific action plans for economic sectors, beginning with the automobile and chemical industry.
Creating a Development Committee for Intermodality.
Service quality and efficiency will be improved by (Ministerio del Fomento, 2010):
Integration of rail transport in the logistics chain.

Page 53 of 73
[Deliverable D2.2] [CO–v2]
Concentrate the demand/supply of multi-modal chains in a global information system that integrates the whole logistic process.
Establish a regulatory framework on technological standards to ensure interoperability within the logistics chain.
Establish real-time tracking of cargo across the logistic chain to facilitate monitoring of the product for customer information.
Studies to promote Rail-Highways.
Implement intelligent systems for automating the management and operation in intermodal terminals.
Grants and incentives for R&D and innovation.
Establish specific training programs for human capital.
This Basic Freight Network will consist on a series of joined logistical nodes. Nodes are ports and intermodal facilities (Ministerio del Fomento, 2010).
The most important measures to develop this network are:
Reducing costs of transportation
Increasing loading gauge and axle load
Efficient break of gauge facilities
Define priority freight corridors
Adapt the network to handle 750 meters length trains
Electrify lines
Remove bottlenecks
Improving port access by rail
Predictions made in 2010 (Ministerio del Fomento, 2010) pointed to an increase in the railway freight transportation activity, both in total goods transported and in modal share.
3.3.3 Route 3 – United Kingdom
In the UK, according to the freight route utilisation study by Network Rail, it is expected that the demand for rail freight will continue to grow by 26-28% by 2014/2015, compared with the year 2007 (Network Rail/Rail Freight Operations’ Association, 2010, p. 33). Important future market segments will remain the carriage of coal (for power production), ore (for the steel industry), and containers (for all kinds of cargo).
Consumer goods transported in containers have been the fastest growing goods category in rail freight over the past six years. This can be seen in Figure 3.12: UK intermodal rail freight transport performance (Woroniuk et al., 2011, p. 17, based on data from ORR National Rail Trends Yearbook 2010-11), and in Figure 3.16: Goods structure in UK rail freight, based upon transport performance (source: Office of Rail Regulation ORR). Even the more moderate growth expected for the future of about 4% would underline the containers´ relevance for rail freight. Regarding the loading gauge, future loading gauge will be W10, so that high cube containers could be carried without any hindrance (Figure 3.17: W10 Clearance Routes (NR)). The routes from Felixstowe and Southampton to Nuneaton have already been upgraded to W10 from April 2011 and chords are being added by 2014 to ease

Page 54 of 73
[Deliverable D2.2] [CO–v2]
the transit of freight along these corridors. High cube containers of an outer height of 9’6’’ (2.90m) are increasingly replacing the world´s fleet of containers of an outer height of 8’6’’ (2.59m). Thus, there is a higher market potential for rail freight, and an increase of the container volumes carried on this line is expected.
Figure 3.16: Goods structure in UK rail freight, based upon transport performance (source: Office of Rail Regulation ORR)
0%10%20%30%40%50%60%70%80%90%100%
2005‐06 2006‐07 2007‐08 2008‐09 2009‐10 2010‐11
Year
Share
Other
DomesticIntermodal
International
Construction
Metals
OilandPetroleum
Coal
Regarding future loading gauge, the UK freight industry and Network Rail have expressed a desire for extensive future clearance to W12 gauge. Network Rail has cleared 135km of route for W12 gauge and does try to achieve W12 wherever a structure is being rebuilt. Hence the BML1 section between Southampton and Basingstoke was actually cleared to W12 gauge and the diversionary route via Andover is being cleared to W12. The loading gauge W12, for example, would allow for the transportation of containers of 9‘6‘‘ height and 2.6m outer width on most wagons. W 11 would be needed for loading units measuring 9‘6‘‘ in height and 2.55m outer width, if FSA type wagons with a loading height of 980mm or KFA type wagons (both are Class R ordinary flat wagons with bogies and 4 axles) with a loading height of 1.000mm were used (Strategic Rail Authority, 2004, pp. 21-22). Continental intermodal loading units such as swap bodies have an outer width of 2.55m. Thus, the major focus of recent gauge enhancements has been W10 which meet the needs of maritime containers but not the continental but work has started on achieving W12 clearance on key intermodal routes.
Another significant aspect is that there are plans to develop new port facilities at Bathside Bay on the other side of the estuary near Harwich, which would increase the number of trains from the combination of Felixstowe and Bathside Bay to 56 trains per day in 2030, which is twice as much as today. Again, this would increase the share of containerised rail freight.

Page 55 of 73
[Deliverable D2.2] [CO–v2]
Figure 3.17: W10 Clearance Routes (NR)

Page 56 of 73
[Deliverable D2.2] [CO–v2]
“As the economy develops, the role of bulk goods traditionally associated with heavy industry will become less pronounced” (Network Rail/Rail Freight Operations’ Association, 2010, p. 34), so, like in Bulgaria, the goods structure effect is also being expected to continue in the UK. Although the demand for Class E ordinary high-sided wagons is still high and will always keep an important share on the market due to specific types of freight (bulk and aggregates), ”...the supply offered by the existing fleets seems to be more than sufficient considering the actual trends” (Ulianov et al., 2011, p. 17). According to Network Rail, new market segments to be opened up for the railways are the transportation of high value, low mass goods. This is in line with the goal of the SPECTRUM project.
The future planned expansion of the port of Felixstowe includes a third terminal capable of taking trains up to 30 wagons in length, which is due for 2012 (Woroniuk et al., 2011, p. 20). In the port of Southampton, there is work underway to increase maximum train length to 775m (Woroniuk et al., 2011, p. 22). One of the main inland terminals is Hams Hall, east of Birmingham, which services trains from both Felixstowe and Southampton and is capable of receiving trains up to 750m in length. For this reason, average train length is expected to increase. Increasing train length will require investment in loops on the network and terminals.
As the loading gauge has been cleared to W10 along the whole length of the two case study route, it is better not to invest in FLA ‘Lowliner’ and FAA Bogie ‘Well’ wagons (Transmodal, 2007b) (MDS Transmodal, 2007a, pp. 27-28). One reason is that smaller wheels (to lower the deck height) show the same disadvantages as for the rolling motorway on the continent: There is more wear and tear, and the maintenance and repair work has to be carried out in shorter time intervals. Second, this increases maintenance cost. A third aspect is the capacity: ‘Lowliner’ wagons have a capacity of 2 TEU, whereas other wagons deployed by Freightliner have a capacity of 3 TEU, while both types have a similar length. This increases the costs per load platform (operating cost per unit). In addition to that, loading capacity is only 18t, and the axle load 8.75t (Ulianov et al., 2011, p. 29). This means that these wagons cannot accommodate heavy container loads. Finally, these wagons are restricted to the British network and not certificated to operate through the Channel Tunnel to mainland Europe. This means that they cannot be used for international intermodal operations, impeding long distance intermodal services for instance between Poland and London. Another solution is the low deck Mega 3 wagon, which allows the transport of high cube container in W9 loading gauge and its capability to run through the Channel Tunnel to the Continent. The disadvantage of the pocket construction of the Mega 3 is, that just 60% of the loading length of the wagon can be used for payload. Especially in the longer term, there may be new opportunities after the prolongation of the HS2 railway line from London to Birmingham and Manchester that is scheduled for 2026, which will have GC extended continental gauge. Unfortunately it can already be foreseen that there will be lack of capacity on HS2 as this is the main corridor with the highest passenger transport volume in Britain. The old will be relieved but can just offer the smaller British gauge (see above).
Regarding bulk, an increase in the transportation of biomass is predicted to take 1/3 to 2/3 of the coal market over the next 15 years (Woroniuk et al., 2011, p. 16).
Finally, the long-term forecasts by commodity for Great Britain provide an insight into the sources of future rail freight growth (Table 2.7: Gaps in co-modality, vehicles and logistics).
Between Q1 2006 and Q1 of 2011 intermodal rail freight grew by 29% whilst there was no actual increase in container volumes at the ports (MDS Transmodal, 2007b). This confirmed MDS’s predictions of continuing strong growth in intermodal freight.

Page 57 of 73
[Deliverable D2.2] [CO–v2]
Table 3.12: Rail freight forecasts by commodity, GB, 2006-30 (MDS Transmodal, 2007b)
Intermodal/wagonload 7.6%
Bulk/semi‐bulk 0.2%
of which: Metals 0.7%
Ore ‐0.7%
Construction 1.5%
Automotive 2.0%
Petro/chemicals 0.6%
Waste 0.0%
Infrastructure 0.0%
Coal ‐0.9%
% per annum growth
in tonnes

Page 58 of 73
[Deliverable D2.2] [CO–v2]
4. CONCLUSIONS AND NEXT STEPS This chapter draws together the main conclusions from the work, including:
implications for future rail vehicle and track requirements (4.1)
the market trends and opportunities to be supported (4.2), and
relevant inputs for subsequent SUSTRAIL Tasks and Work Packages (4.3).
4.1 Implications for future rail vehicle and track requirements
Considering the findings on the current freight flows, the general and route-specific trends, as well as the future market opportunities for rail freight, it follows that the future rail vehicles should be designed to accommodate
cargo with a lower physical density and higher value,
smaller consignments in general,
various types of intermodal loading units (containers, swap-bodies, semi-trailers),
items to be carried in reverse logistics processes (including returns, returned empties, packing material, and other waste).
Sustainable future rail vehicles should
be interoperable in use on different national railway networks,
be ‘intelligent’ (enabling supply chain visibility and vehicle condition monitoring as well as emergency response),
be reliable in operation,
have design features to suit cargo to be carried under current and future market conditions,
have a lower tare weight and an improved aerodynamic performance,
cause less noise,
have track friendly bogies,
be able to run at a higher speed.
Table 4.1: System trends and opportunities for sustainable and competitive rail freight summarises the future logistics requirements on the freight vehicle - track system for the EU three routes assessed in SUSTRAIL.
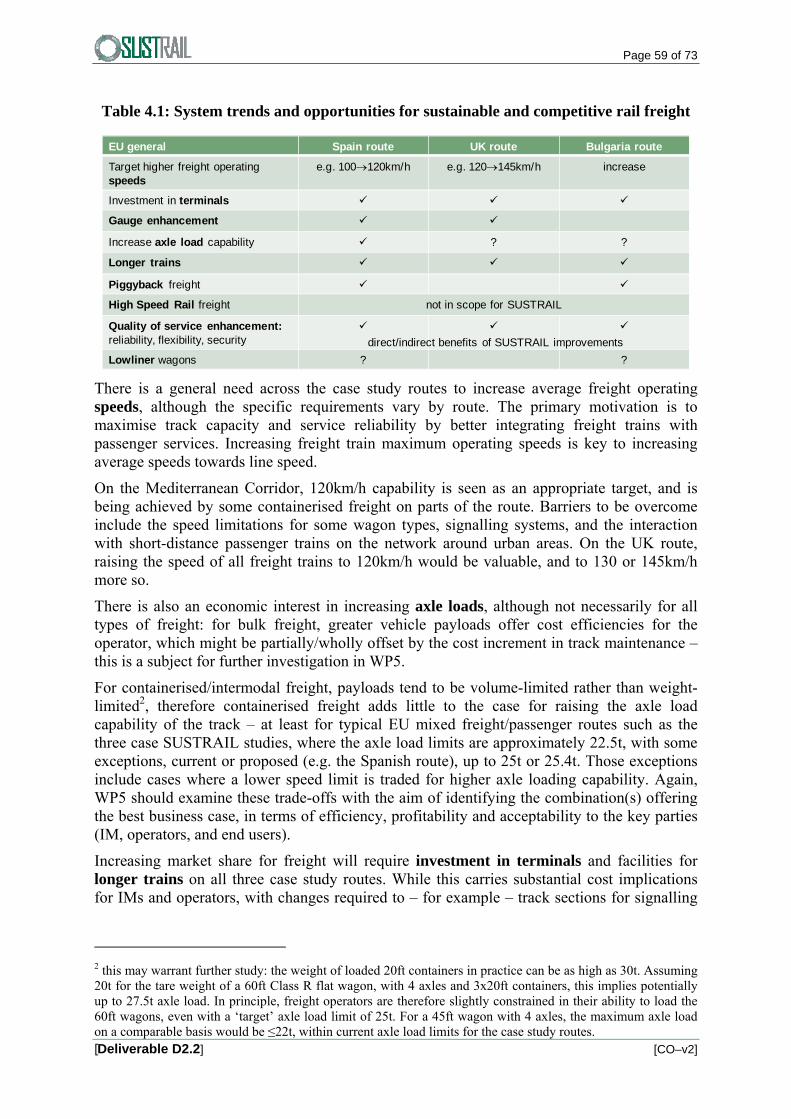
Page 59 of 73
[Deliverable D2.2] [CO–v2]
Table 4.1: System trends and opportunities for sustainable and competitive rail freight
EU general Spain route UK route Bulgaria route
Target higher freight operating speeds
e.g. 100120km/h e.g. 120145km/h increase
Investment in terminals
Gauge enhancement
Increase axle load capability ? ?
Longer trains
Piggyback freight
High Speed Rail freight not in scope for SUSTRAIL
Quality of service enhancement: reliability, flexibility, security
Lowliner wagons ? ?
direct/indirect benefits of SUSTRAIL improvements
There is a general need across the case study routes to increase average freight operating speeds, although the specific requirements vary by route. The primary motivation is to maximise track capacity and service reliability by better integrating freight trains with passenger services. Increasing freight train maximum operating speeds is key to increasing average speeds towards line speed.
On the Mediterranean Corridor, 120km/h capability is seen as an appropriate target, and is being achieved by some containerised freight on parts of the route. Barriers to be overcome include the speed limitations for some wagon types, signalling systems, and the interaction with short-distance passenger trains on the network around urban areas. On the UK route, raising the speed of all freight trains to 120km/h would be valuable, and to 130 or 145km/h more so.
There is also an economic interest in increasing axle loads, although not necessarily for all types of freight: for bulk freight, greater vehicle payloads offer cost efficiencies for the operator, which might be partially/wholly offset by the cost increment in track maintenance – this is a subject for further investigation in WP5.
For containerised/intermodal freight, payloads tend to be volume-limited rather than weight-limited2, therefore containerised freight adds little to the case for raising the axle load capability of the track – at least for typical EU mixed freight/passenger routes such as the three case SUSTRAIL studies, where the axle load limits are approximately 22.5t, with some exceptions, current or proposed (e.g. the Spanish route), up to 25t or 25.4t. Those exceptions include cases where a lower speed limit is traded for higher axle loading capability. Again, WP5 should examine these trade-offs with the aim of identifying the combination(s) offering the best business case, in terms of efficiency, profitability and acceptability to the key parties (IM, operators, and end users).
Increasing market share for freight will require investment in terminals and facilities for longer trains on all three case study routes. While this carries substantial cost implications for IMs and operators, with changes required to – for example – track sections for signalling
2 this may warrant further study: the weight of loaded 20ft containers in practice can be as high as 30t. Assuming 20t for the tare weight of a 60ft Class R flat wagon, with 4 axles and 3x20ft containers, this implies potentially up to 27.5t axle load. In principle, freight operators are therefore slightly constrained in their ability to load the 60ft wagons, even with a ‘target’ axle load limit of 25t. For a 45ft wagon with 4 axles, the maximum axle load on a comparable basis would be ≤22t, within current axle load limits for the case study routes.

Page 60 of 73
[Deliverable D2.2] [CO–v2]
and passing loops, the implications for vehicle and track design are limited and will not be a key focus for the SUSTRAIL research.
Gauge is an issue for the Bulgarian, Spanish and UK networks, in order to accommodate the forecast freight growth and take advantage of market opportunities. For the UK case study route, a consistent W10 loading gauge has been achieved, and for realism should be assumed to remain in place in future. Opportunities for increasing piggyback freight are judged to be significant in the EU as a whole, though are not directly applicable to the UK case study given gauge restrictions. Lowliner wagons are of potential interest to maximise the dimensions of containers carried, given fixed gauge restrictions, however smaller wheels and associated vehicle-track interaction and maintenance issues would require to be investigated.
High speed rail freight is an interesting specialist market with competitive advantages for express freight (including parcel/palletised freight), vis-a-vis air and road modes. It is, however, a very specific market with unique technical requirements for high speed operation, that would warrant separate study. Therefore a decision was reached to focus SUSTRAIL on the majority of the EU rail freight market – at maximum operating speeds in the range 120-160km/h, with particular interest in the lower half of that range.
The market analysis highlighted quality of service enhancement as key to European rail freight growth, including a focus on reliability, security, flexibility and visibility (tracking). There is potential for SUSTRAIL to impact directly or indirectly on some of these issues, particularly reliability which is a key focus of the project. Visibility is at best remotely related to the vehicle design work planned for SUSTRAIL and will be treated as essentially ‘out-of-scope’.
These above factors will therefore be used:
as criteria to guide vehicle and infrastructure design work in SUSTRAIL;
as criteria in the Business Case (WP5) for the SUSTRAIL innovations.

Page 61 of 73
[Deliverable D2.2] [CO–v2]
4.2 Market trends and opportunities to be supported
Table 4.2: Market trends and opportunities for the SUSTRAIL routes
EU general Spain route UK route Bulgaria route
Support intermodal market growth (high value, fast growing)
ports; consumer goods
Automotive, specialist wagons
Oil and petroleum, tank wagons
Metals, flat wagons
Wood, flat wagons
Construction materials
Continuing high flows of coal, using E/F wagons
Chemical industry inputs
Transit traffic: growth markets -east, Turkey
Biomass
Recyclates
Capture more of high value, low density, time sensitive markets(ERRAC, RETRACK)
As part of this task, the partners carried out an assessment of current flows, market trends and opportunities, held a Workshop at which IM and freight operator representatives input their experience and forward-looking perspectives, and prepared a synthesis of the findings. The main conclusions arising from this work, summarising from this Deliverable, are as follows:
(i) The SUSTRAIL research should support growth in the intermodal market, EU-wide and include import and export flows. This sector is both fast-growing and high-value, and has a strong cross-border dimension. The potential benefits for countries with maritime ports such as Spain and the UK will include the enhancement of inland connectivity, as part of a more sustainable and competitive overall logistics sector. The potential benefits for countries with high levels of transit traffic will be exemplified by the Bulgarian case study, where already 50% of rail freight is transit traffic and the fastest-growing flows are with trading partners oustide the EU to the east and south. Consumer goods are a key component of this traffic for the future, with a view to increasing substitution for road freight on congested corridors.
(ii) There are further specific market segments in which there is potential for rail freight growth, including:
the automotive industry, in which EU countries continue to see major operations – not only in finished vehicles which typically require specialist wagons, but in components which can be carried in a range of intermodal vehicle types;

Page 62 of 73
[Deliverable D2.2] [CO–v2]
oil/petroleum/energy products and chemicals, which continue to be important markets although the nature of the products in continually evolving – e.g. the shift towards biofuels;
metals, which remains a medium-to-high value market, although the geography of suppliers is shifting with globalisation;
wood products – particularly in countries with this specialism in trade, represented by Bulgaria among the three case studies;
construction materials to support expected continuing urbanisation;
continued high flows of coal in specific countries, e.g. Bulgaria and UK, where it is used particularly in power generation, whether imported or domestic;
growing markets in biomass and recyclates.
(iii) There are economies of scope in addressing these markets since elements of the track-train system are common to multiple markets, for example:
the widespread use of Y25 bogies (and derivates thereof such as the Y33 and LTF 13, which are used not only for high-sided box wagons (UIC Class E) but also for container flats (UIC Classes R,S));
the ability of certain vehicle types to serve multiple markets – e.g. container flats (UIC Classes R,S) to serve automotive component flows, consumer goods and other forms of containerised/intermodal freight, and high sided box wagons (UIC Class E) to serve a range of dry bulk traffic.
This creates an opportunity to benefit a wider range of commodity flows with a common set of vehicle and track innovations.
(iv) These future market trends and opportunities now need to be investigated in greater depth in the context of the vehicle and track characteristics and requirements identified to date. There are cost, revenue and benefit implications of different configurations of speed, axle load, wagon design and operating regime. This is the focus of the Business Case development forthcoming in WP5, which will be carried out in parallel with the research into vehicle and infrastructure development in WP3&4.
Page 63 of 73
[Deliverable D2.2] [CO–v2]
4.3 Relevant input for subsequent SUSTRAIL Tasks and WP5
Within the SUSTRAIL project, WP5 will evaluate the Business Case for a future freight vehicle-track system supplying a higher delivered tonnage. Recommendations will be made for whole-system implementation, including phasing-in of novel technologies and strategies for the equitable redistribution of whole-system savings.
WP5 will provide an iterative filter:
initially, the Business Case framework will inform the selection among a long list of potential innovations, including vehicle and track developments and combinations of both of these;
in the later stages of the SUSTRAIL project, WP5 will evaluate a Business Case for the preferred option with regard to the vehicle and track system. The assessment will include quantifying the Life Cycle Cost (LCC) of each option and a Reliability, Availability, Maintenance and Safety (RAMS) analysis where the parameters for this analysis are informed by the duty requirements established in WP2.
In the next stage of WP2 (Task 2.5), the duty requirements generated by the preceding tasks 2.1-2.4 will be prioritised, which will focus the vehicle and track design research in WP3 and WP4. Therefore key inputs from this task (2.2) are: the focus on particular vehicle and track requirements in this deliverable; and the initial assessment of the markets to be addressed. Task 2.2 has served to identify and consider the range of markets and physical requirements, to recommend a focus on some of these in particular, and to begin to screen out those which are out of scope for SUSTRAIL (e.g. high speed rail freight).
Among the key lessons for WP5 from this work are the findings relating to:
drivers of rail freight revenue and flow, including the identification of high value traffic and key market segments;
the identification of customer requirements in the transport value chain, including key variables in market demand such as reliability, flexibility, security and traceability;
current performance issues on the EU network, as perceived by the freight operators and IMs in particular, and specific elements of the whole vehicle-track system where relaxation of current constraints could open up growth opportunities and new markets offering significant added value; and
the need to optimise, given multiple variables driving performance on the cost side and on the revenue side, and trade-offs evident between them – exemplified by the selection of targets for maximum freight operating speed on one hand, and axle loads limits on the other.
The review of European research has also re-emphasised the value of preventative maintenance strategies for vehicles and track, which the LCC analysis in WP5 aims to capture. Specifically in vehicle maintenance, in line with the ERRAC Freight Roadmap, it is expected that preventative axle bearing condition monitoring will lead to a decreased failure rate on freight wagons. By monitoring the wagons and anticipating their degradation in speed, wagons will be taken out of duty when they have reached a cost-efficient maintenance limit, instead of using a costly, lifetime-decreasing safety limit. Preventive maintenance allows for higher efficiency, whereas a reactive maintenance strategy leads to expensive corrective maintenance. New ICT such as the online data warehouse InteRRis supports preventive maintenance.

Page 64 of 73
[Deliverable D2.2] [CO–v2]
GLOSSARY Definitions of key metrics
Axle load:
The axle load limits the payload of a rail freight wagon. It is measured in tonnes (t).
vehiclerailtheofaxlesofnumber
tonscargoofweighttonswagonoftareloadaxle
Codification:
The appropriate combination of loading gauge, vehicle and loading unit in intermodal transport is defined through a codification which must fit. The capital letters “C” for containers and swap bodies and “P” for semi-trailers in pocket wagons are used to differentiate between loading units. The 2 or 3 digit figures describe by a definition which width and height the loading has or is allowed on a line by using a specific wagon.
Line classification:
There are different line categories for managing the interface between load limits of vehicles and rail infrastructure. The line classification is derived from the axle load and the load per metre. The line classes are standardised in UIC leaflet 700 as well as in EN 15528:2008.
Loading gauge:
The loading gauge is the maximum height and width in cross section of a railway line available for the load on a wagon. No part of the wagon or of the cargo is allowed to exceed the loading gauge. The loading gauge must fit into the clearance gauge.
Mass:
The mass represents the weight and is expressed in tonnes (t).
Mass per unit length:
The mass per unit length is the maximum gross mass per unit length of a vehicle and limits the payload of a rail freight wagon.
metresbuffersoverlength
tonscargoofweighttonswagonoftaremetreperLoad
Payload:
Payload is the maximum allowable weight of the cargo that can be carried, measured in tonnes (t), taking into account vehicle´s tare and maximum gross mass.
Speed:
The speed is expressed in kilometres per hour (km/h). A distinction has to be made between the maximum speed allowed by the rail infrastructure and the maximum speed allowed by the rail vehicle or train characteristics. Line speed means the running speed. Besides, there is the average speed, taking into account slowing down and resumption of speed.
Tare:
Tare is the mass of an unloaded vehicle. It is measured in tonnes (t).

Page 65 of 73
[Deliverable D2.2] [CO–v2]
Train length:
Train length is expressed in metres (m). In this report, maximum and average train length are addressed.
Train weight:
Train weight is expressed in tonnes (t). In this report, maximum and average train weight are addressed.

Page 66 of 73
[Deliverable D2.2] [CO–v2]
REFERENCES
Aberle, G., 2009. Transportwirtschaft - Einzelwirtschaftliche und gesamtwirtschaftliche Grundlagen. 5 ed. München: Oldenbourg.
ADIF, 2011. Declaración sobre la red de ADIF, s.l.: s.n.
ADIF, no date Cuadro de cargas máximas, s.l.: s.n.
AECOM and Institute for Transport Studies, 2010. Freight Modal Choice Study: Phase 1 Conclusions – Drawing Together Evidence, Final Report, London: Department for Transport.
Anon., 2011. New high speed line in Spain. todays railways Europe 182.
CREAM Partners, 2009. Sofia Terminal Declaration. [Online] Available at: http://www.cream-project.eu/download/service/CREAM_Terminal-Declaration-Sofia_2009.pdf [Accessed 12 12 2012].
Ecologistics Ltd., 2010. Ecologistics launch the container train service. [Online] Available at: http://www.ecologistics.bg/en/?pageID=11&news=Ecologistics-launch-the-container-train-service [Accessed 12 12 2011].
ERA, 2012. The European Railway Agency at a glance. [Online] Available at: http://www.era.europa.eu/Pages/Home.aspx [Accessed 19 01 2012].
Erlinger, M., 2012. Streckenklasse_NRIC_C11, Wien: Rail Net Europe.
ERRAC, 2011. ERRAC WORK PACKAGE 02: Encouraging modal shift (long distance) and decongesting transport corridors. Draft Freight Roadmap, May ed. s.l.:s.n.
Europe Intermodal, 2008. AdriaKombi Turkey. [Online] Available at: http://www.europeintermodal.com/ [Accessed 09 12 2011].
European Automobile Manufacturers Association (ACEA), 2011. The Automobile Industry Pocket Guide 2011. Belgium: ACEA.
European Commission, 2001. EU White Paper on Transport COM(2001) 370, s.l.: s.n.
European Commission, 2001. White Paper, European transport policy for 2010: time to decide. s.l.:s.n.
European Commission, 2006. Keep Europe Moving- Sustainable mobility for our continent, mid-term review of White Paper 2001 European transport policy for 2010: time to decide. s.l.:s.n.
European Commission, 2010. EU Energy and Transport in Figures, Statistical Pocketbook. Luxembourg: Publications Office of the European Union.
European Commission, 2011. Transport: Action Plan and Directive - European commission. [Online]
Page 67 of 73
[Deliverable D2.2] [CO–v2]
Available at: http://ec.europa.eu/transport/its/road/action_plan/action_plan_en.htm [Accessed 13 01 2012].
European Commission, 2011. White Paper 2011: Roadmap to a Single European Transport Area - Towards a competitive and resource efficient transport system. s.l.:s.n.
Eurostat, 2011. Eurostat - Data Explorer - Annual number of empty and loaded intermodal transport units carried on railways (number, TEU). [Online] Available at: http://appsso.eurostat.ec.europa.eu/nui/show.do?dataset=rail_go_contnbr&lang=en [Accessed 14 12 2011].
Eurostat, 2011. Eurostat - Data Explorer - Number of wagons. [Online] Available at: http://appsso.eurostat.ec.europa.eu/nui/show.do?dataset=rail_eq_wagon_n&lang=en [Accessed 13 12 2011].
Eurostat, 2012. Transport – Data – Main Tables. [Online] Available at: http://epp.eurostat.ec.europa.eu/portal/page/portal/transport/data/main_tables [Accessed 29 02 2012].
Express-Interfracht, 2010. Express Interfracht - Balkan Train. [Online] Available at: http://www.express-interfracht.at/en/Our_product_trains/Balkan_Train/index.jsp [Accessed 12 12 2011].
FERRMED, kein Datum Supply/Demand, Technical and Socio-economic GLOBAL STUDY of FERRMED Great Axis Network and its Area of influence , s.l.: s.n.
Ineco-ADIF, 2011. Estudio del Corredor Ferroviario Mediterráneo, s.l.: s.n.
Innofreight, 2008. Innofreight WoodTainersystem kommt in Bulgarien zum Einsatz! / Innofreight WoodTainersystem започва да се използва в България!. [Online] Available at: http://www.innofreight.com/_innofreight/6_news/Bulgarien_Start.php [Accessed 09 12 2011].
Institute of Shipping Economics & Logistics, 2010. Containerisation International Yearbook. s.l.:s.n.
Iskan, S., 2011. Autoteile nehmen die Bahn. DVZ, Issue 146 Sonderbeilage Türkei, p. 10.
J Eckhardt, A. P., 2010. Review of well known logistics concepts adopted during last decade (Final Draft Ver3). [Online] Available at: http://www.efreightproject.eu/knowledge/DownloadFile.aspx?tableName=tblSubjectInfo&field=Skema%20Study%20Filename1&idField=subjectInfoID&id=52 [Accessed 13 01 2012].
Jablonski, A., 2011. SustRail WP1 workshop. Paris: s.n.
Karagyozov, K., 2011. [Interview] (25 11 2011).
Kloss, K., 2011. Augsburger Erfolgskiste. DVZ, Issue 146 Sonderbeilage Türkei, p. 3.
Kloss, K., 2011. Deutscher Markt treibt das Geschäft an. DVZ, 65(152), p. 6.
KombiConsult/K+P Transport Consultants, 2009. DIOMIS - Evolution of intermodal rail/road traffic in Central and Eastern European Countries by 2020 - Bulgaria, Paris: UIC.

Page 68 of 73
[Deliverable D2.2] [CO–v2]
Konings, R. & Vleugel, J., kein Datum Temperature-controlled cargo logistics: market analysis of Dutch transports of selected food products, Delft: s.n.
Kraan, M. W. S. a. V. H. M., 1997. High speed freight transport: first steps towards intra-European high speed freight transport by rail, The Netherlands: Research Unit for Integrated Transport Studies.
Kümmerlen, R. & Schulze, M., 2011. Die Produktion kommt zurück. LOG.Kompass, 07 12, pp. 6-9.
Lekse, J., 2009. x-11 Catalogue for TT 2013. [Online] Available at: http://www.rne.eu/index.php/corridor-info/items/Corridor_11.html [Accessed 20 02 2012].
MDS Transmodal, 2007a. Kent International Gateway - Assessment of Railway Connectivity and Site Layout. [Online] Available at: http://www.maidstone.gov.uk/files/kentgateway/Rail%20connectivity%20report.doc [Accessed 08 11 2011].
MDS Transmodal, 2007b. Rail Freight Forecasting to 2030. [Online] Available at: http://www.mdst.co.uk/attachments/downloads/206009_rail%20freight%20forecasts%20Feb%202008.pdf [Accessed 18 01 2012].
Ministerio del Fomento, 2010. Plan estratégico para el impulso del transporte ferroviario de mercancías en España, Madrid: s.n.
Network Rail/Rail Freight Operations’ Association, 2010. Value and Importance of Rail Freight, s.l.: Network Rail.
NRIC, 2010. National railway Infrastructure Company - network statement. [Online] Available at: http://www.rail-infra.bg/cms/export/backup/gallery/downloads/network_statement/Network_statement.pdf [Accessed 20 02 2012].
OECD, 2010. Globalisation, Transport and the Environment. Paris: OECD Publishing.
Organisation Internationale des Constructeurs d’Automobiles (OICA), 2012. 2010 Production Statistics. [Online] Available at: http://oica.net/category/production-statistics/ [Accessed 29 02 2012].
Peter Brett Associates LLP, 2009. Freight Modal Choice Study: Behavioural barriers and factors influencing modal choice, London: Department for Transport.
Petersen, M. e. a., 2009. Report on Transport Scenarios with a 20 and 40 year Horizon, Final report, Copenhagen: Funded by DG TREN.
RENFE Freight division, kein Datum Sociedades Mercantiles. [Online] Available at: http://www.renfe.com/empresa/mercancias/index.html [Accessed 23 01 2012].
RETRACK, 2012. RETRACK - REorganisation of Transport networks by advanced RAil freight Concepts. [Online] Available at: http://www.retrack.eu [Accessed 19 01 2012].

Page 69 of 73
[Deliverable D2.2] [CO–v2]
Ruschke, E., 2011. [Interview] (09 12 2011).
Sessa, C. a. E. R., 2009. EU transport demand: Trends and drivers, s.l.: Paper produced as part of contract ENV.C.3/SER/2008/0053 between European Commission Directorate-General Environment and AEA Technology plc..
Strategic Rail Authority, 2004. Gauging Policy. [Online] Available at: http://www.joycewhitchurch.care4free.net/Gaug_Pol.pdf [Accessed 12 01 2012].
Studiengesellschaft für den kombinierten Verkehr, 2004. Ford/Transfesa: Orientexpress für die Automobillogistik. SGKV- Rundschreiben, Issue 10, pp. 10-11.
Studiengesellschaft für den kombinierten Verkehr, 2004. Profilerweiterung hilft Hinterlandverkehr der südostenglischen Häfen Tilbury und Felixstowe. SGKV-Rundschreiben, 7, pp. 16-18.
Studiengesellschaft für den kombinierten Verkehr, 2005. Noch eine neue Bahnverbindung für Kühne + Nagel. SGKV-Rundschreiben, 10, p. 5.
SUSTRAIL, 2011. SUSTRAIL Grant Agreement Annex I - "Description of Work", s.l.: s.n.
Trabert, H., 2011. Ford fährt zwischen Köln und Kösekoy. DVZ, Issue 146 Sonderbeilage Türkei, p. 11.
Transmodal, M., 2007b. Rail Freight Forecasting to 2030. [Online].
TRANSvisions, 2009. Task 2 Report “Quantitative Scenarios”, Study on Transport Scenarios with a 20 and 40 Year Horizon, s.l.: Service contract A2/78 2007 for EC DG TREN.
UIC International Union of Railways, 2011. Railisa - The UIC Statistics Database. [Online] Available at: http://uic.asso.fr/spip.php?article1352 [Accessed 13 12 2011].
Ulianov, C., 2011. SustRail WP1 workshop. Paris: s.n.
Ulianov, C., et al., 2011. SustRail D1.3: Overview of common freight wagon vehicles and economic data Version 1, s.l.: s.n.
UNILEEDS, 2012. Which freight market trends should SUSTRAIL support/develop?, Madrid: s.n.
Uniresearch, 2012. ReTrack - Reorganisation of Transport networks by advanced Rail freight Concepts. [Online] Available at: http://www.retrack.eu/ [Accessed 13 01 2012].
University of Westminster , 2010. Freight Modal Choice Study: Addressable Markets, London: Department for Transport.
WBCSD World Business Council for Sustainable Development, 2004. Mobility 2030: Meeting the Challenges to Sustainability. The Sustainable Mobility Project, Full Report , s.l.: WBCSD World Business Council for Sustainable Development.
Woroniuk, C. et al., 2011. SUSTRAIL - Route summary: Logistics, local freight market and whole system economics - Deliverable D1.5, version 001, s.l.: s.n.

Page 70 of 73
[Deliverable D2.2] [CO–v2]
APPENDIX A – QUESTIONNAIRE
Selected line: general route characteristics
General route characteristic about the selected line have been collected in task 1.5. Considering that this data is very useful for defining the traffic flow through the selected line, it should be important to reconsider this information.
The definition of the selected line could be done according to the following main points:
Route maximum speed by sections for freight movement. Maximum length allowed to the freight train composition. Maximum weight allowed to the freight train composition. Maximum weight allowed to single freight wagon. Maximum rail loading gauge. Existing constraints on the line for the transportation of dangerous goods. Maximum axle load allowed to freight wagons. Mass per unit length. geometric aspects regarding wheel-base Line classification (according to EN 15528:2008 / UIC700).
Selected line. Data about traffic flow of freight trains
In order to define a trend, data about the last years are needed. Due to the particular economic situation, actual data does not totally represent a good reference for the study. For this reason the IM will provide data based on the last years (a good data sample, could be considered a time interval not less to 5 year, if possible)
A full study allowing making a trend could be based on the three kinds of data:
Moved freight general data Estimated average data Statistic data
Moved freight general data:
Mass transported (tonnes) Mass transported (tonne-kilometre) Gross hauled tonnage Total freight railway transports (number of trains) Total wagons. Categorisation of vehicles (according to EN 15528:2008 / UIC700).
Estimated average data:
Average speed of the freight train compositions (or average time it takes to travel the section or line studied).

Page 71 of 73
[Deliverable D2.2] [CO–v2]
Average length of the freight train compositions. Average axle load of the freight train compositions.
Statistic Data
A. Good transported by type according to NSTR main groups (in tonnes or percentage of the total): Goods transported in containers. Raw materials, bulk and transportation of special materials (by dimension or
weight). Steel materials, construction materials such as precast concrete, wood, paper, dry bulk (coal, cement, grain, aggregates, fertilizer, etc…) or liquids (fuels, chemicals...).
Transportation of cars or vehicles in special wagons, containers or flat wagon. Other special products.
B. Wagons type (number or percentage of the total): Intermodal wagons (Container, swap bodies, trailer). Open wagons. Covered wagons or boxcars. Flat wagons for transporting rods, beams, pipes, rails, coils, etc… Tank wagons. Hoppers wagons Autoracks for transportation of unlades automobiles. Others.
C. Wagons classification (number or percentage of the total) (According to EN 15528:2008 / UIC700).
D. Value of the different freight flows in selected the line (Statistics of the revenue generated from the different goods transported / different markets).

Page 72 of 73
[Deliverable D2.2] [CO–v2]
APPENDIX B – WORKSHOP ATTENDANCE
‘Which freight market trends should SUSTRAIL support/develop?’
SUSTRAIL Task 2.2.2 Workshop
25th January 2012
held at Universidad Politécnica de Madrid Escuela Superior de Ingenieros Industriales
Calle José Gutiérrez Abascal, 2
28006 Madrid Spain
Attendees
Partner*/Organisation Name
RENFE Group Margarita Risueño
Rosa Martín
TRAIN* Valeria Bagliano
NR* Andrew Jablonski
ADIF* María García Santiago
Enrique Mario García Moreno
MARLO* Roland Frindik
Tilman Platz
UNEW* Dewan Islam
MMU* Simon Inwicki
UNILEEDS*
John Nellthorp
Phill Wheat
Tony Whiteing
USFD* David Fletcher
Adam Beagles
UPM Guest Javier Romero (CDTI and UPM)
Jose Cañizares (AEC, formerly RENFE)
UPM*
Juan de Dios Sanz Bobi
Roberto Loiero
Juan Andrés Brunel Vázquez
Andrés Moreno
Isaac Sanz Yela

Page 73 of 73
[Deliverable D2.2] [CO–v2]
APPENDIX C – WORKSHOP AGENDA
Agenda: ‘Which freight market trends should SUSTRAIL support/develop?’
SUSTRAIL Task 2.2.2 Workshop 25th January, UPM, Madrid
Participants invited
IMs : ADIF Network Rail
Operators: BDZEAD RENFE
Research team: UNILEEDS MARLO LTU UPM VTU
UNEW MMU USFD TRAIN
Agenda
Time Topic Speaker09:00 Coffee
09:30
Lunch 13:00
17:00
Welcome JdDSB
Introduction to the SUSTRAIL project AJ,TP
Workshop Introduction;
Presentation and discussion of findings:
Current flows on case study routes
Freight market trends and new market opportunities
Insight from freight / logistics EC projects
Broad requirements of future freight flows
JN
JN
AEW
DI
TP
Open discussion – strategic questions
what are implications for operators? (e.g. RENFE)
are the market opportunities discussed realistic?
do they relate to operators’ own strategic agendas?
Discussion & selection of market trends and opportunities
JN
Conclusions JN
The participants invited include: Operator and IM representatives, the SUSTRAIL Task 2.1-2.5 leaders, WP3&4 leaders, and Case Study partners.