london freight plan - bestufs · london freight plan sustainable freight distribution: a plan for...
TRANSCRIPT

�
London Freight Plan sustainable freight distribution: a plan for London
Transport for London
MAYOR OF LONDON

Foreword by Mayor Ken LivingstoneThe success of London is dependent on the efficient movement of goods and services as well as people. The growth of London, as set out in my London Plan, will lead to an increase in freight movement to construct, supply and service London’s economy in a sustainable way.
Sustainable freight distribution: a plan for London has been produced to support this sustainable development of London by giving clear guidance and direction to complement the freight policies in my Transport Strategy and to support my Climate Change Action Plan. It recognises a need to improve the efficiency of the freight sector whilst also reducing the environmental and social impacts of freight transport on London, particularly our contribution to climate change. Achieving sustainable freight distribution in London will make a real and positive contribution to improving the lives of those who live, work and visit London.
This Plan clearly identifies the key leading role that Transport for London must play to ensure that improvements are made. However such ambitions cannot be delivered by Transport for London alone. Partnership is needed to help develop and fund these initiatives. With the whole-hearted support of the boroughs and the freight industry, together we will be able to make a real difference to the way in which freight activities can sustainably provide for the future needs of the Capital.
Ken Livingstone Mayor of London

�
Document structure
Part A: Executive summary.
Part B: About the Plan - Outlines the vision and objectives of Sustainable freight distribution: a plan for London, describing the context, and the challenges imposed by the growth of London and climate change. It details how freight is considered in the planning framework, explains why there is a strong need for partnership and outlines the shortage of freight data.
Part C: Freight operational challenges - Draws out the key issues identified by freight stakeholders by sector and mode, developing the key operational challenges to be addressed by the Plan to complement the policy and strategic challenges set out in Part B.
Part D: Plan delivery - Details the delivery proposals for the Plan developed to meet the challenges identified in Parts B and C, together with monitoring proposals and funding.
Definition - sustainable freight distribution
This Plan defines sustainable freight distribution as ‘the balanced management and control of the economic, social and environmental issues affecting freight transport that:
Complies with or exceeds environmental standards, regulations or targets aimed at reducing emissions of climate change gases, improving air quality and minimising impacts from accidents, spillages or wastes
Ensures freight is run efficiently, reduces unnecessary journeys, minimises journey distances and maximises loads with effective planning
Complies with labour, transport and human rights standards and regulations ensuring that employees and communities affected by freight can function in a healthy and safe environment
Minimises the negative impacts of freight activities on local communities’
•
•
•
•
Executive summary
�
’…the safe, reliable and efficient movement of freight and servicing trips to, from, within and, where appropriate, through London to support London’s economy, in balance with the needs of other transport users, the environment and Londoners’ quality of life…’
�
Context
A.�. Sustainable freight distribution: a plan for London (the ‘Plan’) sets out the steps that have to be taken over the next five to ten years to identify and begin to address the challenge of delivering freight sustainably in the Capital.
A.�. The Plan recognises the vital role that freight plays in maintaining London as a world class city. Keeping freight moving efficiently in London is not just vital for London’s economy but also for the UK economy.
A.�. This Plan deals with problems and challenges that are complex and not easy to solve. Little has been done to address the freight agenda in London or nationally in a coordinated way for over �0 years, and there are few directly transferable examples from other world class cities. Data on freight movements is not as readily available as that for the movement of people. Securing reliable access to data on van activities is particularly difficult.
A.4. This document is the culmination of work by the London Sustainable Distribution Partnership (LSDP), Transport for London (TfL), the London boroughs and a large number of businesses, freight operators, bodies and associations.
A.5. The planned growth of London will lead to a �5 per cent growth in demand for freight and servicing by �0�5�. Without intervention this will increase freight’s impact on congestion and climate change. The Plan therefore recognises that freight operators have a significant role to play in supporting the climate change agenda by adopting green fleet management - a key part of delivering freight sustainably.
A.6. Those employing freight operators also have to take a positive lead in requiring the adoption of these sustainable freight practices. The Greater London Authority (GLA) Group will take a leading role and use its strong links to promote the same with London’s boroughs and the Corporation of London (the ‘boroughs’) and other public sector bodies such as health and education establishments.
� TfL (�007) Transport 2025 Transport vision for a growing world city

Executive summary
4
Vision
A.7. The vision for sustainable freight distribution in London is for:
’…the safe, reliable and efficient movement of freight and servicing trips to, from, within and, where appropriate, through London to support London’s economy, in balance with the needs of other transport users, the environment and Londoners’ quality of life…’
Climate change
A.8. The Plan supports the Mayor’s Climate Change Action Plan� and informs future changes to the Mayor’s London Plan, transport, environmental and related strategies.
A.9. Based on �006 data, the estimated contribution from freight transport in London is �.�m tonnes of carbon dioxide (CO�) emissions, which accounts for �� per cent of the total ground-based transport and 5.� per cent of the Capital’s CO� production and energy use. The Mayor’s Climate Change Action Plan identifies the potential for savings of �.7m tonnes of CO� per year (mt/y CO�) by �0�5. London will achieve a 0.7 mt/y CO� saving without central government intervention. In line with the Mayor’s revisions to the London Plan an interim target of a �0 per cent reduction in CO� by �0�5 has been adopted, which is a reduction of 0.47 mt/y.
A.�0. More detailed analysis than that undertaken in the Climate Change Action Plan has been undertaken for the production of this Plan to better understand what the possible CO� reductions may be for freight. This analysis indicates up to �.��mt/y of CO� could be saved by �0�5.
Delivery plan
A.��. The Plan contains proposals to deliver real improvements on the ground, alongside others designed to improve understanding of the issues around freight and to contribute to the longer term process of addressing London’s transport needs.
A.��. To implement the proposals, it is essential to develop new relationships and ways of working between the wide range of public bodies, including those in the health and education sector, businesses and operators with a stake in the
� Mayor of London (�007) Action Today to Protect Tomorrow, The Mayor’s Climate Change Action Plan

5
freight industry. The Plan articulates roles and responsibilities to help realise the benefits made possible by this partnership working.
A.��. The Plan clearly identifies that the LSDP and Freight Quality Partnerships (FQPs), particularly at sub-regional level, will play a key role in its delivery.
A.�4. The Plan identifies four key projects and three workstreams for delivering freight in London more sustainably. This allows freight challenges to be combined into a clear delivery programme.
A.�5. The four key projects are:
1) Freight Operator Recognition Scheme
The Freight Operator Recognition Scheme will employ a tiered set of membership levels to address fleet and freight vehicle operational efficiency, improving all areas of sustainable distribution to reduce CO� emissions, congestion, collisions and operator costs. It will recognise legal compliance as the base ‘bronze’ level and promote the uptake of best practice covering fuel efficiency, alternative fuels and low carbon vehicles, management of road risk, legal record keeping and reducing penalty charge notices through the higher ‘silver’ and ‘gold’ levels. It will also recognise operator achievements with rewards that encourage operators to raise standards to reduce, in particular, CO� emissions and collisions between heavy goods vehicles (HGVs) and cyclists.
The project links with bespoke London training for drivers and managers through the London Freight Booster which incorporates a National Vocational Qualification (NVQ) Level �. The aim is to promote safer and more fuel efficient operations through better driver behaviour with lower CO� emissions and fewer collisions, particularly between HGVs and cyclists. This will be coordinated by a dedicated Commercial Vehicle Education Unit with integrated enforcement and prohibition powers.
The project will set Freight Operator Recognition Scheme Standards, a quality benchmark for use by clients when awarding servicing, maintenance and supply contracts. This provides a simple way for clients to ensure the sustainable credentials of freight operators.
The scheme’s main partners include the Metropolitan Police Service (MPS), Health and Safety Executive (HSE), Vehicle and Operator Services Agency (VOSA), Learning and Skills Council (LSC), London Development Agency (LDA) and Skills for Logistics. Support is also provided by the Department for Transport, Freight Transport Association (FTA) and Road Haulage Association (RHA).

Executive summary
6
2) Delivery and Servicing Plans
Delivery and Servicing Plans (DSPs) will be used to increase building operational efficiency by reducing delivery and servicing impacts to premises, specifically CO� emissions, congestion and collisions. Contractual relationships between building operators and their supply chain will be used to specify companies committed to sustainable freight distribution, such as Freight Operator Recognition Scheme members, and ensure that they use legal loading locations.
DSPs aim to reduce delivery trips (particularly during peak periods) and increase availability and use of safe and legal loading facilities, using a range of approaches including consolidation and out-of-hours deliveries. They will eventually be integrated into the travel plan process, and monitored in the same way,
Specific consideration will be given to increasing the numbers of freight operators using best practice, and promoting Freight Operator Recognition Scheme membership through appropriate contract award criteria for servicing, maintenance and supply contracts.
Road network efficiency will be increased by each traffic authority’s response to its Network Management Duty, which will include the reduction of freight vehicle Penalty Charge Notice (PCN) hotspots to improve congestion and help reduce CO� emissions.
TfL and the GLA Group will take a lead in implementing DSPs for their own premises, with the boroughs following in due course. In parallel, DSPs will be linked to planning conditions for major new developments.
3) Construction Logistics Plans
Construction Logistics Plans (CLPs) have similar objectives to DSPs, but will be applied to the design and construction phases of premises, specifically to improve construction freight efficiency by reducing CO� emissions, congestion and collisions. Ultimately they will be integrated into the travel plan process and each traffic authority’s response to the Network Management Duty to increase road network efficiency by minimising congestion and therefore emissions caused directly and indirectly by construction-related trips.
The aim will again be for TfL and the GLA Group to take a lead in implementing such plans for their construction projects. Traffic authorities will be encouraged to review delivery arrangements for construction sites to ensure they reduce lane closures and carriageway restrictions, and reduce construction duration. The approach will be integrated with the introduction of Site Waste Management Plans from �008, in partnership with the Building Research Establishment (BRE).

7
4) Freight Information Portal
This will offer London, for the first time, a single interface for information on freight between London’s public authorities and freight operators. It will enable the integration of systems and act as a single point of registration for deliveries in London.
The project aims to reduce operators’ administrative costs and improve access to freight journey planning in the Capital, to support improved operational efficiency, better driver behaviour and the use of alternative fuels (including bio-fuel) and low-carbon vehicles.
A range of systems and services will be made available to all, with opportunities for Freight Operator Recognition Scheme members to promote fleet and freight vehicle operational efficiency and the uptake of best practice to reduce CO� emissions and improve safety, particularly by highlighting what can be done to reduce collisions between HGVs and cyclists. Key partners will be all those with data or systems affecting freight operators and deliveries in London.
A.�6. The three ongoing work-streams to support delivery of these projects are:
1) Partnership development
This will assist the Plan’s delivery by building partnerships at pan-London and sub-regional levels to help coordination between TfL, businesses, operators and boroughs. This is in line with the Mayor’s Transport Strategy, as it includes the LSDP and London’s sub-regional Freight Quality Partnerships.
The partnerships will exchange information, share concerns and best practice, and act as a focus for developing new initiatives and agreeing plans. A specific aim is to speed the identification and demonstration of best practice to help reduce CO� emissions and improve safety.
2) Major freight projects
Projects focused on promoting modal change from road to more sustainable alternatives (such as rail and water), and on reducing CO� emissions, will be developed as they arise and as funding is secured.
3) Freight data, modelling and best practice
Building the freight knowledge base is vital to improving the understanding of the role freight plays in maintaining London as a world class city. It will also allow the development of a regional freight modelling capability to demonstrate the benefits of best practice case studies and build business cases for change.

Executive summary
8
Specifically this work will identify case studies of innovations to reduce CO� emissions and collisions involving freight vehicles, with the aim of improving operational efficiency, driver behaviour, and the use of alternative fuels and low-carbon vehicles. These best practice examples will be demonstrated to those engaged through the Freight Operator Recognition Scheme, the Delivery and Servicing Plan project, the Construction Logistics Plan project, the Freight Portal, the LSDP and London’s sub-regional Freight Quality Partnerships.
How is sustainable freight distribution measured?
A.�7. Progress towards attainment of the vision for sustainable freight distribution in London will be reported annually against seven headline sustainable freight distribution ‘progress measures’. These reflect all of the areas of sustainable development: economy, environment and society. Additionally, a single composite indicator of sustainable freight has been identified to enable the procurement of sustainable freight operators. Further sub-measures supporting and adding definition to each headline progress measure are identified in the London Freight Data Report and will be developed as data becomes available. Headline progress measures are:
Total number of commercial vehicle parking-related Penalty Charge Notices (PCNs) per million freight vehicle kilometres
Overall reliability measure for freight
Emissions impact of freight road vehicles, notably CO�, particulates and NOx emissions
Freight fly-tipping incidents
Overall number of people killed or seriously injured in collisions involving freight vehicles
The number of thefts linked to freight activities on London roads
Freight Operator Recognition Scheme membership at each level
How does the Plan achieve this?
A.�8. Funding the delivery programme depends on securing commitments from a wide range of partners. TfL has already committed funds alongside Department for Transport, London Councils, British Waterways, the Port of London Authority (PLA), the Learning and Skills Council, the London Development Agency (LDA), the Thames Gateway Development Corporation (TGDC) and the Olympic Delivery Authority (ODA).
•
•
•
•
•
•
•

9
A.�9. To fully realise the vision for freight, securing additional funds is key, which is why many of the Plan’s actions rely on building partnerships and robust business cases for investment.
A.�0. To implement the proposals, it is essential to develop partnerships and new relationships and ways of working between the wide range of public bodies, businesses and operators with a stake in the freight industry.
How will this all be communicated?
A.��. In addition to the role that the Freight Information Portal will play, to help communicate the individual roles and responsibilities to different groups involved in the freight agenda four supporting documents are being produced, each with a different target audience:
London Rail Freight Strategy
Operators’ Guide
Borough Freight Toolkit
London Freight Data Report
A.��. The London Rail Freight Strategy is based on the same vision and objectives set out in this Plan, but it considers the challenges and solutions for rail within the context of wider rail industry planning processes and TfL’s passenger rail plans. As such, whilst this document considers rail freight challenges, the detailed action plan for rail freight is contained within the London Rail Freight Strategy.
A.��. The London Rail Freight Strategy sets out how TfL would like to see rail freight develop in London over the next ten years. TfL believes it is important for rail freight to flourish alongside a developing passenger railway in London, as rail freight can make an important contribution to the achievement of targets in this Plan
A.�4. The common objectives, under the themes of economy, environment and society, were used to identify a set of seven rail freight challenges for the Rail Freight Strategy to address, these being:
Accommodating London’s growth, increasing rail’s mode share
Accommodating the growth in deep sea container traffic
Improving connectivity with European rail freight networks
Improving planning procedures
Responding to key changes in the competitive environment
Accommodating rail freight customers’ requirements with others’ use of the network
•
•
•
•
•
•
•
•
•
•

Executive summary
�0
A.�5. To address these seven challenges, the London Rail Freight Strategy proposes a series of interventions which are grouped into five categories:
Capacity and capability schemes within London, including upgrading the London Overground routes
Capacity and capability schemes outside London, including a staged upgrade of the Felixstowe to Nuneaton route
Promotion of measures to make more efficient use of the network, such as longer freight trains and the infrastructure to support them
Initiatives to promote terminal development
Promotion of policies designed to improve the competitive advantage of rail freight over road freight, such as liberalisation of the European rail freight market
A.�6. The Operators’ Guide & Borough Freight Toolkit will communicate the Plan’s key aspects to the freight community and London boroughs.
A.�7. The Plan recognises that the current wealth of freight knowledge, expertise and experience will evolve and grow. A further supporting document, the London Freight Data Report, contains the data which informs the Plan. Given the commercial nature of freight data, an early goal of the Plan is to promote and secure the sharing of information by operators and businesses. This will ensure that freight’s role and its relationship with London and Londoners are properly reflected through a continuous process of development.
A.�8. Supporting these documents will be an ongoing process of workshops and resources delivered through the partnership development and data, modelling and best practice workstreams, the Freight Operator Recognition Scheme project and the Freight Information Portal project.
A.�9. Annual reports will be produced showing the progress being made towards attainment of the vision for sustainable freight distribution in London.
How does the Plan relate to other policies, plans and strategies?
A.�0. This Plan has no statutory force; it has been developed to implement the Mayor’s Transport Strategy� that is itself a statutory document. It will, however, play a vital role at the local level by informing the development of borough Local Implementation Plans, Development Plan Documents (DPDs) and the implementation of traffic authorities’ Network Management Duty. It is a
� Reference Policy 4K freight, delivery and servicing
•
•
•
•
•

��
material consideration for planning and its spatial aspects are consistent with the Mayor’s London Plan4.
A.��. Over time, the use of best practice in sustainable freight distribution will be strengthened through active consideration during transport assessments, and through a range of existing regulations, including planning conditions and the consideration of Network Management Duty under the Traffic Management Act �004.
What is the longer-term strategy?
A.��. Building on the contents of this Plan and on TfL’s Transport 2025: Transport Vision for a Growing World City5, a cross-modal freight strategy will be prepared for inclusion in any future revisions to the Mayor’s Transport Strategy.
A.��. The role of road user charging (RUC) and its impact on CO� reduction may be a consideration for the longer-term management of highway trips in London as part of a national RUC scheme, if that is pursued. The Climate Change Action Plan clearly identifies that national intervention is needed through the use of carbon pricing if the full potential of reducing CO� is to be realised by �0�5. Road user charging may be one way of pricing-in the carbon impact of travel.
A.�4. The long-term strategy for freight development will be in line with the strategy for all transport modes in London and with the Mayor’s other strategies, most significantly the London Plan. Critical to this longer term vision will be a further range of policy work impacting on freight, such as:
Measures to tackle congestion and its impact on CO�, while supporting London’s sustainable economic growth
Changing the demand and balance between modes for transporting goods
Technology and how this may influence demand and methods of transporting goods
4 GLA (�004) London Plan: Mayor’s Spatial Development Strategy, Policy �C.�4
5 TfL (�007) Transport 2025 Transport vision for a growing world city
•
•
•

Part B - About the Plan Part B highlights why sustainable freight distribution is vital for London, by reducing congestion, improving reliability and minimising climate change.
It sets out the Plan’s vision and objectives, defines the policy context and establishes high level input from Stern Review6 and Eddington Transport Study7.
The impacts of the planned growth of London are identified, together with the contribution freight must play to help reduce emissions of climate change gases.
The need for partnership is identified and the implications this has for communications are set out.
This section concludes with a consideration of the planning process and a discussion of the limited availability of reliable freight data.
IntroductionDefinition - freight
The Plan defines freight as the physical carriage of goods by any mode. This includes the provision of services and utilities and the movement of waste.
B.�. The geographical area covered by the Plan is generally that of the Greater London Authority, which encompasses the �� London boroughs and the Corporation of London (the ‘boroughs’).
6 HMSO (�006) Stern Review on the economics of climate change
7 HMSO (�006) Eddington Transport Study
��
��
B.�. A number of the modal issues in the Plan will impact outside the Capital due to the importance of global, European and regional movements inherent in modern supply chain logistics. Approximately 8 per cent of the UK’s freight travels to or from London, with an unknown additional level of freight travelling through London; therefore London’s transport infrastructure not only has to cope with its own freight needs, but also those of other regions.
B.�. The strategic challenge for London presented in this Plan is to promote efficient freight transport practices that:
Support London’s economic development
Maintain London’s local, inter-regional and world city role
Contribute to reducing the environmental impact caused by freight in London
Vision and objectives B.4. The vision for sustainable freight distribution in London was identified during
�004-05 by a working group of the LSDP (see B.��) which was set up to consider the strategic choices for freight investment in London:
’…the safe, reliable and efficient movement of freight and servicing trips to, from, within and, where appropriate, through London to support London’s economy, in balance with the needs of other transport users, the environment and Londoners’ quality of life…’
B.5. The working group also set out the Plan’s seven high level aims under the three headings of economy, environment and society:
Economy
Support London’s growth in population and economic activity
Improve the efficiency of freight distribution and servicing in London
Balance the needs of freight and servicing with those of other transport users and demands for London’s resources
Environment
Tackle poor air quality and freight’s contribution to climate change by reducing emissions of air pollutants and CO� caused by freight and servicing
Improve quality of life in London by minimising the impact of noise and vibration caused by freight and servicing
•
•
•
•
•
•
•
•

About the Plan
�4
Society
Improve health and safety in London by reducing the number of deaths and injuries associated with freight movement and servicing
Improve quality of life in London by reducing the negative impacts of freight and servicing on communities
B.6. The need to transport freight to, from, within and, where appropriate, through London has important implications for the Capital’s prosperity and the quality of life enjoyed by residents, workers and visitors.
B.7. London is one of the world’s great cities and the powerhouse of UK economic activity, with a significant impact on European and global trading partners. The businesses and services in the Capital drive an economy worth £�75bn (�00�).
B.8. London is planned to grow: by �0�5 there will be a planned increase in population by some 900,000 to 8.� million as set out in the Mayor’s London Plan, with the creation of more than 847,000 extra jobs. This will increase demand for freight by up to �5 per cent by �0�5 to support the necessary economic growth and development8.
B.9. Competition for space between people and freight movement on limited transport networks will require a sensitive balance to be reached. A world class city relies on first-class efficient and reliable freight transport, but it also has to be a place where people want to live, work and visit.
Policy context
B.�0. The original policy context for the Plan was set out in Sustainable Distribution: A Strategy, published by the then Department of Environment, Transport and the Regions in March �999 and reissued by the Department for Transport in January �004. It emphasised that the industry’s development should not compromise the needs of economy, environment and society which are the three pillars of sustainable development. To this end, the strategy proposed:
Improving the efficiency of road freight distribution
Modal change - increasing the proportion of freight carried by rail and promoting the use of coastal shipping and inland waterways
Modal change - improving interchange between modes
8 TfL (�007) Transport 2025 Transport vision for a growing world city
•
•
•
•
•

�5
B.��. The same principles underpin the Mayor’s Transport Strategy. The specific policy aims are to:
Ensure that London’s transport networks allow for the efficient and reliable handling and distribution of freight and the provision of servicing in order to support London’s economy
Minimise the adverse environmental impact of freight transport and servicing in London
Minimise the impact of congestion on the carriage of goods and provision of servicing
Foster a progressive shift of freight from road to more sustainable modes such as rail and water, where this is economical and practicable
B.��. The Transport Strategy was adopted in July �00� and states that:
’…achieving an efficient and sustainable distribution system for goods and services is one of the greatest challenges facing London…’
B.��. The Transport Strategy recognises that TfL cannot address the freight agenda alone, and calls for a collaborative partnership approach. It required the LSDP to be established9 and for London’s Freight Quality Partnerships�0, particularly at the sub-regional level, to be recognised and supported. Together they were seen as key delivery partners to implement the strategy and to help accelerate the use of cleaner and quieter vehicle technologies and practices to promote better vehicle maintenance and considerate and economical driving.
B.�4. Partnership with boroughs, rail operators and the track authority was identified to be the way to secure and develop road/rail transfer sites��. The strategy promotes partnership to ensure freight facilities�� and related intermodal facilities on the Thames and other waterways�� are used appropriately.
B.�5. The Mayor’s Transport Strategy is one of several statutory strategies that support the Mayor’s London Plan, which sets out the spatial development of the Capital. Sustainable Freight Distribution: A Plan for London is informed by, and complements, future revisions of the London Plan and other relevant Mayoral strategies and Supplementary Planning Guidance (SPG) documents.
9 GLA (�00�) Mayor’s Transport Strategy, Proposal 4K.�
�0 GLA (�00�) Mayor’s Transport Strategy, Proposal 4K.�
�� GLA (�00�) Mayor’s Transport Strategy, Proposal 4K.5
�� GLA (�00�) Mayor’s Transport Strategy, Policy 4M.�
�� GLA (�00�) Mayor’s Transport Strategy, Policy 4M.�
•
•
•
•

About the Plan
�6
B.�6. TfL’s publication of Transport 2025: Transport vision for a growing world city and this plan will help to inform the development of new Mayoral strategies and plans, including any revision of the Transport Strategy.
Recent publications
B.�7. During the development of this Plan the Eddington Transport Study�4 gave a clear focus, by identifying that transport investment should be on existing networks, especially within big cities such as London, to underpin economic growth. It identifies congestion and reliability as key challenges threatening London’s continued sustainable economic growth.
B.�8. However, these challenges have to be seen within the context of climate change identified by Stern in the recently published Stern Review�5. This identifies that pursuing three key elements would avert catastrophic climate change without capping the aspirations of rich and poor countries:
Carbon pricing, which establishes a value that captures the full social cost of the production and consumption of carbon
Policy implementation to support the development of a range of low-carbon and high-efficiency technologies on an urgent timescale
Removing barriers to behavioural change, in particular encouraging the uptake of energy efficiency opportunities
B.�9. Both Eddington and Stern identify road user charging as a potential element of a wider strategy to boost the reliability of the transport network and reduce CO� end emissions. However, road user charging is a subject for consideration in the long-term strategy for London, if this policy is pursued nationally, and is not considered in detail in this Plan.
�4 HMSO (�006) Eddington Transport Study
�5 HMSO (�006) Stern Review on the economics of climate change
•
•
•

�7
Definition - Heavy Goods Vehicles (HGVs)
All Class C and Class C+E vehicles of over 7.5 tonnes Maximum Authorised Mass (MAM) together with Class C� and C�+ E vehicles (between �.5 and 7.5 tonnes MAM). This includes tractors (without trailers), road rollers, box vans, similar large vans and two-axle motor tractive units without trailer.
Definition - Light Goods Vehicles (LGVs) and Vans
Goods vehicles below �.5 tonnes Maximum Authorised Mass (MAM). This includes all car-based vans and those with larger carrying capacity, such as ’transit vans‘. Also included are ambulances, pick-ups, milk floats and pedestrian-controlled motor vehicles. Most of these vehicles are delivery vans of one type or another.
B.�0. These aspirations have to be viewed from a position of knowing less about the movement of freight than about the movement of people. The difficulty in gaining reliable access to a coherent and complete freight data-set has for some time hindered detailed consideration of the freight agenda at international level right down to local level.
Growth of London – the London PlanB.��. The Greater London Authority (GLA) Act �999 which established the GLA and
enabled the Mayor to develop his London Plan, places obligations on the Mayor relating to health, equality and sustainable development.
B.��. The growth in freight movement projected by Transport �0�5 has the potential to increase freight’s social and environmental impacts significantly, particularly CO� emissions and collisions involving personal injury.
B.��. However, this freight trip growth will also occur at a time of increasing passenger transport demand because of population and employment increases. The Transport �0�5 vision is for an increased shift to public transport, walking and cycling, away from car use. An appropriate balance in the use of transport infrastructure will need to be found to cater for the forecast increased passenger travel as well as the increased demand for freight transport.

About the Plan
�8
Since �980 there has been an increase of �9 per cent in goods lifted in Great Britain with the tonne kilometres moved increasing by 47 per cent from �75 to �57 billion tonne kilometres a year.
Over �55m tonnes of freight were moved in, around and through London by road, rail, air and water transport in �005.
More freight is being moved over longer distances than ever before. However, within London most freight will always have to be moved by road and this presents a challenge for our economy, society and environment. The average length of haul was �6km for freight in London in �005.
B.�4. Freight modal change to rail and water is promoted in the London Plan and steps have been taken to safeguard river wharf sites. Whilst not always currently economic, they will be crucial in securing sustainable modal shift in the future, with related economic, social and environmental benefits.
B.�5. The draft Further Alterations to the London Plan stress that an efficient logistics network and related infrastructure are essential to London’s competitiveness�6. The Mayor will work with a range of partners to secure adequate provision, including multi-modal freight transfer capacity.
Climate changeB.�6. The Stern report on the economics of climate change identifies that significant
action is needed now to avert catastrophic climate change and prevent major negative economic as well as environmental repercussions in the near future. The Mayor’s Climate Change Action Plan identifies that a 60 per cent CO� reduction is necessary by �0�5 from 44m tonnes in �006. Freight’s contribution to this could be as much as �.7m tonnes of CO� per year (mt/y). However, the Climate Change Action Plan clearly identifies that without central government intervention, only around a �0 per cent reduction would be achievable – equating to some 0.7 mt/y by �0�5. Further information on the potential for biofuels and their impact is provided in paragraph B.�5.
�6 GLA (�006) Draft Further Alteration to the London Plan, Chapter �B paragraph �.��9i

�9
B.�7. The relative importance of freight to the Climate Change Action Plan is shown on Figure B-� below.
�006 emissions from the transport sector �00% = 9.6 million tonnes CO�
Car & motorcycle
��%
Ground-based aviation
Road freight
�006 emissions from all sectors, excl. aviation �00% = 44.� million tonnes CO�
��%
7%��%
�8%Commercial
IndustrialGround-based transporters
Domestic
Figure B-1 �006 CO� emissions from the transport sectors (from Climate Change Action Plan)
49%5%
4%
4%4%
��%National Rail
Underground
Taxis & PHVs
Bus
B.�8. Based on �006�7 data, London emits 44.�m tonnes of CO� each year, �� per cent being from ground-based transport. Road freight accounts for �� per cent of this (�.�m tonnes) or 5.� per cent of the Capital’s CO� production and energy use.
B.�9. Transport is the only sector (industry, commercial and domestic being the others) in which CO� emissions are increasing. In the case of freight, this reflects the fact that freight movement underpins economic growth and national freight traffic tonne kilometre volumes have increased by 47 per cent between �980 and �005�8.
B.�0. London’s planned increase in population and employment will result in an approximately �5 per cent increase in demand for the movement of freight. Reducing CO� in the freight sector without constraining the economy is, therefore, a significant challenge.
B.��. Vans tend to carry smaller loads. The relative carbon emissions per tonne kilometre for fully loaded vehicles are 84 per cent lower if HGVs are used
�7 Mayor of London (�007) Action Today to Protect Tomorrow, The Mayor’s Climate Change Action Plan
�8 HMSO (�006) Transport Trends 2006

About the Plan
�0
instead of vans and 5� per cent lower if lorries under 7.5 tonnes are used, as shown in Figure B-� below. The market trend is towards the greater use of smaller freight vehicles, which are less efficient in terms of emissions per tonne kilometre than larger vehicles, and will therefore make the situation worse.
-84%-51%
-68%
-60% -70%
0.63
0.31
LGV MGV
Road Water Rail
HGV Small tanker Rail
0.10
0.04 0.03
-94%
Figure B-2 Comparison of carbon emissions for different freight methods /Kg CO� per tonne kilometre (from Climate Change Action Plan)
B.��. The Mayor’s approach to climate change is set out in his Climate Change Action Plan�9. This identifies a range of opportunities for the freight industry to reduce climate change gas emissions. It states that these will need to be addressed by freight operators in partnership with businesses and London’s authorities.
B.��. The Climate Change Action Plan identifies a target CO� saving by �0�5 of 0.7 mt/y which would increase to as much as �.7 mt/y with the introduction of carbon pricing. Initial estimates produced for the Climate Change Action Plan identify that by �0�5 the introduction of road user charging, should it be pursued in London as part of a national scheme, would realise 0.� mt/y CO� savings, with a further 0.� mt/y from the introduction of 5 per cent biodiesel from �0�0, together with the voluntary adoption of higher blends. These initial estimates indicate the remaining 0.� mt/y saving would be possible from the voluntary introduction of fleet efficiency measures, driver training, other alternative fuels and low-carbon vehicles.
B.�4. The use of biofuels may be one way to reduce emissions of CO� from the transport sector. The highest performing biofuels currently available can reduce by 50 per cent the carbon emissions associated with their volume when compared with conventional fuels. The use of biofuels is supported where a substantial CO� reduction is achieved compared with conventional fuels. It is
�9 GLA (�007) Action Today to Protect Tomorrow, The Mayor’s Climate Change Action Plan

��
also recommended that transport companies only buy biofuel where it can be clearly demonstrated to government, through the Renewable Transport Fuel Obligation, that it has been produced from sustainable sources that meet rigorous standards, protect animal and plant species and natural habitats, and promote local production.
B.�5. Because the CO� saving associated with biofuel production can vary so widely, it will be important to establish standards to guarantee the level of CO� saving associated with the use of a specific fuel. Standards must also provide assurance that fuel has been produced sustainably�0.
B.�6. More detailed analysis (see Appendix D) has been undertaken for this Plan to better understand how the CO� reductions for freight can be achieved. This indicates that, even without the introduction of carbon pricing, the 0.7 mt/y target can be exceeded if those involved in freight work together. Table B-� suggests that a saving of �.�� mt/y - equivalent to more than 45 per cent - could be achieved by �0�5.
B.�7. However, this assumes that all involved in freight work in partnership to secure the widespread adoption of green fleet procurement, and that the corporate and social responsibility of developers, contractors, building owners and tenants is strengthened by conditions imposed by the planning process. This will be achieved by consideration being given to freight within travel plans for the design, construction and operational phases of buildings. It also assumes that those based outside, but delivering into, London are encouraged to adopt similar best practice.
B.�8. Without the adoption of green procurement and the consideration of freight use within travel plans in the planning process, the maximum freight CO� saving may drop to as little as 0.46 mt/y, which equates to a CO� saving of around �8 per cent by �0�5.
�0 GLA (�007) Action Today to Protect Tomorrow, The Mayor’s Climate Change Action Plan, pp 142-143

About the Plan
��
Table B-1 Potential freight CO� saving summary (�0�5)��
Opportunity Million tonnes CO� per year saved using travel plan and procurement links
Reduced CO� per year saving without travel plan or procurement links
Road User Charging (should it be pursued as part of a national scheme)
0.�0 0.�0
Modal change 0.08 0.00*
Fleet efficiency 0.�9 0.06
Out of hours deliveries 0.0� 0.00*
Construction consolidation 0.�� 0.00*
Retail / office consolidation 0.�0 0.00*
Waste fleets 0.00� 0.00*
Voluntary adoption of alternative fuel and low carbon vehicles
0.�0 0.�0
Bio-fuel 0.�0 0.�0
Total 1.21 0.46
Notes * Too small to estimate
B.�9. The figures used in this analysis are based on best estimates rather than hard data, of which little exists. The analysis will be refined as access to more robust freight data becomes available.
B.40. To achieve the necessary CO� reductions, the GLA Group�� is committed to demonstrating how CO� savings can be made in practice by establishing flagship projects to provide best practice examples and proof of concept in London. It will also exploit its close relationship with London’s boroughs and health and education sectors to encourage early adoption to secure further CO� savings.
Shared responsibilities - the need for partnershipB.4�. Addressing the freight agenda is a new priority for TfL and London’s boroughs.
The Plan’s success relies on organisations with an interest and/or remit in
�� See Appendix D
�� Greater London Authority, London Development Agency, Transport for London, Metropolitan Police Authority, London Fire & Emergency Planning Authority, Visit London.

��
freight working together in collaborative partnership to coordinate their roles and responsibilities in identifying, developing and delivering the Plan.
B.4�. It is essential to understand fully the issues facing freight transport in London, which can only be achieved by actively engaging with a wide cross-section of stakeholders from the public and private sectors. However, what operators know and take for granted is often not understood by those making policy or developing schemes. This highlights the need for effective communication. Accordingly, the Plan has to promote working-together and shared understanding.
B.4�. Based on the need to develop a common understanding of needs and shared objectives, the LSDP was formed as an action from the Mayor’s Transport Strategy in �00���. It was also recognised that TfL could not address the freight agenda in isolation. TfL gratefully acknowledges the help and support of the LSDP and many other contributors to the Plan (some of whom are listed in Appendix A).
B.44. As the LSDP has matured, a new structure and working arrangements have been developed to help recognise the diverse needs of the different parties involved with freight in London. Supporting the Mayor’s Transport Strategy�4, London’s sub-regional Freight Quality Partnerships were recognised within LSDP as key delivery partners.
LONDONLONDONLONDONLONDONLONDON
Business PlanCoordination Group
Sub-regional FreightQuality Partnerships
IndustryActionGroups
Modal andSpecial Knowledge
Groups
Construction Water Business Vehicle, Fuel& Technology
Safety &Security
PlanningEnvironment
Air
Road
Rail
Courier
Waste Servicing &Maintenance
Oil &Chemical
Utilities
Retail
TfLFreight
Unit
Figure B-3 Structure of the London Sustainable Distribution Partnership
�� proposal 4K.�
�4 proposal 4K.�

About the Plan
�4
B.45. Industry Action Groups have been set up to identify key issues and opportunities. The Business Plan Coordination Group is designed to help identify/commit funds and resources. Illustrated in Figure B-�, the LSDP’s role is to:
Influence the freight agenda
Review the programme supporting implementation of the plan
Engage with and secure commitments of support from stakeholders
Provide an outlet for the demonstration and dissemination of best practices identified or produced by the programme
Definition - Freight Quality Partnerships (FQPs)
FQPs are partnerships between the freight industry, local government, local businesses, the local community, environmental groups and other interested stakeholders. Their aim is to develop an understanding of freight transport issues and problems, then promote constructive solutions which reconcile the need for access to goods and services with local environmental and social concerns.
B.46. TfL has set up a dedicated Freight Unit to develop and help deliver the Plan as well as to manage the LSDP groups. In this way, London is working together to identify and address freight issues through dialogue with the boroughs, businesses and operators.
B.47. The Freight Unit has developed the Plan through an extensive consultation process, both formal and informal. This included widespread engagement with the many freight stakeholder groups as well as additional liaison with London boroughs. This has ensured that as many views as realistically possible are expressed, collated and, where appropriate, reflected within the Plan.
B.48. In addition, links across the wider region, particularly with the South East of England and East of England Regional Development Agencies, continue to develop.
B.49. A solid foundation of expertise now lies within TfL, borough highway authorities, traffic authorities and planning and waste authorities. Sharing and developing this expertise is vital. A range of communications issues that need to be addressed are identified below.
Internal communications – boroughs and TfL
B.50. As a first step, raising awareness of the importance of freight within TfL and the boroughs is crucial. The challenge is to ensure that every appropriate opportunity is used to get the message across that a sustainable freight
•
•
•
•

�5
strategy is of fundamental importance to London’s development as an exemplary sustainable world city.
Communicating between TfL, boroughs and FQPs
B.5�. Sharing information between TfL, the boroughs and freight operators will increase understanding of freight and its supply chain needs. The information gained should be used as a focus for service improvement and development. TfL’s challenge is to collate and disseminate this knowledge.
B.5�. Effective coordination between TfL and the boroughs is essential. The Local Implementation Plan (LIP) Reporting and Funding Submission Guidance emphasises the importance of these linkages and the priorities identified in this Plan.
B.5�. The guidance supports funding of sub-regional FQPs, which will help share knowledge and expertise as well as enabling linkages between local, regional and strategic issues.
B.54. Improving coordination between TfL, boroughs and FQPs will be further strengthened by supporting a freight partnership resource within lead boroughs. Identifying training needs for staff and elected members to more fully acknowledge and act on freight issues is a key challenge if the Plan is to be effectively realised at ‘street-level’.
Communicating with and between operators
B.55. The LIP Reporting and Funding Submission Guidance requires every sub-regional Freight Quality Partnership to have an effective communications plan. It is vital FQPs can reach out to their target audiences.
B.56. Identifying standards and development programmes for freight planners and drivers is vital if best practice is to be identified and communicated. Encouraging operators to use best practice relies on best practice information being readily available and accessible through case study leaflets, databases, workshops and forums.
B.57. There is little possibility for regulatory control without impacting freight costs. An alternative is to recognise those doing well and reward operators who adopt best practice.
B.58. Many freight operators have expressed a need for help with delivering efficiently in London. Providing this help on the web, through workshops and in handbook form would build on information provided at a national level by the Department of Transport. Accurate information on legal delivery locations

About the Plan
�6
and access to an effective real-time journey planner would help to reduce inefficiencies. A coordinated approach to systems and restrictions affecting freight operations would be of benefit to London.
Freight and the planning process
Plan’s statutory status
B.59. This Plan and its supporting documents are non-statutory. They should be used to inform boroughs’ Local Implementation Plans, Local Development Frameworks, Network Management Duty, other Development Plan Documents (DPDs), freight funding bids and the development of the national rail Strategic Freight Network�5. They will be a material consideration for planning aspects under the Mayor’s London Plan�6.
Public sector development planning
B.60. Land-use planning can influence freight activity at a policy and guidance level and through the development control process:
Planning policy is provided at a national level and in London, through the London Plan, Supplementary Planning Guidance (SPG), Sub-regional Development Frameworks and the Local Development Frameworks (replacing Unitary Development Plans)
The Development Control process manages planning policies and is undertaken by borough planners and also strategic land-use planners at the GLA, LDA and TfL
B.6�. The recent draft Planning Policy Statement (PPS): Planning and Climate Change�7 sets out how planning should contribute to reducing emissions and stabilising climate change. Regional authorities should pay attention to:
The location and design of new development to optimise its carbon performance and limit its likely contribution to carbon emissions
Urban growth patterns and their impact on the movement of goods and supply chains
The potential for new and existing developments to increase contributions from renewable and low-carbon energy sources (for freight this could be the fuel used by delivery and servicing vehicles)
�5 The Future of Rail - White Paper, �5 July �007
�6 GLA (�004) London Plan: Mayor’s Spatial Development Strategy, Policy �C.�4
�7 Department for Communities and Local Government (�007) Consultation. Planning Policy Statement: Planning and Climate Change. Supplement to Planning Policy Statement �
•
•
•
•
•

�7
Ensuring full consideration is given to creating and securing transport in line with PPG���8, including through the preparation and submission of travel plans
B.6�. Respondents to the draft PPS thought that not enough importance had been given to transport emissions when designating sites and assessing development proposals�9. The planning system needs to assist in maximising the efficiency of freight operations and reduce many of its adverse impacts.
B.6�. By implementing policies to protect existing inter-modally connected sites and encourage consolidation and activity outside peak hours, further emission reductions and greater efficiency of the remaining road-based freight can be achieved. Challenges for inter-modal facilities include poor public perception and integrating freight considerations into planning conditions through Section �06 agreements�0. By linking freight issues into the travel plans outlined in PPG ����, they can be integrated into the planning process.
B.64. As a result it is important at all stages of the development process - from design and planning through to construction - that full consideration is given to the freight and servicing implications of the development and its potential users. It is essential that freight activity is considered alongside the movement of people, throughout the planning system, to avoid generating conflict with other road users, particularly pedestrians and cyclists.
B.65. From a local government perspective, influence can also be exerted through transport planning and the management, maintenance and development of transport networks. This includes:
Local Implementation Plans and the bidding process between the boroughs and TfL
Traffic authorities’ Network Management Duty, planning works and approaches to minimise impact on borough street cleansing, enforcement activities, street design, roadworks and other street-works
Waste and Minerals Planning
B.66. From a private sector perspective, influence can also be exerted by developers and planners using DPDs and other material considerations to bring forward private sector investment in buildings and infrastructure, and through logistics planners deciding how to meet the demand for goods and services to maximise customer service and minimise costs.
�8 TSO, �00�, Planning Policy Guidance ��: Transport
�9 Department for Communities and Local Government: London (�007) Planning Policy Statement: Planning and Climate Change. Analysis Report of Consultation Responses
�0 Section 106 of the Town and Country Planning Act 1990
�� TSO, �00�, Planning Policy Guidance ��: Transport
•
•
•
•

About the Plan
�8
B.67. Ongoing liaison is needed on freight issues through the established Inter-regional Forum. The challenge is to realise an integrated approach to logistics for all modal networks and the location of Gateway logistics facilities within the South East and East of England regions.
B.68. Within London, strategic logistics provision should be concentrated on Strategic Industrial Locations as defined in the London Plan and the supporting SPG on Land for Transport Functions�� and Industrial Capacity��. These should be linked to the strategic road network, maximising the use of rail and water-based infrastructure.
B.69. To ensure that London’s needs are served efficiently and sustainably, smaller scale provision of logistics facilities must be taken into account. In particular provision should be considered close to the Central Activity Zone and London’s suburban town and neighbourhood centres.
B.70. Understanding and building freight issues (See: Appendix C) into borough DPDs is a key challenge.
Private sector development planning
B.7�. Developers need to understand and accommodate freight requirements of developments in such a way that they meet wider policy objectives. Toolkits have been produced for rail freight policy and development control relating to potential strategic rail freight sites�4, and similar toolkits are being developed for wharves.
B.7�. Developers are encouraged to consider freight as part of transport assessments required for planning applications referred to the Mayor. Guidance is available on producing these assessments�5: the challenge is to encourage all planning applications, particularly those for mixed use schemes, to consider how to increase the sustainability of any freight or servicing activity.
Modal change
B.7�. Both the Mayor’s Transport Strategy and the London Plan encourage investment in more sustainable freight infrastructures. This may include maximising the use of rail, water, cycle and foot for freight where possible.
�� GLA, �007, Land for Transport Functions
�� GLA, �00�, Industrial Capacity Draft SPG
�4 London Rail (�007), Rail Freight Strategy
�5 TfL, �006, Transport Assessment Best Practice

�9
B.74. National Planning Guidance needs to be reviewed to ensure consistency throughout the planning system to:
Encourage and support new facilities close to water or rail (this would help with the development of, for example, waste and resource recovery facilities and increase utilisation of spare capacity on waterways and rail networks)
Protect essential existing facilities supporting alternative freight modes
Ensure access to road space is available for essential road freight in balance with the passenger transport and are functions of each place on the highway network
Reduce congestion, CO� and other environmental impacts
B.75. Some of this guidance is provided through existing documents (see Appendix C). Additional guidance needs to be provided where necessary.
B.76. New locations for modal interchange should meet strategic planning and environmental objectives. These locations should be protected and objectives should take account of current policy and guidance.
B.77. An additional challenge is to ensure that requirements for transport assessments for such developments identify opportunities to reduce the impacts from road movements to and from these sites.
Highway planning - Network Management Duty
B.78. In response to the traffic authorities’ Network Management Duty under the Traffic Management Act (�004), consideration should be given to coordinating traffic authorities in their approach to improving road network reliability in the face of delivery and servicing activity, including lane closures, skip and scaffold licences, where there is:
Absence or insufficient provision of legal facilities at times dictated by business need
Long advanced notification and different permit/dispensation requirements leading to low system use
Inappropriate issue of permit /dispensations
Existing legal loading areas occupied by illegally parked/waiting vehicles
Reduction of road network reliability caused by construction activity
B.79. There is also merit in coordinating traffic authorities through the adoption of an agreed approach to prioritising areas and corridors for action.
•
•
•
•
•
•
•
•
•

About the Plan
�0
B.80. Traffic authorities should also coordinate street cleansing and waste collection (municipal and commercial) activities, the out-of-hours servicing and maintenance of roadside equipment and - through the adoption of consistent planning standards and design for off-street delivery facilities -the enabling of out-of-hours deliveries.
B.8�. A coordinated approach is also needed to improve road network reliability through a cross-modal, integrated corridor management approach to the allocation and management of road space.
B.8�. Improved integration of abnormal load routing and journey time planning provides an opportunity to improve network reliability under the Network Management Duty, though this would also need effective enforcement.
Waste authority planning
B.8�. Waste authorities plan the development of waste treatment, reprocessing and recycling facilities, as well as waste collection route planning. This is designed to minimise road waste distances travelled, especially on capacity-sensitive roads at peak times.
B.84. The Planning and Compulsory Purchase Act �004 requires local authorities to replace existing Unitary Development Plans with a Local Development Framework, which must include specific waste policies.
B.85. Policies currently being prepared for adoption in �0�0 therefore need to minimise waste transport movements through strategic environmental assessments.
Data availabilityB.86. There is a need for a greater understanding at a strategic level about freight
movement in the Capital, its relationship with land uses, and its contribution to economic growth. Much of the freight analysis work undertaken to date has been based on a number of assumptions due to the paucity of available freight data. This is because freight has not been a focus for transport planning in London, or elsewhere in the UK, for the last �0 to 40 years.
B.87. The London Freight Data Report, a supporting document of the Plan, has informed the development of the Plan and provides the facts used in this document. London-specific data is used where available but is supplemented with national data to help build a detailed understanding of freight activities and how these affect the Capital.

��
B.88. The London Freight Data Report will be reviewed periodically to update the freight knowledge base, to monitor trends and to measure the impact of the freight delivery programme. This will enable TfL and the LSDP to be responsive in developing the business case for action.
B.89. Much of the data available at the national and regional level is not currently collected in a way that allows disaggregation to a sub-regional level or below. Gaining support to change data collection practices, allowing greater regional and sub-regional analysis by sector and mode, will be key.
B.90. Securing access to this detailed freight data is particularly difficult for rail freight because of commercial fragmentation and competition. Without better modal and sector freight data and forecasts, the current and future impacts of increasing congestion into and within London will be difficult to understand, making the development of business cases for intervention and modal change challenging.
B.9�. Gaining access to road freight data will require operators to share information frequently thought to be commercially confidential. Gaining access to onward destinations at modal interchanges and details of delivery rounds will require freight operators to develop trust in TfL.
B.9�. Many business sectors within London rely on efficient and quick supply chains. Speed and accessibility into and out of the global marketplace are often key considerations when companies decide where to locate. Poor freight reliability may adversely affect investor confidence in London and therefore threaten its status. It is therefore essential to better understand the effect this has on confidence and the Capital’s economic performance.
B.9�. Van use is the fastest growing freight sector in London. However, little is known about van operations as they operate in the same regulatory environment as cars. It is necessary to better understand the freight industry response to issues such as increasing costs in HGV operations, shortages of trained commercial goods vehicle drivers, small order just-in-time deliveries, and internet and home deliveries which have contributed to this growth.
B.94. The impact of change on supply chain practices is difficult to understand at a pan-London level. Detail has to be built-up by sector and mode before it can be effectively aggregated to increase understanding and allow freight needs to be considered alongside those of people movement.
B.95. Whilst data on the transport of some commodities such as aggregates and other bulk goods is quite readily available, the movement of other goods and services to buildings, and on and off construction sites, remains unclear.

Part C - Freight challenges in LondonThis section deals with the key operational challenges affecting freight transport in London. The section is set out under the following headings:
Modal challenges Road, rail, water, air, and pipeline challenges
Sector challenges Retail, Courier, Servicing and Maintenance, Oil and Chemical, Construction, Waste, and Utilities challenges
Potential CO2 savings through modal change/shift
•
•
•
C.�. This part of the Plan has been informed by the LSDP’s members, its Business Plan Coordination Group, Modal and Special Knowledge Groups, Industry Action Groups and sub-regional Freight Quality Partnerships. Boroughs, local FQPs, freight operator market research and consultation respondees have greatly assisted in the Plan’s development.
C.�. This section presents the main issues and resulting challenges by mode and sector, so that solutions can be identified that best reflect the diversity of freight operations. The consideration of specific sector supply chains enables opportunities for change to be better understood.
C.�. This Plan deals with problems that are complex, and not easy to solve. There are few directly transferable examples from other world class cities that can be drawn upon.
��

��
Modal challenges
Road freight
C.4. Delivering in the UK and London is mainly undertaken by road. In the London Freight Data Report it is recorded that 88 per cent of freight lifted in London is by road. The UK’s logistics operations are widely regarded as being second to none in terms of their operational efficiency. The Eddington Transport Study�6 reports that 7� per cent of journeys made by the HGV sector are over �00kms. Across England, freight demand is very sharply concentrated on the London - Birmingham - Manchester corridor and the Liverpool - Manchester - Leeds corridor, together with links to the major ports. This produces large volumes of inter-regional traffic, much of it concentrated on the Midlands/M� corridor and M�5 logistics hubs.
160
140
120
100
80
60
40
20
0
Tonn
es li
fted
(mill
ion)
Within London
1997 1998 1999 2000 2001 2002 2003 2004 2005
From London To London
Figure C-1 Freight lifted by heavy goods vehicles in London, �997-�005
C.5. Figure C-� shows the inter-regional dependency of London on freight flows. It provides an indication of demands affecting the Capital’s strategic road networks - the Transport for London Road Network (TLRN) and Strategic Road Network (SRN)�7.
�6 HMSO (�006) Eddington Transport Study: The case for action: Sir Rod Eddington’s advice to Government
�7 DfT (�006) Freight Statistics (based on special tabulations from CSRGT, the International Road Haulage Survey and the Survey of Privately Owned Vans)

Freight challenges in London
�4
Reliability
C.6. The impact of congestion is to reduce journey time reliability. The growing number of vans may play a greater role than HGVs in adding to peak period congestion, and more understanding of this is needed. Restrictions on drivers’ working hours for vehicles over �.5 tonnes, and the lack of places to legally stop and rest, create a particular problem to be overcome.
C.7. Improved integration of abnormal load routing/journey time planning is a specific opportunity for improved network reliability. Most of this activity is in the construction sector.
C.8. Measures to increase journey reliability for people and goods, such as Red Routes and bus lanes, can also increase restrictions on delivery times unless sensitively designed. Giving further priority to freight by introducing HGVs into bus lanes has been tried but there are significant safety concerns for cyclists and other vulnerable users. A cross-modal integrated approach to developing and managing road corridors would seek to maximise journey time benefits for freight within the constraints of meeting the essential needs of other road users.
C.9. Boroughs and TfL will also need to continue to improve real-time traffic management and access to electronic information on delivery restrictions. This will minimise areas where commercial vehicles make deliveries or collections illegally, which frequently affects road capacity and reliability.
C.�0. Night-time delivery of goods and servicing can have a role to play in helping to minimise day-time congestion and improve freight reliability. London’s borough councils may impose delivery curfews through planning conditions and noise abatement notices to protect the night-time amenity of residents. However, operators and businesses often complain these are not consistent or recorded coherently, are often out of date and do not relate to current uses or practices.
C.��. Borough councils and London Councils also maintain the London Lorry Control Scheme (LLCS). This scheme restricts the routes that can be used by lorries over �8 tonnes at night and over the weekend. While helping to protect residential night-time amenity, the scheme can sometimes lead to an increase in fuel use and emissions, and deter journeys at less congested times of the day.
C.��. Congestion caused by collisions, especially those involving fatalities on key freight corridors, can also be very disruptive to freight operations, in some circumstances grid-locking sections of London’s road network for considerable periods. Ensuring the freight workforce is adequately trained to minimise these operational road risks is essential to help minimise these network delays and the consequent journey time unreliability.

�5
C.��. Bridge-strikes, damage or other disruptions as diverse as security alerts or flooding can have a significant impact on the reliability of freight operations. There is limited understanding about where such disruption might be critical to London and the steps taken to minimise the risk.
C.�4. Introduction of the LEZ in February �008 is estimated to reduce restricted activity days by about �66,000 days (-�� per cent ), the number of life years lost by nearly �,600 years (-�0 per cent) and reduce the number of premature deaths by 45 (-�0 per cent )�8. The scheme will have significant impact in improving the health of Londoners�9.
C.�5. Road user charging, should it be pursued as part of a national scheme with the objectives of reducing congestion and bringing environmental benefits, has the potential to deliver improved journey time reliability and lower fuel consumption and emissions for freight. Operationally, a key challenge in any development of road user charging in London as part of a national scheme would be to integrate existing and planned initiatives, including Congestion Charging and the LEZ, so that regulatory and administrative burdens on operators are minimised.
Regulations and efficiency
C.�6. Operators work within a range of regulations that affect operations in London, including the LLCS, Congestion Charging, the LEZ, red route and yellow line loading restrictions, Controlled Parking Zones and the process for seeking loading exemptions. Planning for deliveries in these conditions is complex, and can be difficult and costly. There is limited coordination between the many and varied organisations involved.
C.�7. Currently the most common grievance among London’s freight operators is the inconsistency in regulations and enforcement between authorities and the level of penalty charge notices (PCNs) for delivery vehicles.
C.�8. The need to improve the efficiency of movement of goods and people on the TLRN is recognised in the Mayor’s Transport Strategy. However, this can lead to problems for operators wishing to deliver at a time suitable to their business need. On the TLRN, around �0 per cent of all PCNs are issued to commercial vehicles for parking and loading offences. Without providing safe and legal loading space for new developments, where practicable off-street, this problem will continue.
�8 TfL (�006) Health Impact Assessment of the Low Emission Zone, ERM.
�9 Restricted activity days is a measure of the number of days of poor health experienced by an individual over the course of a year. Other benefits estimated to �0�0.

Freight challenges in London
�6
C.�9. Operators need to be encouraged and rewarded for employing best practice. TfL and the GLA Group have an opportunity to lead in the procurement of delivery and servicing contracts using award criteria that take account of the operators’ use of best practice.
Improving safety
C.�0. In �005, �,789 people were killed or seriously injured on London’s roads, with 40� of these incidents involving freight vehicles40. About �4 per cent of all collisions involving goods vehicles result in serious or fatal injuries, which is higher than for other road users.
C.��. The Mayor has already made a clear commitment to tackle the HGV/cyclist collisions issue through the Share the Road campaign and other initiatives. This will need support through the Plan. However, as shown in Table C-�, more pedestrians than cyclists were involved killed and seriously injured (KSI) incidents involving goods vehicles in �005, while there were as many pedestrian fatalities involving HGVs as there were cyclist fatalities. In looking at the overall picture of collisions involving freight vehicles, it is clear that more needs to be done, specifically to reduce KSIs involving pedestrians, car drivers, powered two-wheelers and cyclists. Such action must include publicity to raise awareness, training, and employing best practice such as retrofitting mirrors and side-guards.
C.��. In line with improvements across all modes, there has been significant progress towards meeting the Mayoral target of a 50 per cent reduction in killed and seriously injured (KSI) collisions by �0�0. This is calculated from base figures averaged from �994 to �998. For collisions involving freight vehicles, the �005 figures shown in Table C-� represent a 49 per cent reduction, indicating that if these injury savings can be maintained, the Mayoral targets are attainable.
40 TfL (�006) Goods vehicle casualty data for Greater London provided by the London Road Safety Unit, TfL

�7
Table C-1 Collisions involving goods vehicles (�005)4�
Casualty mode of travel
Fatal Serious KSI Total
LGV MGV HGV LGV MGV HGV LGV MGV HGV
Pedestrian 7 � 6 5� �� �0 60 �4 �6 �00
Pedal cycle � 0 6 �� � �� �4 � �7 54
Powered two-wheeler
� 0 4 60 8 �� 6� 8 �6 86
Car 4 0 � 54 8 �9 58 8 �� 97
Taxi 0 0 0 � 0 0 � 0 0 �
Bus or coach 0 0 0 4 � � 4 � � 6
Goods vehicle � 0 0 �6 4 �� �7 4 �� 5�
Other 0 0 0 � 0 � � 0 � �
TOTAL 17 1 18 243 37 86 260 38 104 402
C.��. Research shows that speed is a significant contributory factor in freight vehicle collisions, particularly those involving van drivers, who do not require special training. A significant challenge will be to improve vehicle operator and driver practices to provide a safer environment in which London’s diverse communities can thrive.
C.�4. In �004, the freight sector directly employed ���,400 workers at 6,�55 workplaces in London4�. Van and HGV drivers made up �� per cent of all freight and logistics sector employees. The current reported shortage of trained HGV drivers may be exacerbated in �009 by the planned requirements for continuing driver development which are detailed in EU Directive: �00�/59/EC Vocational Driver Training.
C.�5. The Leitch Report4� calls for a voluntary increase in driver standards by �0�0, otherwise regulations may be passed to set minimum qualification standards for the industry. Resources to support driver training and development are currently available through the organisation Skills for Logistics, a sector skills council for the freight logistics industries. One challenge is to target training towards Black, Asian and Minority Ethnic communities as they are currently under-represented in the freight sector44.
4� TfL (�006) Goods vehicle casualty data for Greater London provided by the London Road Safety Unit, TfL
4� Skills for Logistics (�006) Greater London Logistics Sector Regional Profile, produced by Stephen Grey, Skills for Logistics
4� HMSO (�006) Prosperity for all in the Global Economy - World Class Skills”, Lord Leitch’s final report
44 Skills for Logistics, UK Logistics Profile Aug �007 – p �8

Freight challenges in London
�8
C.�6. Vehicle standards are also of concern, with VOSA reporting prohibition rates of �7 per cent for HGV motor vehicle ’road-worthiness‘ spot checks in the South East and London metropolitan areas45. In London, foreign vehicles lifted approximately �.5 million tonnes, which was equivalent to �.8 per cent of the freight lifted by British vehicles. The prohibition rates of �8 per cent and 5�.� per cent for foreign HGV tractor and trailer spot checks was much greater than for UK HGVs (�6.7 per cent and �7.4 per cent, though the sampling is not random).
C.�7. For LGV overloading, the prohibition rate on spot checks has been increasing year on year and is now �� per cent compared with �0 per cent nationally. Van overloading is a particular concern, possibly caused by the lack of regulatory controls and low cost of entry to van operations.
C.�8. Overloading and unroadworthiness directly relate to increased risk of collisions and severity of injury. The challenge is to find effective enforcement measures, supported by appropriate resources, to address these issues.
Rail freight
C.�9. Details of future approaches to rail freight are contained in the London Rail Freight Strategy, a companion to this Plan. However it is useful to highlight the key challenges ahead. The rail network in and around London faces growth pressures from both passenger and freight. The industry’s own forecasts of freight growth, which TfL endorses, show that rail freight that operates in London (for example container and construction traffic) is expected to experience much stronger growth than the UK average. However, more needs to be done to encourage growth in freight and promote modal change. These challenges are developed in more detail in the London Rail Freight Strategy, which identifies and evaluates packages of solutions.
Regional growth
C.�0. Rail can play an important role in accommodating London’s growth and in helping to deliver key projects such as London �0��, Stratford City and the wider Thames Gateway development. This growth is expected to increase rail freight traffic, notably aggregates, retail goods (including international flows from continental Europe) and possibly waste and recyclates, with associated increases in the volume of road movements at terminals.
C.��. This growth is occurring within the context of an already congested rail network. The Rail Freight Strategy seeks to accommodate both expanding passenger and freight services
45 VOSA (�006) Effectiveness Report 2004/5, VOSA

�9
Modal change
C.��. By increasing its mode share, rail can play an important role in making the transport system more sustainable and meeting CO� emissions reduction targets. There is thought to be latent demand for rail freight services carrying consumer goods to and from London; however the lack of terminal/warehouse capacity in particular is constraining this demand (see Appendix D, point ��). This should be addressed by making a better case for these terminals in the planning system. In addition to trunk haul routes, there may be opportunities for some intra-London traffic to transfer to rail, particularly construction and waste traffic.
C.��. National rail generates 4 per cent of ground-based transport CO� emissions in London. It has reduced its emissions per passenger kilometre over the last �0 years, due largely to mode shift and lower emissions from national grid electricity. CO� emissions from the operation of national rail services will further benefit from the increased generation of electricity from renewable or low carbon sources, along with new technologies, infrastructure, behaviour and policy. TfL London Rail, in particular, is bringing together carbon reduction initiatives as part of the London Rail Energy Action Plan.
Port growth
C.�4. With the recent granting of approval for the London Gateway Port, accommodating growth in deep sea container traffic between the existing and planned East Coast ports (Haven ports and North Thameside) and the rest of the country is seen as essential. Effective partnerships are needed to help secure the necessary investment, which includes upgrading routes through London and creating alternative routes that do not pass through London.
International connectivity
C.�5. Improving London’s international competitiveness by improving connectivity with European rail freight networks is important for growth. There are opportunities for developing greater use of the Channel Tunnel for rail freight, particularly with the opening of the High Speed � line in �007 and the progressive liberalisation of Continental rail freight markets. The challenge is to grow capacity and capability inside and outside London by developing partnerships, particularly in relation to terminal facilities for High Speed �.
Planning
C.�6. Planning of facilities has to be undertaken whilst striking an appropriate balance between strategic rail freight benefits and the local impacts of freight activities. There will be an increased demand for the development of inter-modal

Freight challenges in London
40
terminals to support sub-regional and inter-regional distribution. This should be encouraged where it accords with other Mayoral policies.
Changes in competitive environment
C.�7. Changes in the competitive environment of the freight transport industry are expected to provide opportunities for rail freight to grow. It is important that the framework within which the industry operates facilitates this growth.
Customer requirements
C.�8. The commercial requirements of rail freight operators differ from the needs of passenger rail operators. In planning how to accommodate growth in both passenger and freight it is important that these differing needs are appreciated and taken into account.
Waterborne freight
C.�9. The PLA and British Waterways look after the Capital’s river and inland waterway systems respectively. The PLA is responsible for the Port of London, the largest port in the southern UK. It handles almost 55m tonnes, with another �.�m tonnes of traffic transhipped between its various terminals. It comprises the Port of Tilbury and over 60 operational terminals and wharves along the tidal Thames, including 50 wharves within Greater London.
6
5
4
3
2
1
0
Mill
ion
tonn
es
Aggreg
ates
Suga
r
Was
te
Unliste
d
Veg O
il & O
il See
d
Other
goods
Other
Metals
Vehicl
esSte
el
Chemica
ls Oil
Cemen
t
Figure C-2 Freight handled by the PLA at wharves in London, �005

4�
Modal change
C.40. Inland waterways include the non-tidal section of the Thames, the River Lea and Lee Navigation, the Grand Union Canal, Regent’s Canal, and the Limehouse Cut. Currently, little use is made of these waterways for freight. This offers an opportunity to relieve congested roads and reduce transport emissions. The challenge, in collaboration with the PLA and British Waterways, is to stimulate and develop new opportunities for freight.
C.4�. Opportunities will arise for waterborne freight to be used by major construction projects such as London �0��, Crossrail and Stratford City. The funding of Prescott Lock for London �0�� and its legacy development will allow the movement of �50 tonne barges onto the site from �008.
C.4�. Two key challenges are to identify, develop and realise the benefits for the London �0�� legacy period and to give early consideration of waterborne freight during the development of any near-water construction proposals.
C.4�. Low bridges, loss of water through more intensive use of locks, slow manual locks and dredging to support freight barges all need addressing. The challenges are to:
Secure funding for waterways and infrastructure development
Support an increase in waterborne freight with new barges and barge design, capacity and availability
Bridge a significant skills gap among those required to operate barges and boats on the waterways
Port growth
C.44. To take advantage of increased freight opportunities, the PLA forecasts that additional capacity will be required to handle increased cargo volumes to �0�5, both inside and outside Greater London. With likely major port developments along the Thames, including the recently approved London Gateway Port Development (Shell Haven), expected to generate up to �4,000 new jobs, there will be substantially increased container and other traffic.
C.45. Consideration for the development of strategic, secure consolidation points near the port development and London boundary is important – and should take into account the differences between China-Europe and Africa-Europe cargo.
C.46. Opportunities exist to adopt sustainable onward transport modes, particularly ship-to-rail. There may also be potential to tranship container and bulk cargoes
•
•
•

Freight challenges in London
4�
upstream, and to bring back into use a number of protected wharves through compulsory purchase and development.
Planning
C.47. Fifty wharves lying within Greater London are safeguarded by ministerial direction following the Mayor’s recommendations in the London Plan Implementation Report46. It is important to protect the �4/7 operational remit of these facilities and, by implication, the road access to them.
C.48. The Mayor’s power to secure river wharves along the Thames does not extend to canal wharves or the necessary supporting land. Studies of the Grand Union Canal have identified a number of development sites with the opportunity for inter-modal transfer and the distribution of waste, recyclates and construction materials47. Protection of these sites is provided for by the Land for Transport Function Special Planning Guidance, which may need to be enhanced and/or strengthened in the future.
C.49. Another challenge is to bring forward the development of facilities in balance with the social and environmental needs of local communities.
Air freight
C.50. Air freight continues to grow year-on-year and the London Plan (Further Alterations) recognises that adequate airport capacity serving a wide range of destinations is critical to the competitive position of London in the global economy48. Typically goods flown by air tend to be high value, low weight and time sensitive. Heathrow is responsible for �0 per cent of the UK’s international trade by value and accounts for 56 per cent of all UK air freight49.
C.5�. London’s airports have recently seen annual freight growth rates of between 8 and �4 per cent, though the industry expects that this will slow to an average of 6-7 per cent over the next �0 years. However there are specific industry sectors where growth is substantial. Courier and parcel sector ‘Integrators’ are expected to account for half of the UK’s airfreight market by �0�050. Ninety four per cent of air freight arrives and departs at Heathrow in the belly hold of
46 GLA (�005) Safeguarded Wharves on the River Thames London Plan Implementation Report
47 Peter Brett Associates (�005) West London Canal Network, Developing Water Borne Freight on the West London Canal Network, Vol� and Vol�.
48 Policy �C.6
49 CAA, Statistics Airport Data �005.
50 http://www.dft.gov.uk/stellent/groups/dft_aviation/documents/page/dft_aviation_0�6040.hcsp

4�
passenger aircraft, with the remaining 6 per cent arriving on dedicated freight-only aircraft5�.
C.5�. Heathrow’s attractiveness for the air freight industry is due to the range of destinations served by its airlines and the density and frequency of the schedules operated.
Modal change and efficiency
C.5�. Heathrow is also important in providing air freight services to the UK regions. The UK Air Freight Study Report5� estimates that, annually, �06,000 tonnes of air freight is trucked to and from Scotland through London. Heathrow also serves continental Europe and truck movements occur between Heathrow and key airports such as Frankfurt, Paris and Amsterdam. The challenge is to understand these freight flows, which could lead to modal change and efficiency opportunities.
C.54. It is estimated that there are about �.6 to �.0 million road trips per year associated with the various movements of air freight at Heathrow5�, with an inevitable impact on congestion. The challenge is to understand the onward road distribution of goods and identify opportunities for increased efficiencies and modal change.
C.55. There is evidence that road transport serving the air cargo industry does not always operate at an optimum efficiency level. Road trailers may be despatched by airlines, transit shed operators and freight forwarders to meet the requirements of individual flights, as opposed to consolidated loads.
Climate change and air quality
C.56. This intense level of road haulage activity takes time, costs money and is not ideal in environmental terms. In particular, high levels of NOx and in particular nitrogen dioxide (NO� - the more harmful component of NOx) recorded around Heathrow exceed the Government’s air quality targets. This is an area that requires close working and cooperation with all parties in the air freight industry.
C.57. When on the ground, planes contribute �� per cent of all London’s ground-based transport emissions54, so reductions in this area have the potential to deliver significant benefits.
5� CAA (�006) CAA Statistics, Table �5
5� HMSO (�000) UK Air Freight Study Report
5� UK Airfreight Study, Stage �, DETR Aviation Policy Unit, p85, �� August �00�
54 GLA (�007) Action Today to Protect Tomorrow, The Mayor’s Climate Change Action Plan

Freight challenges in London
44
Pipeline
C.58. Pipelines offer an alternative method of transportation that removes goods from the road. They typically supply water, remove sewage and waste products, and distribute and supply gas and petroleum products. Water and sewage are transported through an estimated ��8,000 km55 of pipes under London, offering the only door-to-door service alternative to the road network.
Congestion and delays
C.59. London’s expected growth will increase demand for water, sewage and petroleum-based products to be moved by pipeline, with the inevitable extension of existing networks (see the section on Utilities). The challenge is to promote the mode, but reduce the related disruption caused by maintenance, renewal or installation.
C.60. Sewage pipelines are susceptible to flooding. The challenge is to find ways of using rainwater harvesting and sustainable urban drainage systems to alleviate some of the localised impacts and reduce disruption caused to the road transport network.
C.6�. Following the incident at the Buncefield Depot and pipeline maintenance issues affecting key water, oil and gas operators, there is a recognised need to upgrade many existing oil, gas and water pipelines.
Modal change
C.6�. New pipeline systems are being developed and commercially installed (particularly in Scandinavia) for waste and recyclates. However, without appropriate consideration at the design stage, the opportunity to promote modal change will be lost.
C.6�. Underground freight pipelines are used at airports for baggage handling. The highly reliable MagLev System at Heathrow has been in use for over �0 years. This technology is being considered by other major world class cities and in the longer term could provide a fast, reliable and economic retail distribution system for London as surface congestion increases.
55 TfL (�006) Personal communication to TfL Freight Unit

45
Sector challenges
Retail freight
C.64. This sector is highly diverse and hugely important to sustaining London as a world class city. Projected growth in comparison goods and convenience goods is expected to increase annually by 4.8 per cent and � per cent respectively between �00� and �0�656. The planned growth in London’s population and workforce will increase retail demand, while the Capital’s rising appeal as a tourist, conference and leisure destination will further increase the demand for hotel, restaurant and leisure facilities.
C.65. While the retail and wholesale sector covers a complex range of supply chains, it is the sub-set of issues around local sustainable food distribution57 with low-carbon vehicles which is perhaps the most visible in terms of freight activity. However a recent study commissioned for the LDA58 suggests that to increase access to sustainable healthy food in support of the Mayor’s Food Strategy59 the focus should be on food procurement and a local sustainable food brand, along with ensuring sustainable food delivery through existing wholesale markets, rather than providing additional physical facilities.
Efficiency and out-of-hours deliveries
C.66. Based on this projected growth and the need for increased sustainable distribution of both convenience and comparison goods, there are opportunities to increase consolidation, out-of-hours deliveries and use of alternative modes, all of which reduce congestion and CO�, particulate and NOx emissions. This is a particular issue for smaller and medium-sized retailers where economies of scale affect the commercial viability of these activities. Attention is needed if these opportunities are to be brought forward and changes to supply chain operations made within a commercial environment.
Access to legal delivery facilities
C.67. Different types of retail outlet have very different delivery needs, some taking much longer than the �0-minute maximum imposed by on-street loading restrictions. The opportunity exists to consider freight PCN hotspot minimisation as part of the Network Management Duty.
56 GLA (�004) London Town Centre Assessment - Comparison Goods Floorspace Need; GLA (�005) London Town Centre Assessment - Convenience Goods Floorspace Need
57 London Sustainable Food Hub, Research Report, Sustain �005
58 Unpublished LDA Food Hub Study
59 Mayor of London Food Strategy, Healthy & Sustainable Food for London �006

Freight challenges in London
46
Planning
C.68. Some of the forecast growth in retail will be met through the expansion and redevelopment of existing facilities and more productive use of space. However new developments are also planned across London, including at Stratford, White City, Brent Cross/Cricklewood, Wembley, King’s Cross, Elephant and Castle, Kingston, Croydon and Battersea. Overall, the growth in floor space is expected to be around 0.8-�.�m m� for comparison goods and 0.� to 0.�m m� for convenience goods by �0�660.
C.69. Ensuring that sufficient freight facilities are provided in new retail developments is essential. It is especially important for large centres where consolidation of deliveries could provide substantial congestion and environmental benefits.
C.70. The challenge is to ensure that developers address freight issues during both the construction and operation phases of a development, through a transport assessment. In addition, regulatory authorities should apply conditions requiring consolidation and out-of-hours deliveries, as appropriate, as well as requiring proper design of freight facilities to help minimise illegal activity and trip numbers. This is particularly important for mixed use developments, to minimise the impact of deliveries to acceptable levels for all users.
C.7�. In order to support the rejuvenation of town centres and prevent further movement to out of town retail development, where it may be easier to deliver goods, active consideration should be given to deliveries in town centres and managed developments.
Courier freight
C.7�. The courier industry is extremely diverse and faces many challenges delivering in London. For all companies in the sector, the internet poses both a threat and a significant growth opportunity. The threat takes the form of product substitution, eg increased use of email reducing physical document movement, whilst the growth opportunity comes from increased internet purchasing within the consumer and business markets.
First-time delivery
C.7�. About 50 per cent of UK households are unoccupied during normal working hours and �0-40 per cent of deliveries of items that cannot fit into the letterbox fail first time. In such instances, the courier may reattempt delivery a number of times, or the recipient may make a journey to collect from a local
60 GLA (�004) London Town Centre Assessment - Comparison Goods Floorspace Need GLA (�005) London Town Centre Assessment - Convenience Goods Floorspace Need GLA (�006) Mayor of London, Central London Sub Regional Development Framework

47
depot, leading to unnecessary vehicle trips. Finding ways to increase first-time delivery success and reduce vehicle activity is important and can be built into new developments.
Access to legal delivery facilities
C.74. The vast majority of courier goods are delivered to road and street frontages, resulting in operators needing to park and unload in relatively close proximity. Access, provision and contractual use for legal loading is therefore a key operational efficiency concern for the sector.
Consolidation and modal change
C.75. Reducing the overall number of courier vehicles would deliver key environmental benefits. For example, the flow of courier products from the airports into London for same-day delivery generates significant vehicle movement. Gaining access to data on these flows may help identify and develop proposals for consolidation and modal change.
C.76. There appears to be potential in specific areas of high delivery/collection concentrations for a switch to foot, cycle or trolley delivery. Realising this potential economically is a challenge.
C.77. Nominated carrier schemes (ie where access is restricted to a limited number of carriers) are not generally welcomed by the courier sector and may be considered anti-competitive. However, sector consultees to the draft Plan supported the application of such schemes in major developments (eg London �0��) and other sites, such as hospitals, as they offer opportunities for consolidation.
Servicing and maintenance
C.78. This sector has unique needs in terms of parking, access and loading/unloading times. It includes the following operations:
Removals and relocation
Cash-in-transit;
Newspaper distribution
Supply of office consumables
Building facilities management and maintenance, eg cleaning and lift servicing
Supply to hotels, hospitals and educational establishments
•
•
•
•
•
•

Freight challenges in London
48
Access to legal delivery facilities
C.79. The removals sector is concerned about loading/unloading time limits, permits and the administration process associated with dispensations and/or suspensions. Overcoming this challenge will require a partnership approach to provide a coordinated service that meets these needs.
C.80. The cash-in-transit sector seeks to park as close as possible to premises to enable the safe transfer of cash and valuables. It does not support increases in provision of night-time deliveries due to concerns about crime. In �006, 4�5 attacks were made on cash-in-transit vehicles in the Metropolitan Police Service area6�.
C.8�. Pursuant to Section �7 of the Crime and Disorder Act �998, highway authorities have a duty to help design-out crime. There is an opportunity to exercise this duty in relation to cash-in-transit as part of street redevelopments.
Out-of-hours servicing and maintenance
C.8�. The increasing difficulties of making servicing and maintenance trips in London is seen as a cause of rising costs and decreasing efficiency by sector operators. Some organisations are looking at alternative ways of servicing. Further work is needed to develop best practice, including exploring the potential of pick up/drop off and locker boxes which have worked well elsewhere.
Oil and chemical freight
C.8�. The main activity in this sector is the distribution of petroleum products from regional depots located on the periphery of London to large users and to retail forecourts.
C.84. Some of the key issues for the sector revolve around protecting local communities and the environment. These can be summarised as:
Tighter control of high risk and dangerous goods
Increasingly stringent anti-pollution measures relating to the use, storage and distribution of chemicals and fuels
Measures to ensure goods are transported safely
Route planning
C.85. Fuel distribution is likely to remain largely road-based. Suitable information to enable efficient route planning for the carriage of oils and chemicals is
6� Source: BSIA �5/�/�007
•
•
•

49
important, including the provision of information and regulations, such as bridge height and tunnel restrictions.
Modal change
C.86. The industry will have to respond to changes in fuel usage and the types of fuel used, which may influence distribution operations as different vehicles may be required to distribute different fuel types.
Out-of-hours deliveries
C.87. The delivery of fuel at night appears to have some significant benefits given the potentially hazardous nature of the product and the overall demand for road space. Whilst a number of operators deliver at night, the level of activity and future potential needs to be understood.
Alternative fuels
C.88. Proposals for the development of sites in London for the production of cleaner fuels, such as bio- or synthetic diesels utilising waste oil and other wastes, will also have impacts on the distribution, transport and development of outlets. Electrically powered vehicles have an added advantage in that their ’fuel‘ does not require special transportation.
Construction freight
C.89. The construction industry uses a large range of commodities, from bulk aggregates to the smallest fittings. Delivery times are imposed by sites and sometimes by borough curfews. Vehicles from a vast array of suppliers frequently travel long distances. Congestion and delays on the main trunking routes can lead to delivery windows being missed and goods being sent back.
C.90. Alternatively, loads arriving early may have to wait, often causing congestion and attracting parking fines. Both these scenarios can lead to difficulties with drivers exceeding their allowed hours. These factors contribute to just 50 per cent of deliveries arriving at the right place at the right time.
C.9�. Site-generated construction and demolition waste is a particular concern. New regulations coming into force in �0086� will require construction sites for works over £�50,000 to have a site waste management plan. As materials are left on-site in bulk, theft and damage can lead to over-ordering and increased costs. Damaged and even unused goods are often treated as waste.
6� NetRegs http://www.netregs.gov.uk/netregs/legislation/�805�5/�555007/

Freight challenges in London
50
Consolidation
C.9�. The London Construction Consolidation Centre (LCCC) pilot has been running since September �005 and shows significant transport and construction efficiency benefits, such as increased delivery reliability (97 per cent), a reduction in vehicle trips to site and local emissions (of 75 per cent each) and the potential to reduce site waste.
C.9�. The challenge for London is to promote the widespread adoption of this concept. This can be achieved through:
Construction clients requiring the consideration and/or use of consolidation through their contracts
Developers and contractors choosing to use consolidation for good practice and economic/productivity considerations
Encouraging construction consolidation through the planning process by using site construction plans, Construction Statements and transport assessments for construction and operational phases to minimise trips, contract deviation and waste
Drawing on the Mayor’s Supplementary Planning Guidance on sustainable design and construction and the London Best Practice Guide on Construction: The control of dust and emissions from construction and demolition
Contract award criteria that encourage freight companies to actively demonstrate logistics best practice
Modal change
C.94. The road network has limited ability to expand. More consideration needs to be given to the use of water and rail for construction traffic, though it should be recognised that such opportunities will only arise under certain conditions, especially as rail already carries around 40 per cent of construction traffic.
Waste
C.95. In �00�, the Capital produced about �8m tonnes of waste. This is expected to rise to ��.5m tonnes by �0�0 as London grows6�. One of the Mayor’s goals is to manage 85 per cent of London’s waste within London by �0�0, compared with the current rate of 60 per cent. A particular issue is that of the freight demand generated by the expected increase in recycling, which is predicted to
6� GLA (�006) The London Plan Spatial Development Strategy for Greater London: Housing provision targets, waste and minerals alterations, GLA
•
•
•
•
•

5�
grow as local authorities and businesses aim to meet more rigorous recycling and recovery targets.
C.96. The shift to greater levels of recycling could significantly alter the economic balance of existing bulk waste shipments. Therefore consideration should be given to locating new facilities where there is established or easy to deliver rail/water access to help prevent a proliferation in recycled material vehicle shipments being moved across London by road.
Road transport minimisation and efficiency
C.97. The Mayor estimates that �08 new waste management facilities64 will be needed across London to reduce the Capital’s dependency on landfill sites in other regions. The locations of these facilities will affect their waste transport requirements and impacts. The challenge is to ensure that strategic planning and development proposals keep waste transport impacts to a minimum.
C.98. The road transport impact could be further reduced if commercial, industrial and municipal solid wastes were jointly managed locally.
C.99. Recent applications of road-only logistics routing and scheduling software applied to council waste collection rounds elsewhere in the UK have yielded reductions up to �5 per cent in distances travelled65. The challenge is to encourage cooperation between neighbouring businesses so that commercial and industrial waste collection can be more easily optimised.
C.�00. Changing logistics practices to use other modes or to consolidate loads requires innovative waste collection equipment. TfL is undertaking preliminary trials of a new Multi-modal Refuse Collection Vehicle (MMRCV), which would be of an open design and free for use in London.
C.�0�. The challenge for the sector will be to adopt inter-modal vehicle designs which can increase movements by water and rail. Identifying ways to introduce the MMRCV into London’s waste fleets will bring significant benefits in areas where the direct delivery to local recovery facilities is not possible.
64 GLA (�005) The draft London Plan Alterations Planning for Waste, Planning for Minerals,
65 DfT (�006) Optimising Vehicles undertaking waste collection, Transport Research Group, University of Southampton.

Freight challenges in London
5�
Multi-modal Refuse Collection Vehicle – key facts
Based on data from two London boroughs (Royal Borough of Kensington and Chelsea and London Borough of Redbridge), if similar reductions could be achieved across the whole of London, savings could be in the order of:
�7 per cent reduction in the number of vehicles
�0 per cent cost reduction
�8 per cent mileage reduction
CO� emissions reduction
•
•
•
•
Planning
C.�0�. Waste authorities will have the role of working with the Mayor, LDA, each other and the planning authorities to protect inter-modal facilities and maximise the use of sustainable modes of transport.
C.�0�. Clients and planners must ensure that waste arising from the demolition and operation of new and existing developments is either managed on-site and/or managed to minimise the road distances travelled to the sites that receive these wastes for reuse, treatment or disposal.
Fly-tipping
C.�04. The dumping of waste material in public spaces is both anti-social and illegal. It requires local authorities, at taxpayers’ expense, to clear it up and gives an unfair competitive advantage to any illegal operator involved. London appears to have the worst problem: more than �8,000 fly-tipping incidents were reported each month in �005/6, with 79 per cent of these occurring on public highways66.
C.�05. The challenge will be to address these issues, including removing the unfair competitive advantage gained by illegally operating companies. This issue is one of the concerns monitored by the sustainable freight progress measures.
Energy from waste
C.�06. Bio-degradable waste is a renewable source of methane and can be used as a fuel for either stationary or transport applications. As the Landfill Directive67 sets decreasing target limits for municipal bio-degradable wastes sent to landfill, there is an opportunity to introduce waste management processes
66 Defra (�007) London Flycapture Results, April 2005 to March 2006
67 Landfill Directive �999/��/EC

5�
to treat bio-degradable waste and turn it into a renewable fuel. The Climate Change Action Plan contains a target for the waste and biomass industry to contribute �.�m tonnes of carbon savings per year.
Utilities
C.�07. Utilities are businesses using underground or overground equipment to physically or electronically move goods or information. Gas, electricity, telecommunications, water and sewage companies all fall into this sector.
C.�08. There are over �00 utility companies operating in London. The majority are small or medium operators. Because many vehicles used by such companies will be less than �.5 tonnes it is unclear how many vehicles actually operate in this sector.
C.�09. It is believed that some of the larger utility companies operate fleets of about �00 vehicles over �.5 tonnes inside the Capital. The number of such utility vehicles in London could exceed �,000 and there may well be three to five times this number of vans.
C.��0. Utilities maintenance and renewal leads to street-works, congestion and delays. In �006/07 nearly �70,000 roadworks affecting all of London’s boroughs were recorded on the TfL LONDONworks database. Of these over �5,000 lasted for a week or more.
Fleet efficiency
C.���. The challenge is to encourage the uptake of best practice for fuel efficiency, operational road risk and PCN reduction by operators which could offer significant congestion, emission and safety benefits for London.
Client responsibility
C.���. Many utility companies frequently employ contractors to undertake roadworks on their behalf. As utility companies can choose the criteria they expect contracted operators to comply with, the challenge is to encourage them to specify contractors employing demonstrable best practice.
Traffic Management Act responsibility
C.���. The Traffic Management Act �004 places a duty on all traffic authorities to make sure road networks are managed effectively to minimise congestion and disruption to vehicles and pedestrians. TfL and the boroughs are the traffic authorities responsible for London’s road network. TfL is responsible

Freight challenges in London
54
for facilitating cooperation between London’s traffic authorities and utility companies requiring planned road and street-works.
C.��. Utilities vehicles and those of contractors maintaining the underground infrastructure are at risk from PCNs. The challenge is to ensure parking enforcement agencies take into account situations where vehicles off-loading materials and specialist plant can make rapid deliveries to site without penalty.
C.�4. Encouraging TfL and the boroughs to use the principles of best practice to ensure utility companies minimise network disruption caused by uncoordinated street-works would also reap dividends.
Potential CO2 savings through modal change/shift
C.��6 The potential environmental benefits of a change from road to water or rail are considerable. However, the economic and practical opportunity for modal change is limited, given the key advantage of flexibility that road-based transport offers. To realise a �0 per cent modal shift to rail of the 48m tonnes of road freight moved to London each year, new large-scale rail terminals would need to be sited on the edge of London. Such a shift could produce about an 80,000 tonne CO� saving per year, mainly outside London.
C.��7 There could also be a modal switch within London to canal and river. A five per cent modal shift to water of the 55m tonnes of road freight moved within London could achieve about a 4,000 tonne CO� saving per year. In addition, a switch from road to walking and cycling by couriers has the potential to reduce delivery and collection trips: initial estimates suggest that a total of 75,000 van km, equating to about �0 tonnes of CO�, could be saved per year. In terms of municipal waste, the London Plan sets out the policy that, as far as is possible, waste is managed locally68, thus minimising transport impacts. Initial estimates for the CO� saving arising from this policy are included in the 4,000 tonnes of CO� saving identified for modal switch to river and canal.
Table C-2 Freight modal change CO� saving (�0�5)
Opportunity Tonnes CO� per year saved
Rail 80,000
Water 4,000
Walk/Cycle �0
Total 0.08 mt/y
68 Mayor of London �004 The London Plan Spatial Development Strategy for Greater London, Policy 4A.�

55
C.��8 Table C-� above provides provisional estimates of potential CO� savings from assessed modal change69 opportunities. Further savings from sector supply chain configuration changes are likely to add to the 0.08mt/y shown.
69 An in-depth analysis of this potential can be found in Appendix D: Climate Change; paras 9 to �6 inclusive on pages 95 - 97

Part D - The delivery plan This section of the Plan summarises the key elements outlined in Parts B and C that the Plan must address. It details the projects and workstreams developed in response to this and the feedback received on the draft Plan.
Progress measures are described that will assess how initiatives are contributing to the attainment of the vision for sustainable freight distribution in London Modal Challenges.
To help understand how the plan contributes to the Climate Change Action Plan and safety agenda, summary figures are included.
The section concludes with an analysis of aligning funding and resources that will enable effective delivery of the Plan.
Summary of key elementsD.�. The key elements outlined in Part B that the delivery plan will need to address
include:
Focusing on the GLA Group’s role in leading others in the boroughs, education and health sectors
Increasing the use of green fleet practices where there is direct control and as part of a travel plan approach for building operations, using green procurement practices wherever possible, and alternative modes where practical
Increasing the use of green fleet practices as part of a travel plan approach for construction and development operations, using green procurement practices wherever possible, and alternative modes where practical
Integrating freight considerations into the travel plan process, with links in turn to the planning process and the use of planning conditions, to require freight to be detailed in transport assessments for construction and building operations. These assessments will indicate how green fleet procurement,
•
•
•
•
56

57
provision and contractual use of legal loading facilities and techniques such as consolidation all contribute to reduced CO� emissions
Maximising reliability through Network Management Duty and the reduction of congestion caused by illegal kerbside delivery and servicing activity
Developing partnerships to share responsibility for action and gain commitment for private sector investment
Securing access to better and more reliable freight data
D.�. The key elements outlined in Part C that the delivery plan will need to address include:
Increasing reliability
Improving efficiency by reducing PCNs, administrative costs, fuel use, etc
Moving more freight while reducing vehicle km and CO� emissions
Securing development of intermodal facilities and promoting modal shift towards more sustainable forms of freight transport
Increasing safety, particularly for pedestrians and cyclists
Improving driver standards and availability
Taking advantage of less congested roads and railways during out-of-hours periods
Reducing illegal operations, thefts and crime
Shaping prioritiesD.�. During the Plan’s development and throughout the consultation process, freight
stakeholders in general and members of the LSDP in particular have helped to address the varied and disparate needs of the freight community. However this process has proved challenging.
D.4. Following this extensive consultation process, including a period of further engagement with London Councils and the boroughs, the original eight draft proposals and ��4 identified tasks have been revisited and simplified.
D.5. Publication of the Mayor’s Climate Change Action Plan placed an additional demand to show how the Plan contributes to meeting CO� reduction targets.
D.6. A delivery-focused plan is presented which capitalises on the lessons learnt during the consultation. This represents only the first steps towards understanding and addressing the freight agenda. It is essential that the plan remains flexible enough to take advantage of new opportunities and emerging needs and is developed and built upon in any revision of the Mayor’s Transport Strategy.
•
•
•
•
•
•
•
•
•
•
•

The Delivery Plan
58
Projects and workstreamsD.7. The original priorities are now aligned as four key projects with three
supporting workstreams. These will help TfL, other statutory agencies, London Councils, boroughs, operators and businesses to forge closer links and work together to make a real difference in London and for Londoners.
D.8. Assessment of the potential impacts of the projects and workstreams on the sustainability of London’s freight operations is included in Appendix B.
D.9. The four key projects, already at pre-launch stage and designed to commence their delivery phases in the autumn of �007, are:
1. Freight Operator Recognition Scheme, designed to promote green fleet practices, increase driver and operations manager skills for working in London, reduce CO�, improve efficiency and reduce collisions, particularly with pedestrians and cyclists. The scheme also provides industry standards to help clients procure sustainable freight operators.
2. Delivery and Servicing Plans (DSPs), or the use of the travel plan approach and green fleet procurement, to reduce the freight CO� emissions of a building’s operation. Provides a tool for use by Traffic Authorities and Planning Authorities to improve reliability.
3. Construction Logistics Plans (CLPs), or the use of the travel plan approach and green fleet procurement, to maximise the use of alternate modes and reduce the freight CO� emissions of a construction or development operation. Provides a tool for use by Traffic Authorities and Planning Authorities to improve reliability.
4. Freight Information Portal (FIP), helping to share best practice, reduce administrative burdens and improve efficiency. Provides a single place to go for information about delivering in London.
D.�0. These four projects are supported by three workstreams:
1. Partnership Development (including LSDP and sub-regional FQPs) to promote greater coordination of freight investment, better access to resources and improved local links between boroughs, businesses and operators.
2. Major projects focused on promoting modal change from road to more sustainable alternatives (such as rail and water), and on reducing CO� emissions, will be developed as they arise and as funding is secured.
3. Data, modelling and best practice to identify case studies where green fleet management, use of alternative modes and low-carbon vehicles has resulted in reduced CO� emissions and collisions.

59
D.��. A brief summary of key milestones is included.
D.��. The main roles and responsibilities are identified and benchmarks included to help clarify the key responsibilities of the boroughs in helping to deliver the Plan and to assist in coordinating their contribution. The benchmarks are also intended to help boroughs identify their progress and comparative performance in delivering the Plan. Updates will be provided in an annual London Freight Progress Report. Baselining the benchmarks will be undertaken during �007.
Projects
Project One - Freight Operator Recognition Scheme
D.��. This project is designed to encourage freight operators to take up green fleet management and the use of best practice and to increase the sustainability of London’s freight distribution. The project has already been developed with trade union involvement and with close collaborative partnership70 to engage effectively with freight operators and facilitate the sharing of information.
D.�4. The scheme will be London’s cornerstone for promoting the safe, reliable and efficient movement of freight and servicing trips to, from and within London, in balance with the needs of other transport users, the environment and Londoners’ quality of life.
D.�5. Operators will join the scheme as members, with tiers of membership reflecting freight operator achievements. It will offer members incentives to increase the sustainability of their operations and to develop their skills, including best practice development for:
Training to improve safety and reduce CO� and emissions
Maintenance, to improve safety and reduce fuel consumption, CO� and emissions
Management of road risk to improve safety, particularly for pedestrians and cyclists
Fuel efficiency, to save costs and reduce CO� and emissions
The use of low-carbon engine technologies such as hybrid and electric vehicles, hydrogen fuel cells and biofuels to reduce CO� and emissions
70 Metropolitan Police: Skills for Logistics: Vehicle and Operator Services Agency (VOSA): Department for Transport (DfT): Health and Safety Executive (HSE): Road Haulage Association (RHA): Freight Transport Association (FTA)
•
•
•
•
•

The Delivery Plan
60
D.�6. Members demonstrating commitment to scheme standards will be rewarded with valuable benefits. Conversely those repeatedly failing to progress or meet agreed standards may find their benefits downgraded or membership withdrawn.
D.�7. A Commercial Vehicle Education Unit (CVEU), with representatives from the Metropolitan Police Service (MPS), Health and Safety Executive (HSE) and Vehicle and Operator Services Agency (VOSA), will encourage legal compliance. The unit will have solid links with parent organisations to ensure effective and coordinated enforcement. It will also undertake education to raise awareness of the need to avoid collisions, particularly with pedestrians and cyclists.
D.�8. The GLA Group will lead in requiring its own and contracted delivery and/or servicing fleets to be registered with the scheme. London’s local authorities, together with other government bodies, will be encouraged to adopt the same approach.
D.�9. This will promote the various levels of membership of the scheme as the quality standard for sustainable freight distribution, with legal compliance at its heart. In time, the use of scheme-registered companies will become the norm for delivery and servicing contracts, and a requirement of planning applications.
D.�0. Across London, industry and borough initiatives such as the Considerate Contractors scheme will be aligned to the scheme. In addition, annual Freight Operator Recognition Scheme awards will recognise outstanding performance.
D.��. Benefits will be developed recognising operator needs. These will include a subsidised training programme called London Freight Booster which will include an NVQ Level � qualification that supports the ongoing competencies requirements for drivers.
D.��. Members will benefit from advice about fuel efficiency, PCN reduction, legal record keeping and the management of occupational road risks. Tailored action plans to help reduce collisions, emissions and costs will also be developed.
Impacts
D.��. The economy in London will improve as scheme members receive help, guidance and advice to reduce PCNs and improve journey reliability.
D.�4. The environment will benefit as freight’s air quality impacts are lessened by reducing fuel consumption (therefore CO� and emissions), improving vehicle maintenance and driver training, and using less-polluting vehicles. Fly-tipping will be reduced through the use of responsible, scheme-registered companies for waste disposal.

6�
D.�5. Society will be improved by reducing casualties and fatalities, particularly among pedestrians, cyclists and drivers of powered two-wheelers.
Milestones
�. By spring �008, scheme registration and level � membership will be in place, with level � incentives developed for trial
�. By spring �008, the London Freight Booster for drivers and managers will be in place
�. By spring �008, fuel efficiency support staff will be in place
4. By autumn �008, scheme level � and level � will be in place with level � and � incentives developed
5. By autumn �008, VOSA resources will be included within the Commercial Vehicle Education Unit
6. By spring �0�0, 75 per cent of TfL, GLA Group and boroughs’ own and contracted fleets will be signed up
7. By spring �0�6, 50 per cent of HGV and van fleets serving London will be signed up
Roles and responsibilities
Roles Responsibilities
Provision of Freight Operator Recognition Scheme services
TfL, Commercial Vehicle Education Unit (CVEU) of the Metropolitan Police Service (MPS), Health & Safety Executive (HSE), Vehicle Operator Services Agency (VOSA), Learning and Skills Council training network, FTA, RHA
Potential members Freight operators based in London, freight operators delivering into London
Associated enforcement MPS, CVEU, VOSA
Promotion TfL, GLA Group, boroughs, sub-regional Freight Quality Partnerships, Department for Transport, FTA, RHA, other relevant trade associations
Monitoring TfL, CVEU (MPS, HSE, VOSA), Learning and Skills Council training network, FTA, RHA
Borough benchmark All borough freight fleets to be Freight Operator Recognition Scheme-registered
Project Two - Delivery and Servicing Plans (DSPs)
D.�6. These plans will be the freight equivalent of employee travel plans and will ultimately be integrated into the travel planning process. They include the

The Delivery Plan
6�
consideration of consolidation and collaborative delivery arrangements to help reduce the impact of commercial goods and servicing vehicle activity in and out of premises/developments.
D.�7. DSPs will have three main elements:
A plan to reduce the number of trips, particularly in the peak period, justified by a transport assessment that considers the benefits of using consolidation
A plan showing when and where deliveries and servicing can take place safely and legally
Details of contractual changes requiring suppliers and servicing companies to reduce the number of trips and to use legal loading facilities. The selection process for supply and servicing contracts will specify Freight Operator Recognition Scheme membership
D.�8. The use of Freight Operator Recognition Scheme members will have additional environmental, economic and social benefits. Organisations using this approach will be able to demonstrate best value and environmental credibility.
D.�9. Due to the difficulty in securing adoption of this approach, TfL and the GLA Group will take the lead in developing DSPs for all of their premises.
D.�0. Corporate and Social Responsibility measures will be used to promote the adoption of a similar approach by borough councils, waste collection authorities, waste disposal authorities, other local government bodies, health authorities and key private sector businesses generating a significant volume of peak period delivery or serving trips.
D.��. In time, borough and GLA planners will require all large planning applications for developments and all smaller developments over an agreed threshold to develop and implement DSPs. Plans will be tracked through the Travel Plan iTrace system and will feed the TRAVL database to provide valuable freight data.
D.��. To help prioritise where attention should be focused in line with the Traffic Management Act �004, London’s traffic authorities will be encouraged to monitor the location and density of penalty charge notices for commercial vehicles.
Impacts
D.��. Efficiency of the economy will improve as commercial vehicle PCNs are reduced by the contractual use of legal loading facilities and scheme-registered
•
•
•

6�
operators. Reliability will also increase as freight operators reduce trips and make more off-peak and out-of-hours deliveries.
D.�4. The environment will improve through a reduction in congestion, the take-up of initiatives such as consolidation and the promotion of a long-term shift to more sustainable forms of freight.
D.�5. Society will benefit from a reduction in casualties as freight vehicles make more use of off-peak and out-of-hours delivery and servicing times. The use of legal loading plans for cash-in-transit activities - and access to the Commercial Vehicle Education Unit’s local insight into problem areas – will also cut the number of thefts.
Milestones
�. By winter �008, five TfL funded coordinator posts will be in place for DSPs and Construction Logistics Plans (see below)
�. By winter �0�0, the GLA Group will have drawn up DSPs and legal loading plans for all of its premises
�. By spring �0�0, TfL and boroughs will have addressed priority PCN Hotspots in response to their Network Management Duty
4. By spring �0��, borough DPDs will be modified where necessary to require Delivery and Servicing Plans in the planning process
5. By winter �0�6, DSPs and legal loading plans will be drawn up for a prioritised list of premises including those of borough councils, development agencies, health authorities and key private sector businesses premises

The Delivery Plan
64
Roles and Responsibilities
Roles Responsibilities
Provision of DSP advice TfL, DSP/CLP officers, sub-regional FQP secretariat, sub-regional coordinators
Those needing DSPs GLA Group, borough councils, waste collection authorities, waste disposal authorities, other local government bodies, LDA, health authorities, private sector businesses generating high volume of peak freight trips, planning applicants
Associated enforcement Borough Development Control officers, TfL and GLA Land-use Planning Team
Promotion TfL, GLA Group, boroughs, traffic authorities, sub-regional Freight Quality Partnerships, Department for Transport, FTA, RHA, other relevant trade associations
Monitoring TfL, sub-regional DSP & CLP officers
Borough benchmark Borough DSP developed with Freight Operator Recognition Scheme promotion
Borough Network Management Duty approach to include minimising priority PCN hotspots
DPD requirement for DSP development
Project Three - Construction Logistics Plans (CLPs)
D.�6. These plans are very similar to the DSPs described above and will also be integrated into the travel planning process. They cover:
The design of buildings to maximise benefits of implementation
Delivery operations during the construction phase
D.�7. The plans will consider consolidation and other techniques to help minimise trips (particularly in peak times), lane closures and illegal waiting/loading activities. This will in turn reduce congestion and emissions.
D.�8. The plans also link supply and site servicing contracts to Freight Operator Recognition Scheme membership with the associated benefits of reduced emissions, collisions, congestion and costs this brings.
D.�9. CLPs will have four main elements:
•
•

65
Encouraging the inclusion of design features to minimise the number of delivery trips during the operation phase of the building (when the Delivery and Servicing Plan will be enacted)
A plan to reduce the contract duration and the number of trips, particularly in the peak period, together with a Site Waste Management Plan, justified by a transport assessment that considers the benefits of using consolidation
A plan showing when and where deliveries and servicing can take place legally
Details of contractual changes that require suppliers and servicing companies to reduce the number of trips and to use legal loading facilities (eg through Freight Operator Recognition Scheme membership)
D.40. As with Delivery and Servicing Plans, TfL and the GLA Group will take the lead in requiring their own construction projects to develop and use CLPs. Suitable assessment criteria, including Freight Operator Recognition Scheme membership, will be drawn up to demonstrate best value and operator sustainability for delivery and site servicing contracts.
D.4�. Corporate and Social Responsibility will be promoted to encourage the adoption of similar good practice by public organisations such as local authorities, housing associations, development agencies and health authorities.
D.4�. In time planning applications for all major developments, along with smaller developments over an agreed threshold, will require the submission and implementation of CLPs.
D.4�. To help target improvements in reliability, London’s traffic authorities will be encouraged to require developments located on capacity-sensitive links to demonstrate how lane closures and illegal waiting/loading will be minimised for deliveries, and how construction duration and the total number of deliveries will be reduced.
•
•
•
•

The Delivery Plan
66
Impacts
D.44. The economy will benefit from an increase in legal loading and improvements in reliability resulting from fewer trips, a reduction in construction duration and illegal waiting at or near sites, and the promotion of off-peak and out-of-hours deliveries.
D.45. In terms of the environment, air quality impacts will be reduced by minimising site deliveries and using the most sustainable forms of freight available.
D.46. Society will be improved by reducing the number of casualties caused by freight vehicle accidents, by minimising congestion and deliveries, and by reducing theft through the use of consolidation centres.
D.47. As with Delivery and Servicing Plans, by linking supplier contracts with Freight Operator Recognition Scheme membership, the wider benefits of the scheme can be accelerated.
Milestones
�. By spring �008, GLA Group will prioritise a list of construction projects requiring CLPs
�. By spring �0�0, CLPs will be in place for all appropriate new contracts
�. By spring �0�0, borough councils, waste disposal authorities, housing associations, other local government buildings, development agencies and health authorities will establish CLPs for all appropriate new contracts
4. By spring �0�0, TfL and boroughs will implement CLPs for developments on the TLRN/SRN
5. By Spring �0��, borough DPDs will be modified where necessary to require CLPs as part of the planning process

67
Roles and Responsibilities
Roles Responsibilities
Provision of CLP advice TfL, CLP and DSP officers, sub-regional FQP secretariats, sub-regional coordinators
Drafting of CLPs GLA Group, borough councils, other local government bodies, LDA, health authorities, large private sector developments and those above agreed threshold
Associated enforcement TfL, Borough Development Control officers
Promotion TfL, GLA Group, boroughs, traffic authorities, sub-regional Freight Quality Partnerships, Department for Transport, FTA, RHA, other relevant trade associations
Monitoring TfL, CLP and DSP officers
Borough benchmark CLPs developed for all borough construction work with Freight Operator Recognition Scheme compliance included
Borough Network Management Duty approach to include minimising construction site lane closures and illegal waiting/loading
DPD requirement for Construction Logistics Plan development
Project Four - Freight Information Portal
D.48. The portal aims to simplify the complicated array of information and requirements from differing sources facing operators in London. Users of the portal are expected to include freight operators and drivers, Freight Quality Partnerships, businesses, freight associations, and local and national government.
D.49. By providing information more effectively, the portal should encourage efficiency and the uptake of best practice. The portal will enable access to a range of services offered by a wide range of partners facilitated through a single point of reference.

The Delivery Plan
68
D.50. In addition to these services, the portal will enable effective dissemination of information on best practice, Freight Quality Partnerships and updates on the projects and workstreams contained in this Plan.
D.5�. Links to national and international content will include a London-centric Freight News feature with, as a key example, the opportunity to highlight successful actions taken against persistent fly-tipping offenders.
D.5�. The development of information on the portal will be linked to the operator priorities identified by an expanding Freight Operator Recognition Scheme membership. This will allow the freight community to more efficiently and effectively plan journeys, increase journey time reliability and reduce emissions, while enabling TfL to better manage freight movements in balance with other road users.
Impacts
D.5�. The economy will benefit from freight operators having improved access to legal loading information and permit/exemption systems to help them reduce the number of PCNs. Smoother journeys will result from the provision of journey time reliability information and journey planning systems promoting off-peak and out-of-hours deliveries. Increased compliance with loading restrictions will also reduce congestion.
D.54. The environment will be improved for the same reasons mentioned above, along with reductions in fuel use and emissions and fly-tipping incidents.
D.55. Society will be improved by reducing the number of casualties involving freight vehicles and by promoting off-peak and out-of-hours delivery and servicing times. The number of thefts associated with freight activities on London roads will also be reduced through better crime data and by highlighting successful action against offenders.
Milestones
�. By autumn �007, a portal development strategy and marketing and promotional approach will be agreed
�. By winter �008, stage � implementation will be completed, including initial services and Freight Operator Recognition Scheme incentives
�. By winter �0�0, stage � implementation will be completed, including further services and Freight Operator Recognition Scheme incentives
4. By winter �0��, stage � implementation - including ongoing support and plans for future development – will be completed

69
Roles and responsibilities
Roles Responsibilities
FIP users TfL, sub-regional FQP members, businesses, operators, boroughs
Main FIP contributors TfL, boroughs, London Councils
FIP supporters FTA, RHA, other relevant trade associations, LDA, Learning and Skills Council, Department for Transport
Promotion TfL, GLA Group, boroughs, sub-regional Freight Quality Partnerships, Department for Transport, FTA, RHA, other relevant trade associations
Monitoring TfL
Borough benchmark Provision of updated electronic data on parking and loading
Provision of updated electronic data on speed limits
Provision of updated electronic data on width, weight, height restrictions
Agreement to develop pan-London parking regulations exemptions / permit system
Workstreams
Workstream 1 - Partnership development
D.56. TfL cannot deliver the Freight Plan alone. Partnership is absolutely vital if the vision for sustainable freight distribution is to be achieved. To successfully secure access to funds and better alignment of projects it is essential that TfL concentrates much of its activity on developing and supporting partnerships.
D.57. The investment in freight, staff and money that any one partner is able to make adds to the potential total if all partners work together.
D.58. The London Sustainable Distribution Partnership (LSDP) will remain the main focus for TfL and the GLA Group to engage with the freight and business communities on strategic freight issues.
D.59. The LSDP will continue to have widespread representation from the freight industry, business and London’s FQPs in addition to specialists with knowledge and expertise on freight related matters.

The Delivery Plan
70
D.60. The LSDP will identify the need for guidance, help inform and oversee the development of initiatives and align work from partner organisations to maximise investment and progress towards the vision for sustainable freight distribution in London.
D.6�. Sub-regional FQPs will be fully established throughout London’s sub-regions and their activities supported by TfL-funded borough posts.
D.6�. They will prioritise freight investment, identifying where more local initiatives are needed and where opportunities for modal shift can be taken forward, and will share expertise and advice on freight best practice to maximise progress.
D.6�. They will have agreed action plans contributing to the aims of the Plan by specifically reducing commercial vehicle PCNs, collisions, fly-tipping and thefts and increasing Freight Operator Recognition Scheme membership.
D.64. Sub-regionally, FQPs will have practical communications and marketing strategies to achieve widespread awareness and active member participation. There will be two-way dialogue between the freight industry and with other stakeholders to promote the use of the Plan’s Operators’ Guide and to share best practice.
D.65. FQPs will assist in gathering commercial vehicle PCN data to prioritise hotspots (before commercial vehicle PCN flags are introduced by all enforcement authorities) as a focus for borough programmes and projects.
Impacts
D.66. Economic efficiency will be increased as boroughs and TfL work towards reducing commercial vehicle PCNs. Reliability will be improved through the promotion of Freight Operator Recognition Scheme membership by LSDP and sub-regional FQPs. It will also be improved by better journey planning and by the uptake of Delivery and Servicing Plans and Construction Logistics Plans, encouraging off-peak deliveries and legal deliveries that cause less congestion.
D.67. The environment will be enhanced as air quality and emissions are lessened through promotion of Freight Operator Recognition Scheme membership. Improved fuel efficiency, modal shift, better journey planning and an increase in off-peak deliveries and legal deliveries resulting from the uptake of Delivery and Servicing Plans and Construction Logistics Plans will also have environmental benefits. Fly-tipping reduction will be achieved through locally identified initiatives.
D.68. Impacts on society will be reduced through local initiatives identified by sub-regional FQPs. These will promote Freight Operator Recognition Scheme membership - leading to better management of operational road risk and

7�
improved vehicle maintenance and driver standards – while seeking to reduce theft and other crime associated with freight use.
Milestones
�. By winter �007, a Borough Toolkit will be published
�. By spring �008, sub-regional Freight Quality Partnerships will be established in all London sub-regions
�. By summer �008, TfL-funded secretariat posts for sub-regional FQPs will be established in all lead boroughs/partnership organisations
4. By winter �008, Freight Supplementary Planning Guidance and Best Practice Guidance will be produced
Roles and responsibilities
Roles Responsibilities
Provision of partnership secretariat support
TfL, borough sub-regional FQP secretariats
Partnership funding TfL, other contributions invitedPartnership advise TfL, Borough ToolkitMonitoring TfL, borough sub-regional FQP
secretariatsBorough benchmark Participation of boroughs within sub-
regional FQPs
Workstream 2 - major projects
D.69. Collaboratively funded, this workstream will develop and assist in the implementation of major freight projects/initiatives as they arise. Projects will enable Delivery and Servicing Plans and Construction Logistics Plans to take advantage of new opportunities, for example, by promoting modal change.
D.70. Individual business cases with impacts and key milestones will be developed for each project. New projects meeting the objectives of the Plan will be identified with partners as funds become available.
D.7�. The status and responsibilities for current major projects are identified in Table D-�.

The Delivery Plan
7�
Table D-1 Major project summary
Project Responsibilities Status
Abnormal Load Routing Upgrade TfL (lead/fund), CVEU (administration), MPS (support)
Scoping
Breakdown Removal Service Upgrade TfL (lead/ fund) Scoping
Congestion Charging Systems Upgrade TfL (lead & fund) Scheme in preparation
Lea Navigation Lock Automation British Waterways (lead) Scoping
LEZ Implementation TfL (lead/fund), freight operators (vehicle renewal/RPC installation)
Ongoing
London Lorry Control Scheme London Councils (lead), boroughs and TfL (support and fund)
Ongoing
Overseas Operator Database Department for Transport (lead/fund), TfL (support)
Scoping
Prescott Lock BW (lead/fund), with support and funding from TfL, TGDC, ODA, Department for Transport
Under construction
Rail Gauge Enhancements, including
North London Line – four-tracking west of Dalston, plus other capacity upgrades
Willesden - Gospel Oak - Barking Line - gauge enhancement to W�0, plus signalling-based capacity upgrades
West London Line/South London Line/Kew East Line - work to ensure freight capacity within passenger capacity improvements
Crossrail � - a number of schemes to permit continued freight capacity growth as part of wider passenger railway project
Ipswich - Nuneaton - staged gauge enhancement and signalling upgrades to facilitate longer trains
•
•
•
•
•
TfL (London lead), Department for Transport (fund), Network Rail (support)
Scheme in preparation. London Rail Freight Strategy provides more information

7�
Project Responsibilities Status
Rail Terminal Development, including at Barking, to build upon European loading gauge access that freight operating on High Speed � would allow.
Private developers (lead/fund), freight operators (support/fund) freight Train Operating Companies (support/fund), TfL/LDA/boroughs (support)
Concept and scheme in preparation
Rail signalling works to facilitate the operation of longer trains and the efficient use of freight train paths
Network Rail Proposed
River Lea Dredging PLA (Lower section lead/fund), BW (Upper section lead/ fund)
Scheme in preparation
Weight In Motion Sites VOSA (lead/support), TfL (support/fund)
Scoping
Workstream 3 - data, modelling and best practice
D.7�. To help promote improved understanding of freight operations and their role in maintaining London as a world class city, freight modelling approaches need to be developed.
D.7�. Where possible examples of best practice in accessing freight data will be used to assist this process. The benefits of adopting such practices will be demonstrated by case studies of boroughs, Freight Operator Recognition Scheme members and businesses who have adopted Delivery and Servicing Plans and Construction Logistics Plans.
D.74. TfL’s Freight Unit will continue to develop pilots and work with sub-regional FQPs, operators and businesses to identify best practice. This will include data capture and analysis to help build the business case for appropriate and timely intervention(s).
D.75. TfL will aim to be a world leader in the collection of reliable freight data, and in the development of freight modelling approaches, producing regular updates of the London Freight Data Report.
D.76. Progress towards achieving the vision for sustainable freight distribution in London will be reported annually. A comprehensive set of progress measures will reflect the contribution of the Plan’s projects and workstreams to the economy, environment and society.
D.77. The roles and responsibilities for data and modelling projects are shown in Table D-� and those for best practice projects in Table D�. Specific borough benchmarks are listed below.

The Delivery Plan
74
D.78. TfL is working in partnership with British Waterways and the Port of London Authority to ensure effective take-up of modal shift opportunities.
D.79. Studies such as River Lea Freight Study are in progress, along with discussions to formulate ways to increase the use of Thames-side wharves for freight use.
Roles Responsibilities
Borough benchmark Provision of waste fleet usage/volumes/routing data
Reporting commercial vehicle PCN data with accurate geo-coding
Reporting fly-tipping to Environment Agency
Table D-2 Data and modelling project summary
Data and modelling projects Responsibilities Status
Freight Data Centre and Annual Report University of Westminster (lead), TfL (support/fund)
Underway
Freight Knowledge Centre University of Westminster (lead), TfL (support/fund)
Scoping
Journey Time Reliability by Sector TfL (lead/ fund) Scoping
Green Logistics Data and Modelling Project
Cardiff University, Heriot-Watt University, Lancaster University, University of Leeds, University of Southampton, University of Westminster, DfT, CILT, TfL (data/support)
Underway
Base Year Freight Matrices Department for Transport (lead/fund), TfL (support/ fund)
Underway
TRAVL Development for Freight London Councils (lead), boroughs & TfL (support/fund)
Underway
London GVA / supply chain relationships – freight policy model
TfL (lead/fund) Scoping
Pan-London Waste Model TfL (lead/fund), GLA (support/ fund), BRE (support/ fund)
Scoping

75
Table D-3 Best practice project summary
Data and modelling projects Responsibilities Status
Priority HGV lane case studies and guidance
TfL (lead/fund), Department for Transport (support/ fund)
Underway
Urban Road & Loading facility examples & design
TfL (lead/ fund), Department for Transport (support/fund), boroughs (support)
Underway
Multi-Modal Refuse Collection Vehicle (MRCV) and wider use study Pilot
TfL (lead/fund), North London Waste Authority (support), Hackney and Bexley Waste Collection Authorities (support)
Underway
London Construction Consolidation Centre (LCCC) Pilot and wider use study
TfL (lead/fund), Stanhope (support/fund), Bovis Lend Lease (support/ fund), Wilson James (support), Constructing Excellence (support)
Complete
CVIS Delivery Booking EU Project (underway)
EU-funded consortia, TfL (support/fund)
Underway
Measuring progressD.80. As the Plan is implemented it is vital that progress toward attaining the vision
for sustainable freight distribution in London is identified. This will ensure that activities are result-oriented and focused on delivery, and that all involved are informed and motivated.
D.8�. To help achieve this, a set of sustainable freight distribution progress measures have been developed. TfL will produce an annual London Freight Progress Report reporting on these progress measures with updates on research and project milestones. Baselining of the measures will be undertaken in �007 and the first annual report produced in �008.
D.8�. The measures represent one of the key areas addressed through dialogue with London Councils and boroughs following the publication of the draft plan. In general the measures will:
Provide a framework to show progress at a strategic level
Be measured and reported at borough, sub-regional and pan-London level without placing additional burdens on boroughs
Be informed by the Plan’s pan-London initiatives
•
•
•

The Delivery Plan
76
Provide a view of sustainable freight distribution in London that will be relevant to a wide range of potential stakeholders
Be further developed as measurement mechanisms become more sophisticated
Ensure data capture is relevant, timely and significant, with qualitative impacts forecast for every project and accompanying workstream for both �0�0 and �0�6
D.8�. To mirror the aims of sustainability outlined in this Plan, the measures are developed under the headings of economy, environment and society. They are also designed to be:
London-specific
Practical and reflecting data availability
Capable of being integrated with Mayoral targets and into TfL’s broader performance monitoring framework
Complementary to the Department for Transport’s national measures
Economy
D.84. Commercial vehicle parking-related Penalty Charge Notices (PCNs): These reflect the impact that incorrect provision of loading/unloading has on operator costs and on freight intensity, which is the major concern for freight operators. Data is currently available on the TLRN but not for borough roads. Steps need to be taken to capture of geo-coded commercial vehicle PCN data for these roads.
D.85. Journey time reliability: These measures reflect the impact that journey time reliability (JTR) has on operator costs, freight intensity, vehicle loading factors, vehicle time utilisation and deviation from schedule. JTR is currently measured for London’s general traffic only.
Environment
D.86. Air quality and climate change: These measures include CO� emissions as well as related particulates and NOX emissions. In this way, freight’s contribution to achieving the Mayor’s climate change target of a 60 per cent CO� reduction by �0�5 from �990 base levels will be estimated and reported. Using best estimates, the Plan highlights opportunities to exceed the 0.7 mt/y target for CO� reduction and achieve a 0.9 mt/y reduction by �0�5. In line with the Mayor’s revisions to the London Plan, an interim target of a �0 per cent reduction in CO� by �0�5, equivalent to 0.47 mt/y has been adopted.
•
•
•
•
•
•
•
77
D.87. Fly-tipping: This is a particular environmental and quality of life issue that is closely linked to the road network, including the TLRN in London. Incidents are currently recorded on the Environment Agency’s website by most London boroughs. Fly-tipping is often undertaken by illegally operated and poorly maintained freight vehicles.
Society
D.88. Road safety: These measures complement the Mayor’s commitment to improving road safety They will be recorded by the London Road Safety Unit to ensure that freight’s contribution to targets is measured. By �0�0 the aim is for a:
50 per cent reduction in the number of people killed or seriously injured
50 per cent reduction in the number of cyclists and pedestrians killed or seriously injured
40 per cent reduction in the number of powered two-wheeler users killed or seriously injured
60 per cent reduction in the number of children killed or seriously injured
�5 per cent reduction in the slight casualty rate, expressed as the number of people slightly injured per �00 million vehicle kilometres
D.89. Thefts: This measure addresses the level of theft of (and from) freight vehicles and of theft during the loading/unloading of cash-in-transit operations.
Composite measure
D.90. Freight Operator Recognition Scheme Membership: This measure provides an estimate of London’s sustainable freight distribution performance and will clearly indicate the level of engagement with the road freight operator community.
D.9�. Targets are identified relating to entry-level registration. Targets for higher levels/tiers of recognition will be identified once the requirements have been set and assessed for likely take-up. Ideally:
By April �0�0, 75 per cent of TfL, GLA and LDA and boroughs’ own and contracted fleets will be signed up
By April �0�0, �0 per cent of HGV and van fleets serving London will be signed up
By April �0�6, 50 per cent of HGV and van fleets serving London will be signed up
•
•
•
•
•
•
•
•

The Delivery Plan
78
Climate change summaryD.9�. To help understand how the Plan contributes to the Mayor’s Climate Change
Action Plan, figure D-� has been included.
Climate ChangeImpacts
Plan Projects &Workstreams
Not considered in the Plan
0.20 mt/y
Implemented Nationally
0.10 mt/y
Freight OperatorRecognition Scheme
DSP
CLP
Freight InformationPortal
Major Projects‘Rail Terminals’
Major Projects‘Wharf development’
PartnershipDevelopment
Best Practice
Fleet efficiency 0.29 mt/y
0.01 mt/y
0.13 mt/y
0.10 mt/y
0.08 mt/y
Un-quantified
0.002 mt/y
0.30 mt/y
Sub-total 0.91 mt/y
Sub-total 0.30 mt/y
Total 1.21 mt/y
Out of hoursdeliveries
Constructionconsolidation
Retail / Officeconsolidation
Modal Change
Networkefficiency
Waste fleetefficiency
Voluntary use ofalternative fuel& low carbon
vehicles
Road User Charging Bio-diesel
Figure D-1 Delivery plan contribution to CO� reduction (�0�5)7�
7� See Appendix D

79
Road safety summaryD.9�. In recognition of the Mayor’s commitment to address collisions involving fatal
or serious collisions, particularly between cyclists and HGVs, the Plan aims to meet the �0�0 target for reducing KSIs.
D.94. The procurement of green fleets within Delivery and Servicing Plans and Construction Logistics Plans helps increase the uptake of the Freight Operator Recognition Scheme. This will reward and recognise companies that are legally compliant and treat the road as a workplace in their management of occupational road risks. This will include the use of retrofitted mirrors, side under-run bars and cyclist warning signs.
D.95. The Commercial Vehicle Education Unit will take preventative action on near-misses and non-fatal accidents to help identify failings in companies’ Management of Operational Road Risk policies and practices before fatalities occur.
Road Safety ImpactsPlan Projects &Workstreams
Freight OperatorRecognition Scheme
DSP
CLP
Freight InformationPortal
Major Projects‘Rail Terminals’
PartnershipDevelopment
Improved fleet managementof Operations Road Risk
Use of Best Practice formirrors and cycle signs
Improved driver andmanager safety training
Reduced peakperiod trips
Increased number ofintelligent SpeedAdaptation units
Reduced over-loadedvehicle collisions
Figure D-2 Delivery plan road safety summary
The Delivery Plan
80
Programme funding and resourcesD.96. The development of the Plan clearly demonstrates that success depends on
broad-ranging partnerships working together over the long term, with TfL acting to stimulate change, develop collaborative approaches and build sustainable capacity.
D.97. In people terms, TfL will directly fund around 40 staff on freight issues – within TfL’s Freight Unit, the Commercial Vehicle Education Unit and the boroughs. They will work alongside staff in other organisations on freight training, enforcement and development. Overall by �008 there will be about �00 people in place working to help the thousands of drivers, logistics support staff and managers make progress in delivering the Plan.
D.98. Finance for the Plan comes from a variety of sources. Improved coordination of projects and investment by all those involved in freight in London will increase the scope and impact of what can be delivered.
D.99. There are some key financial contributors in place and others that are yet to be secured. Sources include:
TfL’s funding streams, including those specifically directed to freight, but also others that contribute to improvements in the progress measures set out earlier in this section (for example, the air quality benefits arising from the Low Emission Zone)
Funding from other public sector partners. These include:
Department for Transport and its agencies (such as VOSA)
The rail sector - for example, through funding being sought from the Transport Innovation Fund for infrastructure improvements to support mode shift to rail
The water sector - with funding contributions in place for the Prescott Lock from British Waterways. Other agencies such as the Olympic Delivery Authority and local government organisations such as Thames Gateway London Partnership
Investment by the private sector in, for example, new rail freight facilities or vehicle fleet improvements
D.�00. Given this wide range of confirmed and potential contributions, TfL’s direct financial input to freight (although significant) is a minority share of the total investment.
D.�0�. The overall investment over the next three years could range from £�50m to £450m, with TfL’s contribution being between �0 - 40 per cent of this total.
•
•
•
•
•
•

8�
D.�0�. TfL will work to maximise the investment over this period, and further ahead to �0�5, through building capacity in partner organisations and promoting and coordinating investment.
D.�0�. The Plan will be subject to ongoing review to ensure available funds and resources are targeted at areas where the maximum benefit can be achieved.
Developing a long term cross-modal freight strategyD.�04. To address the role of freight policy over the longer term (to �0�5), building on
the contents of this Plan and on TfL’s Transport 2025: Transport Vision for a Growing World City document, a cross-modal freight strategy will be prepared to be included in a future revision to the Mayor’s Transport Strategy.
D.�05. This will enable the long-term strategy for freight to be developed in line with the strategy for all transport modes in London and with the Mayor’s other strategies, most significantly the London Plan.
D.�06. Critical to this longer term vision will be a further range of policy work impacting on freight, such as:
Measures to tackle congestion and its impact on CO� while supporting London’s sustainable economic growth
Changing demand and the balance between modes for transporting goods.
Technology and how this may influence demand and methods of transporting goods
•
•
•

8�
Appendix A: Contributors to the PlanTfL wishes to thank the following individuals and organisations who have agreed to have their details included as contributors to the development of the London Freight Plan. Inclusion in this list does not imply that the individual or the organisation represented is in agreement with all of the content of this Plan, or that others were not involved.
Borough and partnership workshopsAntoneta Horbury, London Councils
Ranjith Chandrasena, Enfield
David Higham, Barking and Dagenham
Stephen Burke, Bexley
Robert Mansfield, Richmond
Sally Crew, Southwark
Roy Turner, Camden
Ruth Seager, Newham
Alex Forrest Hammersmith and Fulham
Garry Morris, Hackney
Helen Fallon, Islington
Paul Dearman, Kingston
Mark Chetwynd, Kensington and Chelsea
Tony Davis, Tower Hamlets
Robert Mansfield, SWELTRAC
Les Ewen, Redbridge
Brian Marheineke, Brimsdown Freight Quality Partnership
Tom Mansfield, TfL
Jan Collins, TfL
Nick Gallup, Intermodality
Jonathan Spear, Thames Gateway London Partnership
David Hawkins, SWELTRAC
John Barkley, SELTRANS/ SWELTRAC
Mike Slinn, West London Freight Quality Partnership
Kevin Ratnasingam, West London Freight Quality Partnership
Steve Robinson, Facilitator

8�
Special knowledge group
EnvironmentAdrian Young, Environment Agency Thames Region, Principal Officer Air Quality, Health and Transport
Alex Nickson, Policy Officer, Climate Change Adaptation Strategy, GLA
Dick Allard, Member of Transport and Planning Committee, London Forum of Amenity and Civic Societies
Dr Dave Dawson, Strategy Manager Biodiversity, Animal Protection & Ambient Noise, GLA
Max Dixon, Principal Policy Adviser, Noise, GLA
Sarah Legg, Principal Policy Adviser, Air Quality, GLA
Safety and SecurityIan Brooks, formerly Chief Inspector, Metropolitan Police Service (retired)
Roger Bibbings, RoSPA
Land Use PlanningDarren Briggs, Associate Director, Arup
Richard Linton, Principal Planner, The London Plan team, GLA.
BusinessJames Ford, London Chamber of Commerce
Minakshi Roy, CBI
Paul Browne, British Retail Consortium
Tim Hockney, Head of Transport, London First
Modal groupsKevin Austin, Head of Transport, Greater London Authority
Victoria Hills, Transport Projects & Performance Manager, Greater London Authority
Gordon Telling, Head of Policy-London, SE and East of England, Freight Transport Association (FTA)
Philippa Edmunds, Campaigner, Freight on Rail
RoadChris Welsh, General Manager Campaigns, Freight Transport Association
Chrys Rampley, Manager - Infrastructure, Environment, Security, Business Affairs, Road Haulage Association
German Dector-Vega, Senior Transport Planner, Transport for London
•
•
•
•
•
•
•
•
•
•
•
•
•
•
•
•
•
•
•
•
•

Appendix A
84
Louisa Perry, Regional Policy Manager, London & South East, Freight Transport Association
Richard Bourn, London Transport Campaigner, Transport�000
WaterChris Pickford, Project Manager London �0��, CEMEX UK Operations
Del Brenner, Regents Network and member of the London Waterways Commission
David Hilling, Inland Waterways Freight Group
Richard Rutter, Regeneration Manager, British Waterways
Tom Chaplin, Freight Development Manager, British Waterways
John Dodwell, Managing Director, Rolandon Water and Sea Freight Advisory Services
RailIan Birch, Freight Strategy Manager, London Rail
Ian Cleland, Senior Route Freight Manager, South East, Network Rail
Dr Andrew Traill, Head of Rail Freight, Maritime and Air Cargo Policy. FTA
Philippa Edmunds, Campaigner, Freight on Rail
Allen Marsden, Manager Regional and Local Government, English, Welsh and Scottish Railway
Maggie Simpson, Policy Manager, Rail Freight Group
Lindsay Durham, Head of Rail Strategy, Freightliner Group
Industry sector groups
RetailBrian Aherne, Business Delivery Manager, Pret a Manger (Europe) Ltd
Colin Menzies, Logistics Manager, Pret a Manger (Europe) Ltd
David Potter, Head of DHL-Exel Supply Chain Transport - UK, Business Director, Railports UK
David Sheppard, Deputy Head of Transport, John Lewis Partnership
Edward Cooke, Policy Executive, London Retail Consortium
Paul Doubledee, Deputy Transport Manager, Kuehne + Nagel Logistics Ltd
Phil Shankley, UK Managing Director, GEFCO
CourierAnne de Courcy, Association of Courier Express Services
Charlie Shiels, Director of Hubs, Linehaul, Risk and Transport, Geopost UK Ltd
Mr Wayne Josh, Area Operations Manager, DHL Express
Robin Parr-Davies, Director, Express Network Forum
•
•
•
•
•
•
•
•
•
•
•
•
•
•
•
•
•
•
•
•
•
•
•
•
•
•

85
Paul Gray, Transport Policy Manager, Royal Mail
Philip Stone, Chairman, The Despatch Association
Oil and ChemicalClive deSouza, Terminal Manager, Murco
Peter Larner, Managing Director, J.W. Suckling Transport Ltd
Wayne Park, Regional Operations Manager, BP Plc
Servicing and MaintenanceJim Armitage, Central Services Manager, WHSmith News
Mr Colin French, General Manager, Brooks
Mr Dave Roberts, General Manager Logistics, Iron Mountain (UK) Ltd
Mr Dick Hanks, British Security Industry Association
Mr Simon Stretch, National Distribution Manager, office�office UK Plc
Mr Shane Hadley, Head of Delivery Service, Harrow Green
Mr Tom Bush, Transport Manager, London and South East, Sunlight Service Group
Paul Goss, Group Transport Manager, Dawson Holdings Ltd
Richard McCurdie, Menzies Distribution
Robert Sayers, General Secretary, British Association of Removers
ConstructionGary Sullivan, Wilson James Ltd
Paul Yeoman, Hansons
Adrian Blumenthal, Constructing Excellence
WasteAdrian Hawkes, Strategic Planning Director, VALPAK
Adrian Judge, Group Strategic Director, Cory Environmental
Brian Padgham, General Manager, SITA UK
Chris Murphy, Deputy Chief Executive, Chartered Institute of Waste Management
Colin James, General Manager, Western Riverside Waste Authority
John Wilson, East London Waste Authority
Jim Perkins, Programme Manager, London Remade
Patrick Mahon, Policy Analyst, WRAP
Sam Corp, Policy Executive, Environmental Services Association
Wayne Hubbard, Senior Policy Officer, Waste, GLA
•
•
•
•
•
•
•
•
•
•
•
•
•
•
•
•
•
•
•
•
•
•
•
•
•
•
•
•

Appendix A
86
UtilitiesAlan Maynard, Group Transport Manager, Lowery
Geoff Day, Freight Transport Association
Jim Davey, Contract Manager, Thames Water
Note: This list only includes those contributors who gave their permission during the development of the Plan
•
•
•

87
Appendix B: Assessment of projects and workstreamsTo understand the contribution these identified projects and workstreams make in terms of sustainability, a qualitative assessment has been carried out. Based on a seven point scale (+++, ++, +, 0 , -, --, ----), where +++ represents high-level beneficial impacts.
Pillars of Sustainable Distribution
Economy Environment Social
High Level Aims
Projects & Workstreams Su
ppor
t Lon
don’
s gr
owth
in p
opul
atio
n &
econ
omic
act
ivit
y
Impr
ove
the
effic
ienc
y of
frei
ght d
istr
ibut
ion
& se
rvic
ing
with
in L
ondo
n
Bala
nce
the
need
s of
frei
ght &
ser
vici
ng
with
oth
er t
rans
port
use
rs a
nd d
eman
ds fo
r Lo
ndon
’s re
sour
ces
Impr
ove
air q
ualit
y in
Lon
don
by re
duci
ng
emis
sion
s of
loca
l air
pollu
tant
s an
d C
O�
caus
ed b
y fr
eigh
t & s
ervi
cing
Impr
ove
qual
ity
of li
fe in
Lon
don
by
min
imis
ing
impa
ct o
f noi
se &
vib
ratio
n
Impr
ove
heal
th &
saf
ety
in L
ondo
n by
redu
cing
nu
mbe
r of d
eath
s &
inju
ries
sso
ciat
ed w
ith
frei
ght m
ovem
ent a
nd s
ervi
cing
Impr
ove
qual
ity
of li
fe in
Lon
don
by re
duci
ng
nega
tive
impa
cts
of fr
eigh
t and
ser
vici
ng o
n co
mm
uniti
es
Project � Freight Operators Recognition Scheme (FORS)
++ +++ ++ +++ ++ +++ +++
Project � Delivery & Servicing Plans (DSPs)
+++ ++ +++ ++ + ++ ++
Project � Construction Logistics Plans (CLPs)
+++ ++ +++ ++ + ++ ++
Project 4 Freight Information Portal (FIP)
++ ++ + ++ 0 + +
Workstream � Partnership Development
+++ +++ +++ +++ +++ +++ +++
Workstream � Major Projects
Proj
ect
depe
nden
t
Proj
ect
depe
nden
t
Proj
ect
depe
nden
t
Proj
ect
depe
nden
t
Proj
ect
depe
nden
t
Proj
ect
depe
nden
t
Proj
ect
depe
nden
t
Workstream � Data, Modelling & Best Practice
+ ++ +++ ++ ++ ++ ++
88
Appendix C: Freight considerations for Development Plan documents
London Plan freight policy is contained within polices �C.�4 and �C.�5
Sustainable delivery and servicing should be considered in all new Development Plan documents
At all stages of the development process, design, planning and construction, full consideration must be given to the freight and servicing implications to minimise adverse impacts
Mixed use developments must consider the delivery and servicing needs of all uses to ensure freight and servicing activity has limited impact on those other uses in the development or on surrounding-road users
Developments that generate high levels of freight movement should be located close to major transport routes
Suitable sites and facilities should be made available to enable the transfer of freight to rail and water through the protection of existing sites and the provision of new sites
All developments should include appropriate freight loading, waiting and parking facilities, off-the-main bus and tram routes as a minimum and off-road wherever practicable
Planning conditions, particularly on night time and out-of-hours activity, should only be used consequent to ’user consideration‘ when delivering to a specific development. Good design can minimise disturbance for residents at, or en-route to, the site, for example through appropriate sound-proofing, without the need for the use of delivery curfews (see Department for Transport guidance on Delivery Restrictions – Department for Transport �006)
Freight Delivery and Servicing Plans should be developed for each premise providing for safe and legal delivery, collection and servicing locations, with obligations to use them
Construction Logistics Plans should be developed to include design features to facilitate legal loading, minimisation of trip and construction duration, and to promote the use of suppliers and contractors using best practice in logistics (incorporating Construction Statements and Site Waste Management Plans). The use and maintenance of consolidation centres for construction and operational phases may also be appropriate
Developments should provide sufficient facilities for storage and collection of segregated waste
•
•
•
•
•
•
•
•
•
•
•

89
First-time delivery efficiency to premises, including for home delivery, should be encouraged through the use of locker banks or agreed delivery points and concierge services
Freight requirements need to be balanced with the societal and environmental aspects of the development, and particularly:
The Mayor’s objectives for biodiversity and protecting important wildlife and its habitat
The Mayor’s open space and green belt policies through preferential development of brown field sites
Current useful documents include: Land for Transport Functions SPG7�, GLA Safeguard Wharves on the River Thames7� and new TfL guidance on Rail Freight Planning Policy74 and Development Control75
7� GLA, March �007, Land for Transport Functions The London Plan Supplementary Planning Guidance
7� GLA, January �005, Safeguarded Wharves on the River Thames London Plan Implementation Report
74 TfL, November �006, Planning for the development of rail freight in London: Planning Policy Toolkit
75 TfL, November �006, Planning for the development of rail freight in London: Development Control Toolkit
•
•
-
-
•

90
Appendix D: Climate change�. As the Climate Change Action Plan makes clear, the degree of influence the
Mayor has over CO� savings varies considerably. The Mayor has direct control over Mayoral policy and functional body resources. However, in many of the most promising areas, Mayoral powers are far more limited. In these instances, influencing the commercial and public sectors will be critical.
0.1
Low
LUL greenelectricity
Hard & Softdemand
management
Car & freightdriver
behaviour
Freightvehicles
Bio fuelobligation
Public transport,walkin & cycling Low-carbon
cars & taxies
Public transportdriver behaviour
Low-carbonbuses
LUL traction
High
0.5 1.0 1.5 2.0
C02 impact (million tonnes C02/year)
Figure Ad-1 Degree of Mayoral control over key transport CO� opportunities (from Climate Change Action Plan)
�. This sets the approach adopted in this Plan, with the Mayoral Group, boroughs, universities, schools and hospitals taking the leading role in areas where they have most control.
�. The areas in the Climate Change Action Plan where freight can play an important role in reducing CO� are:
Emissions from ground based transport
Emissions from existing commercial and public sector activity
Emissions from new build and development
•
•
•
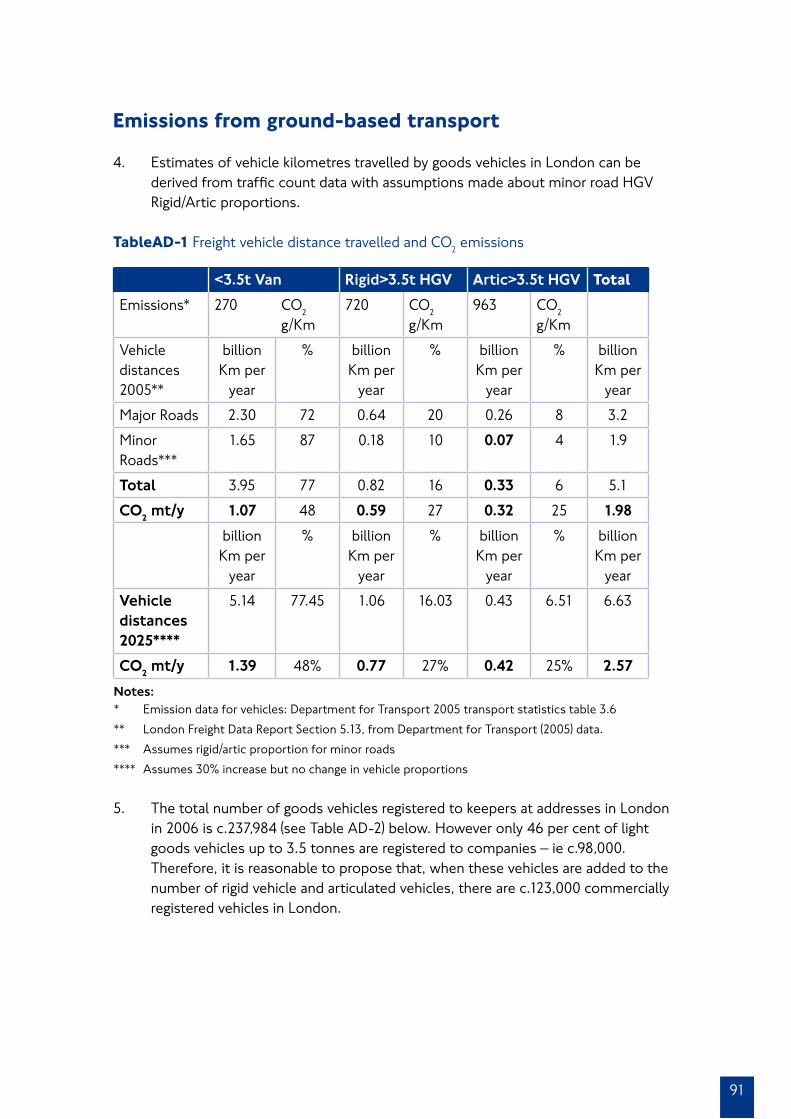
9�
Emissions from ground-based transport
4. Estimates of vehicle kilometres travelled by goods vehicles in London can be derived from traffic count data with assumptions made about minor road HGV Rigid/Artic proportions.
TableAD-1 Freight vehicle distance travelled and CO� emissions
<3.5t Van Rigid>3.5t HGV Artic>3.5t HGV Total
Emissions* �70 CO� g/Km
7�0 CO� g/Km
96� CO� g/Km
Vehicle distances �005**
billion Km per
year
% billion Km per
year
% billion Km per
year
% billion Km per
year
Major Roads �.�0 7� 0.64 �0 0.�6 8 �.�
Minor Roads***
�.65 87 0.�8 �0 0.07 4 �.9
Total �.95 77 0.8� �6 0.33 6 5.�
CO2 mt/y 1.07 48 0.59 �7 0.32 �5 1.98
billion Km per
year
% billion Km per
year
% billion Km per
year
% billion Km per
year
Vehicle distances 2025****
5.�4 77.45 �.06 �6.0� 0.4� 6.5� 6.6�
CO2 mt/y 1.39 48% 0.77 �7% 0.42 �5% 2.57
Notes: * Emission data for vehicles: Department for Transport �005 transport statistics table �.6
** London Freight Data Report Section 5.��, from Department for Transport (�005) data.
*** Assumes rigid/artic proportion for minor roads
**** Assumes �0% increase but no change in vehicle proportions
5. The total number of goods vehicles registered to keepers at addresses in London in �006 is c.��7,984 (see Table AD-�) below. However only 46 per cent of light goods vehicles up to �.5 tonnes are registered to companies – ie c.98,000. Therefore, it is reasonable to propose that, when these vehicles are added to the number of rigid vehicle and articulated vehicles, there are c.���,000 commercially registered vehicles in London.

Appendix D
9�
Table AD-2 Goods vehicles licensed with keepers’ addresses in London, �006
Vehicle type Number of licensed vehicles
Light goods vehicles up to �.5 tonnes gvw ���,67�
Rigid goods vehicles over �.5 tonnes gvw ��,��7
Articulated goods vehicles over �.5 tonnes gvw �,996
TOTAL 237,984
Notes:
Light goods vehicle data is for end of March �006.
Rigid and articulated goods vehicle data is for end of June �006.
Source: Department for Transport, �006c.
6. Arriving at the number of freight vehicles directly owned and run by the GLA Group, boroughs, education and health sectors is not straightforward. Difficulties arise when trying to identify freight fleets from car fleets, and which fleets are in-house as opposed to contracted to a third party. Some �0,000 vehicles are estimated to be contracted to or regularly servicing these sectors. This equates to about �5 per cent of the ���,000 commercially registered vehicles in London, of which 5 per cent may be managed in-house. However, not all will actually be registered in London. These figures will increase by �0�5.
7. The approach to reducing freight ground-based transport will depend on whether the fleet is in-house or contracted to a third party where there is less direct control. Contracted fleets and services are considered in the sections below on emissions from existing commercial and public sector activity and on emissions from new build and development.
8. Three ways to reduce CO� for ground-based vehicles have been identified in the Climate Change Action Plan:
Changing the mode
Operating vehicles more efficiently
Promoting the uptake of lower-carbon infrastructure, vehicle and fuel types
Changing the mode
9. In �005, 88 per cent of freight in London was moved by road, and for many commodities this will always be the most effective mode. Road will nearly always be used for the final delivery leg unless the destination is close to, or part of, an appropriate rail depot or wharf. Modal split, excluding pipelines, is shown in Table AD-� below. It should be noted that data for vans is not available.
•
•
•

9�
Table AD-3 Freight lifted by mode in London, �005
Million tonnes Per cent
Road ��7.0 88.0%
Rail 7.8 5.0%
Water 9.0 5.8%
Air �.9 �.�%
Sources:
Department for Transport: 2006
Road: only goods vehicles over 3.5 tonnes gross weight included.
Rail: 2000 estimate by Ove Arup (2003).
Water 2002/3 data from British Waterways
Air: Heathrow, Gatwick, Stansted, Southend and Luton.
�0. The environmental benefits of a change from road to water or rail are huge (with potential CO� reductions of up to 94 per cent for vans and 60 per cent for HGVs76). However, the economic and practical opportunity for modal change is limited: flexibility is a key advantage of using road-based transport, with easy connections between origins and destinations and rapid loading and unloading available at many facilities.
��. To realise a �0 per cent modal shift to rail of the 48m tonnes of road freight moved to London each year, new large rail terminals would need to be sited on the edge of London, either outside or close to the GLA boundary. Each new terminal could take approximately �.5m tonnes of this freight off the road. Four new terminals would therefore be able to handle �0m tonnes of freight. Their use could equate to about an 80,000 tonne CO� saving per year, mainly outside London.
��. Potentially there could also be a modal switch within London to canal and river. A five per cent modal shift to water of the 55m tonnes of road freight moved within London could achieve about a 4,000 tonne CO� saving per year. This would require several new wharves on the canal and river network to be constructed and some existing wharves brought back into use. Additional savings could be achieved through increased use of the Port of London, London Gateway and Tilbury docks.
��. The use of couriers that change mode from road to walking and cycling has the potential to reduce delivery and collection trips. Initial estimates show that 75,000 van km per year could be saved per year, which equates to about �0 tonnes of CO�. How to achieve this is considered in the section on emissions from existing commercial and public sector activity.
76 from Figure B-�

Appendix D
94
�4. For municipal waste, the London Plan requires that, as far as is possible, waste is managed locally77 thus minimising transport impacts. To support this, TfL has been exploring the potential for London waste fleets to utilise multi-modal containers allowing transfer from road to water or rail without the need for a licensed waste transfer station. Latest estimates show that this could increase logistics efficiency and potentially reduce the municipal waste fleet from 4�0 to �75 vehicles. Multi-modal modelling to quantify the CO� benefits of this is currently under development with the GLA Waste Team and Buildings Research Establishment. However initial estimates for the CO� saving have been included within the 4,000 tonnes of CO� saving from modal switch to river and canal.
�5. Construction projects undertaken by the GLA Group, boroughs, education and health organisations are able to promote, through contractual conditions, the use of alternative modes for the movement of construction material and construction waste. A good example is provided by the Olympics, where the ODA aspires for at least 50 per cent of materials, by weight, to be transported by rail and water, potentially saving �4,000 tonnes of CO�
78. As this estimate is not an annual saving, it has not been included in our total, but does give an indication of the scale of potential benefit made possible through construction logistics modal change for large developments.
�6. In total, modal change could achieve:
Table AD-4 Freight modal change CO� saving (�0�5)
Opportunity Tonnes CO2 per year saved
Rail 80,000
Water 4,000
Walk/cycle �0
Total 0.08 mt/y
Operating vehicles more efficiently
�7. Work by the Department for Transport has shown that using best practice to improve driving skills, vehicle maintenance, the use of speed limiters and journey planning has the potential to reduce fuel use (and so CO� emissions), by up to �5 per cent79. Some fleets are already using these techniques but it is not known exactly how many. Table AD-5 shows the potential CO� savings that would result if these techniques were used by all fleets operating in London.
77 Mayor of London �004 The London Plan Spatial Development Strategy for Greater London, Policy 4A.�
78 TfL (�005): Olympic Park: Construction and Waste Transport Optimisation Strategy. Position Paper
79 Typically resulting from a combination of these measures: �0% from SAFED www.safed.org.uk , 5% from other best practice www.freightbestpractice.org.uk

95
Table AD-5 Annual fleet CO� saving using driver training, operational planning etc. (�0�5)
Emissions <�.5t Van
�.�9 mt CO�
Rigid>�.5t HGV
0.77 mt CO�
Artic>�.5t HGV
0.4� mt CO�
Total
CO�
saving mt/y
Maximum saving **
% Uptake opportunity ***
Maximum saving **
% Uptake opportunity ***
Maximum saving **
% Uptake opportunity ***
0.�� 90 0.�� 60 0.06 50 0.39
Maximum possible saving****
0.�9 0.07 0.0� 0.29
Maximum realistic saving*****
0.140 0.052 0.023 0.215
�00% MUSH Uptake+
0.0� 0.0� 0.00 0.04
50% total uptake
0.09 0.0� 0.0� 0.14
Notes:
*Figures taken from table AD-�
** Maximum saving = �5% of emissions (From table AD-�)
*** Freight Unit estimate based on �005
**** Maximum possible saving = Maximum saving x % uptake opportunity/�00
***** Maximum realistic saving = Maximum possible saving x 75%
+ Assumes �5% of maximum possible saving
�8. However, with over ���,000 commercial goods vehicles based in London, and many operators based outside London whose fleets travel into the Capital, it is likely that a number will already be using best practice. For this reason, the maximum possible CO� saving is reduced to 0.�9 mt/y, as shown in Table AD-5.
�9. In addition, the large number of operators with very small fleets makes �00 per cent adoption of best practice unrealistic. Therefore, the best expected uptake without carbon pricing would be lower than the maximum possible saving. In recognition of this a �5 per cent reduction has been assumed, enabling a 0.�� mt/y CO� saving by �0�5.
�0. If all of the vehicles serving the GLA Group, boroughs, education and health sectors adopted these techniques, 0.04 mt/y of CO� saving would be achieved.
��. Using the network in off-peak periods enables increased vehicle speeds and less fuel to be used. However, planning restrictions and Noise Abatement Notices often limit this opportunity. Using best practice to review curfews, quiet vehicles and training of drivers and reception staff could enable �� and �7 per cent less

Appendix D
96
emissions for HGVs and vans respectively, and �0 and 4 per cent more out of hours deliveries. This would equate to a CO� saving of 0.0� mt/y.
��. Additional CO� savings are possible through the increased efficiency made possible by consolidation. The use of consolidation to minimise trips and fuel use and therefore CO� emissions is standard practice for large retailers. For smaller retailers and offices, consolidation may achieve similar benefits to construction material consolidation. However achieving this will be more difficult in practice because of the high degree of fragmentation amongst the smaller retailers and office developments. Outline estimates suggest that greater retail and office consolidation may achieve a further 0.� mt/y of CO� saving.
��. Construction material consolidation has been demonstrated by TfL in partnership with Wilson James, Bovis Lend Lease and Stanhope at the London Construction Consolidation Centre pilot in south Bermondsey, which showed about a 70 per cent reduction in trips to site and a corresponding reduction in CO�. The use of four such sites across London for the �75 largest construction projects could realise about a 50 per cent reduction in CO� of the estimated 0.�5 mt/y total generated by construction traffic, equivalent to a 0.�� mt/y CO� saving.
�4. Reducing illegal kerbside deliveries and the frequency and duration of deliveries, particularly using consolidation for construction traffic, would achieve a significant but as yet unquantifiable benefit in terms of network performance. This would in turn increase fuel efficiency and reduce CO� emissions.
�5. Among waste fleets, improved logistics efficiency offers a further possibility for CO� saving. Operational efficiency is at the heart of the Multi-modal Refuse Collection Vehicle being developed by TfL. Using data from two London boroughs, and assuming that similar reductions could be achieved across the whole of London, savings could be in the order of �.67m vehicle km per year, which at an unrestricted urban speed would equate to 0.00� mt/y of saved emissions. This figure does not take account of the modal change benefits that this technology facilitates, which are considered elsewhere.

97
�6. In total, operational efficiency, without carbon pricing, could achieve the following savings:
Table AD-6 Freight operational efficiency CO� saving (�0�5)
Opportunity Million tonnes CO2 per year saved
Fleet efficiency 0.�9
Out of hours deliveries 0.0�
Retail / office consolidation 0.�0
Construction consolidation 0.��
Network Efficiency Un-quantified
Waste fleets 0.00�
Total 0.53
Promoting the uptake of lower-carbon infrastructure, vehicle and fuel types
�7. In addition to the national introduction of 5 per cent and possible voluntary use of higher blends by �0�5, which will achieve a 0.� mt/y CO� saving, there are opportunities for additional carbon savings from early adoption of new alternative fuels and low-carbon vehicles. The Climate Change Action Plan suggests that low-carbon vehicles could contribute a further 0.�mt/y CO� saving by �0�5. This is the best estimate available for new technology uptake without the introduction of carbon pricing.
�8. A green fleet is one that minimises fuel consumption and therefore CO� and exhaust emissions. It also seeks to minimise the number of road trips, by utilising vehicles efficiently and using alternative modes wherever possible. A green fleet will also be a safe fleet; its drivers will be trained and encouraged to drive safely and efficiently and will not come under pressure to speed or spend excessive hours behind the wheel. Unnecessary trips add to congestion and CO� and emissions, as do collisions, particularly those involving fatalities.
�9. The Mayor’s �00� publication An Introduction to the Fleet Operator’s Guide to Cleaner Vehicles80 explains how many of the measures available to reduce the emissions from vehicle fleets could also save money.
�0. The �00� Transport Energy /Mayoral publication Green Fleet Management: An essential guide on how to run your fleet8� further argues that green fleet
80 Web link: http://www.london.gov.uk/mayor/environment/air_quality/docs/fleet_op/intro.pdf
8� The guide is available from www.TransportEnergy.org.uk

Appendix D
98
management has to be a part of corporate culture in order to run vehicles efficiently and cost effectively.
��. In addition to the need to meet the challenges in the Climate Change Action Plan, there are several other reasons for adopting green fleet management principles:
To save money, by making more efficient use of vehicles
As a strategic business tool, where efficiencies in the fleet can be found to meet wider company needs
As part of a travel plan, where an organisation intends to reduce the amount of traffic it generates, often because of planning needs or parking and traffic problems
As part of a road safety management policy, to take full advantage of the cost savings and other benefits that are derived from a safer fleet
To comply with environmental policy, for example under ISO�400� or because the organisation wishes to adopt a responsible stance
��. Those organisations with in-house fleets are well-placed to take a corporately responsible stance on alternative fuels and green fleet practices. The promotion of uptake within third-party fleets is considered in the sections on emissions from existing commercial and public sector activity and on emissions from new build and development.
��. Good examples exist: Southwark Council’s green fleet strategy is a demonstration of the benefits of using high percentage bio-diesel mixes. With a �0 per cent bio-diesel blend, �60 tonnes of CO� will be saved each year. If this were replicated across all London’s boroughs this could equate to over 5,000 tonnes per year. Southwark Council’s green fleet policy has a number of individual elements:
Fuel policy
Awareness raising
Driver training
Vehicle procurement policy
Exhaust after treatment
Fuel monitoring
�4. Hybrid technology currently being fitted to new vans is also available for buses and heavier lorries and is expected to become commercially viable for heavy duty vehicles in the near future. Promoting the early adoption of this technology by operators is a key opportunity for this Plan.
•
•
•
•
•
•
•
•
•
•
•

99
�5. Developing technologies are also increasing the provision of electric-powered vehicles, particularly within the urban environment where range, pay-load, cost and environmental considerations make their use effective.
�6. In the longer-term, hydrogen technology is expected to be commercially available to captive fleets8� between �0�0 and �0�5. The London Hydrogen Partnership is working to make hydrogen technology a reality in the Capital.
�7. In its leading role, TfL is managing the procurement, delivery and operation of a hydrogen-fuelled fleet in London by �0�0. This will include 60 hydrogen cars, vans, motorbikes and other vehicle types (the procurement of nine buses is already subject to a separate procurement exercise). The vehicles will be operated by London’s public sector fleets, with a focus on Central London operation. To support this project dedicated hydrogen refuelling facilities will be constructed. This high profile project is an opportunity to showcase new hydrogen vehicle technologies and to prepare London for the wider deployment of hydrogen vehicles as the technology approaches commercial maturity.
�8. Clients are able to specify the type of alternative fuel or low-carbon vehicle to be used. Linking this procurement decision to a travel plan for freight for each premise would help to realise potential CO� savings.
Emissions from existing commercial and public sector activity
�9. The GLA Group comprises the Greater London Authority (GLA) and four functional bodies. The latter occupy around one million square metres of floor space in 89� buildings8� involved in delivery of the Mayoral group’s duties. Together, the GLA Group, boroughs and education and health authorities in London are thought to use in excess of �,500 buildings.
40. One of the five priority areas for the GLA Group identified in the Climate Change Action Plan is to improve the energy efficiency of buildings. In terms of freight, this could include the impact of a building’s delivery arrangements (such as its legal loading facilities) on the energy efficiency of delivery and servicing, and indeed that of the road network as a whole.
4�. A further Climate Change Action Plan priority is to minimise emissions from travel and vehicles. All members of the GLA Group are required to develop travel plans that follow best practice and focus on sustainable travel. The action plan also commits the GLA Group to follow high standards of green procurement for contracting of all goods and services.
8� Kollamthodi, S. (�005) Technical and non-technical options to reduce road emissions of air pollutants from road transport. ED48�00, AEA Technology Environment, �� March.
8� Identified in the Climate Change Action Plan, GLA, �006

Appendix D
�00
4�. Few examples exist of travel plans that address freight. TfL is playing a leading role for the GLA Group by developing a plan to consider the freight movements of several TfL Surface Transport buildings. Surveys have indicated that in a five day period over 500 trips were made to these premises. This could equate to about �5,000 trips a year. Estimates for possible trip reduction are under development.
Table AD-7 Five-day servicing and delivery trips to TfL Surface Transport and LDA buildings (�007)
Windsor House
Faith Lawson House
172 BPR Eccleston Place
Palestra Total
Delivery ��0 40 7� 4� �56 4�0
Collection �� 9 �� 5 4� 9�
Servicing � 0 �0 0 � ��
Waste Collection � � � � 4 9
Delivery & Collection 5 0 � � 4 ��
Unknown 7 0 4 � � �5
Total 148 50 99 52 211 560
4�. The transport assessment for the proposed redevelopment of Great Ormond Street Hospital shows how freight trips can be included using the latest TfL Transport Assessment Guidance84. Table AD-8 gives the hospital’s figures for �005 and the proposed figures for �0�0/�0�4 should the freight aspects of its travel plan be successful.
Table AD-8 Great Ormond Street freight transport assessment (�005 base)
Category Total Annual Trips
Total Daily Trips
% reduction each year between 2005 and 2010
Proposed Total Annual Trips (2010 & 2104)
Proposed Total Daily Trips (2010 & 2104)
Supplies 4,900 ��.5 �0% �,89� 8
Catering 5,700 �5.7 ��% �,�8� 8.8
Waste �,700 7.4 8% �,778 4.9
Couriers 6,�00 �7.� 9% �,868 �0.7
Pharmacy �,800 �0.5 �0% �,�4� 6.�
Others �,900 5.� ��% �,00� �.8
Total 25,200 69 14,966 41
84 TfL (�006): Transport Assessment Best Practice, Guidance Document
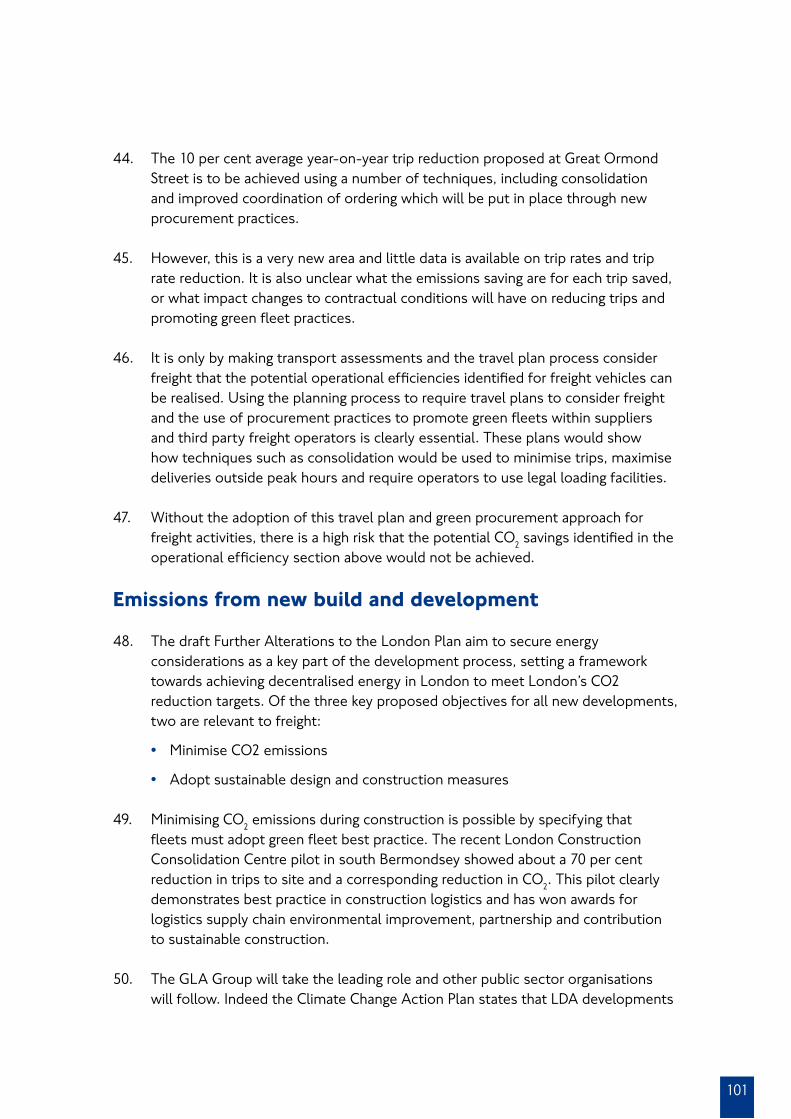
�0�
44. The �0 per cent average year-on-year trip reduction proposed at Great Ormond Street is to be achieved using a number of techniques, including consolidation and improved coordination of ordering which will be put in place through new procurement practices.
45. However, this is a very new area and little data is available on trip rates and trip rate reduction. It is also unclear what the emissions saving are for each trip saved, or what impact changes to contractual conditions will have on reducing trips and promoting green fleet practices.
46. It is only by making transport assessments and the travel plan process consider freight that the potential operational efficiencies identified for freight vehicles can be realised. Using the planning process to require travel plans to consider freight and the use of procurement practices to promote green fleets within suppliers and third party freight operators is clearly essential. These plans would show how techniques such as consolidation would be used to minimise trips, maximise deliveries outside peak hours and require operators to use legal loading facilities.
47. Without the adoption of this travel plan and green procurement approach for freight activities, there is a high risk that the potential CO� savings identified in the operational efficiency section above would not be achieved.
Emissions from new build and development
48. The draft Further Alterations to the London Plan aim to secure energy considerations as a key part of the development process, setting a framework towards achieving decentralised energy in London to meet London’s CO� reduction targets. Of the three key proposed objectives for all new developments, two are relevant to freight:
Minimise CO� emissions
Adopt sustainable design and construction measures
49. Minimising CO� emissions during construction is possible by specifying that fleets must adopt green fleet best practice. The recent London Construction Consolidation Centre pilot in south Bermondsey showed about a 70 per cent reduction in trips to site and a corresponding reduction in CO�. This pilot clearly demonstrates best practice in construction logistics and has won awards for logistics supply chain environmental improvement, partnership and contribution to sustainable construction.
50. The GLA Group will take the leading role and other public sector organisations will follow. Indeed the Climate Change Action Plan states that LDA developments
•
•

Appendix D
�0�
will be constructed to the highest standards of energy efficiency, building upon experiences such as the Gallions Park zero carbon project.
5�. However there is no clear set of standards or codes for construction that address all freight issues. Even among the GLA Group there are a number of approaches. The GLA has produced two relevant documents, both of which make reference to nationally recognised Considerate Contractors Schemes:
Best Practice Guide to The Control of Dust and Emissions from Construction and Demolition85
Supplementary Planning Guidance on Sustainable Design and Construction86
TfL major projects use a Code of Construction Practice and require contractors to produce Environmental Management Plans.CLM, the ODA’s delivery partner, is also developing a Construction Transport Management Plan and a Code of Construction Practice87.
5�. The Climate Change Action Plan identifies a clear need to work collaboratively with developers to promote and share best practice through a series of planner and developer seminars and publications. Agreeing a consistent approach to securing freight CO� benefits is seen as an urgent priority.
5�. The adoption of sustainable design practices, such as creating legal loading facilities for the operational phase, can help to minimise congestion caused by inappropriate kerbside deliveries, particularly at congestion hot-spots. Reducing this congestion increases network reliability for other freight activities and further reduces CO� emissions.
54. Clients are also able to require the use of alternative modes to supply building materials can also dramatically reduce emissions. In constructing the Olympic Park, the ODA aspires for at least 50 per cent of materials, by weight, to be transported by sustainable means during construction.
55. By specifying the use of consolidation or logistics facility, such as those used for the construction of T5 at Heathrow, clients will ensure significant CO� reductions from more efficient and sustainable construction activity.
85 GLA (�006): Best Practice Guidance, The control of dust and emissions from construction and demolition.
86 GLA (�006): Sustainable Design and Construction, The London Plan Supplementary Planning Guidance
87 CLM (�007): Logistics – Code of Construction Practice, v0.9
•
•

�0�
56. However, without linking freight considerations and the use of consolidation into planning conditions and construction contract procurement, the potential CO� savings identified in the vehicle operational efficiency section would not be realised.
Table AD-9 Potential freight CO� saving summary (�0�5)
Opportunity Million tonnes CO2 per year saved using travel plan and procurement links
Reduced CO2 per year saving without travel plan or procurement links
Road User Charging (should it be pursued as part of a national scheme)
0.�0 0.�0
Modal change 0.08 0.00*
Fleet efficiency 0.�9 0.06
Out of hours deliveries 0.0� 0.00*
Construction consolidation 0.�� 0.00*
Retail/office consolidation 0.�0 0.00*
Waste fleets 0.00� 0.00*
Alternative fuel and low carbon vehicles
0.�0 0.�0
Bio-fuel 0.�0 0.�0
Total �.�� 0.46
Notes
* Too small to estimate

Appendix D
�04
Appendix E: GlossaryB2B Business to Business
B2C Business to Consumer
BRE Building Research Establishment
CAA Civil Aviation Authority
CBI Confederation of British Industry
CILT Chartered Institute of Logistics & Transport
CLP Construction Logistic Plan
CO2 Carbon Dioxide
CTRL Channel Tunnel Rail Link
DSP Delivery and Service Plan
DTi Department for Trade and Industry
EA Environment Agency
FQP Freight Quality Partnership
FTA Freight Transport Association
GLA Greater London Authority
HGV Heavy Goods Vehicle
HSE Health and Safety Executive
KPI Key Performance Indicator
LCCC London Construction Consolidation Centre
LDA London Development Agency
LEZ Low Emission Zone
LFP London Freight Plan
LGV Light Goods Vehicle
LIP Local Implementation Plan
LLCS London Lorry Control Scheme
LOCOG London Organising Committee of the Olympic Games
LSC Learning and Skills Council
LSDP London Sustainable Distribution Partnership
MAM Maximum Authorised Mass
MMRCV Multi Modal Refuse Collection Vehicle
MPS Metropolitan Police Service
NO2 Nitrogen Dioxide
NOx Nitrogen Oxides (Mixture of NO, NO�, N�O4, etc)
NVQ National Vocational Qualification
ODA Olympic Delivery Authority
PCN Penalty Charge Notice
PLA Port of London Authority
RHA Road Haulage Association
SPG Supplementary Planning Guidance
SRN Strategic Road Network
TfL Transport for London
TLRN Transport for London Road Network
TGDC Thames Gateway Development Corporation
TRAVL Trip-rate Assessment valid for London
UK United Kingdom
VOSA Vehicle and Operator Services Agency


Address: TfL Freight Unit, 4th Floor, 172 Buckingham Palace Road, London, SW1W 9TN
Email: [email protected]
November 2007
Printed on recycled paper
tfl.gov.uk/freight