sustainable freight transport: improving the environmental...
TRANSCRIPT
Paving the Way for Sustainable Freight Transport
Qatar National Convention Centre / Auditorium 3
Doha, 25 April 2012 - 15.00–18.00
“Sustainable Freight Transport:
Improving the environmental sustainability of transport and
logistics”
Professor Alan MCKINNON
Kühne Logistics University
Hamburg
Sustainable Freight Transport:
Improving the environmental sustainability of transport and logistics
Professor Alan McKinnon
Kühne Logistics University
Hamburg
UNCTAD 13
Paving the Way for Sustainable Freight Transport
Doha
25th April 2012
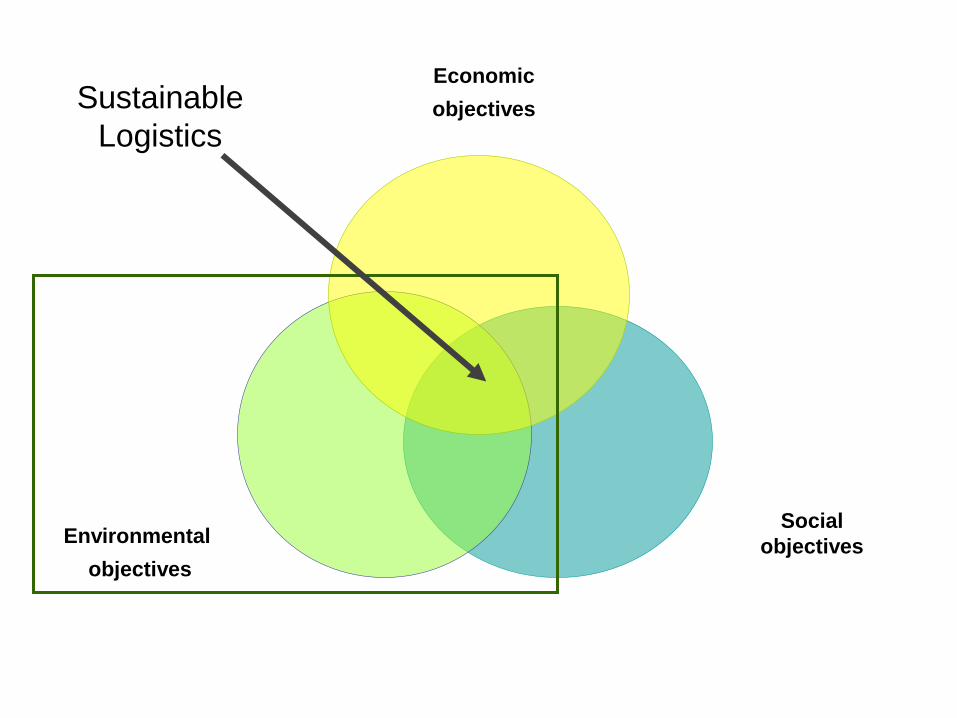
Economic
objectives
Environmental
objectives
Social
objectives
Sustainable
Logistics
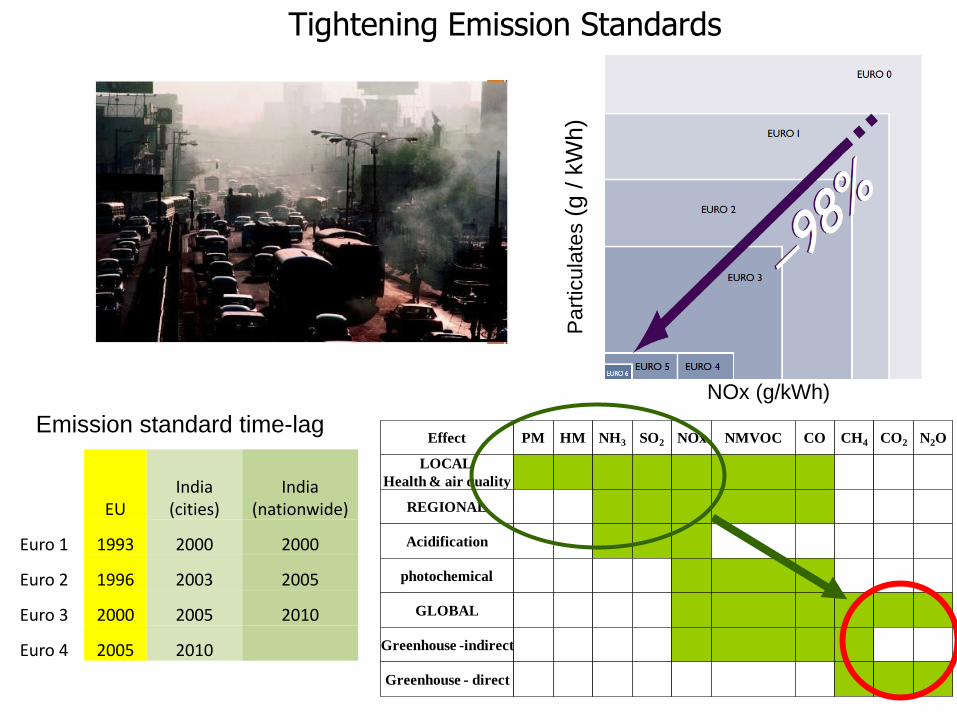
Tightening Emission Standards
Part
icula
tes (
g / k
Wh)
NOx (g/kWh)
LOCAL
Health & air quality
REGIONAL
Acidification
photochemical
GLOBAL
Greenhouse -indirect
Greenhouse - direct
Effect PM HM NH3 SO2 NOx NMVOC CO CH4 CO2 N2O
EU India
(cities) India
(nationwide)
Euro 1 1993 2000 2000
Euro 2 1996 2003 2005
Euro 3 2000 2005 2010
Euro 4 2005 2010
Emission standard time-lag
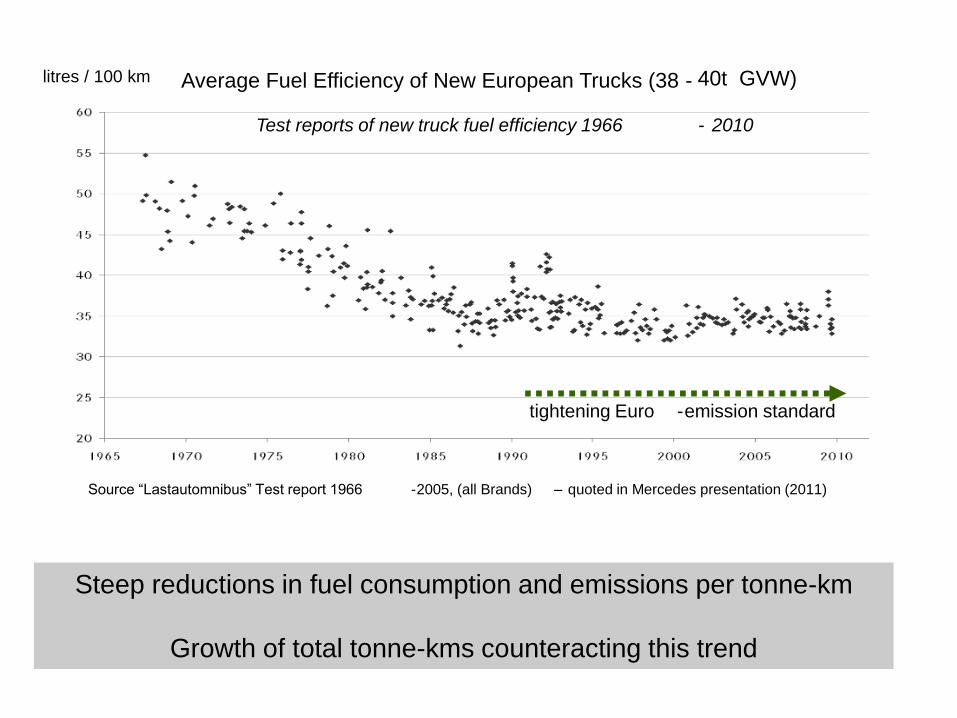
Average Fuel Efficiency of New European Trucks (38 - 40t GVW) litres / 100 km
tightening Euro - emission standard
Source “Lastautomnibus” Test report 1966 - 2005, (all Brands) – quoted in Mercedes presentation (2011)
Test reports of new truck fuel efficiency 1966 - 2010
Steep reductions in fuel consumption and emissions per tonne-km
Growth of total tonne-kms counteracting this trend
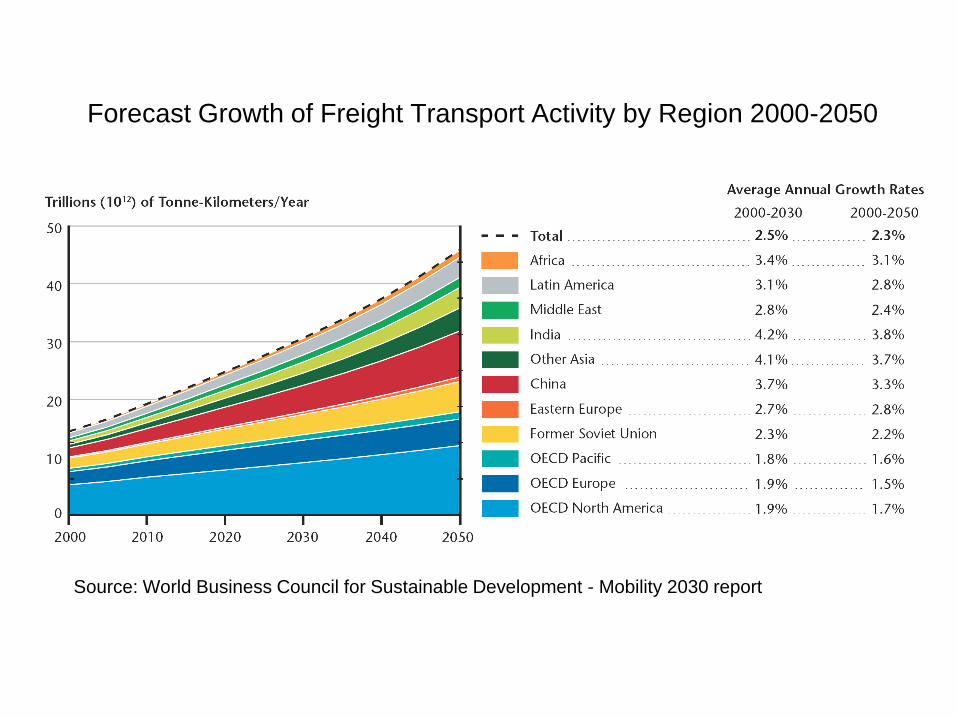
Forecast Growth of Freight Transport Activity by Region 2000-2050
Source: World Business Council for Sustainable Development - Mobility 2030 report
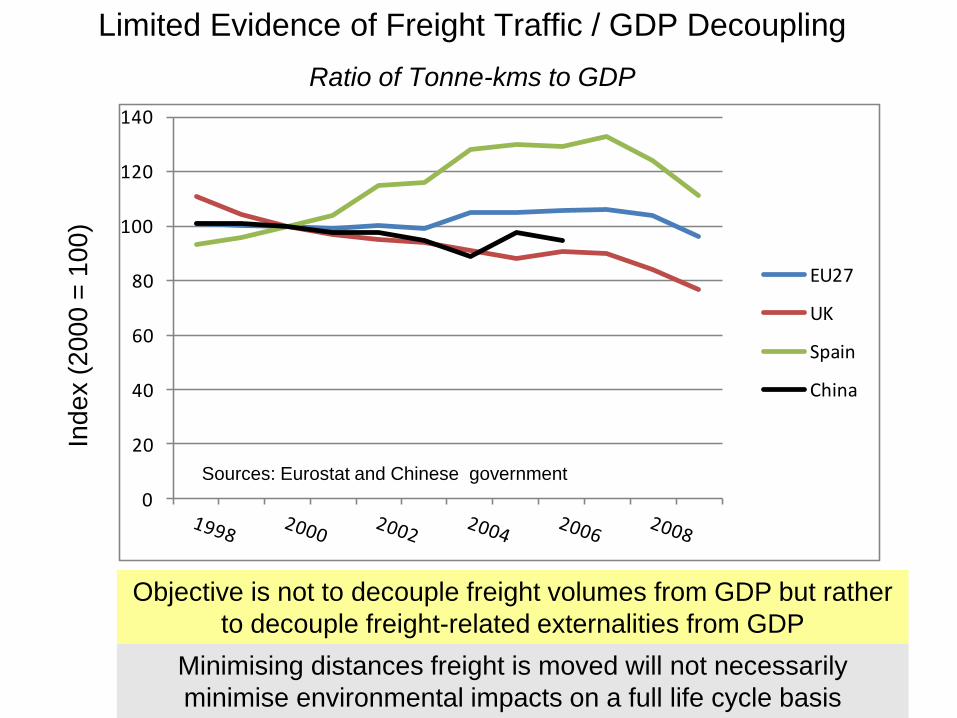
Limited Evidence of Freight Traffic / GDP Decoupling
Ratio of Tonne-kms to GDP In
de
x (
20
00
= 1
00
)
0
20
40
60
80
100
120
140
EU27
UK
Spain
China
Sources: Eurostat and Chinese government
Objective is not to decouple freight volumes from GDP but rather
to decouple freight-related externalities from GDP
Minimising distances freight is moved will not necessarily
minimise environmental impacts on a full life cycle basis
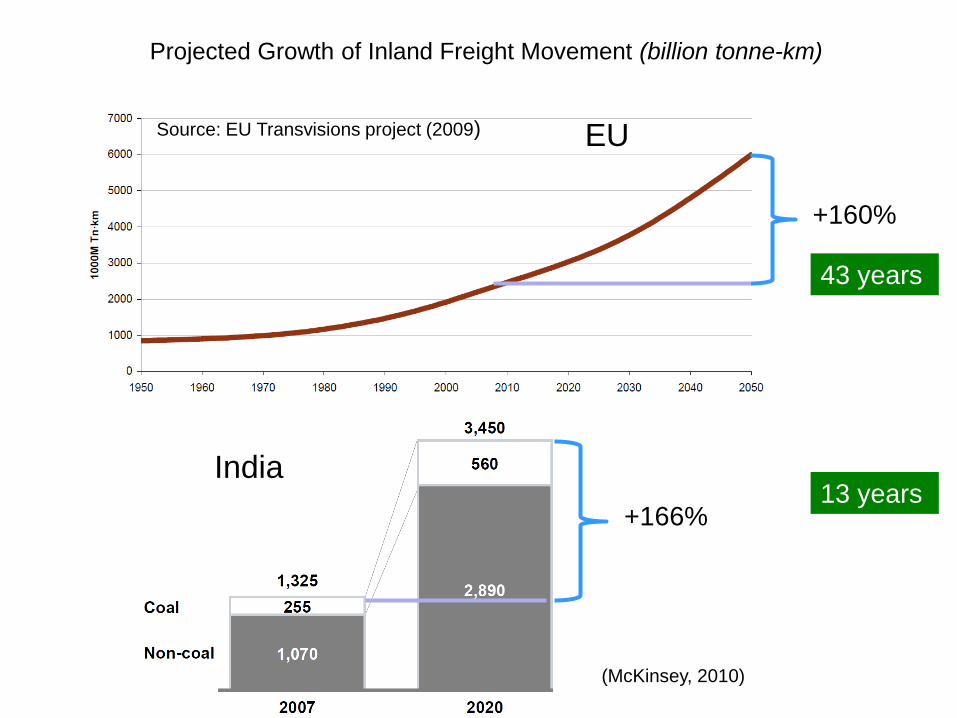
Projected Growth of Inland Freight Movement (billion tonne-km)
Source: EU Transvisions project (2009)
(McKinsey, 2010)
India
EU
+160%
+166% 13 years
43 years
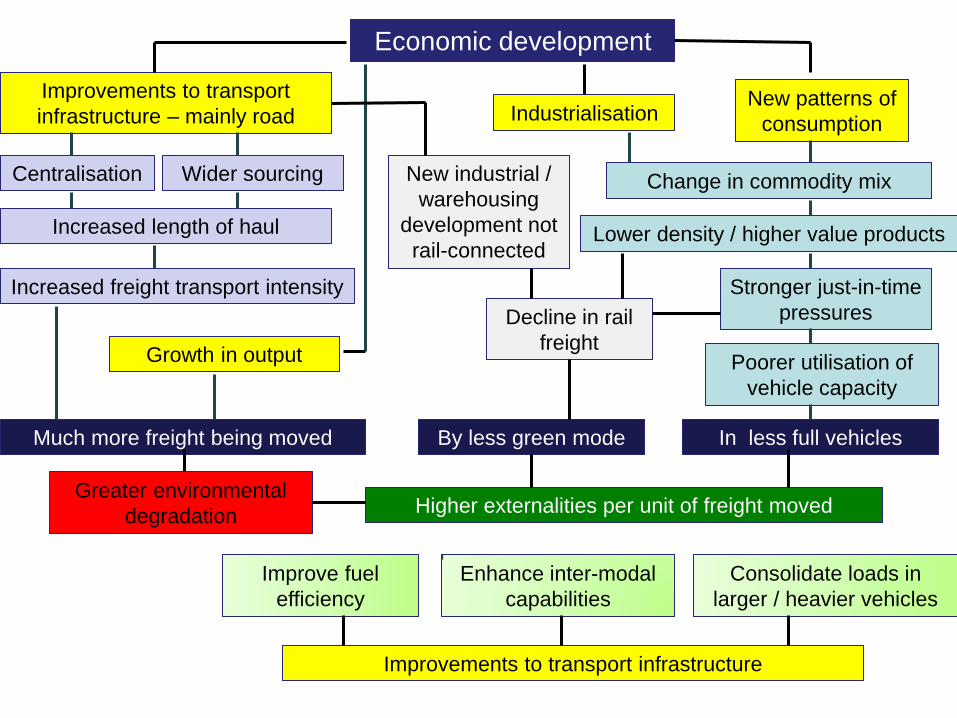
Improvements to transport
infrastructure – mainly road
Centralisation
Increased length of haul
Increased freight transport intensity
Change in commodity mix
Industrialisation
Lower density / higher value products
Consolidate loads in
larger / heavier vehicles
Stronger just-in-time
pressures
Poorer utilisation of
vehicle capacity
Decline in rail
freight
New industrial /
warehousing
development not
rail-connected
Enhance inter-modal
capabilities
Economic development
Wider sourcing
New patterns of
consumption
Growth in output
Much more freight being moved By less green mode
Higher externalities per unit of freight moved Greater environmental
degradation
Improve fuel
efficiency
Improvements to transport infrastructure
In less full vehicles
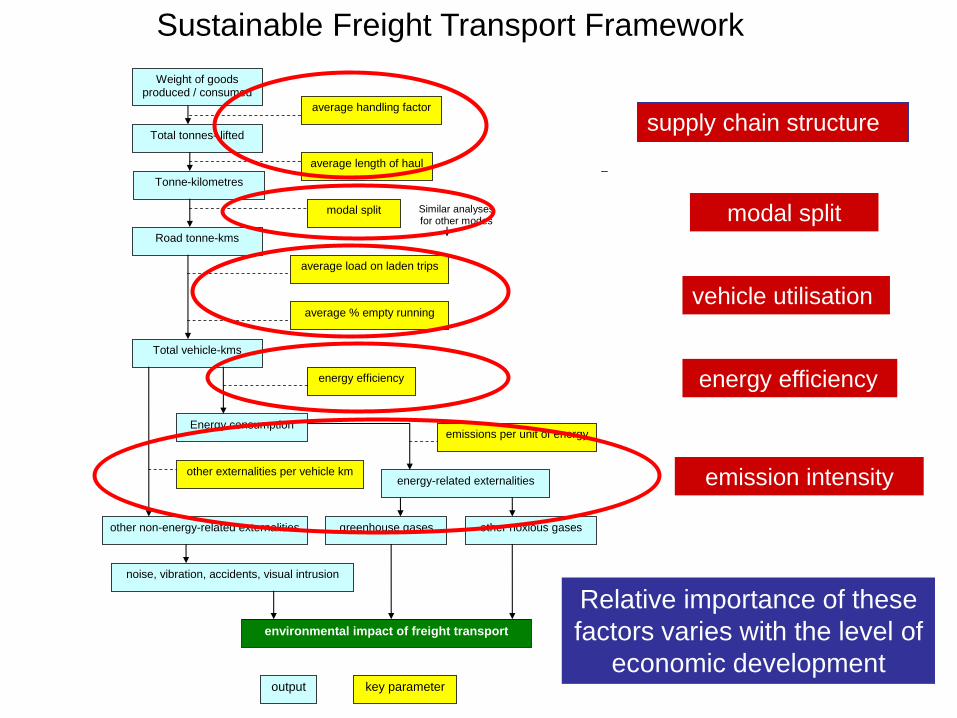
Weight of goods produced / consumed
Total tonnes- lifted
Tonne-kilometres
Road tonne-kms
Total vehicle-kms
energy-related externalities
Energy consumption
other noxious gases greenhouse gases other non-energy-related externalities
average handling factor
average length of haul
average load on laden trips
average % empty running
energy efficiency
noise, vibration, accidents, visual intrusion
emissions per unit of energy
other externalities per vehicle km
environmental impact of freight transport
modal split Similar analyses for other modes
outputs key ratios outputs key ratios
output key parameter
modal split
supply chain structure
emission intensity
energy efficiency
vehicle utilisation
Sustainable Freight Transport Framework
Relative importance of these
factors varies with the level of
economic development
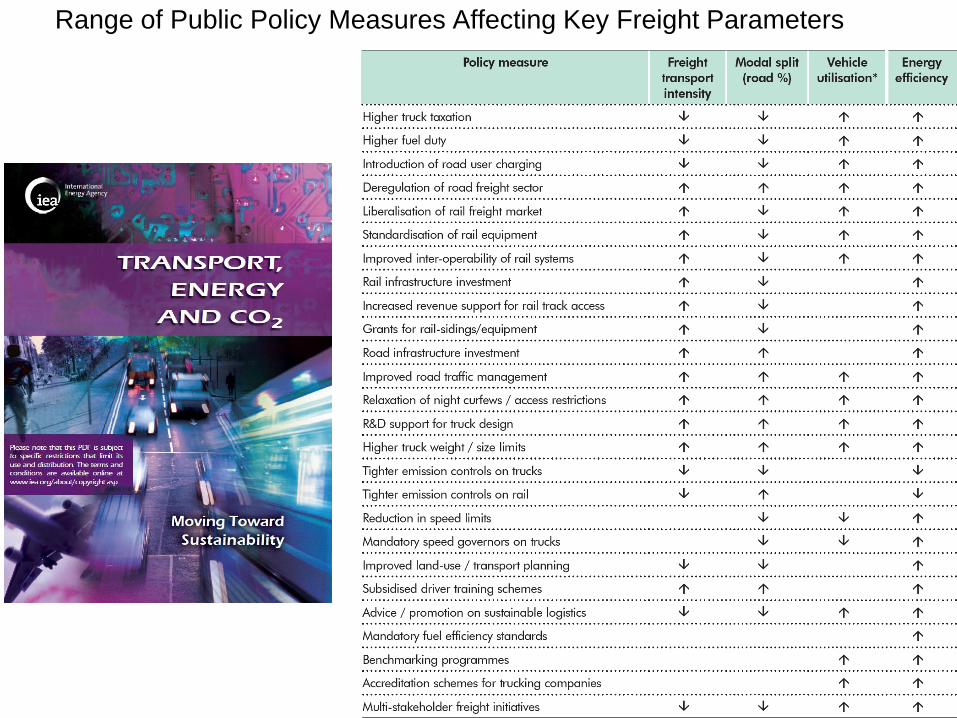
Range of Public Policy Measures Affecting Key Freight Parameters
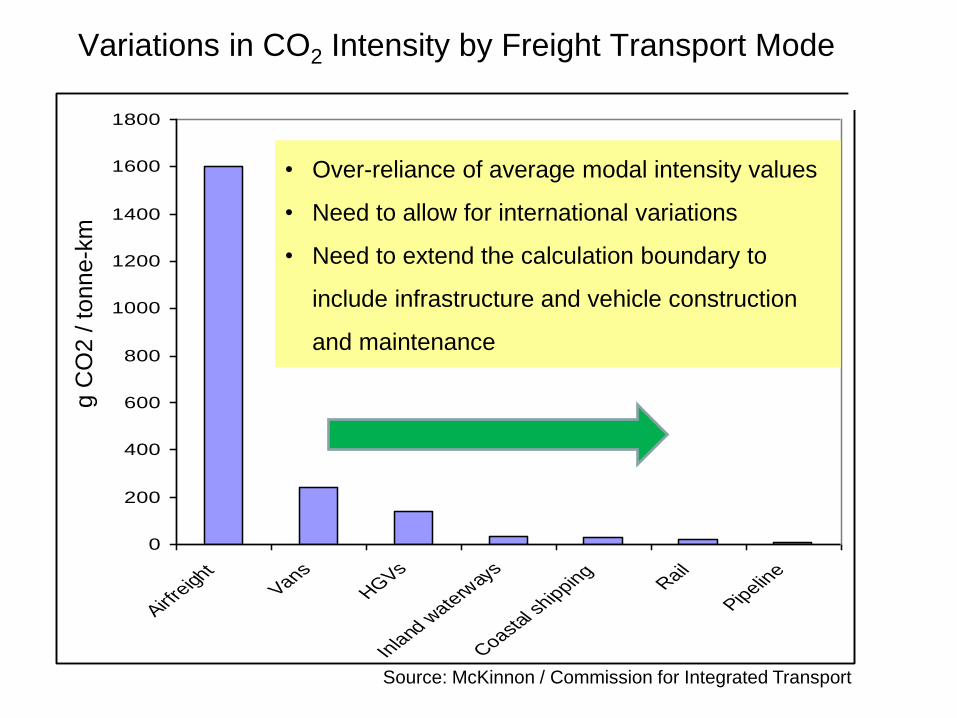
Variations in CO2 Intensity by Freight Transport Mode
0
200
400
600
800
1000
1200
1400
1600
1800
Airfre
ight
Vans
HGVs
Inla
nd w
aterw
ays
Coastal
ship
ping
Rail
Pipelin
e
CO
2 g
m p
er t
on
ne-
km
Source: McKinnon / Commission for Integrated Transport
• Over-reliance of average modal intensity values
• Need to allow for international variations
• Need to extend the calculation boundary to
include infrastructure and vehicle construction
and maintenance
g C
O2 /
tonne-k
m
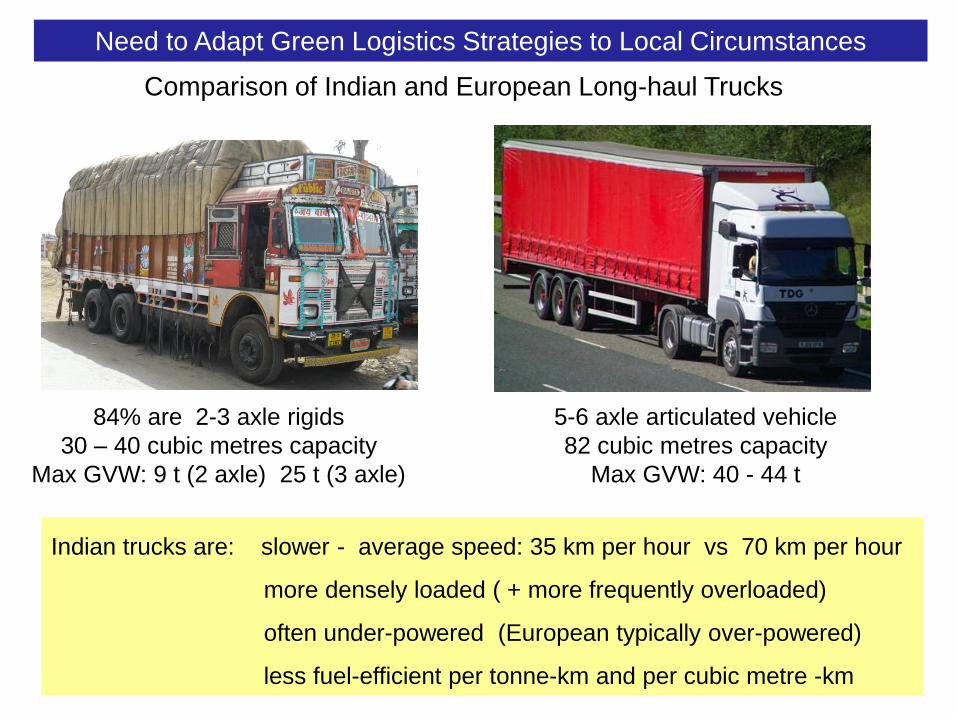
Comparison of Indian and European Long-haul Trucks
84% are 2-3 axle rigids
30 – 40 cubic metres capacity
Max GVW: 9 t (2 axle) 25 t (3 axle)
5-6 axle articulated vehicle
82 cubic metres capacity
Max GVW: 40 - 44 t
Indian trucks are: slower - average speed: 35 km per hour vs 70 km per hour
more densely loaded ( + more frequently overloaded)
often under-powered (European typically over-powered)
less fuel-efficient per tonne-km and per cubic metre -km
Need to Adapt Green Logistics Strategies to Local Circumstances
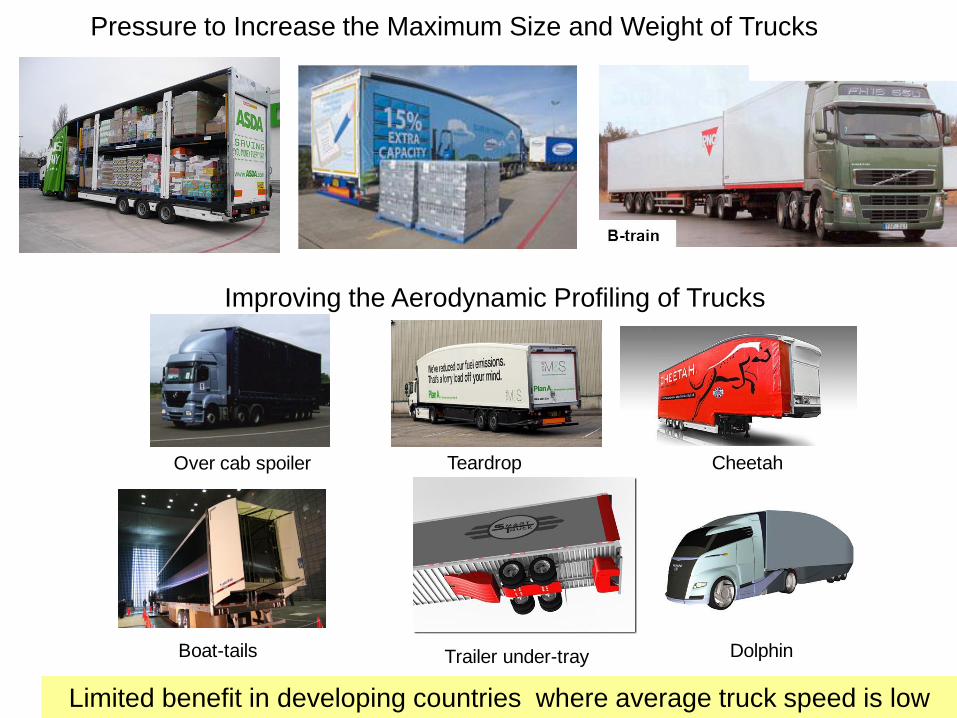
Pressure to Increase the Maximum Size and Weight of Trucks
Teardrop Cheetah
DolphinBoat-tails Trailer under-tray
Over cab spoiler
Improving the Aerodynamic Profiling of Trucks
Limited benefit in developing countries where average truck speed is low
0%
10%
20%
30%
40%
50%
60%
70%
80%
90%
100%
1 4 7
10
13
16
19
22
25
28
31
34
37
40
43
46
49
52
55
58
61
64
67
70
73
76
79
82
85
88
91
94
97
10
0
Speed (km/h)
Ve
hic
le r
es
isti
ve
fo
rce
s (
%)
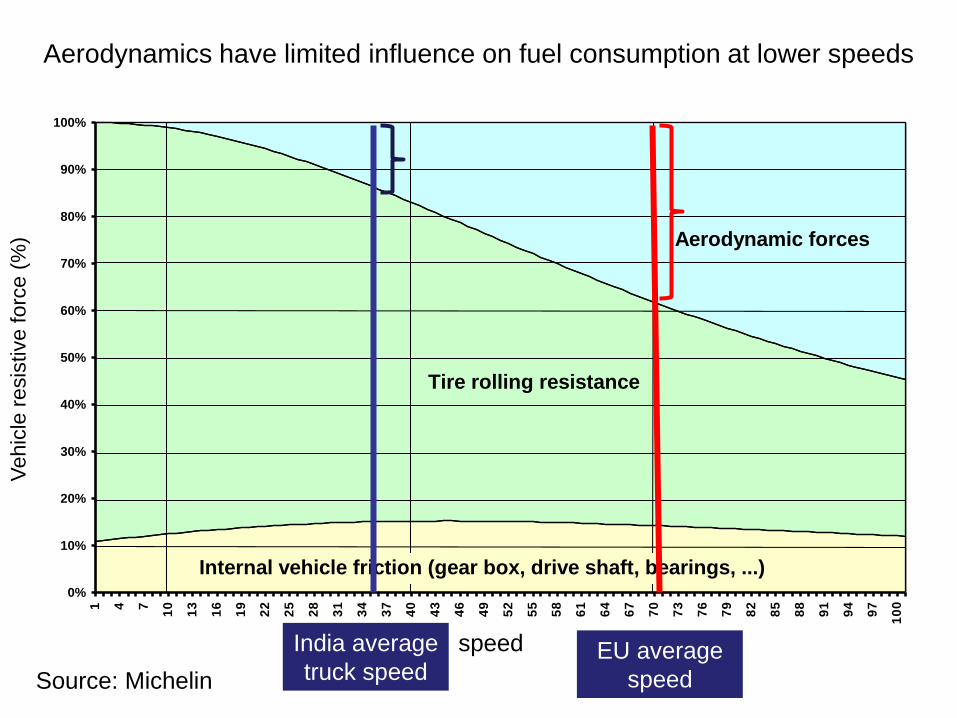
Internal vehicle friction (gear box, drive shaft, bearings, ...)
Tire rolling resistance
Aerodynamic forces
Source: Michelin
Aerodynamics have limited influence on fuel consumption at lower speeds
speed
Vehic
le r
esis
tive forc
e (
%)
EU average
speed
India average
truck speed
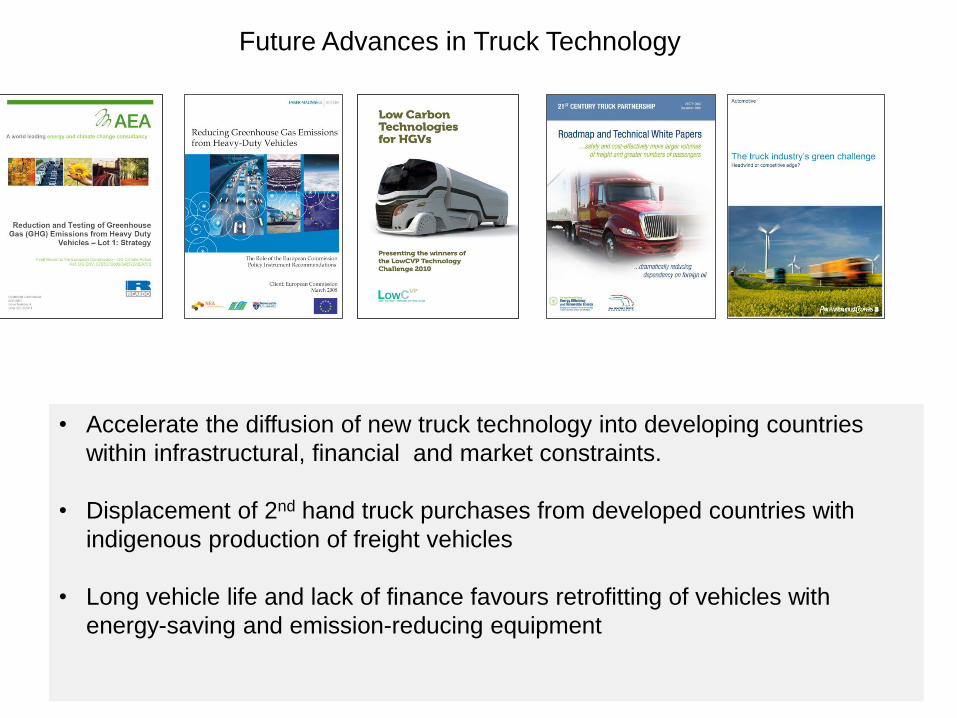
Future Advances in Truck Technology
• Accelerate the diffusion of new truck technology into developing countries
within infrastructural, financial and market constraints.
• Displacement of 2nd hand truck purchases from developed countries with
indigenous production of freight vehicles
• Long vehicle life and lack of finance favours retrofitting of vehicles with
energy-saving and emission-reducing equipment
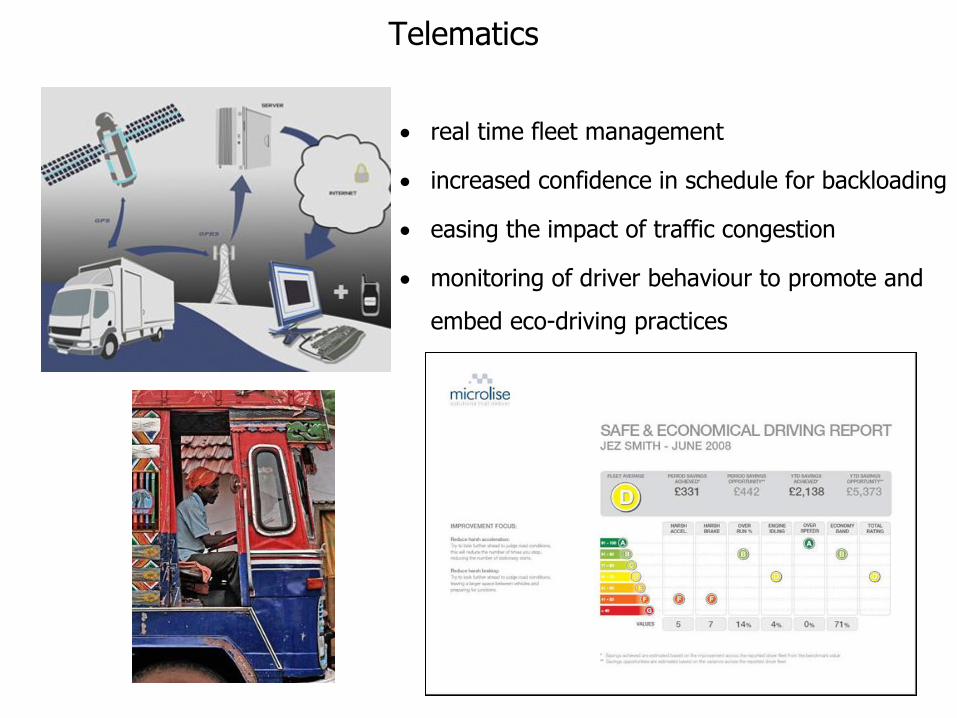
Telematics
real time fleet management
increased confidence in schedule for backloading
easing the impact of traffic congestion
monitoring of driver behaviour to promote and
embed eco-driving practices
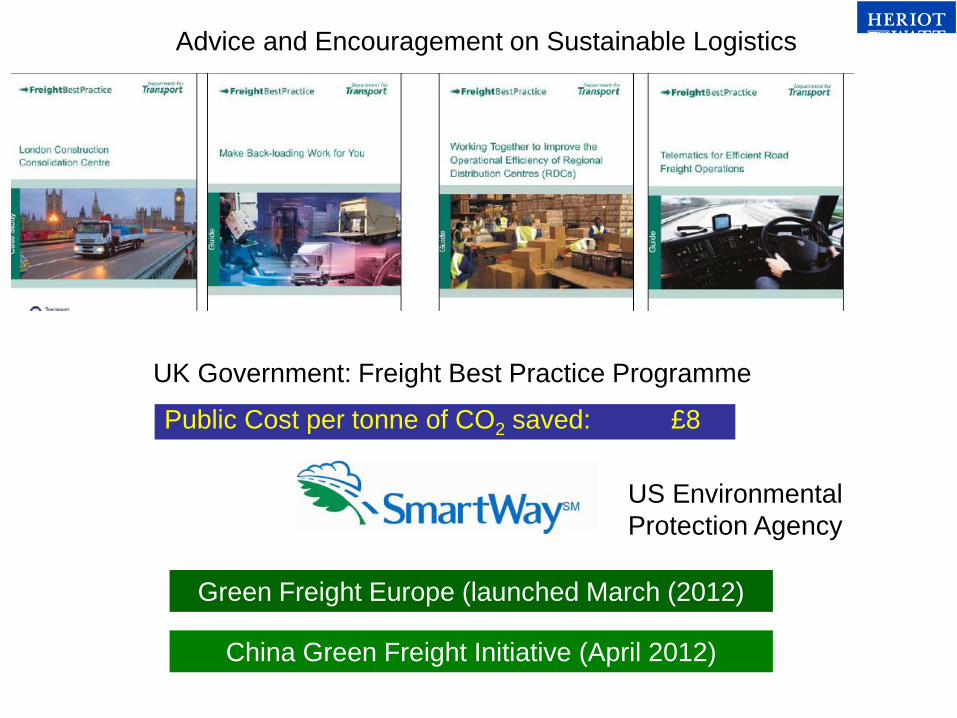
Public Cost per tonne of CO2 saved: £8
Advice and Encouragement on Sustainable Logistics
Green Freight Europe (launched March (2012)
US Environmental
Protection Agency
UK Government: Freight Best Practice Programme
China Green Freight Initiative (April 2012)
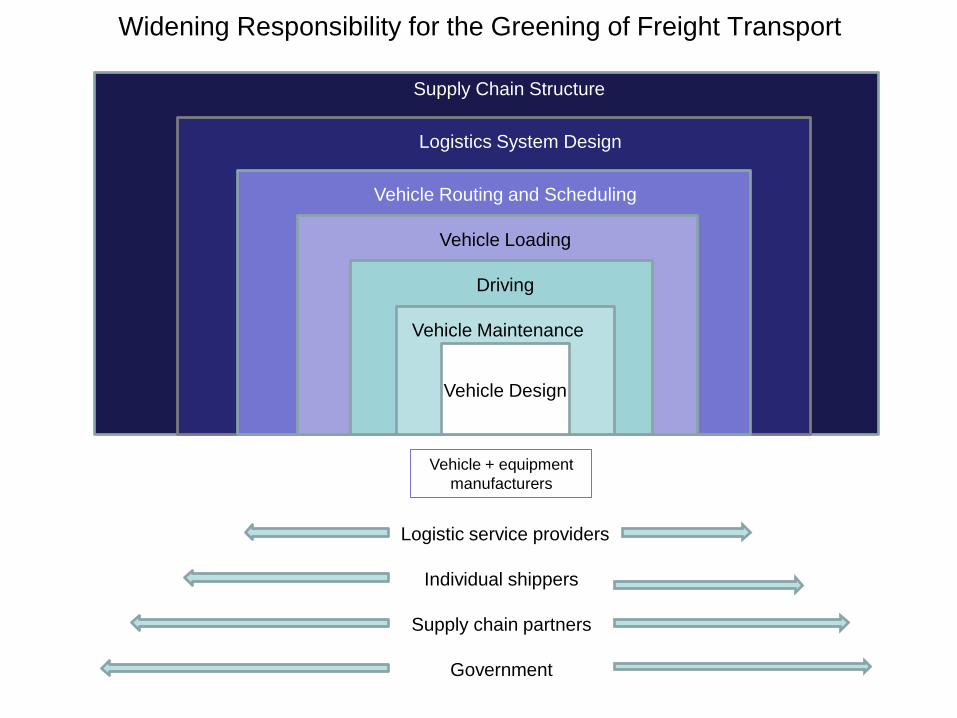
Widening Responsibility for the Greening of Freight Transport
Logistics System Design
Vehicle Maintenance
Driving
Vehicle Loading
Vehicle Routing and Scheduling
Vehicle Design
Supply Chain Structure
Vehicle + equipment
manufacturers
Logistic service providers
Individual shippers
Supply chain partners
Government
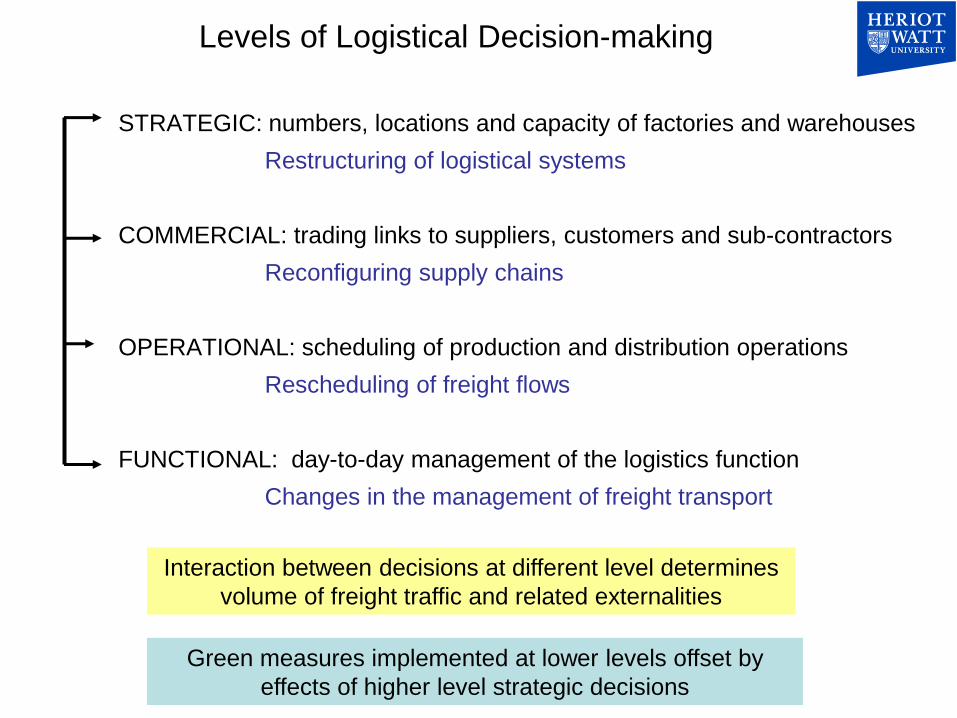
Levels of Logistical Decision-making
STRATEGIC: numbers, locations and capacity of factories and warehouses
Restructuring of logistical systems
COMMERCIAL: trading links to suppliers, customers and sub-contractors
Reconfiguring supply chains
OPERATIONAL: scheduling of production and distribution operations
Rescheduling of freight flows
FUNCTIONAL: day-to-day management of the logistics function
Changes in the management of freight transport
Interaction between decisions at different level determines
volume of freight traffic and related externalities
Green measures implemented at lower levels offset by
effects of higher level strategic decisions
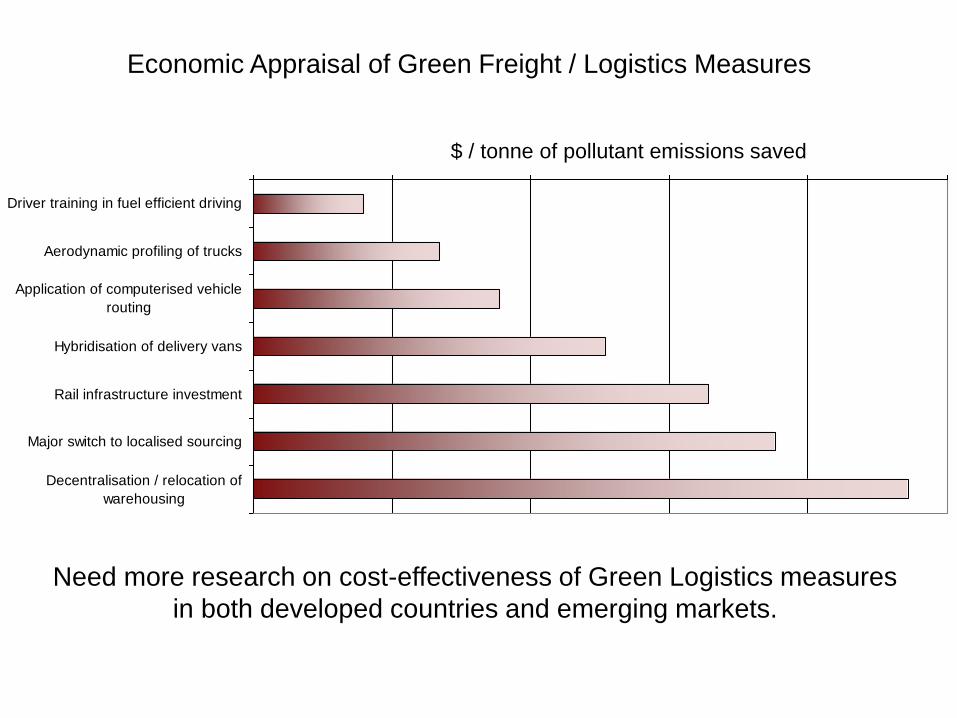
Euro / tonne of CO2 emitted0 50 100 150 200 250
Driver training in fuel efficient driving
Aerodynamic profiling of trucks
Application of computerised vehicle
routing
Hybridisation of delivery vans
Rail infrastructure investment
Major switch to localised sourcing
Decentralisation / relocation of
warehousing
Economic Appraisal of Green Freight / Logistics Measures
$ / tonne of pollutant emissions saved
Need more research on cost-effectiveness of Green Logistics measures
in both developed countries and emerging markets.
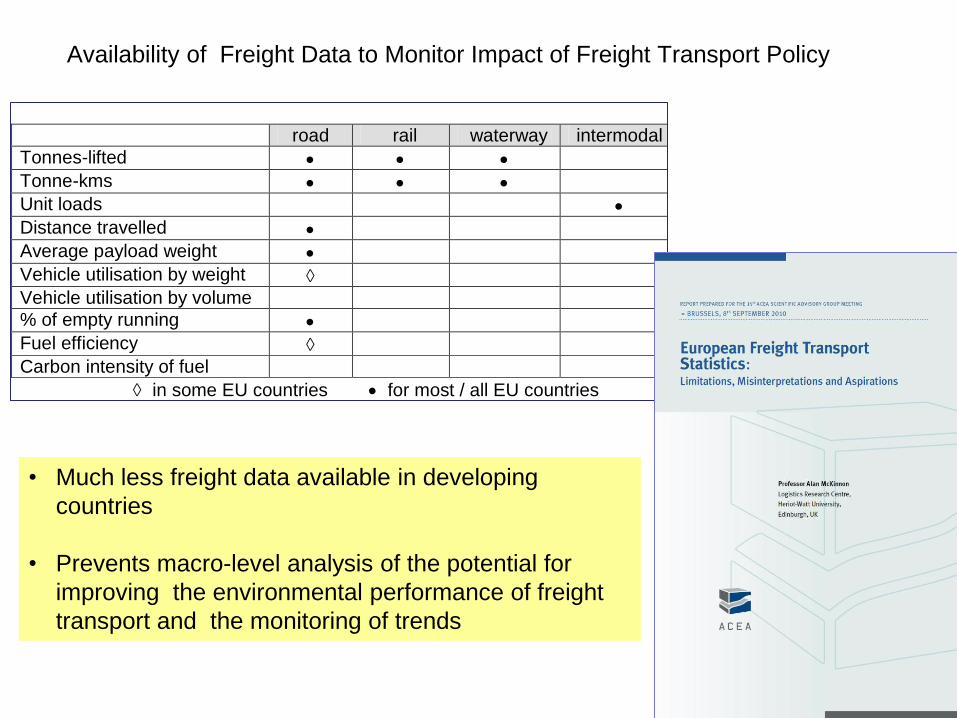
Availability of Freight Data to Monitor Impact of Freight Transport Policy
road rail waterway intermodal
Tonnes-lifted
Tonne-kms
Unit loads
Distance travelled
Average payload weight
Vehicle utilisation by weight
Vehicle utilisation by volume
% of empty running
Fuel efficiency
Carbon intensity of fuel
in some EU countries for most / all EU countries
• Much less freight data available in developing
countries
• Prevents macro-level analysis of the potential for
improving the environmental performance of freight
transport and the monitoring of trends
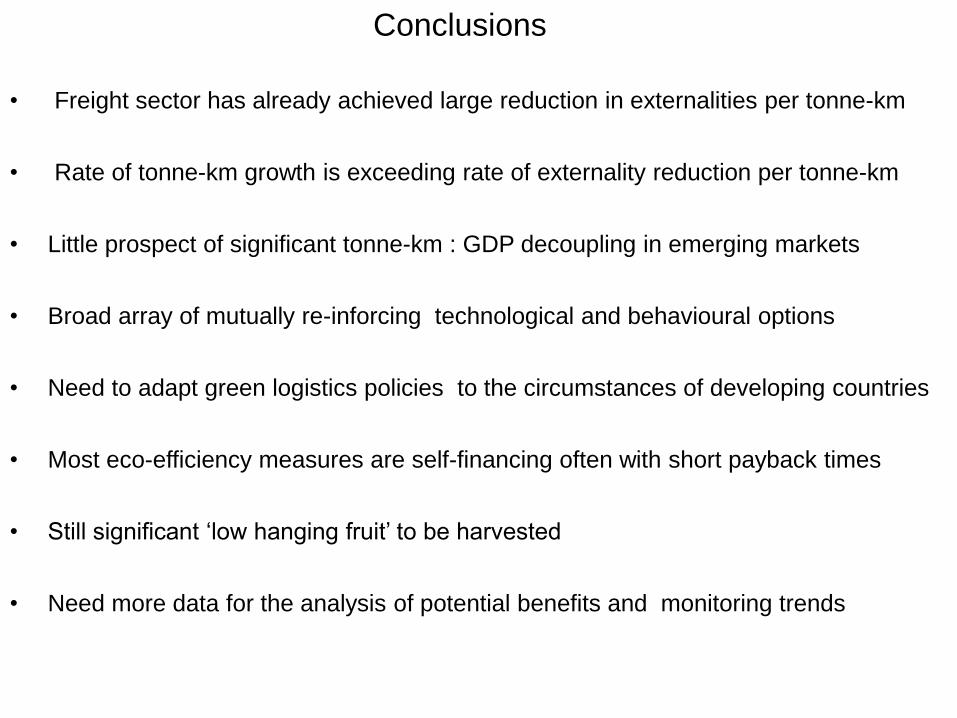
Conclusions
• Freight sector has already achieved large reduction in externalities per tonne-km
• Rate of tonne-km growth is exceeding rate of externality reduction per tonne-km
• Little prospect of significant tonne-km : GDP decoupling in emerging markets
• Broad array of mutually re-inforcing technological and behavioural options
• Need to adapt green logistics policies to the circumstances of developing countries
• Most eco-efficiency measures are self-financing often with short payback times
• Still significant ‘low hanging fruit’ to be harvested
• Need more data for the analysis of potential benefits and monitoring trends
Contact details
Kühne Logistics University – The KLU Wissenschaftliche Hochschule für Logistik und
Unternehmensführung Brooktorkai 20
20457 Hamburg
Tel.: +49 40 328707-271 Fax: +49 40 328707-109
E-Mail: [email protected]
Website: www.the-klu.org