the state of forests in the amazon basin, congo basin and
TRANSCRIPT
1
The State of Forests in the Amazon Basin, Congo Basin and Southeast Asia
A report prepared for the Summit of the Three Rainforest Basins
Brazzaville, Republic of Congo, 31 May – 3 June, 2011
Draft for comments

2
Acknowledgments This report was prepared by staff of FAO and ITTO. Special thanks goes to the following: Rémi
d’Annunzio, Chris Brown, Carlos Marx Carneiro, Patrick Durst, Steve Johnson, Örjan Jonsson,
Arvydas Lebedys, Danae Maniatis, Jean-Claude Nguinguiri and Hivy Ortiz-Chour for input; Mette L.
Wilkie for the compilation of the report; Philippe Mayaux of the Joint Research Centre of the
European Commission for the map and statistics on forest types; Thorgeir Lawrence, Frederique
Banoun, José Chabás and Flora di Carlo for language editing, translations and layout; and Emma Foti
for administrative support.

3
Table of Contents
ACKNOWLEDGMENTS ................................................................................................................................... 2
TABLE OF CONTENTS .................................................................................................................................... 3
INTRODUCTION ............................................................................................................................................... 4
EXTENT OF FORESTS ..................................................................................................................................... 7
FOREST CHARACTERISTICS ...................................................................................................................... 10
GROWING STOCK AND CARBON STOCKS.............................................................................................. 13
OWNERSHIP AND MANAGEMENT RIGHTS ........................................................................................... 16
DESIGNATED FUNCTIONS OF FORESTS ................................................................................................. 17
SOCIO-ECONOMIC ASPECTS ....................................................................................................................... 19
LAWS AND POLICIES .................................................................................................................................... 22
STATUS OF FOREST MANAGEMENT ....................................................................................................... 24
CHALLENGES AND OPPORTUNITIES IN THE THREE RAINFOREST BASINS .............................. 30
AMAZON BASIN .............................................................................................................................................. 31
CONGO BASIN ................................................................................................................................................. 34
SOUTHEAST ASIA .......................................................................................................................................... 40
CONCLUSIONS ................................................................................................................................................. 46
REFERENCES ................................................................................................................................................... 49
ANNEX TABLES .............................................................................................................................................. 50
4
Introduction This report was prepared as a background document for The Summit on the Three Rainforest Basins, held in Brazzaville, Republic of Congo, on 31 May – 3 June, 2011. The three basins and the countries they cover are:
Amazon Basin. Bolivia (Plurinational State of), Brazil, Colombia, Ecuador, French Guiana, Guyana, Peru, Suriname and Venezuela (Bolivarian Republic of).
Congo Basin. Angola, Burundi, Cameroon, Central African Republic, Congo, Democratic Republic of the Congo, Equatorial Guinea, Gabon, Rwanda and Sao Tome and Principe.
Southeast Asia. Brunei Darussalam, Cambodia, Indonesia, Lao People’s Democratic Republic, Malaysia, Myanmar, Papua New Guinea, Philippines, Singapore, Thailand and Viet Nam.
The selection of countries is based on geographical rather than political groupings and includes those countries where a significant proportion of their forests are characterized either as tropical rainforests or as moist deciduous forests. For ease of reference, the three regional groupings are collectively referred to as the three rainforest basins in this report, although, strictly speaking, they are delimited neither geographically nor hydrologically as basins, and some countries contain forests that are not classified as tropical rainforests. Unless otherwise specified, the information contained in this report is based on the data provided by countries to FAO for the Global Forest Resources Assessment 2010 (also known as FRA 2010) (FAO, 2010), to the FAO/ITTO/UNECE/Eurostat Joint Forest Sector Questionnaire and to ITTO for the Status of Tropical Forest Management - 2011 (ITTO, in press). Additional information on issues, challenges and opportunities and on the regional outlooks was provided by FAO’s Regional Forestry Officers in the three subregions and is primarily based on the most recent versions of regional Forestry Sector Outlook Studies. The data presented covers all the forests in each of the countries—not just the tropical rainforests—since it was not possible to systematically disaggregate the available national data. The document provides information on the current status (the best available, most recent data or estimate—mostly for 2010) as well as trends over time (generally for 1990–2010). Not all countries provided data for all the reporting years, so the trend figures presented in this document only represent those countries that provided a complete data series. More detailed and, in some cases, more recent information is available in individual countries and, for the Congo Basin, in the report Congo Basin Forests – State of Forests 2010 (in press). However, time did not allow for collection, analysis and incorporation of such data.
5
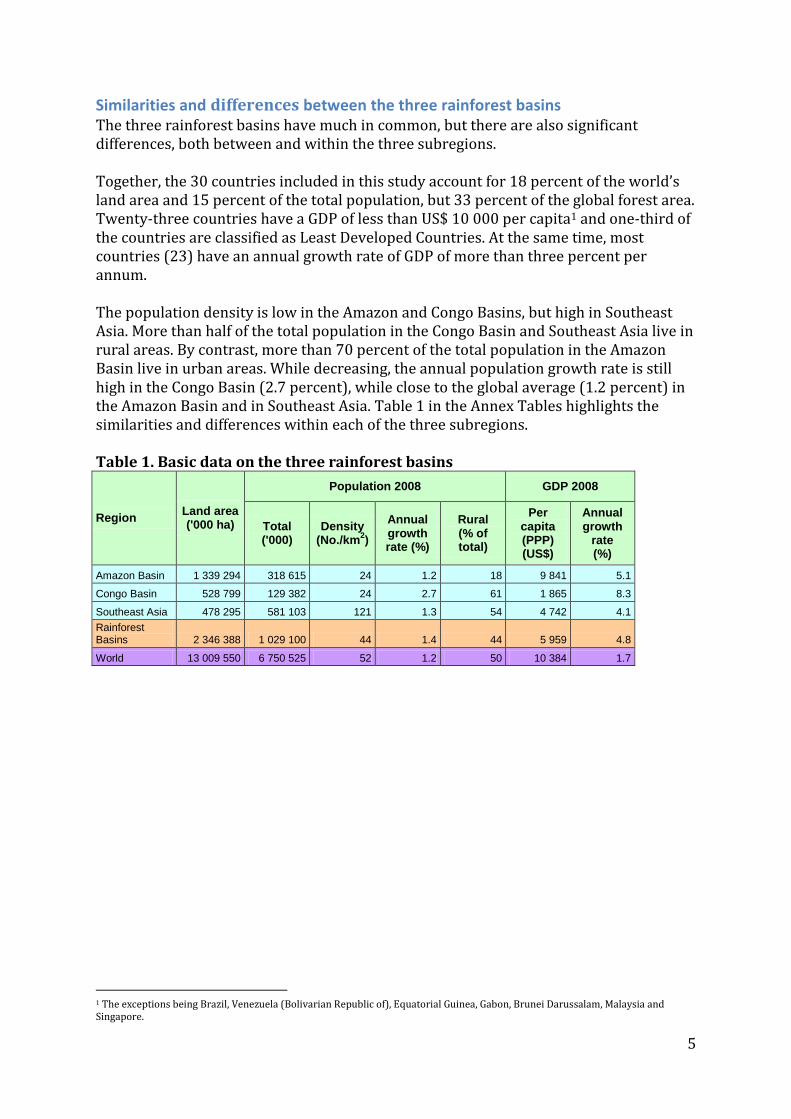
Similarities and differences between the three rainforest basins The three rainforest basins have much in common, but there are also significant differences, both between and within the three subregions. Together, the 30 countries included in this study account for 18 percent of the world’s land area and 15 percent of the total population, but 33 percent of the global forest area. Twenty-three countries have a GDP of less than US$ 10 000 per capita1 and one-third of the countries are classified as Least Developed Countries. At the same time, most countries (23) have an annual growth rate of GDP of more than three percent per annum. The population density is low in the Amazon and Congo Basins, but high in Southeast Asia. More than half of the total population in the Congo Basin and Southeast Asia live in rural areas. By contrast, more than 70 percent of the total population in the Amazon Basin live in urban areas. While decreasing, the annual population growth rate is still high in the Congo Basin (2.7 percent), while close to the global average (1.2 percent) in the Amazon Basin and in Southeast Asia. Table 1 in the Annex Tables highlights the similarities and differences within each of the three subregions. Table 1. Basic data on the three rainforest basins
Region Land area
('000 ha)
Population 2008 GDP 2008
Total ('000)
Density (No./km
2)
Annual growth rate (%)
Rural (% of total)
Per capita (PPP) (US$)
Annual growth
rate (%)
Amazon Basin 1 339 294 318 615 24 1.2 18 9 841 5.1
Congo Basin 528 799 129 382 24 2.7 61 1 865 8.3
Southeast Asia 478 295 581 103 121 1.3 54 4 742 4.1
Rainforest Basins 2 346 388 1 029 100 44 1.4 44 5 959 4.8
World 13 009 550 6 750 525 52 1.2 50 10 384 1.7
1 The exceptions being Brazil, Venezuela (Bolivarian Republic of), Equatorial Guinea, Gabon, Brunei Darussalam, Malaysia and Singapore.

6
Figure 1. Countries included in this report
Figure 2. Distribution of forests in the three rainforest basins
Note : Tree cover derived from MODIS VCF* 250 meter pixels for year 2005. *Moderate-resolution Imaging Spectroradiometer Vegetation Continuous Fields (Hansen et al. 2010)

7
Extent of forests
Forests cover 57 percent of total land area in the three rainforest basins compared with the world average of 31 percent The total forest area in the three rainforest basins is over 1.3 billion hectares (Table 1), which corresponds to one-third of the total forest area in the world and an average of 2.3 ha of forest per capita. The three most forest-rich countries (Brazil, Democratic Republic of Congo and Indonesia) account for more than half (57 percent) of the total forest area and the Amazon Basin contains more forest than the Congo Basin and Southeast Asia combined. French Guiana, Suriname and Gabon have the highest percent of their land area covered by forests (98, 95 and 85 percent respectively), while Singapore, Burundi and Rwanda have the lowest, ranging from 3 to 18 percent of their total land area.
Table 2. Forest area in the three rainforest basins, 2010
Region Forest area
1 000 ha % of land area
Amazon Basin 799 394 60
Congo Basin 301 807 57
Southeast Asia 242 048 51
Rainforest Basins 1 343 249 57
World 4 033 060 31
Figure 3. Ten countries with the largest forest area in the three rainforest basins, 2010 (million ha)
520
15494
68
60
58
57
46
32
29
224
Brazil
Democratic Republic of the CongoIndonesia
Peru
Colombia
Angola
Bolivia (Plurinational state of)
Venezuela (Bolivarian Republic of)Myanmar
Papua New Guinea
Others
8
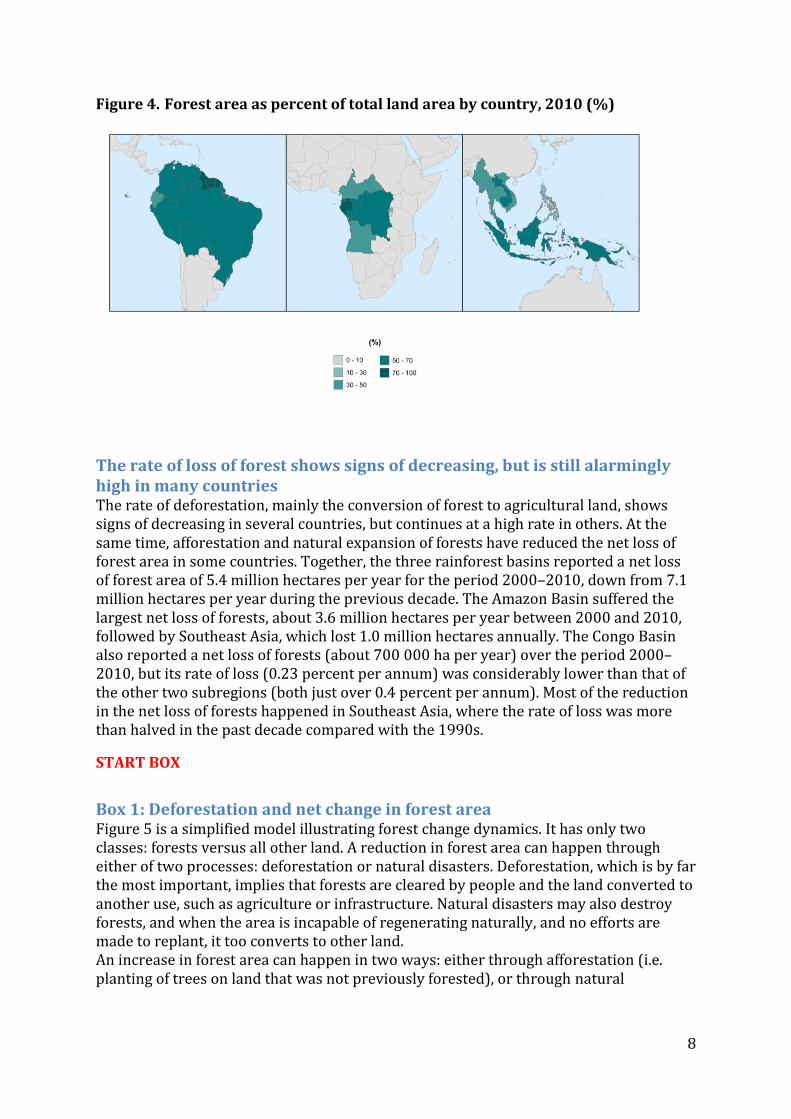
Figure 4. Forest area as percent of total land area by country, 2010 (%)
The rate of loss of forest shows signs of decreasing, but is still alarmingly high in many countries The rate of deforestation, mainly the conversion of forest to agricultural land, shows signs of decreasing in several countries, but continues at a high rate in others. At the same time, afforestation and natural expansion of forests have reduced the net loss of forest area in some countries. Together, the three rainforest basins reported a net loss of forest area of 5.4 million hectares per year for the period 2000–2010, down from 7.1 million hectares per year during the previous decade. The Amazon Basin suffered the largest net loss of forests, about 3.6 million hectares per year between 2000 and 2010, followed by Southeast Asia, which lost 1.0 million hectares annually. The Congo Basin also reported a net loss of forests (about 700 000 ha per year) over the period 2000–2010, but its rate of loss (0.23 percent per annum) was considerably lower than that of the other two subregions (both just over 0.4 percent per annum). Most of the reduction in the net loss of forests happened in Southeast Asia, where the rate of loss was more than halved in the past decade compared with the 1990s.
START BOX
Box 1: Deforestation and net change in forest area Figure 5 is a simplified model illustrating forest change dynamics. It has only two classes: forests versus all other land. A reduction in forest area can happen through either of two processes: deforestation or natural disasters. Deforestation, which is by far the most important, implies that forests are cleared by people and the land converted to another use, such as agriculture or infrastructure. Natural disasters may also destroy forests, and when the area is incapable of regenerating naturally, and no efforts are made to replant, it too converts to other land. An increase in forest area can happen in two ways: either through afforestation (i.e. planting of trees on land that was not previously forested), or through natural
9
expansion of forests (e.g. on abandoned agricultural land, which is quite common in some European countries). Where part of a forest is cut down but replanted (reforestation) or grows back on its own within a relatively short period (natural regeneration), there is no change in forest area. For FRA 2010, countries were asked to provide information on their forest area for four points in time: 1990, 2000, 2005 and 2010. This allows the calculation of net change in forest area over time. This net change is the sum of all negative changes due to deforestation and natural disasters, and all positive changes due to afforestation and natural expansion of forests. The information available does not permit the calculation of the deforestation rate for each country. Figure 5. Forest change dynamics
END BOX
Table 3. Trends in forest area in the three rainforest basins, 1990–2010
Region Area (1000 ha)
Annual change (1000 ha)
Annual change rate (%)
1990 2000 2010 1990-2000
2000-2010
1990-2000
2000-2010
Amazon Basin 874 321 835 847 799 394 -3 847 -3 645 -0.45 -0.44
Congo Basin 316 078 308 864 301 807 -721 -706 -0.23 -0.23
Southeast Asia 277 817 252 324 242 048 -2 549 -1 028 -0.96 -0.41
Rainforest Basins 1 468 216 1 397 035 1 343 249 -7 118 -5 379 -0.50 -0.39
World 4 168 399 4 085 063 4 032 905 -8 334 -5 216 -0.20 -0.13
Figure 6. Annual change in forest area, 1990–2010 (million ha)
-4.5
-4.0
-3.5
-3.0
-2.5
-2.0
-1.5
-1.0
-0.5
0.0
Amazon Basin Congo Basin Southeast Asia
1990-2000
2000-2010
10
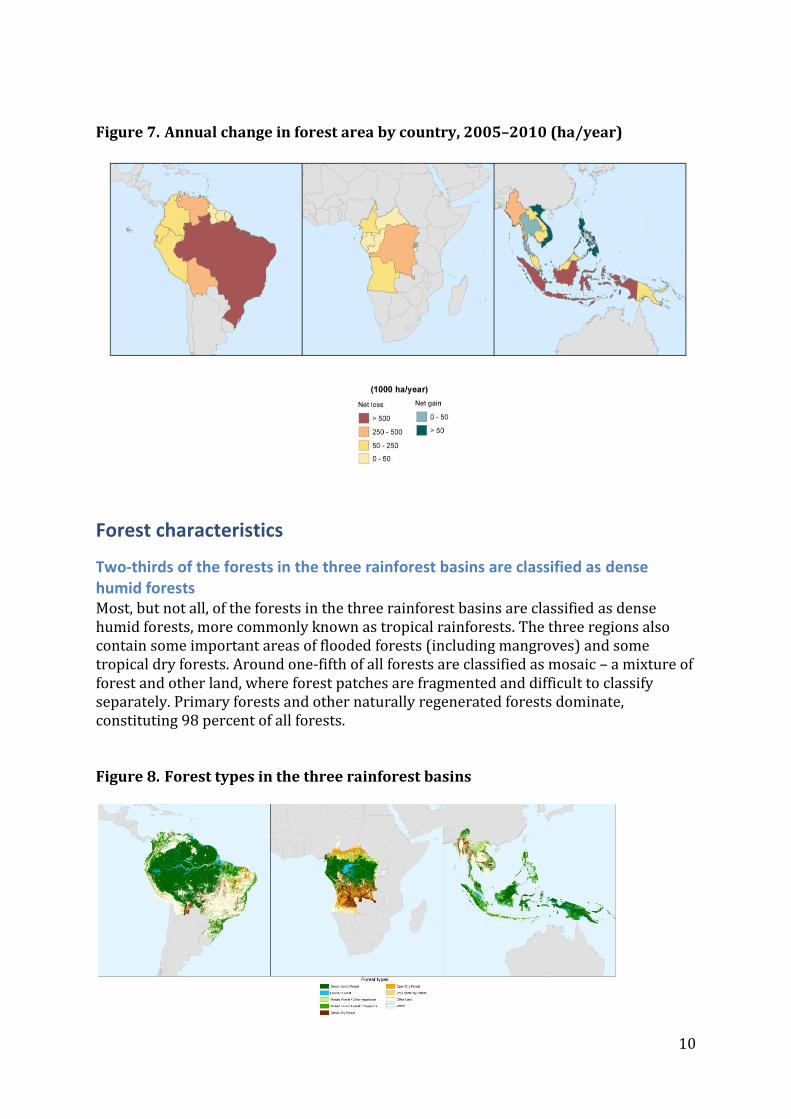
Figure 7. Annual change in forest area by country, 2005–2010 (ha/year)
Forest characteristics
Two-thirds of the forests in the three rainforest basins are classified as dense humid forests Most, but not all, of the forests in the three rainforest basins are classified as dense humid forests, more commonly known as tropical rainforests. The three regions also contain some important areas of flooded forests (including mangroves) and some tropical dry forests. Around one-fifth of all forests are classified as mosaic – a mixture of forest and other land, where forest patches are fragmented and difficult to classify separately. Primary forests and other naturally regenerated forests dominate, constituting 98 percent of all forests. Figure 8. Forest types in the three rainforest basins
11
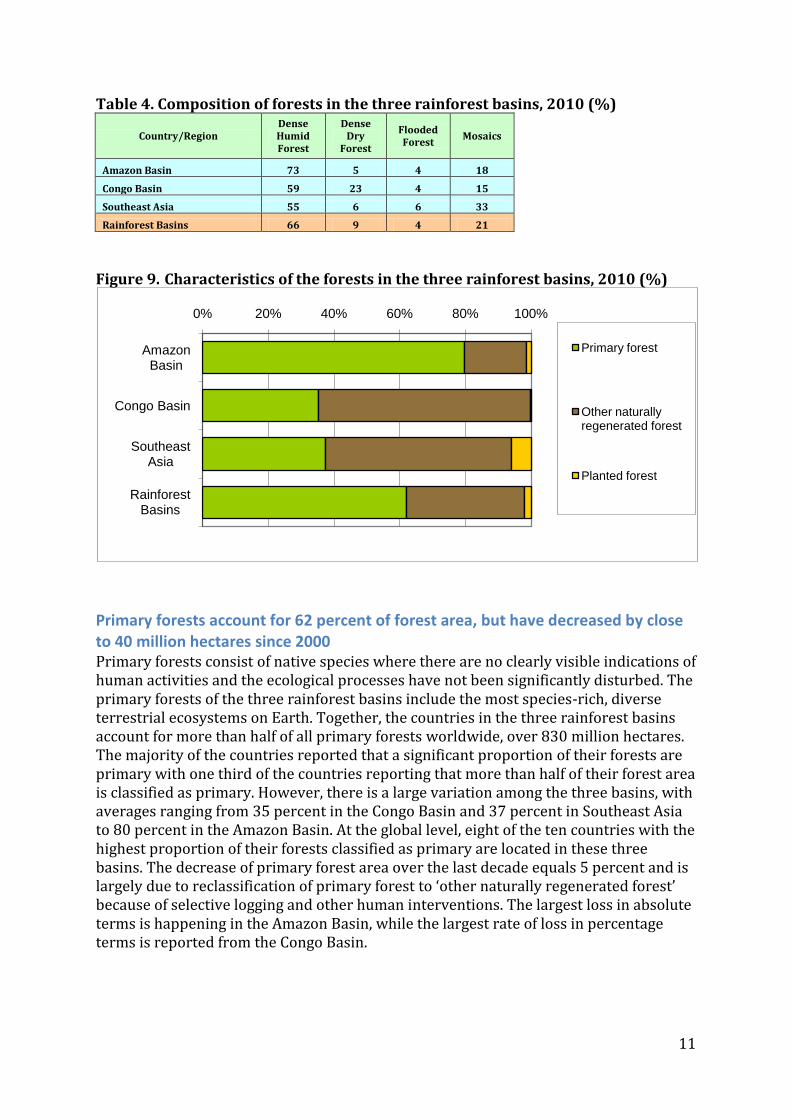
Table 4. Composition of forests in the three rainforest basins, 2010 (%)
Country/Region Dense Humid Forest
Dense Dry
Forest
Flooded Forest
Mosaics
Amazon Basin 73 5 4 18 Congo Basin 59 23 4 15 Southeast Asia 55 6 6 33 Rainforest Basins 66 9 4 21
Figure 9. Characteristics of the forests in the three rainforest basins, 2010 (%)
Primary forests account for 62 percent of forest area, but have decreased by close to 40 million hectares since 2000 Primary forests consist of native species where there are no clearly visible indications of human activities and the ecological processes have not been significantly disturbed. The primary forests of the three rainforest basins include the most species-rich, diverse terrestrial ecosystems on Earth. Together, the countries in the three rainforest basins account for more than half of all primary forests worldwide, over 830 million hectares. The majority of the countries reported that a significant proportion of their forests are primary with one third of the countries reporting that more than half of their forest area is classified as primary. However, there is a large variation among the three basins, with averages ranging from 35 percent in the Congo Basin and 37 percent in Southeast Asia to 80 percent in the Amazon Basin. At the global level, eight of the ten countries with the highest proportion of their forests classified as primary are located in these three basins. The decrease of primary forest area over the last decade equals 5 percent and is largely due to reclassification of primary forest to ‘other naturally regenerated forest’ because of selective logging and other human interventions. The largest loss in absolute terms is happening in the Amazon Basin, while the largest rate of loss in percentage terms is reported from the Congo Basin.
0% 20% 40% 60% 80% 100%
Amazon Basin
Congo Basin
Southeast Asia
Rainforest Basins
Primary forest
Other naturally regenerated forest
Planted forest
12
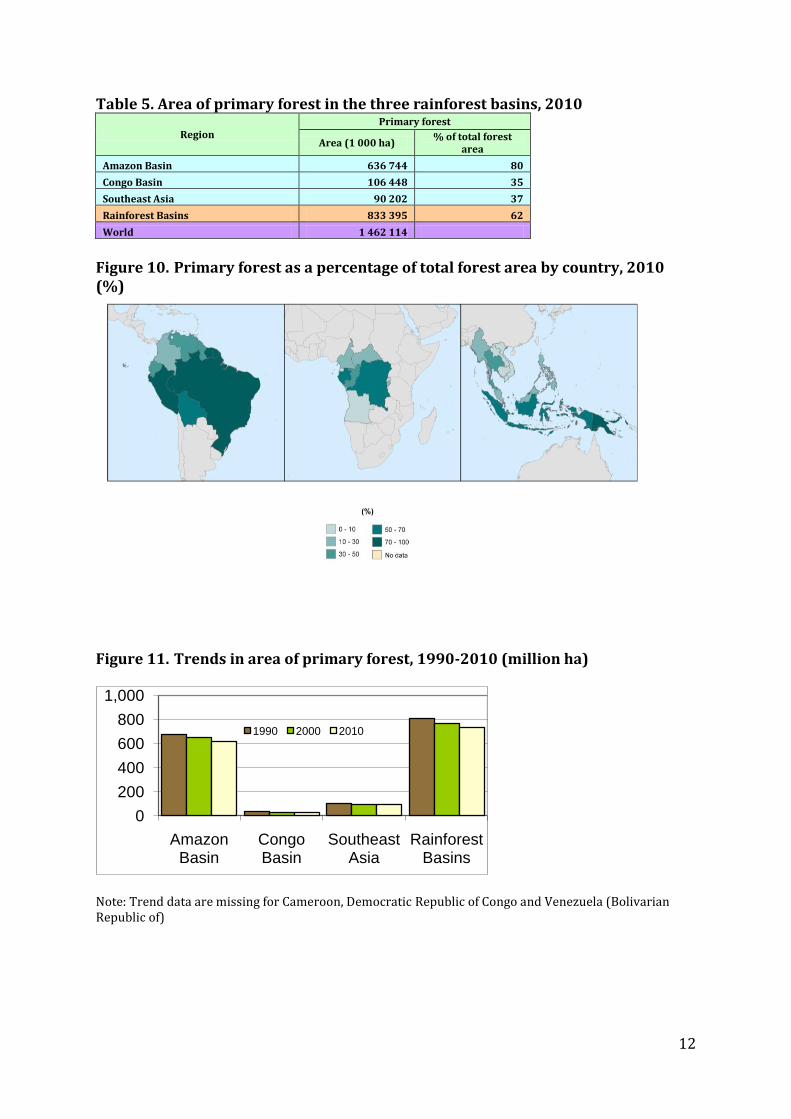
Table 5. Area of primary forest in the three rainforest basins, 2010
Region Primary forest
Area (1 000 ha) % of total forest
area
Amazon Basin 636 744 80
Congo Basin 106 448 35
Southeast Asia 90 202 37
Rainforest Basins 833 395 62
World 1 462 114
Figure 10. Primary forest as a percentage of total forest area by country, 2010 (%)
Figure 11. Trends in area of primary forest, 1990-2010 (million ha)
Note: Trend data are missing for Cameroon, Democratic Republic of Congo and Venezuela (Bolivarian Republic of)
0
200
400
600
800
1,000
Amazon Basin
Congo Basin
Southeast Asia
Rainforest Basins
1990 2000 2010

13
The area of planted forest is increasing, but it still only accounts for 2 percent of the total forest area Forests and trees are planted for many purposes and make up an estimated 1.9 percent of the total forest area in the three rainforest basins, or 24 million hectares. The total area of planted forests is largest in Southeast Asia, where it accounts for 6 percent of the total forest area and smallest in the Congo Basin, where only 0.3 percent of the total forest area is established through planting. Between 2000 and 2010, the area of planted forest increased by over half a million hectares per year on average, almost all of it in the Amazon Basin and Southeast Asia. Table 6. Area of planted forests in the three rainforest basins, 2010
Region Planted forest
Area
(1 000 ha) % of total forest
area
Amazon Basin 9 017 1.2
Congo Basin 820 0.3
Southeast Asia 14 576 6.0
Rainforest Basins 24 412 1.9
World 264 084 6.6
Figure 12. Trends in area of planted forests, 1990–2010 (million ha)
Growing stock and carbon stocks
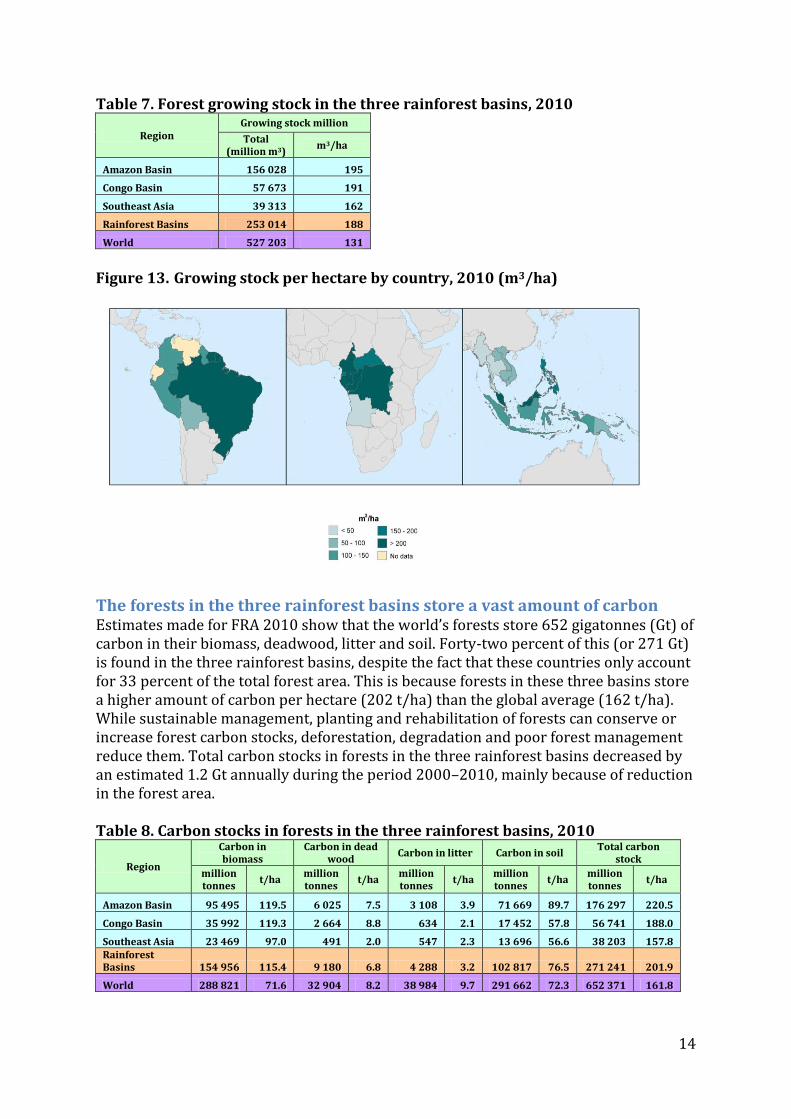
The forests in the three rainforest basins contain 47 percent of the global growing stock The total growing stock of forests in the three basins is estimated at more than 250 billion cubic metres, equivalent to an average of 188 m3/ha. However, there is a large variation between countries, with reported national average ranging from around 40 m3/ha in Angola and Thailand to 350 m3/ha in French Guiana, with eight countries reporting a national average of more than 200 m3/ha.
0.0
5.0
10.0
15.0
20.0
25.0
30.0
Amazon Basin
Congo Basin Southeast Asia
Rainforest Basins
1990 2000 2010
14
Table 7. Forest growing stock in the three rainforest basins, 2010
Region Growing stock million
Total (million m3)
m3/ha
Amazon Basin 156 028 195
Congo Basin 57 673 191
Southeast Asia 39 313 162
Rainforest Basins 253 014 188
World 527 203 131
Figure 13. Growing stock per hectare by country, 2010 (m3/ha)
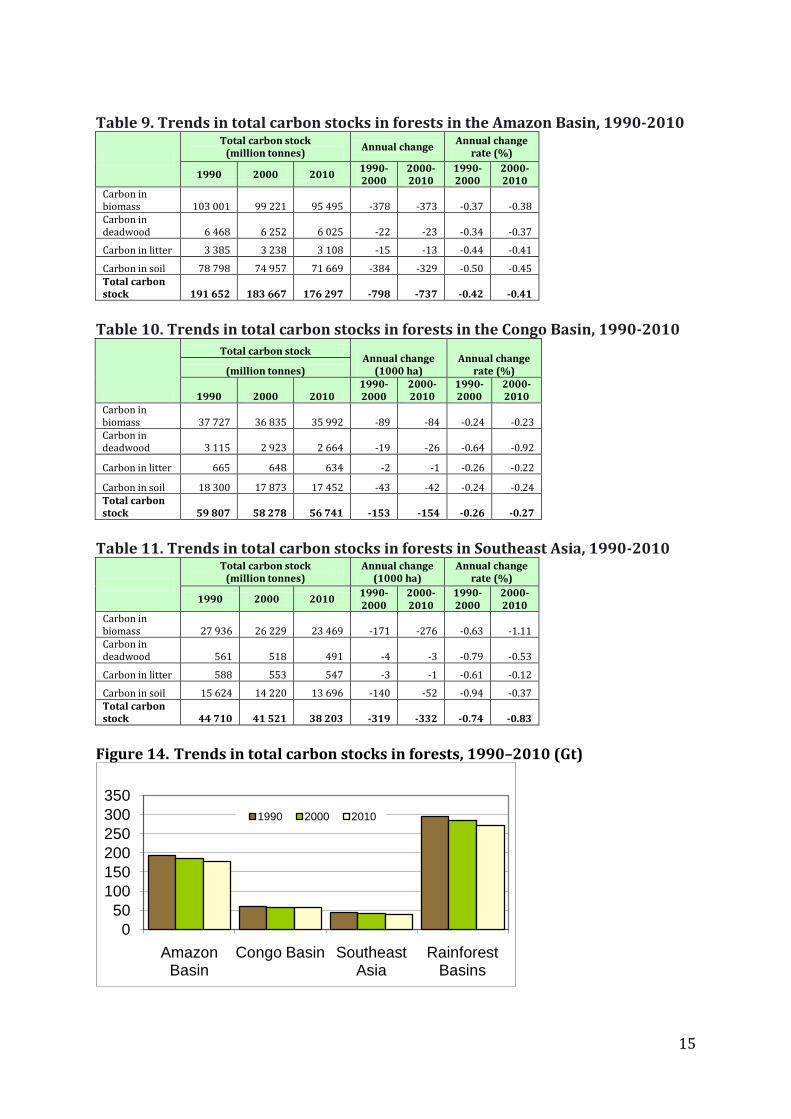
The forests in the three rainforest basins store a vast amount of carbon Estimates made for FRA 2010 show that the world’s forests store 652 gigatonnes (Gt) of carbon in their biomass, deadwood, litter and soil. Forty-two percent of this (or 271 Gt) is found in the three rainforest basins, despite the fact that these countries only account for 33 percent of the total forest area. This is because forests in these three basins store a higher amount of carbon per hectare (202 t/ha) than the global average (162 t/ha). While sustainable management, planting and rehabilitation of forests can conserve or increase forest carbon stocks, deforestation, degradation and poor forest management reduce them. Total carbon stocks in forests in the three rainforest basins decreased by an estimated 1.2 Gt annually during the period 2000–2010, mainly because of reduction in the forest area. Table 8. Carbon stocks in forests in the three rainforest basins, 2010
Region
Carbon in biomass
Carbon in dead wood
Carbon in litter Carbon in soil Total carbon
stock
million tonnes
t/ha million tonnes
t/ha million tonnes
t/ha million tonnes
t/ha million tonnes
t/ha
Amazon Basin 95 495 119.5 6 025 7.5 3 108 3.9 71 669 89.7 176 297 220.5
Congo Basin 35 992 119.3 2 664 8.8 634 2.1 17 452 57.8 56 741 188.0
Southeast Asia 23 469 97.0 491 2.0 547 2.3 13 696 56.6 38 203 157.8 Rainforest Basins 154 956 115.4 9 180 6.8 4 288 3.2 102 817 76.5 271 241 201.9
World 288 821 71.6 32 904 8.2 38 984 9.7 291 662 72.3 652 371 161.8
15
Table 9. Trends in total carbon stocks in forests in the Amazon Basin, 1990-2010
Total carbon stock (million tonnes)
Annual change Annual change
rate (%)
1990 2000 2010 1990-2000
2000-2010
1990-2000
2000-2010
Carbon in biomass 103 001 99 221 95 495 -378 -373 -0.37 -0.38 Carbon in deadwood 6 468 6 252 6 025 -22 -23 -0.34 -0.37
Carbon in litter 3 385 3 238 3 108 -15 -13 -0.44 -0.41
Carbon in soil 78 798 74 957 71 669 -384 -329 -0.50 -0.45 Total carbon stock 191 652 183 667 176 297 -798 -737 -0.42 -0.41
Table 10. Trends in total carbon stocks in forests in the Congo Basin, 1990-2010
Total carbon stock Annual change
(1000 ha) Annual change
rate (%) (million tonnes)
1990 2000 2010 1990-2000
2000-2010
1990-2000
2000-2010
Carbon in biomass 37 727 36 835 35 992 -89 -84 -0.24 -0.23 Carbon in deadwood 3 115 2 923 2 664 -19 -26 -0.64 -0.92
Carbon in litter 665 648 634 -2 -1 -0.26 -0.22
Carbon in soil 18 300 17 873 17 452 -43 -42 -0.24 -0.24 Total carbon stock 59 807 58 278 56 741 -153 -154 -0.26 -0.27
Table 11. Trends in total carbon stocks in forests in Southeast Asia, 1990-2010
Total carbon stock (million tonnes)
Annual change (1000 ha)
Annual change rate (%)
1990 2000 2010 1990-2000
2000-2010
1990-2000
2000-2010
Carbon in biomass 27 936 26 229 23 469 -171 -276 -0.63 -1.11 Carbon in deadwood 561 518 491 -4 -3 -0.79 -0.53
Carbon in litter 588 553 547 -3 -1 -0.61 -0.12
Carbon in soil 15 624 14 220 13 696 -140 -52 -0.94 -0.37 Total carbon stock 44 710 41 521 38 203 -319 -332 -0.74 -0.83
Figure 14. Trends in total carbon stocks in forests, 1990–2010 (Gt)
0
50
100
150
200
250
300
350
Amazon Basin
Congo Basin Southeast Asia
Rainforest Basins
1990 2000 2010
16
Ownership and management rights
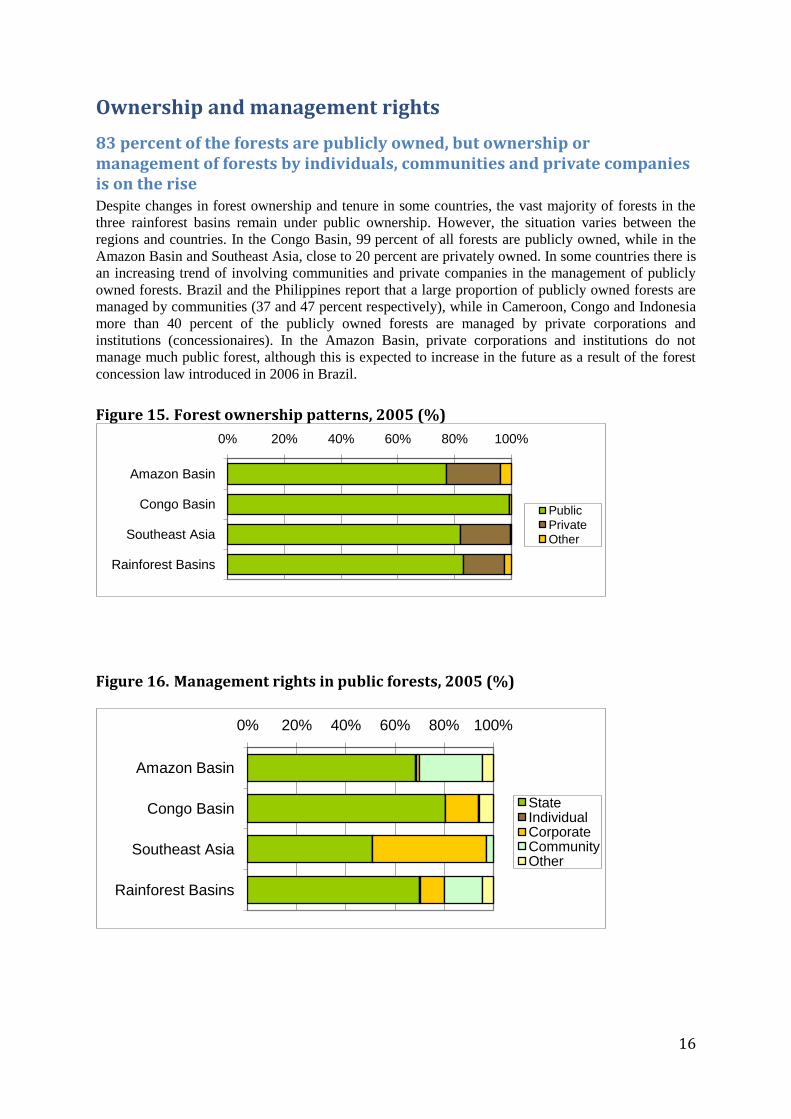
83 percent of the forests are publicly owned, but ownership or management of forests by individuals, communities and private companies is on the rise Despite changes in forest ownership and tenure in some countries, the vast majority of forests in the
three rainforest basins remain under public ownership. However, the situation varies between the
regions and countries. In the Congo Basin, 99 percent of all forests are publicly owned, while in the
Amazon Basin and Southeast Asia, close to 20 percent are privately owned. In some countries there is
an increasing trend of involving communities and private companies in the management of publicly
owned forests. Brazil and the Philippines report that a large proportion of publicly owned forests are
managed by communities (37 and 47 percent respectively), while in Cameroon, Congo and Indonesia
more than 40 percent of the publicly owned forests are managed by private corporations and
institutions (concessionaires). In the Amazon Basin, private corporations and institutions do not
manage much public forest, although this is expected to increase in the future as a result of the forest
concession law introduced in 2006 in Brazil.
Figure 15. Forest ownership patterns, 2005 (%)
Figure 16. Management rights in public forests, 2005 (%)
0% 20% 40% 60% 80% 100%
Amazon Basin
Congo Basin
Southeast Asia
Rainforest Basins
Public
Private
Other
0% 20% 40% 60% 80% 100%
Amazon Basin
Congo Basin
Southeast Asia
Rainforest Basins
StateIndividualCorporateCommunityOther
17
Designated functions of forests
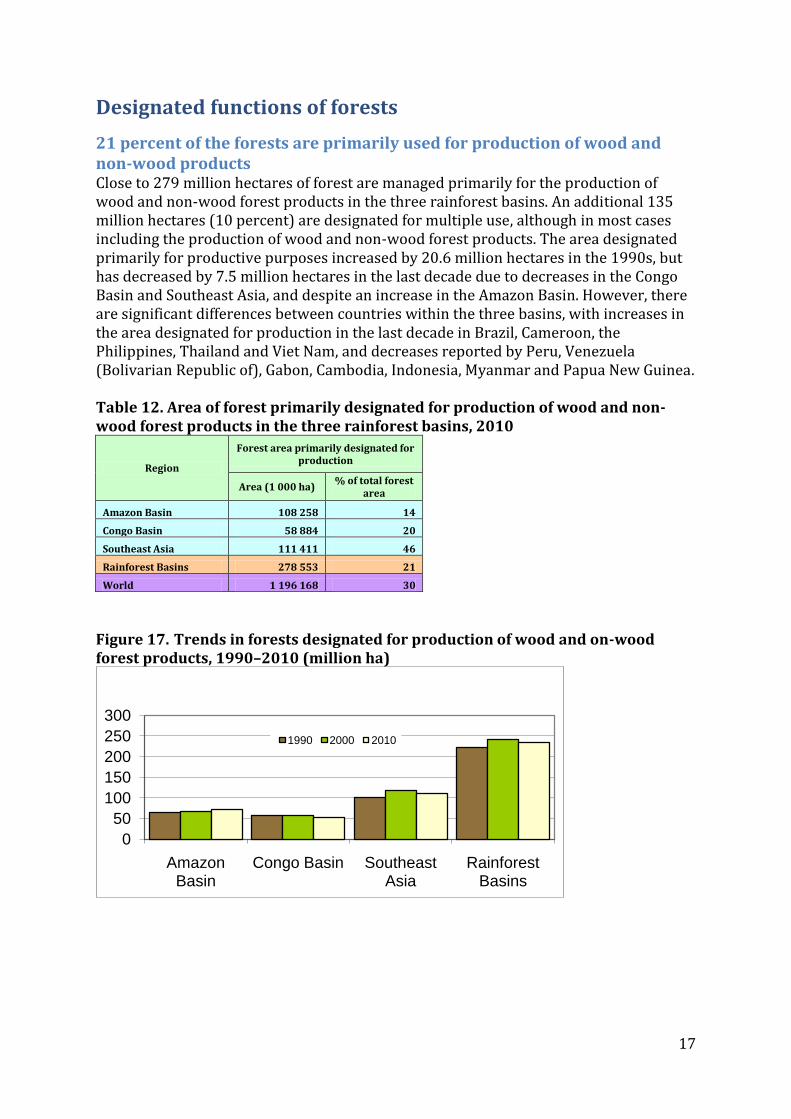
21 percent of the forests are primarily used for production of wood and non-wood products Close to 279 million hectares of forest are managed primarily for the production of wood and non-wood forest products in the three rainforest basins. An additional 135 million hectares (10 percent) are designated for multiple use, although in most cases including the production of wood and non-wood forest products. The area designated primarily for productive purposes increased by 20.6 million hectares in the 1990s, but has decreased by 7.5 million hectares in the last decade due to decreases in the Congo Basin and Southeast Asia, and despite an increase in the Amazon Basin. However, there are significant differences between countries within the three basins, with increases in the area designated for production in the last decade in Brazil, Cameroon, the Philippines, Thailand and Viet Nam, and decreases reported by Peru, Venezuela (Bolivarian Republic of), Gabon, Cambodia, Indonesia, Myanmar and Papua New Guinea. Table 12. Area of forest primarily designated for production of wood and non-wood forest products in the three rainforest basins, 2010
Region
Forest area primarily designated for production
Area (1 000 ha) % of total forest
area
Amazon Basin 108 258 14
Congo Basin 58 884 20
Southeast Asia 111 411 46
Rainforest Basins 278 553 21
World 1 196 168 30
Figure 17. Trends in forests designated for production of wood and on-wood forest products, 1990–2010 (million ha)
0
50
100
150
200
250
300
Amazon Basin
Congo Basin Southeast Asia
Rainforest Basins
1990 2000 2010
18
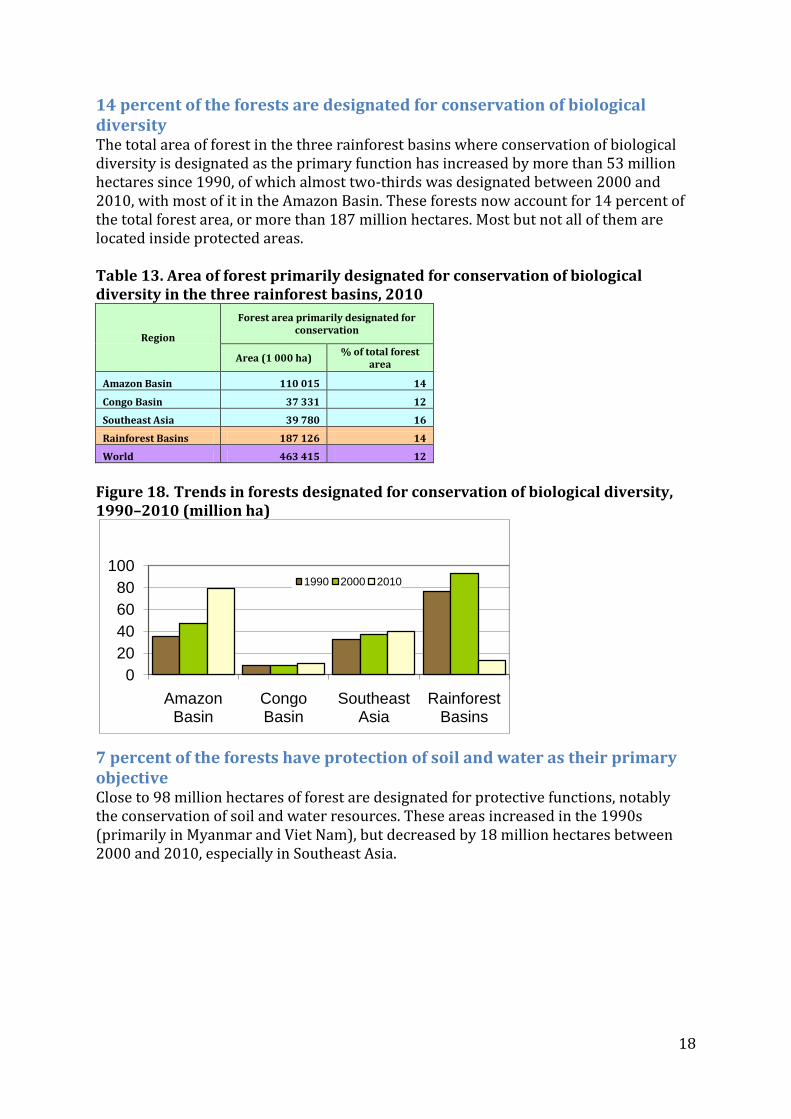
14 percent of the forests are designated for conservation of biological diversity The total area of forest in the three rainforest basins where conservation of biological diversity is designated as the primary function has increased by more than 53 million hectares since 1990, of which almost two-thirds was designated between 2000 and 2010, with most of it in the Amazon Basin. These forests now account for 14 percent of the total forest area, or more than 187 million hectares. Most but not all of them are located inside protected areas. Table 13. Area of forest primarily designated for conservation of biological diversity in the three rainforest basins, 2010
Region
Forest area primarily designated for conservation
Area (1 000 ha) % of total forest
area
Amazon Basin 110 015 14
Congo Basin 37 331 12
Southeast Asia 39 780 16
Rainforest Basins 187 126 14
World 463 415 12
Figure 18. Trends in forests designated for conservation of biological diversity, 1990–2010 (million ha)
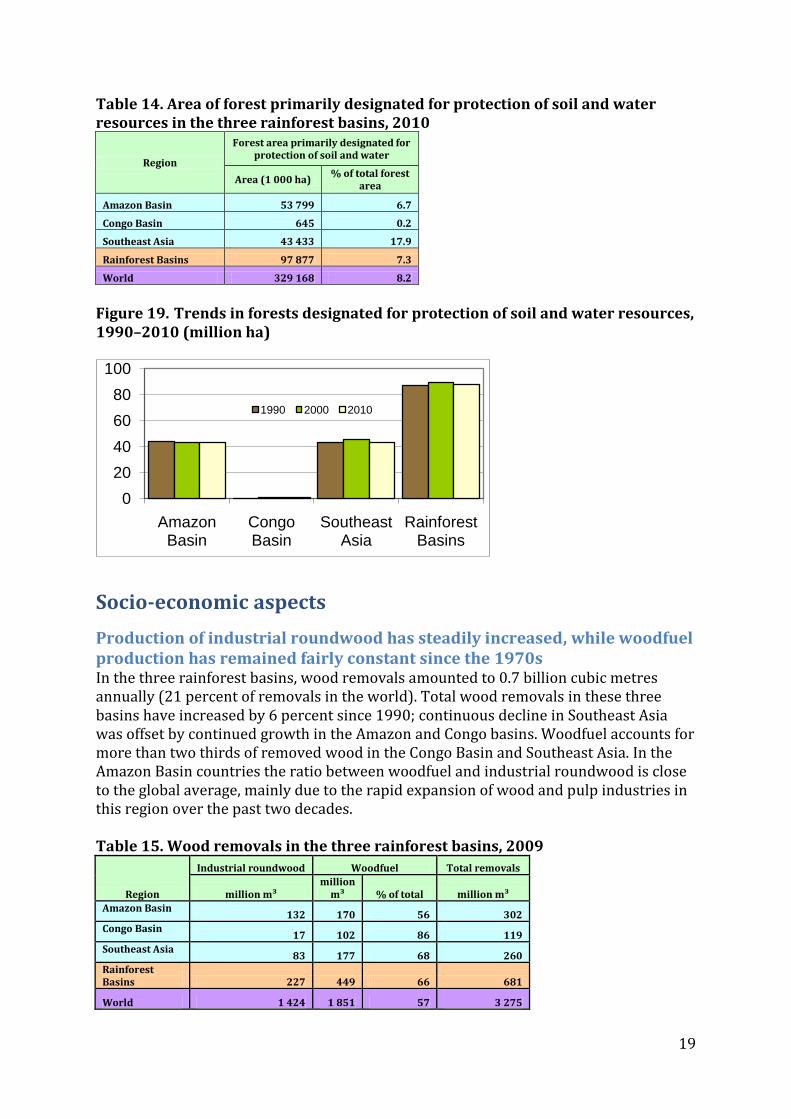
7 percent of the forests have protection of soil and water as their primary objective Close to 98 million hectares of forest are designated for protective functions, notably the conservation of soil and water resources. These areas increased in the 1990s (primarily in Myanmar and Viet Nam), but decreased by 18 million hectares between 2000 and 2010, especially in Southeast Asia.
0
20
40
60
80
100
Amazon Basin
Congo Basin
Southeast Asia
Rainforest Basins
1990 2000 2010
19
Table 14. Area of forest primarily designated for protection of soil and water resources in the three rainforest basins, 2010
Region
Forest area primarily designated for protection of soil and water
Area (1 000 ha) % of total forest
area
Amazon Basin 53 799 6.7
Congo Basin 645 0.2
Southeast Asia 43 433 17.9
Rainforest Basins 97 877 7.3
World 329 168 8.2
Figure 19. Trends in forests designated for protection of soil and water resources, 1990–2010 (million ha)
Socio-economic aspects
Production of industrial roundwood has steadily increased, while woodfuel production has remained fairly constant since the 1970s In the three rainforest basins, wood removals amounted to 0.7 billion cubic metres annually (21 percent of removals in the world). Total wood removals in these three basins have increased by 6 percent since 1990; continuous decline in Southeast Asia was offset by continued growth in the Amazon and Congo basins. Woodfuel accounts for more than two thirds of removed wood in the Congo Basin and Southeast Asia. In the Amazon Basin countries the ratio between woodfuel and industrial roundwood is close to the global average, mainly due to the rapid expansion of wood and pulp industries in this region over the past two decades. Table 15. Wood removals in the three rainforest basins, 2009
Region
Industrial roundwood Woodfuel Total removals
million m³ million
m³ % of total million m³
Amazon Basin 132 170 56 302
Congo Basin 17 102 86 119
Southeast Asia 83 177 68 260
Rainforest Basins 227 449 66 681
World 1 424 1 851 57 3 275
0
20
40
60
80
100
Amazon Basin
Congo Basin
Southeast Asia
Rainforest Basins
1990 2000 2010
20
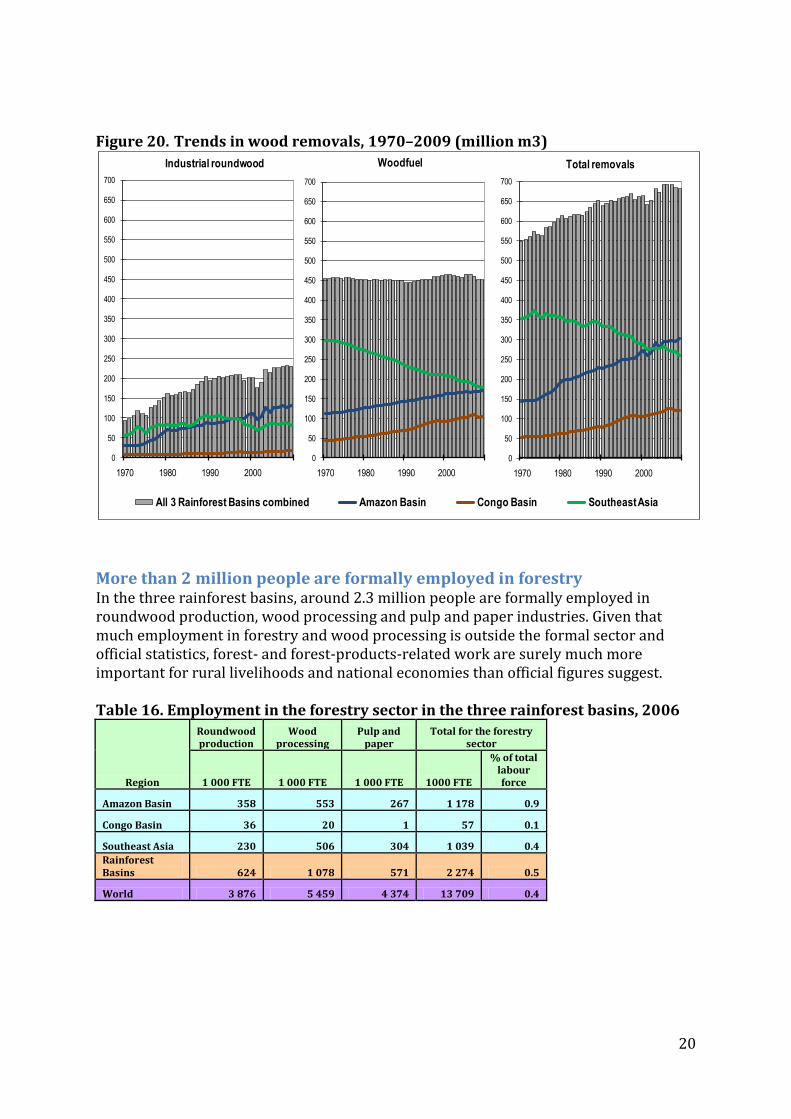
Figure 20. Trends in wood removals, 1970–2009 (million m3)
More than 2 million people are formally employed in forestry In the three rainforest basins, around 2.3 million people are formally employed in roundwood production, wood processing and pulp and paper industries. Given that much employment in forestry and wood processing is outside the formal sector and official statistics, forest- and forest-products-related work are surely much more important for rural livelihoods and national economies than official figures suggest. Table 16. Employment in the forestry sector in the three rainforest basins, 2006
Region
Roundwood production
Wood processing
Pulp and paper
Total for the forestry sector
1 000 FTE 1 000 FTE 1 000 FTE 1000 FTE
% of total labour force
Amazon Basin 358 553 267 1 178 0.9
Congo Basin 36 20 1 57 0.1
Southeast Asia 230 506 304 1 039 0.4
Rainforest Basins 624 1 078 571 2 274 0.5
World 3 876 5 459 4 374 13 709 0.4
0
50
100
150
200
250
300
350
400
450
500
550
600
650
700
1970 1980 1990 2000
All 3 Rainforest Basins combined Amazon Basin Congo Basin Southeast Asia
Industrial roundwood
0
50
100
150
200
250
300
350
400
450
500
550
600
650
700
1970 1980 1990 2000
Woodfuel
0
50
100
150
200
250
300
350
400
450
500
550
600
650
700
1970 1980 1990 2000
Total removals
21
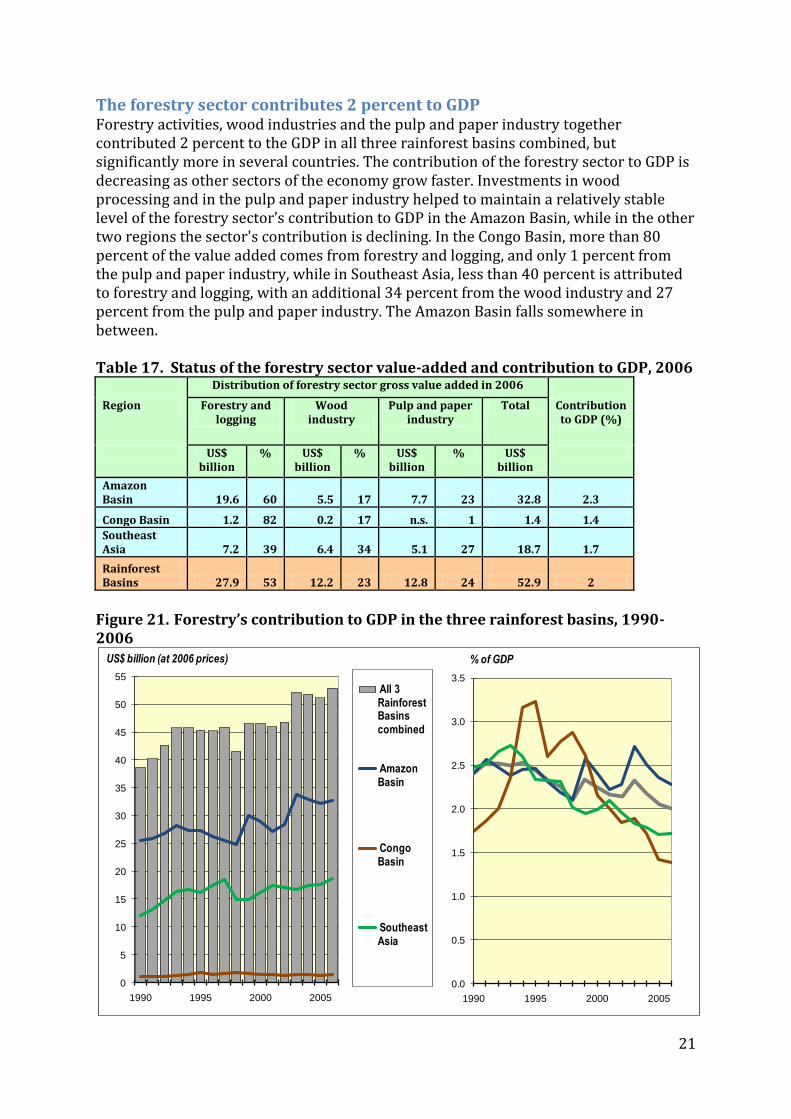
The forestry sector contributes 2 percent to GDP Forestry activities, wood industries and the pulp and paper industry together contributed 2 percent to the GDP in all three rainforest basins combined, but significantly more in several countries. The contribution of the forestry sector to GDP is decreasing as other sectors of the economy grow faster. Investments in wood processing and in the pulp and paper industry helped to maintain a relatively stable level of the forestry sector’s contribution to GDP in the Amazon Basin, while in the other two regions the sector's contribution is declining. In the Congo Basin, more than 80 percent of the value added comes from forestry and logging, and only 1 percent from the pulp and paper industry, while in Southeast Asia, less than 40 percent is attributed to forestry and logging, with an additional 34 percent from the wood industry and 27 percent from the pulp and paper industry. The Amazon Basin falls somewhere in between. Table 17. Status of the forestry sector value-added and contribution to GDP, 2006
Distribution of forestry sector gross value added in 2006
Region Forestry and logging
Wood industry
Pulp and paper industry
Total Contribution to GDP (%)
US$ billion
% US$ billion
% US$ billion
% US$ billion
Amazon Basin 19.6 60 5.5 17 7.7 23 32.8 2.3
Congo Basin 1.2 82 0.2 17 n.s. 1 1.4 1.4
Southeast Asia 7.2 39 6.4 34 5.1 27 18.7 1.7
Rainforest Basins 27.9 53 12.2 23 12.8 24 52.9 2
Figure 21. Forestry’s contribution to GDP in the three rainforest basins, 1990-2006
0
5
10
15
20
25
30
35
40
45
50
55
1990 1995 2000 2005
All 3 Rainforest Basins combined
Amazon Basin
Congo Basin
Southeast Asia
US$ billion (at 2006 prices)
0.0
0.5
1.0
1.5
2.0
2.5
3.0
3.5
1990 1995 2000 2005
% of GDP
22
Laws and policies
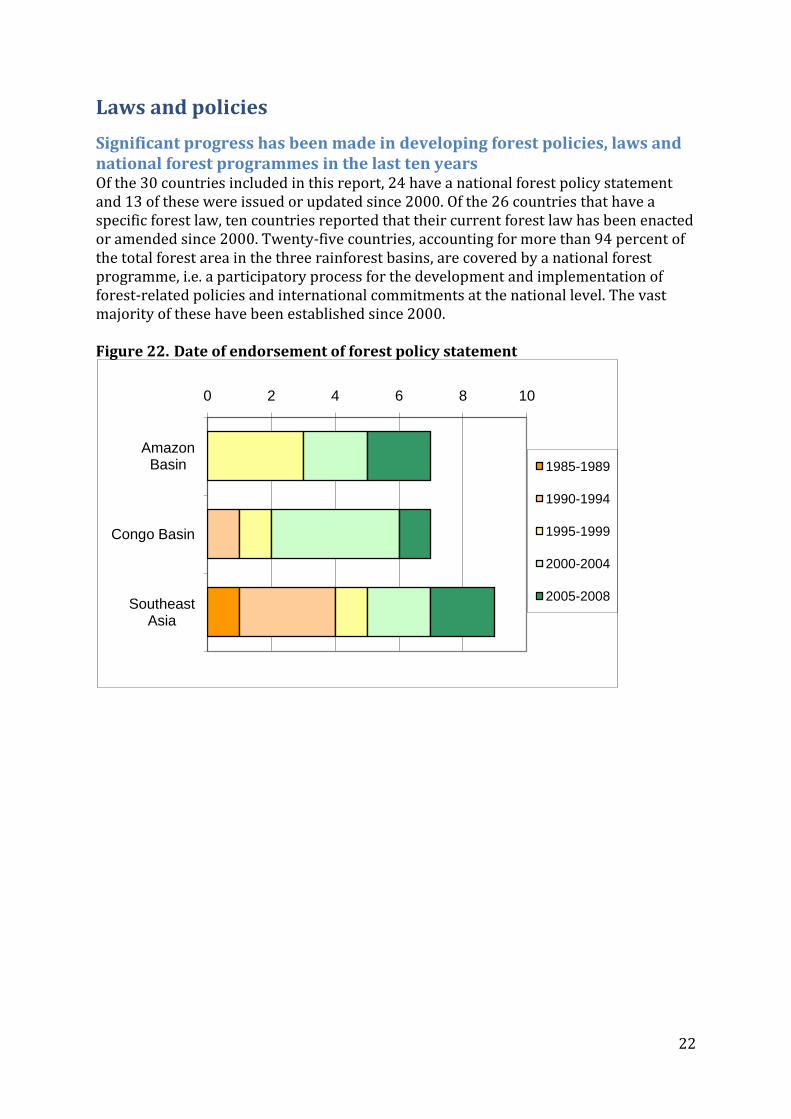
Significant progress has been made in developing forest policies, laws and national forest programmes in the last ten years Of the 30 countries included in this report, 24 have a national forest policy statement and 13 of these were issued or updated since 2000. Of the 26 countries that have a specific forest law, ten countries reported that their current forest law has been enacted or amended since 2000. Twenty-five countries, accounting for more than 94 percent of the total forest area in the three rainforest basins, are covered by a national forest programme, i.e. a participatory process for the development and implementation of forest-related policies and international commitments at the national level. The vast majority of these have been established since 2000. Figure 22. Date of endorsement of forest policy statement
0 2 4 6 8 10
Amazon Basin
Congo Basin
Southeast Asia
1985-1989
1990-1994
1995-1999
2000-2004
2005-2008
23
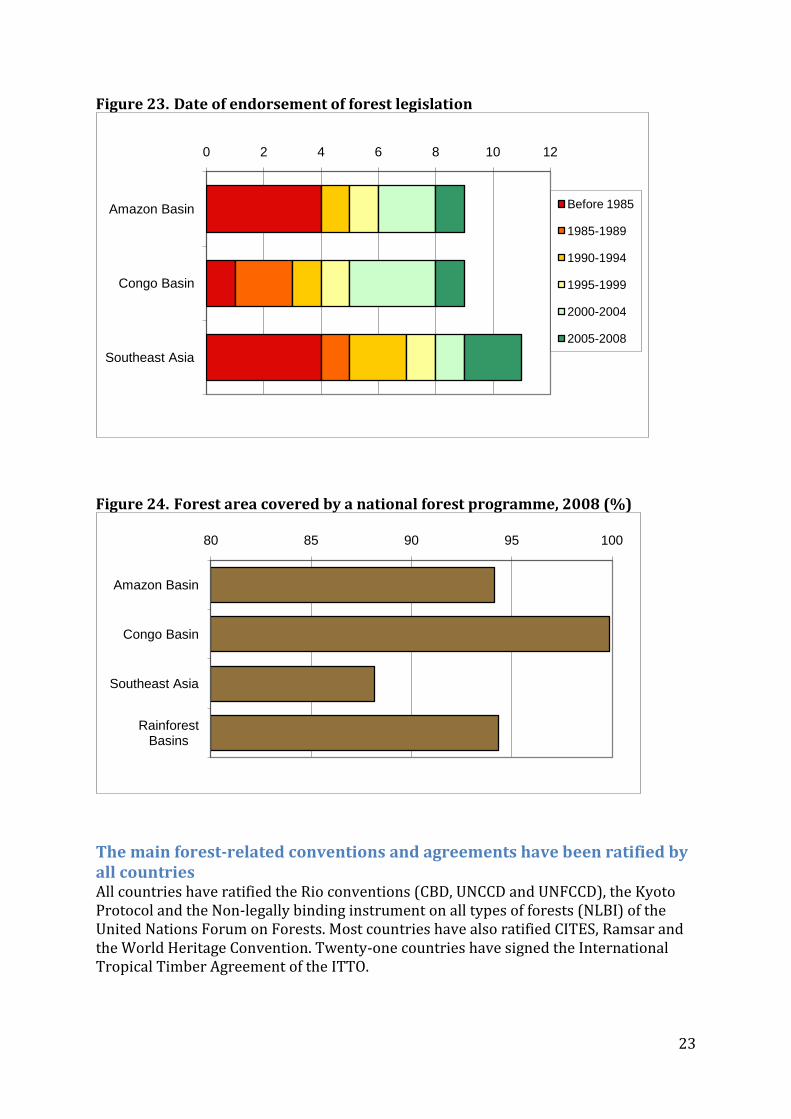
Figure 23. Date of endorsement of forest legislation
Figure 24. Forest area covered by a national forest programme, 2008 (%)
The main forest-related conventions and agreements have been ratified by all countries All countries have ratified the Rio conventions (CBD, UNCCD and UNFCCD), the Kyoto Protocol and the Non-legally binding instrument on all types of forests (NLBI) of the United Nations Forum on Forests. Most countries have also ratified CITES, Ramsar and the World Heritage Convention. Twenty-one countries have signed the International Tropical Timber Agreement of the ITTO.
0 2 4 6 8 10 12
Amazon Basin
Congo Basin
Southeast Asia
Before 1985
1985-1989
1990-1994
1995-1999
2000-2004
2005-2008
80 85 90 95 100
Amazon Basin
Congo Basin
Southeast Asia
Rainforest Basins
24
Status of forest management
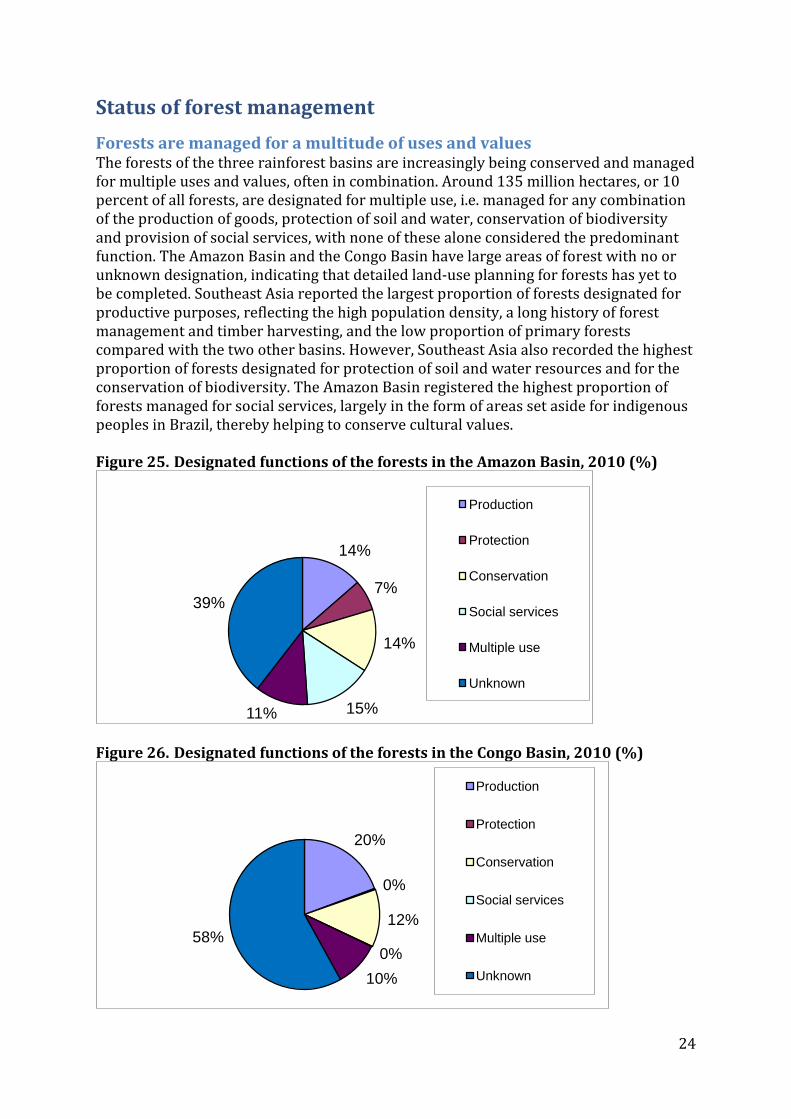
Forests are managed for a multitude of uses and values The forests of the three rainforest basins are increasingly being conserved and managed for multiple uses and values, often in combination. Around 135 million hectares, or 10 percent of all forests, are designated for multiple use, i.e. managed for any combination of the production of goods, protection of soil and water, conservation of biodiversity and provision of social services, with none of these alone considered the predominant function. The Amazon Basin and the Congo Basin have large areas of forest with no or unknown designation, indicating that detailed land-use planning for forests has yet to be completed. Southeast Asia reported the largest proportion of forests designated for productive purposes, reflecting the high population density, a long history of forest management and timber harvesting, and the low proportion of primary forests compared with the two other basins. However, Southeast Asia also recorded the highest proportion of forests designated for protection of soil and water resources and for the conservation of biodiversity. The Amazon Basin registered the highest proportion of forests managed for social services, largely in the form of areas set aside for indigenous peoples in Brazil, thereby helping to conserve cultural values. Figure 25. Designated functions of the forests in the Amazon Basin, 2010 (%)
Figure 26. Designated functions of the forests in the Congo Basin, 2010 (%)
14%
7%
14%
15%11%
39%
Production
Protection
Conservation
Social services
Multiple use
Unknown
20%
0%
12%
0%
10%
58%
Production
Protection
Conservation
Social services
Multiple use
Unknown
25
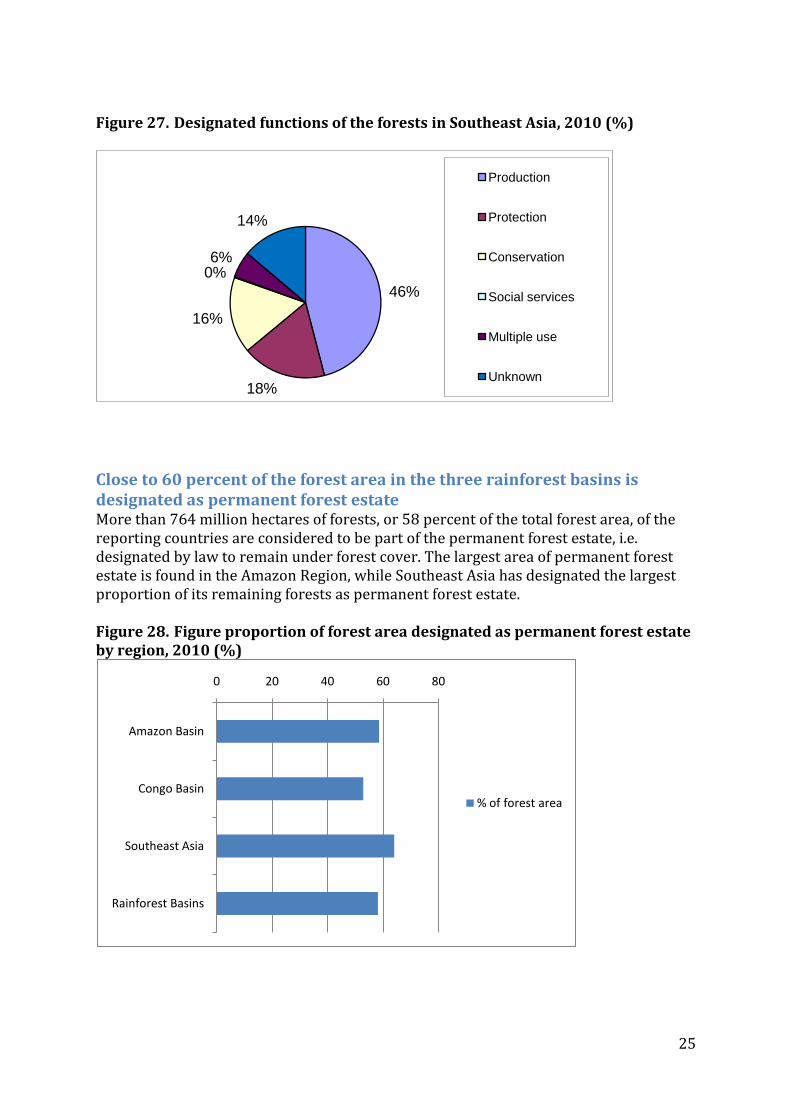
Figure 27. Designated functions of the forests in Southeast Asia, 2010 (%)
Close to 60 percent of the forest area in the three rainforest basins is designated as permanent forest estate More than 764 million hectares of forests, or 58 percent of the total forest area, of the reporting countries are considered to be part of the permanent forest estate, i.e. designated by law to remain under forest cover. The largest area of permanent forest estate is found in the Amazon Region, while Southeast Asia has designated the largest proportion of its remaining forests as permanent forest estate. Figure 28. Figure proportion of forest area designated as permanent forest estate by region, 2010 (%)
46%
18%
16%
0%6%
14%
Production
Protection
Conservation
Social services
Multiple use
Unknown
0 20 40 60 80
Amazon Basin
Congo Basin
Southeast Asia
Rainforest Basins
% of forest area
26
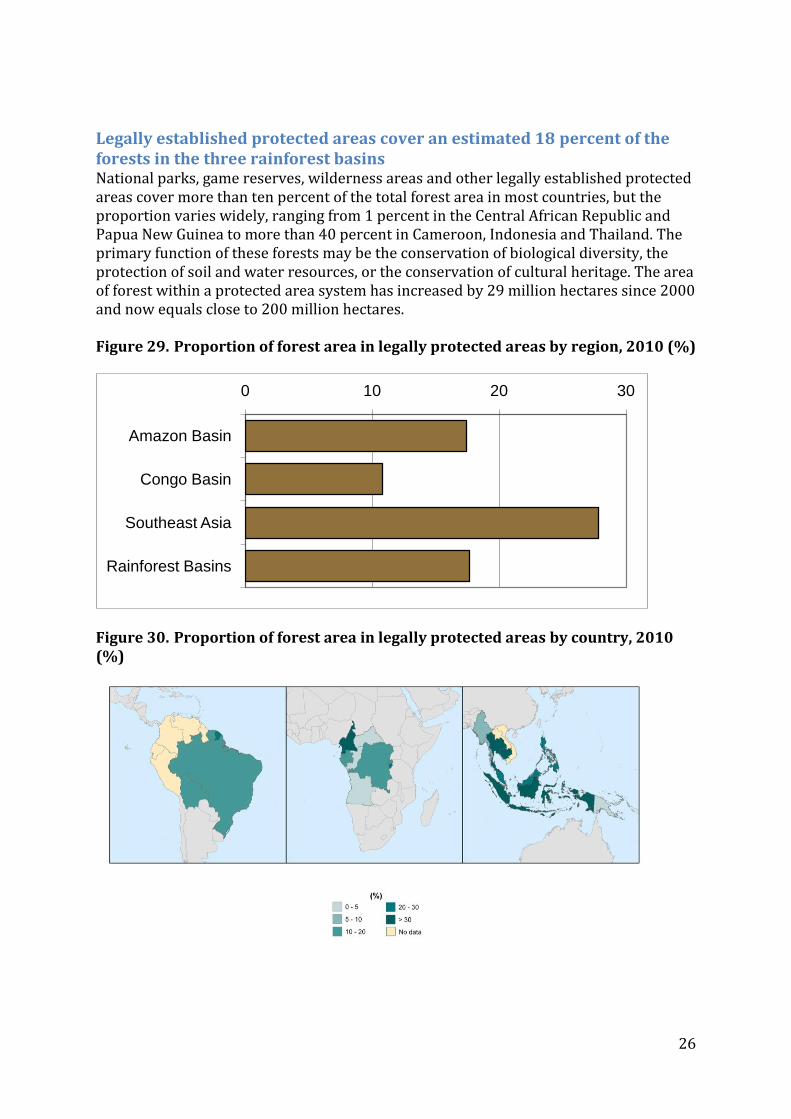
Legally established protected areas cover an estimated 18 percent of the forests in the three rainforest basins National parks, game reserves, wilderness areas and other legally established protected areas cover more than ten percent of the total forest area in most countries, but the proportion varies widely, ranging from 1 percent in the Central African Republic and Papua New Guinea to more than 40 percent in Cameroon, Indonesia and Thailand. The primary function of these forests may be the conservation of biological diversity, the protection of soil and water resources, or the conservation of cultural heritage. The area of forest within a protected area system has increased by 29 million hectares since 2000 and now equals close to 200 million hectares. Figure 29. Proportion of forest area in legally protected areas by region, 2010 (%)
Figure 30. Proportion of forest area in legally protected areas by country, 2010 (%)
0 10 20 30
Amazon Basin
Congo Basin
Southeast Asia
Rainforest Basins
27
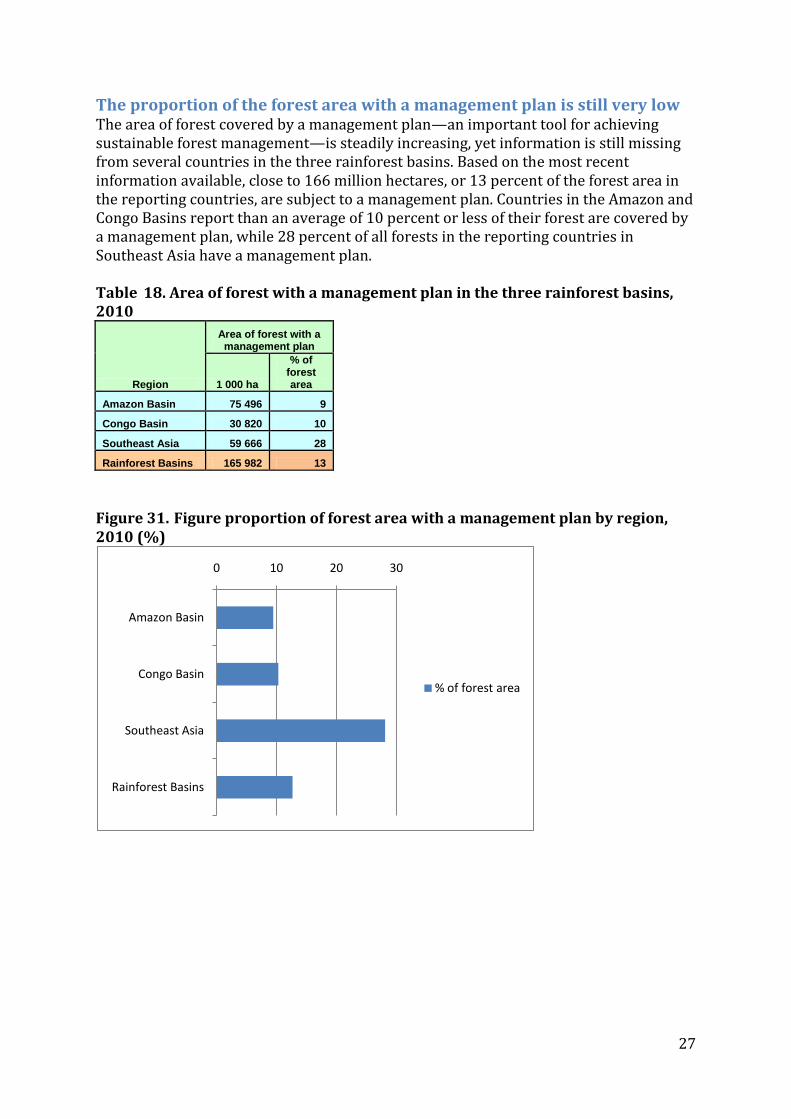
The proportion of the forest area with a management plan is still very low The area of forest covered by a management plan—an important tool for achieving sustainable forest management—is steadily increasing, yet information is still missing from several countries in the three rainforest basins. Based on the most recent information available, close to 166 million hectares, or 13 percent of the forest area in the reporting countries, are subject to a management plan. Countries in the Amazon and Congo Basins report than an average of 10 percent or less of their forest are covered by a management plan, while 28 percent of all forests in the reporting countries in Southeast Asia have a management plan. Table 18. Area of forest with a management plan in the three rainforest basins, 2010
Region
Area of forest with a management plan
1 000 ha
% of forest area
Amazon Basin 75 496 9
Congo Basin 30 820 10
Southeast Asia 59 666 28
Rainforest Basins 165 982 13
Figure 31. Figure proportion of forest area with a management plan by region, 2010 (%)
0 10 20 30
Amazon Basin
Congo Basin
Southeast Asia
Rainforest Basins
% of forest area
28
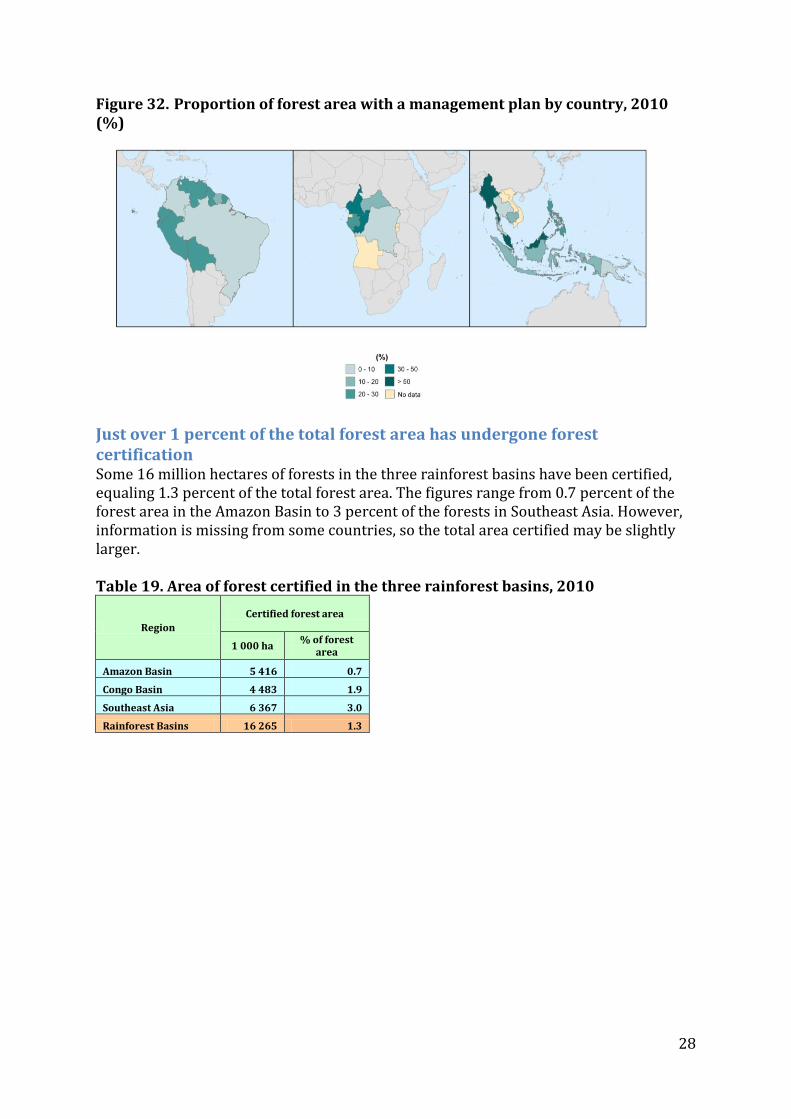
Figure 32. Proportion of forest area with a management plan by country, 2010 (%)
Just over 1 percent of the total forest area has undergone forest certification Some 16 million hectares of forests in the three rainforest basins have been certified, equaling 1.3 percent of the total forest area. The figures range from 0.7 percent of the forest area in the Amazon Basin to 3 percent of the forests in Southeast Asia. However, information is missing from some countries, so the total area certified may be slightly larger. Table 19. Area of forest certified in the three rainforest basins, 2010
Region
Certified forest area
1 000 ha % of forest
area
Amazon Basin 5 416 0.7
Congo Basin 4 483 1.9
Southeast Asia 6 367 3.0
Rainforest Basins 16 265 1.3

29
Only 3.5 percent of the total forest area is considered to be under sustainable management Based on information received from 23 of the 30 countries, less than 44 million hectares, or 3.5 percent of the total forest area in the reporting countries, are considered to fulfil all the criteria of sustainable forest management. The assessment criteria used were fairly strict2, but allowed for a comparison with a similar assessment in 2005, which indicated progress in most countries (ITTO, in press). Figure 33. Proportion of forest area under sustainable forest management by region, 2010 (%)
2 The assessment of the area of forest under sustainable forest management required that the forests included should fulfil at least one of the following conditions:
i. have been independently certified or in which progress towards certification is being made;
ii. have fully developed, long-term (ten years or more) forest management plans with firm information that these plans are being implemented effectively;
iii. are considered as model forest units in their country and information is available on the quality of management;
iv. are community-based forest management units with secure tenure for which the quality of management is known to be of high standard; or
v. are protected areas with secure boundaries and a management plan and that are generally considered in the country and by other observers to be well managed and are not under significant threat from destructive agents.
0.0 2.0 4.0 6.0 8.0
Amazon Basin
Congo Basin
Southeast Asia
Rainforest Basins
% of forest area
30
Challenges and opportunities in the three rainforest basins START BOX Box 2. REDD+ Readiness A country will have achieved REDD+ readiness when it is able to fulfil all of the REDD+ commitments set out by the UNFCCC. This will involve demonstrating sufficient capacity in four key areas:
technical (measurement and monitoring of the five REDD+ activities over time);
institutional (transparent and accountable government and other stakeholders who can enact and enforce laws, and clear land tenure);
social (multi-stakeholder participation in REDD+ activities, including indigenous and forest-dependent communities); and
economic (design and implementation of equitable REDD+ benefit sharing).
Achieving REDD+ readiness therefore requires substantial in-country consultation to ensure broad participation; international support to facilitate technical capacity building; and implementation of results-based demonstration (or pilot) activities to begin testing approaches and methodologies. A number of multilateral support programmes have been established to facilitate REDD+ readiness in developing countries. Two of the most prominent of these are the UN Collaborative Programme on REDD (UN-REDD Programme) and the World Bank’s Forest Carbon Partnership Facility (FCPF). Significant bilateral support has already been pledged and disbursed to this end, particularly through the Government of Norway’s Climate and Forest Initiative. In addition, many lessons are being learned from national initiatives and REDD+ projects established for the voluntary carbon market in developing countries, as well as through academic investigation of these activities. All of these outcomes can inform the development of national REDD+ action plans. The diversity of national socio-ecological conditions, circumstances and existing capacities means that countries will approach REDD+ readiness in unique ways, and arrive at different speeds, depending on existing capacities. Key challenges that have arisen during the creation of national REDD+ readiness programmes include, but are not limited to:
‘Translation’ of UNFCCC REDD+ decisions into national action plans (while taking into account national circumstances) that can be enacted on the ground;
Coordination and communication between different activities and funding sources to ensure complementarity;
Building long-lasting capacity to implement REDD+.
END BOX
31
Amazon Basin
Issues and challenges Deforestation and forest degradation Loss of forest cover, mainly primary forest, is still a major concern in the Amazon Basin. Expansion of the agricultural frontier and urbanization are two of the main causes. In parallel with the deforestation process, the degradation of forests, not yet accurately quantified, is a big challenge in the region. Most of the forest area is publicly owned. Forestry agencies have limited personnel and budgets to guarantee forestry laws enforcement and control of their forest areas. Encroachment on national forest areas for the extraction of woodfuel is a traditional practice, which still exists in rural areas and which, in many areas, results in the degradation of forests. Ownership and management rights Land tenure and land ownership rights are not clear in several of the Amazonian countries. This has implications for the long-term investment required for sustainable forestry practices. Lack of adequate information for decision makers Deforestation and forest degradation practices have implications for the social, economic and environmental sectors, but this has not been well documented and communicated to decision-makers. Forest goods and services data, including employment and subsistence practices, have not been collected in national accounting systems, leading to lack of visibility of the forestry sector in the productive chain of society and the development process of countries. Institutional aspects The number of forestry students is decreasing in the region. In addition, the role of foresters in society is not well known. Foresters and the forest industry are frequently perceived by the public as those causing deforestation rather than those promoting the sustainable use of forest resources. A revision of forester training needs to be undertaken and their image improved. Climate change The new challenge of climate change requires appropriate measures to optimize the role of forests in adaptation and mitigation strategies. These measures should include an assessment of the economic value of forest goods and services and protection of the local value of forests. Payment for environmental services The establishment of markets to adequately remunerate the environmental services provided by forests is a key element to strengthen the payment mechanism for services for the benefit of local, forest-dependent communities.
32
Progress and opportunities Progress towards sustainable forest management Sustainable forest management has been promoted in the region and significant progress made in recent years. More than the half of the forest area has an officially designated function. Central and local governments, together with forest-dependent communities, are working on the implementation of sustainable forest management plans, and legal logging is promoted in the region by facilitating operational and legal procedures. Biofuels The forest biofuel industry is increasing in the region. It is forecast that by 2030 it could compete with ethanol produced from sugar cane. Reforestation and forest restoration Forest plantations for timber production are increasing in the region and there is potential for further involvement of the private sector and private owners of land in the establishment of forest plantations. The enrichment of degraded natural forest using native species is now being promoted. Urban forestry is also increasing in the region.
Regional cooperation and agreements Amazon Cooperation Treaty Organization (ACTO) The Amazon Cooperation Treaty (ACT), signed on July 1978, is a legal instrument that recognizes the transboundary nature of the Amazon. With the approval of the Amazon Cooperation Treaty Organization (ACTO) Protocol of Amendment in 1995, ACTO was officially instituted as a mechanism responsible for enhancing and strengthening cooperation processes developed in the context of the Treaty. The main purpose of the ACT is to promote the harmonious development of the Amazon while integrating the countries' Amazonian territories into their respective national economies, an essential condition for reconciling economic growth with environmental conservation. The Tarapoto Process With an active role in the ACT, the Tarapoto process was established in 1995. It is a coordinated effort between countries to define a set of criteria and indicators for sustainable forest management that reflect the specific features of the region’s ecosystems as well as their social and cultural factors. The main purpose is to help achieve sustainable forest management and sustainable development. Latin American Technical Cooperation Network on Watershed Management (REDLACH) This network was created in 1980 to support river basin management and the promotion of sustainable development in Latin America and the Caribbean, facilitating the exchange of information and promoting technical cooperation between countries.
33
Latin American Technical Cooperation Network on National Parks, other Protected Areas and Wildlife (REDPARQUES) Created in 1983, REDPARQUES supports the management of forests in protected areas and conservation of wildlife. The aim is to more effectively share available technical knowledge and experience in the region. Latin American Network of Forest Education (RELAFOR) RELAFOR supports better teaching and education in forestry in the region. It links universities and educational institutions to increase knowledge and local capacities through the exchange of experiences, promotion of dialogue, dissemination of information and technical collaboration using existing technical and financial resources. Table 20. Indicative participation status of regional forestry-related institutions and agreements in the Amazon Basin
To come
Outlook Resources, their management and use The loss of primary forest will continue, but it will slow down, as capacity improves in management of protected areas and forest conservation areas. Communities and indigenous people will have a more active role on the management of the native forest area. Private sector land owners will invest in plantations as a result of incentives and market prices, and will be the main source of industrial production in the subregion. Fuelwood and charcoal production will continue as the main source of energy in the countryside. Bioenergy production and marketing is increasing, but not yet well developed. Non-wood forest products are recognized as a source of income for forest-dependent communities, and its quantification is a priority for forestry agencies. Forest industries are improving in their management and technical capacities. Marketing is improving in Europe and China. Institutional aspects Data and information needs are recognized as a priority in the region due to the REDD+ process and carbon markets. Brazil and Ecuador are initiating their national forestry inventories and stimulating a south-south collaboration to increase national capacities for assessment and monitoring of forest cover, carbon inventory, provision of environmental services and support to biodiversity conservation. There are formal limitations on interaction and collaboration between the private and public forestry sectors, with negative effects, especially on small forests owners and enterprises. Rules and regulations are not clear, and bureaucratic procedures are long and expensive, which together reinforce tendencies for illegal activity. Conflicts between forest sector and environmental agencies are increasing, and there is competition for financial resources coming from the carbon markets. Carbon ownership
34
and governance needs to be defined so that the roles and responsibilities of the national agencies are clear, specially the environmental agencies responsible for climate change and forestry. Specific priorities and strategies are required to improve the outlook for forestry. These include:
National forestry inventory, mapping and data collection are priorities for forestry management and monitoring. Good information will also facilitate access to markets for carbon and environmental services.
Green funds may play a fundamental role in sustainable forest management and protected areas, but the mechanism for this investment needs to be clarified. This should include support to small-scale forestry owners and forest-dependent people living close to protected areas.
Forestry education needs to be revised and updated to guarantee professional responses to new scenarios related to social, environmental and climate change issues.
Simplification of rules for investment in the forestry sector is needed, with legislative guarantees. This implies security in legislation, forestry financial mechanisms, plantation incentives, co-management in protected areas, and marketing facilities for small forestry enterprises.
Congo Basin
Issues and challenges Deforestation and forest degradation In the Congo Basin, the key issue is to find ways of reducing deforestation and forest degradation through means that are consistent with improving livelihoods for about 60 million local people directly depending on forests. Lack of coordination among sectors The current mode of governance is dominated by an intra-sectoral approach. It still lacks consistency between, on the one hand, forest policies and laws and, on the other hand, those of other sectors that have an impact on deforestation and forest degradation. In this context, impacts expected from actions taken to combat deforestation and forest degradation will not be attained, as the dominant drivers of deforestation are slash-and-burn agricultural expansion and illegal or unsustainable firewood extraction and charcoal production. It is clear that the drivers of deforestation in the Congo Basin are essentially economic and so cannot be controlled simply through intra-sectoral actions. Lack of adequate knowledge of the forest ecosystem Forest ecosystems are poorly known. The production and management of knowledge is a peripheral concern. This lack of knowledge, caused by insufficient and disparate research efforts, has negative impacts on forest management. The information needed to make decisions with certainty is often not available. Therefore, decisions in the forest sector are frequently based on incomplete information.
35
Better utilization and value of trees and forests products and services The economic and social potentials of the Congo Basin forests are still poorly valued. Priority is still given to logging activities at the expense of other goods and services. The value of non-wood forest products, for example, may be much greater than the value of logs. This point of view has recently been receiving increasing recognition and attention from decision-makers. It remains to translate this into concrete action with the aim of finding the best way to limit human pressure on forest resources and to combat deforestation and forest degradation.
Progress and opportunities Sustainable forest management For a decade, significant progress towards sustainable forest management has been made: 11 percent of the territory of the Congo Basin is classified as protected areas; around 10 million hectares of forest are considered to be under sustainable management; 4.5 million hectares of forest concessions have been certified; and the decline in populations of large charismatic wildlife species has been reversed in some landscapes identified as priority areas for biodiversity conservation. Contribution of the timber sector to economic development There is no doubt that the contribution of the timber sector to economic development in Congo Basin countries is very important. The sector’s contribution to GDP in 2006 was about 2 percent in Cameroon and the Democratic Republic of the Congo, 3 percent in Gabon and 11 percent in Central African Republic. In the last-named, timber exports contributed about 40 percent of national earnings each year. The timber sector is the second-largest employer in the national economy, after the state, in both Gabon and the Central African Republic. Forest policy development Five countries have already expressed their commitment to review their national forest policy in a participatory manner. The process is ongoing in Cameroon and the Democratic Republic of the Congo, and will start in the Republic of Congo, Gabon and the Central African Republic by the end of 2011. An inter-sectoral approach is used with a view to improving consistency of actions and integration between the forest sector and other sectors with potential impacts on trees and forests. National REDD strategy development The Congo Basin countries have been engaged in international negotiations to recognize and take into account the role of tropical forest in the fight against climate change. It is therefore envisaged that each country develop a national Reduced Emissions from Deforestation and Forest Degradation (REDD) strategy. The formulation of a national REDD strategy is a continuous process involving a series of consultations in order to seek consistency and synergy between stakeholders and sectors and to ensure maximum stakeholder engagement to attain consensual objectives in combating deforestation.
36
Regional cooperation and agreements A new spirit of collaboration was launched in 1999 when the Central African Heads of State met together for the first time in Yaoundé, Cameroon, to discuss the future of the Central African forest ecosystems. The basis for the current arrangements was therefore laid with the Yaoundé Declaration, through which the Heads of State recognized the protection of the Congo Basin ecosystems as an integral component of the development process and re-affirmed their commitment to work together to promote the sustainable use of the Congo Basin forest ecosystems. The learning process used in implementing the Yaoundé resolutions led to the establishment of a number of complementary institutions. Central African Forest Commission (COMIFAC) COMIFAC is the political and technical steering, coordinating, harmonizing and decision-making institution in the domain of the conservation and sustainable management of forest and savannah ecosystems in Central Africa. It was established in February 2005 through the ‘Treaty for the Conservation and Sustainable Management of Forest Ecosystems in Central Africa’, signed by ten African Heads of State attending the Second Summit, held in Brazzaville. This treaty gave legal recognition to COMIFAC and its Convergence Plan, with a common subregional intervention framework of member countries and their development partners. The ten strategic axes of the COMIFAC Convergence Plan are: (1) harmonization of forest policy and taxation; (2) resource knowledge; (3) ecosystem management; (4) biodiversity conservation; (5) sustainable use of forest resources; (6) strengthening of capacities, including stakeholder participation and alternative income generation; (7) capacity development and training; (8) research and development; (9) innovative financing mechanisms; and (10) cooperation and partnerships. COMIFAC works in close cooperation with other international, regional and subregional organizations and networks, particularly those below. Congo Basin Forest Partnership (CBFP) CBFP was launched at the World Summit on Sustainable Development in September 2002, in response to a call by the United Nations General Assembly in resolution 54/214 on February 2000 encouraging the international community to support the countries of the Congo Basin with financial and technical assistance in their efforts towards sustainable management of the forests. As a ‘type II’ partnership, CBFP is a non-binding network based on a voluntary agreement among governments, the private sector, civil society, and development organizations. CBFP members (about 60 in 2011) have agreed to harmonize their programmes for the effective implementation of the COMIFAC Convergence Plan. CBFP facilitation unit is provided by one of its partners for a two-year period, chosen on a voluntary basis. After the United States of America (2003–2004), France (2005–2007) and Germany (2008–2009), facilitation is now provided by Canada for the period 2010–2012. Congo Basin Forest Fund (CBFF) CBFF is a multi-donor fund set up to take early action to protect the forests in the Congo Basin. The Fund supports activities and projects that complement particular aspects of the COMIFAC Convergence Plan. CBFF was launched in June 2008 to support transformative and innovative proposals that will develop the capacity of the people and institutions of the Congo Basin to enable them to manage their forests; to help local
37
communities to find livelihoods that are consistent with the conservation of forests; and to reduce the rate of deforestation. It is initially being financed by a grant of GBP 100 million from the Governments of the UK and of Norway. The Secretariat of CBFF is hosted by the African Development Bank (AfDB). African Timber Organization (ATO) Created in 1976, ATO is an international cooperation and consultation body concerned with the forest economy and trade in timber. Its objective is to encourage its member states to coordinate their activities in these fields in order to enable them to benefit more from their forest products. Central African Agency for the development of environmental information (ADIE) ADIE aims to support environmental data gathering, analysis and assessment to enhance the decision-making process and the dissemination of information. Central African Wildlife Conservation (OCFSA) OCFSA aims to coordinate subregional activities related to wildlife conservation, biodiversity conservation, trans-boundary protected areas management and border control. Conference on the Ecosystems of Dense Tropical Rainforests of Central Africa (CEFDHAC) CEFDHAC is a subregional forum for consultation and exchange of experience, open to all those involved in the forest sector, with a view to equitable and sustainable management of forest ecosystems in Central Africa. Its goal is to encourage all players (States, national and subregional organizations, the private sector, NGOs) to exchange points of view and develop a common vision of conservation and utilization of the forests in the region. Network for protected areas in Central Africa (RAPAC) RAPAC is a subregional association that brings together the agencies in charge of protected areas management in seven Central African countries. Its main objective is to promote conservation and the rational management of the natural resources of Central Africa, particularly through the management of protected areas in its member countries. Network for forestry education in Central Africa (RIFFEAC) RIFFEAC is a subregional network for training institutions. Its objective is to develop the skills to meet changing job market requirements and employer demands. Created in 2001, RIFFEAC became a partner of COMIFAC in 2006 for the implementation of strategic axis 7 of the Convergence Plan. Observatory for Central African Forests (OFAC) Created in2007, OFAC aims at collecting, harmonizing and disseminating scientific, administrative and technical information on forest management, forest biodiversity, forest cover change and forest ecosystem services (carbon, water, non-wood forest products). Information is collected at national level and at the level of each management unit (logging concession, protected area, transformation unit, REDD project, etc.). OFAC coordinates the production of ‘The State of the Forests of the Congo Basin’ every two years.
38
Network for Parliamentarians for the Sustainable Management of Forest Ecosystems in Central Africa (REPAR) Created in 2002, the aim of this network is to enable parliamentarians in the subregion to share their respective national legislative experiences in the management of forest ecosystems, to deliberate on common themes, to encourage consideration of the interests of local communities in the preparation of legislative texts relating to the environment, to contribute through concerted legislative action to the safeguarding and sustainable management of the forest ecosystems and to make the CEFDHAC member countries aware of the need to apply international conventions on the environment. Network of African Women for Sustainable Development (REFADD) REFADD is a network of women’s NGOs working in the field of sustainable management of natural resources. Its objective is to promote effective participation of African women in sustainable development through their involvement in programmes for the sustainable management of natural resources and biodiversity conservation in Central Africa. International Forum for Indigenous Peoples of Central Africa (FIPAC) FIPAC is a subregional network of indigenous peoples. Its objective is to improve participation of indigenous people in the sustainable management and conservation of the forest ecosystems of Central Africa and to reinforce the rights of indigenous people regarding sustainable management and conservation of forest ecosystems. The Sangha Tri-National Collaboration agreement (TNS) TNS, a 2.8 million hectare area of forest in Central Africa, was established following an agreement signed between the governments of Cameroon, the Republic of Congo and the Central African Republic. The agreement is for collaborative management of TNS. The COMIFAC TRIDOM intergovernmental collaboration agreement (TRIDOM) The Dja-Odzala-Minkébé (TRIDOM) collaboration agreement was signed in 2005. It defines TRIDOM as a trans-border complex of protected areas connected by a vast inter-zone in Cameroon, the Republic of Congo and Gabon. The TRIDOM conservation zone of about 14.6 million hectares represents 7.5 percent of the Congo Basin rainforest.
39
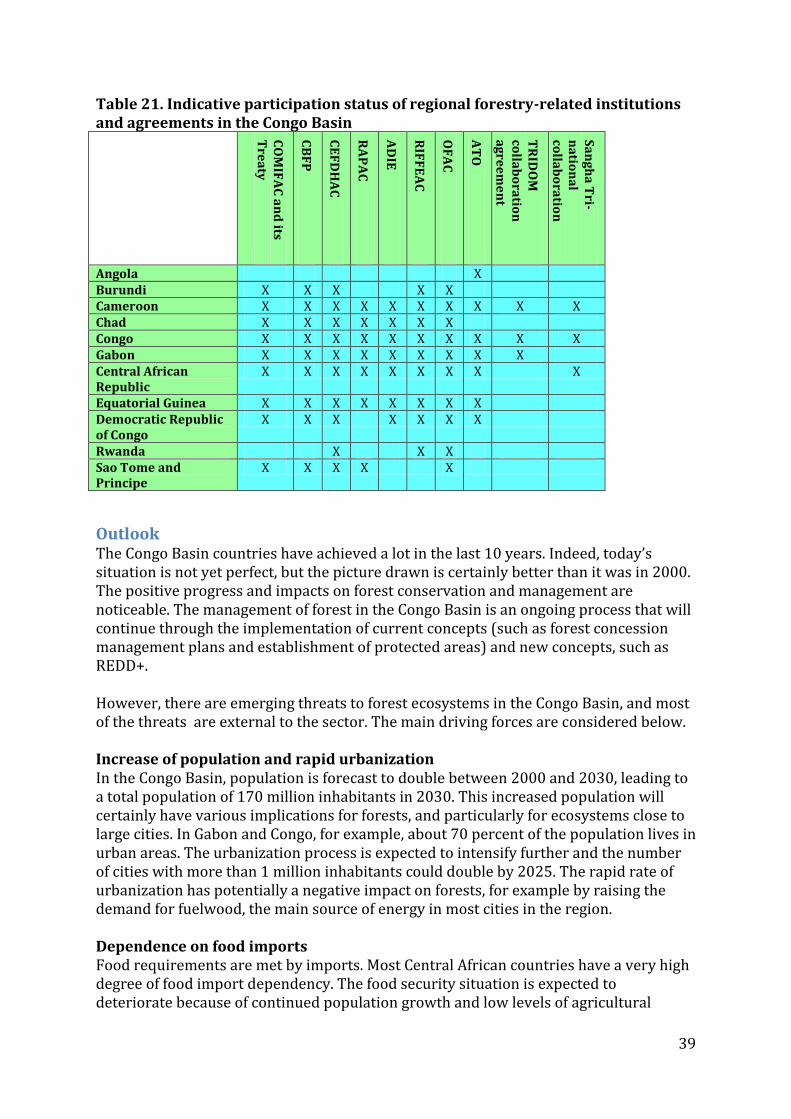
Table 21. Indicative participation status of regional forestry-related institutions and agreements in the Congo Basin C
OM
IFA
C a
nd
its T
rea
ty
CB
FP
CE
FD
HA
C
RA
PA
C
AD
IE
RIF
FE
AC
OF
AC
AT
O
TR
IDO
M
colla
bo
ratio
n
ag
ree
me
nt
Sa
ng
ha
Tri-
na
tion
al
colla
bo
ratio
n
ag
ree
me
nt
Angola X Burundi X X X X X Cameroon X X X X X X X X X X Chad X X X X X X X Congo X X X X X X X X X X Gabon X X X X X X X X X Central African Republic
X X X X X X X X X
Equatorial Guinea X X X X X X X X Democratic Republic of Congo
X X X X X X X
Rwanda X X X Sao Tome and Principe
X X X X X
Outlook The Congo Basin countries have achieved a lot in the last 10 years. Indeed, today’s situation is not yet perfect, but the picture drawn is certainly better than it was in 2000. The positive progress and impacts on forest conservation and management are noticeable. The management of forest in the Congo Basin is an ongoing process that will continue through the implementation of current concepts (such as forest concession management plans and establishment of protected areas) and new concepts, such as REDD+. However, there are emerging threats to forest ecosystems in the Congo Basin, and most of the threats are external to the sector. The main driving forces are considered below. Increase of population and rapid urbanization In the Congo Basin, population is forecast to double between 2000 and 2030, leading to a total population of 170 million inhabitants in 2030. This increased population will certainly have various implications for forests, and particularly for ecosystems close to large cities. In Gabon and Congo, for example, about 70 percent of the population lives in urban areas. The urbanization process is expected to intensify further and the number of cities with more than 1 million inhabitants could double by 2025. The rapid rate of urbanization has potentially a negative impact on forests, for example by raising the demand for fuelwood, the main source of energy in most cities in the region. Dependence on food imports Food requirements are met by imports. Most Central African countries have a very high degree of food import dependency. The food security situation is expected to deteriorate because of continued population growth and low levels of agricultural
40
productivity. Faced with low supply from the agricultural sector, government strategies and plans aim to boost domestic food production and to reduce the national dependence on imports. Thus national programmes for food security are being implemented in Cameroon, Congo, Gabon, Chad and DRC with this aim. The implementation of these strategies and plans will certainly increase pressure on forest land. Macro-economic externalities With the escalating prices of fuel and food, large-scale acquisition of land for oil palm and cash crop production appears set to become, with mining, a leading cause of deforestation in the Congo Basin for the immediate future. In many countries, protected areas and forest concessions are threatened by mining projects and the establishment of large-scale plantations of palm trees for biofuel. Several companies are currently prospecting for minerals in the region. Some of them are even interested in areas already allocated to biodiversity conservation, such as Dja in Cameroon, Minkebe in Gabon and Odzala in Congo. These external factors to the forestry sector will have a negative impact on forests in the next decade. Therefore, specific priorities and strategies are required to improve the outlook for forestry. These include:
Land-use planning The development of land-use plans with the aim to prevent conflicts over natural resources, to conserve forest biodiversity and to combat deforestation.
Revision of legal and policy frameworks The formulation of new forest policies and laws in a participatory manner with a holistic and inter-sectoral approach.
Improved forest management practices The improvement of the management paradigms, particularly the management of forest concessions, by bringing new concepts of integrated natural resources management and multiple-use forest management. This could allow for the expansion of current forest management practices to incorporate other forest functions (biodiversity conservation, safeguarding the forest heritage), in addition to the productive function.
Promotion of other values and benefits of forest ecosystems The promotion of other values and benefits of forest ecosystems in order to establish appropriate systems of incentives and support for sustainable livelihood and sustainable forest management.
Southeast Asia
Issues and challenges Deforestation Southeast Asia’s forests have played a central role in the development of the region and continue to play an important role in the production of wood and other products, the conservation of biodiversity, climate change abatement and protection of land and
41
water resources. Consequently, loss of forest areas in the region are of significant concern, potentially compromising timber production, river basin protection, biodiversity, the global carbon balance and rural employment. Infrastructure development, expansion of industrial agriculture and population growth have been primary drivers of change in the region and will continue to threaten forest resources. With expansion of infrastructure, investment in agriculture has increased and establishment of cash crop plantations has become a primary driver of forest conversion in Southeast Asia. Two of the most important crops in terms of forest conversion are rubber and oil-palm. Cashew nuts, coconut and sugar cane have also driven forest conversion, in particular in Mekong countries, while in coastal areas shrimp ponds and agriculture have resulted in the loss of mangroves. Forest degradation The health and vitality of forests in Southeast Asia is threatened by several factors, including fires, pests and diseases, and degradation through forest fragmentation, excessive extraction and poor harvesting techniques. Fire has been a major cause of loss of forest vitality and, in concert with logging and climate change, poses a serious threat to forests in the region. Logging has perhaps the most significant impacts on forest health and vitality in the region in view of the generally low quality of harvesting operations. Associated degradation has significantly reduced the present and future value of forests and together with other influences may jeopardize the future economic and ecological viability of the region’s forests. Rebuilding the natural resource base Doubt over the economic viability of sustainable management of natural forests for production in Southeast Asia also constitutes a serious concern for production forestry in the region. Overharvesting and high grading, multiple re-entry to logging coupes and lack of implementation of reduced-impact logging techniques have all reduced the value of forests. In many areas forest protection and rehabilitation are essential to increase growing stock and provide time to redress destructive logging practices. Reversing current trends will require significant investment in resource supply, renovation of production facilities and improved governance and institutional performance. Forest governance In most countries, little measurable improvement in standards of governance has occurred, with the exception of Indonesia, where indicators have improved significantly. Despite increased attention to forest law enforcement and governance around the region, significant changes on the ground have been slow in developing. Largely to blame are conflicting priorities, lack of resources and the reluctance of vested interests to stem the flow of forest products. In many countries, uncertainties over forest and land tenure continue to impede improvements in forest management.Progress and opportunities External incentives to improve forest management performance External measures that reflect growing concern over trade legality and sustainable resource management may provide significant impetus to improve forest management
42
performance, such as the European Union’s impending due diligence regulations, and amendments to the United States of America’s ‘Lacey Act’, making it a criminal offence to import or trade in timber products that have been harvested illegally.
Progress and opportunities Broader forest policy frameworks In Southeast Asia, forest policy has been directed towards sustainable forest management in almost all countries for over a decade. In more precise terms, this has meant reorientation towards reduced exploitation of natural forests, increased establishment of plantation resources and greater inclusion of community groups and the private sector in forest management and forestry. Forest rehabilitation has become more frequently included in policy declarations, particularly in Indonesia, the Philippines and Viet Nam. Plantation development has also been an important policy focus in Indonesia and Viet Nam. Community involvement has frequently been targeted, and in Lao PDR poverty reduction has become a central theme. Devolution of forest ownership and tenure As demands for land and forest products and services increase, it is becoming ever more critical for forest managers to balance interests and to integrate or separate activities according to local and national conditions. Revisions of ownership and tenure can transfigure forest management, as is happening particularly in Viet Nam. Additionally, allocation of land can have considerable effects on economic efficiency and equity. In several countries in the subregion, forest and forest land allocation processes have been progressing over the past decade as economic frontiers have advanced and societal demands have changed (Edmunds and Wollenberg 2003; FAO 2006b). In Viet Nam and the Philippines, granting of land rights to individuals, families and indigenous groups has had a huge influence on the forestry sector. In Viet Nam the forest land allocation policy has been combined with major programmes to increase forest cover, wood product production and rural incomes through afforestation. In the Philippines, changes in ownership have resulted primarily from establishment of productive forest plantations with accompanying increases in corporate and small-scale ownership. Increase in forest area in some countries Increasing forest areas in several countries is a promising trend. In Viet Nam, large government-supported afforestation and reforestation programmes are resulting in forest expansion, although, as in almost all countries in the region, primary forests are still being lost at high rates. In the Philippines, forest cover is estimated to be increasing due to reduction of pressures on forest lands, private-sector-planted forest expansion and rising demands for forest products. In Thailand, the agricultural frontier has, to a greater or lesser extent, been closed and forests are regrowing on former agricultural land. In other countries, relationships between forest area and key drivers of deforestation remain essentially unchanged. Vast potential for restoring degraded forest lands If resources to support forest rehabilitation can be found, then Southeast Asia offers vast potential for restoring lost and degraded forest areas. For example, the region contains an estimated 40 million hectares of low value imperata grasslands that could be converted back to forest using low cost measures such as Assisted Natural
43
Regeneration. Similarly, with adequate support and expertise, large tracts of other wastelands could be reclaimed for forest. REDD and payment for environmental services Greater inclusion of forests and forestry in international climate change-related agreements is anticipated as a means of supporting a transition towards forest production and increased focus on forest ecosystem services in countries where exploitative use of forest continues and local demand for forest services remains undeveloped. REDD+ in particular offers the possibility of substantial income from reducing emissions from deforestation, mitigating forest degradation, and enhancing conservation of forest carbon stocks through sustainable management of forests. Payments for other ecosystem services, such as river basin services and biodiversity conservation, also offer potential incentives for improved forest management, though at present such systems are in their infancy in Southeast Asia. However, high demand for land and forest products, low institutional capacity and poor governance, particularly in low-income, high-forest-cover countries, as well as the deeply entrenched social causes of deforestation and forest degradation, suggest that reductions in deforestation and degradation will be hard won. Improved forest monitoring In countries developing REDD frameworks, preparations will include design of systems for intensified forest monitoring. Examination of the state of forest resources in unprecedented detail will provide a much stronger foundation for developing effective mitigation strategies and more accurate cost assessments. Monitoring will also provide valuable information for adaptation-related interventions.
Regional cooperation and agreements A range of regional agreements and instruments are important in promoting forestry cooperation in Southeast Asia. Association of Southeast Asian Nations (ASEAN) ASEAN has established several technical networks and working groups that relate strongly to forestry, including working groups on nature conservation and biodiversity and climate change, and ad hoc expert working groups on implementing international forest policy processes and pan-ASEAN timber certification. ASEAN Transboundary Haze Agreement This is the first regional arrangement in the world that binds a group of contiguous states to tackle transboundary haze pollution resulting from land and forest fires. Asia-Pacific Forestry Commission (APFC) APFC is one of six FAO Regional Forestry Commissions that cover the world's major geographical regions. APFC is a forum for advising and taking action on key forestry issues. Asia Forest Partnership (AFP) AFP was launched in 2002 as a partnership for sustainable development based on the Rio Declaration principles and the values expressed in the Millennium Declaration. AFP

44
set itself the task of information sharing, dialogue and joint action to promote sustainable forest management. Mekong River Commission (MRC) The MRC works to facilitate joint management of the member countries’ shared water resources, and development of the economic potential of the Mekong river. Heart of Borneo Initiative (HoBI) The HoBI provides a framework for cooperation on management of the 220 000 km2 “Heart of Borneo” rainforest area. It commits Indonesia, Malaysia and Brunei Darussalam to preparing strategic and operational plans with joint road maps for realizing ‘One Conservation Vision’ for the area. Asia-Pacific Network for Sustainable Forest Management and Rehabilitation (APFNet) APFNet is an open regional organization promoting and improving sustainable forest management and rehabilitation in the Asia-Pacific region through capacity-building, information-sharing, regional policy dialogues and pilot projects. Asia-Pacific Forest Invasive Species Network (APFISN) APFISN is a regional forest invasive species network under the auspices of APFC. Table 22. Indicative participation status of regional forestry-related institutions and agreements in Southeast Asia
AS
EA
Na
AS
EA
N
Tra
nsb
ou
nd
arry
H
aze
Ag
ree
me
nt
b
AP
FC
c
AF
Pd
MR
Ce
He
art o
f Bo
rne
of
AP
FN
et
g
AP
FIS
Nh
Brunei Darussalam X X X X
Cambodia X X X X X X X
Indonesia X X X X X X
Lao People’s Democratic Republic
X X X X X X
Malaysia X X X X X X X
Myanmar X X X X* X X
Papua New Guinea X X X
Philippines X X X X X X
Singapore X X X
Thailand X X X X X X X
Viet Nam X X X X X X X
* Observer.
45
Sources:
a) http://www.aseansec.org/74.htm
b) http://haze.asean.org/hazeagreement/status
c) http://www.fao.org/forestry/33587/en/
d) http://www.asiaforests.org/index.php?option=com_content&task=view&id=23&Itemid=173
e) http://www.mrcmekong.org/
f) http://www.adb.org/Environment/adb-hob.asp
g) http://www.apfnet.cn/About-Us/Focal-Point.html
h) http://www.fao.org/forestry/35067/en/
Outlook Between 2010 and 2020, the population of Southeast Asia is projected to increase by 11 percent to 670 million people. Increased pressures on forests are expected to drive a decline in forest cover in Southeast Asia, from 51 percent in 2010 to 47 percent in 2020 (FAO, 2011). Net losses in the majority of countries are expected to total 18 million hectares. With forest conversion the primary driver of biodiversity loss, estimates are that between 13 percent and 42 percent of species will be lost in Southeast Asia by 2100, at least half of which could represent global extinctions (Sodhi et al., 2004). While overall pressures on forest resources are set to increase, several factors may mitigate tendencies towards deforestation and degradation. Structural changes in economies towards industry and services and away from agriculture, and migration towards urban centres could reduce pressures on land. Within Southeast Asia’s overall development framework, prevailing economic and demographic trends and national-level priorities suggest that forestry-related goals should centre on economic production and biodiversity protection. Trade-offs between these objectives should be carefully monitored and controlled, and as such a third, cross-cutting, priority is improved governance. Specific priorities and strategies to improve the outlook for forestry include:
Rebuild the natural resource base and conserve existing resources. Demands for wood products and ecosystem services are expected to accelerate, making imperative greater investment in conserving and enhancing the natural asset base.
Conserve forest biodiversity. Protected areas remain the cornerstone of forest biodiversity and, although there are exceptions, deforestation and forest degradation within protected areas are lower than in surrounding landscapes. In particular, there is a great need to increase forest law enforcement and awareness-raising efforts and to improve financing for protected areas.
Utilize available incentives. Financial mechanisms aimed at reducing deforestation and degradation of forests, and legislation aimed at imports of forest products to high paying markets provide new incentives to promote sustainable forest management.
Involve stakeholders. Much greater inclusion of forestry stakeholders at different levels is necessary. Public opinion should play a larger role in forestry development so that policies are appropriate, are broadly supported and can be more easily implemented.
46
Re-invent policies and institutions. Many countries would benefit from tenure reform; improved land-use planning; reform of public sector agencies; and creation of enabling business environments.
Revitalize field-level forestry. International agreements and policy development need to be accompanied by practical steps towards improving basic forest management.
Improve education. Wider involvement in forest-related decision-making implies greater emphasis on education and awareness related to forests and forestry.
Conclusions The present document summarizes the state of forests in the three rainforest basins. Given the short time available in which to compile this document in three languages (two months), it does not claim to be a comprehensive assessment; rather, it provides an overview of some key aspects considered important in terms of indicating progress towards sustainable forest management in the three basins. The difference in the extent of available information among the regions inevitably means that not all available data could be comprehensively considered in its compilation. The document is therefore, of necessity, limited to a few comparable sources of data. Fortuitously, FAO’s Global Forest Resources Assessment 2010 (FRA 2010) was completed less than a year ago, based on reports received from countries, and ITTO’s assessment of the Status of Tropical Forest Management – 2011, which covers 20 of the 30 countries in this study, is currently in press, so the information available is relatively recent. Nevertheless, there are a number of issues related to data availability and quality that should be stressed.
Data availability and quality The tables in Annex 1 provide the country data available for all the variables discussed in the document. As can be seen, data availability is generally good. However, there are a number of important data gaps, including on such essential aspects as forest characteristics, growing stock and carbon stocks, but in particular a lack of complete data series needed for trend analysis of designated functions of forests, their ownership and management rights in some countries. Data on forest fires, pests and diseases, and on non-wood forest products were too scarce to merit inclusion in this report. Attempts to fill gaps in the FRA 2010 datasets with those from ITTO and vice versa were made for some variables (clearly specified in the tables), but had to be abandoned in some cases since the discrepancies between the two data sources were too large, both derived from reports submitted by countries and for the two major assessments generally using the same definitions and classifications at the aggregated level and carried out almost simultaneously. In terms of data quality for the most basic data, that of forest area, most countries have an estimate of forest area that is less than ten years old (See Table 2 in the Annex Tables) and the forest area-weighted average year is 2001. The notable exception is Angola, which had to rely on very old data for FRA 2010 (dating from 1970), but which is currently in the process of conducting a national forest inventory. Relatively old data are also used for Venezuela (Bolivarian Republic of), Central African Republic, Sao Tome and Principe, Brunei Darussalam and Papua New Guinea (15 years old or more). The
47
vast majority of countries use remote sensing to estimate the forest area, in some cases in combination with data from forest inventories. Three countries (Cameroon, Philippines and Viet Nam) have conducted a national forest inventory since 2003 and ten countries (Angola, Bolivia (Plurinational State of), Brazil, Congo, Democratic Republic of the Congo, Ecuador, Indonesia, Papua New Guinea, Peru and Viet Nam) are currently in the process of doing so or at an advanced planning stage. A number of countries (notably those wishing to take advantage of REDD+) are currently using remote sensing to obtain comparable information on changes in forest area since 1990. Both efforts indicate that more and better data on forest area, growing stock and carbon stock may become available in the near future. Nevertheless, it must be concluded that there is still a long way to go before forest and forest management data are reliable and robust enough to produce detailed and accurate reports on the state of forests in the three rainforest basins, let alone serve as the foundation for calculating compensation under any eventual market mechanisms for forest services such as carbon sequestration.
Alarming trends Despite issues with data availability and quality, the key findings of the present document highlight a number of observations that are alarming in the light of aspirations for sustainable forest management and for progress towards the four Global Objectives on Forests and the Non-legally binding instrument on all types of forests, adopted by the United Nations General Assembly in December 2007:
Deforestation continues at alarming rates in most of the countries in the three rainforest basins. Together, the 30 countries reported a net loss of forest area of 5.4 million hectares per year in the last decade, or 0.4 percent annually. As a result, the total carbon stock in forests decreased by an estimated 1.2 Gt annually during the period 2000–2010.
The area of primary forest is decreasing by about 4 million hectares a year. This is partly due to deforestation and partly due to other human activities that leave visible signs of human impact and thus transform the forest into ‘other naturally regenerated forest’ in the FRA 2010 classification system.
Although not yet quantified, forest degradation due to unsustainable, including illegal, practices is a common phenomenon in most countries.
Less than 15 percent of the total forest area is covered by a forest management plan, and only 3.5 percent of the total forest area is considered to be under sustainable forest management. Just over 1 percent has undergone certification.
Positive news However, there are also some very positive factors:
The rate of loss of forests is showing signs of slowing down in the three rainforest basins. When comparing the average annual loss of the 1990s (7.1 million ha/year) with that of 2000–2010 (5.4 million ha/year), it fell by 24 percent.
48
Close to 200 million hectares, or 18 percent of all forests in the three rainforest basins, are located in national parks, game reserves, wilderness areas and other legally established protected areas.
The area of planted forest increased by over half a million hectare per year during the period 2000–2010 and, although only accounting for 2 percent of the total forest area, planted forests are likely to supply an increasing share of the demand for wood in the future and may reduce the pressure on the remaining natural forests in some countries.
The area of forest designated primarily for the protection of soil and water now accounts for 7 percent of the total forest area.
Significant progress has been made in further developing an enabling framework for sustainable forest management. Of the 30 countries, 13 have updated their forest policy since 2000 and 10 have updated their forest law. An estimated 94 percent of the total forest area in the three rainforest basins is now covered by national forest programmes.
Substantial efforts are needed to address a number of alarming trends and advance progress towards sustainable forest management in all countries and regions. National forest programmes offer a potential vehicle for the discussion of issues and for reaching agreements on priority actions at the national and subnational levels, while regional and inter-regional collaboration facilitates the sharing of information and experiences among countries.

49
References ACTO. n.d. Tratado de Cooperación Amazónica. http://www.otca.info/portal/
CBFP [Congo Basin Forests Partnership]. 2006. The Forests of the Congo Basin. State of the Forest 2006. Congo Basin Forests Partnership, Belgium. 257 p.
CBFP. 2009. The Forests of the Congo Basin. State of the Forest 2008. Publications Office of the European Union, Luxembourg. 411 p.
CEPAL/FAO/IICA. 2010. Perspectiva de la agricultura para y del desarrollo rural en las Américas: una mirada hacia América Latina y el Caribe. FAO, Santiago.
Edmunds, D. and Wollenberg, E. 2003. Local forest management: the impacts of devolution policies. Earthscan.
Elias, E. 2004. El proceso de Tarapoto: Criterios e indicadores para la gestión del bosque Amazónico. Brasil. http://www.fao.org/docrep/007/y5841s/y5841s12.htm
FAO. 2006. Understanding forest tenure in South and Southeast Asia. FAO, Forest Policy and Institutions Working Paper 14. Rome, FAO.
FAO. 2010. Global Forest Resources Assessment 2010. FAO Forestry Paper no. 163. FAO, Rome.
FAO. 2011. FAOSTAT – FAO’s online statistical database. Rome, Italy (available at http://faostat.fao.org).
FAO. 2011. Pacific forests and forestry to 2020: Subregional report of the second Asia-Pacific Forestry Sector Outlook Study. RAP Publication 2011/01. FAO, Bangkok.
FAO. 2011. Redes de cooperación técnica, RLC. FAO, Santiago. http://www.rlc.fao.org/es/tecnica/redes.htm
FAO. 2011. State of the World’s Forests. FAO, Rome
FAO. 2011. Southeast Asian forests and forestry to 2020: Sub-regional report of the second Asia-Pacific Forestry Sector Outlook Study. RAP Publication 2010/20. Bangkok, FAO.
ITTO (in press). Status of Tropical Forest Management - 2011.
Junta de Castilla de Leon/FAO. 2010. Casos ejemplares de manejo forestal sostenible en América Latina y el Caribe. FAO, Santiago.
Nazi, R., Nguinguiri, J.C. & Ezzine de Blaz, D. 2006. Exploitation et gestion durable des forêts d’Afrique centrale. La quête de la durabilité. L’Harmattan, Paris. 404 p.
Sodhi, N.S., Koh, L.P., Brook, B.W. & Ng, P.K.L. 2004. Southeast Asian biodiversity: an impending disaster. Trends in Ecology & Evolution, 19(12): 654–660.

50
Annex Tables
Notes
Country nomenclature used in the tables
The country names used in these tables follow standard UN practice regarding nomenclature.
Data source
Unless otherwise stated, the information provided in these tables are derived from officially validated
country reports. The reports contain detailed information on data sources, original data and an
explanation of how the reported figures were calculated, as well as explanatory notes on each of the
tables. These reports are available on the FAO Web site www.fao.org/forestry/fra2010) in English,
French or Spanish.
Totals
Numbers may not tally because of rounding. Global and regional totals are omitted in those cases
where the sum of the reported values would not give a correct estimate because of incomplete data
sets.
Abbreviations
n.s. = not significant, indicating a very small value
– = data not available
FTE = full-time equivalent
Contents
1. Basic data on countries and regions
2. Information status on forest area
3. Extent of forest and other wooded land 2010
4. Change in extent of forest 1990–2010
5. Forest types 2010
6. Forest characteristics 2010
7. Change in extent of primary forest 1990–2010
8. Change in area of planted forest 1990–2010
9. Forest growing stock and carbon stock 2010
10. Change in carbon stock in living forest biomass 1990–2010
11. Ownership and management rights of forests 2005
12. Change in ownership of forest 1990–2005
13. Primary designated function of forest 2010
14. Change in area designated for production, protection and conservation 1990–2010
15. Change in removal of wood products 1990–2009
16. Formal employment in the forestry sector 2006
17. Forestry sector’s contribution to GDP 2006
18. Permanent forest estate and area under sustainable forest management, 2010
19. Change in area of forest in protected areas 1990–2010
20. Policy and legal framework 2008
21. Ratification of international forest–related agreements
22. Participation in global initiatives on REDD+ readiness
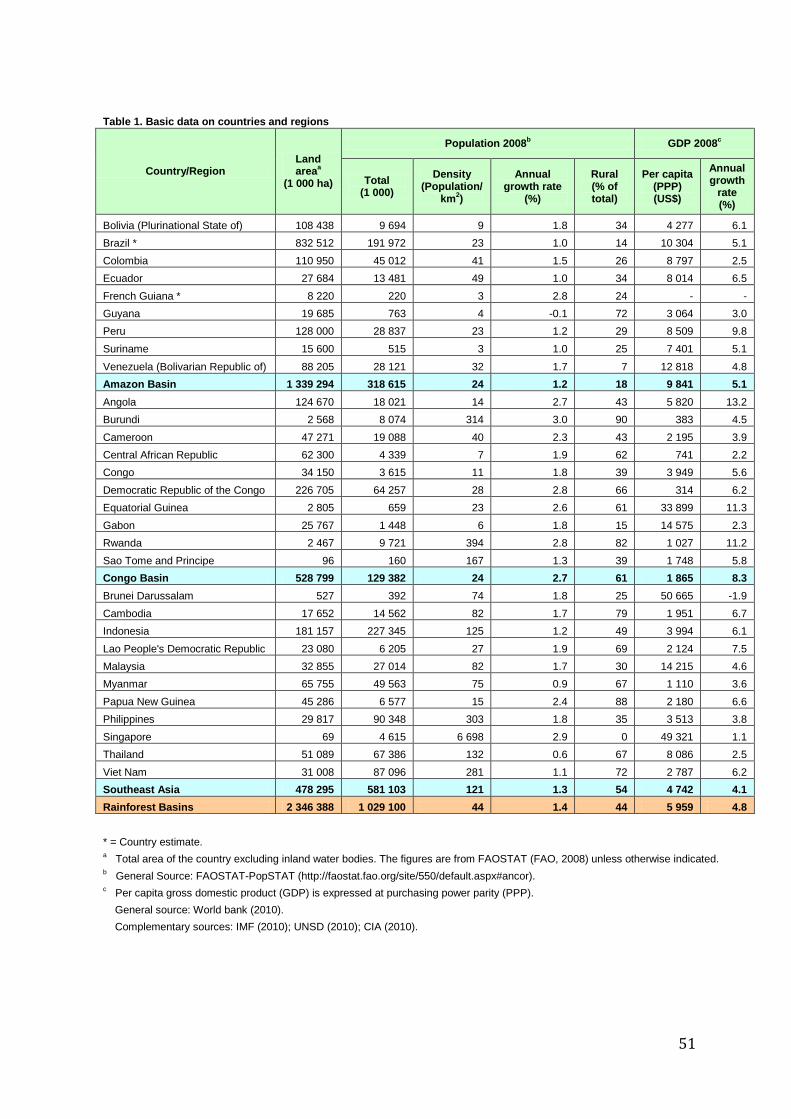
51
Table 1. Basic data on countries and regions
Country/Region Land area
a
(1 000 ha)
Population 2008b GDP 2008
c
Total (1 000)
Density (Population/
km2)
Annual growth rate
(%)
Rural (% of total)
Per capita (PPP) (US$)
Annual growth
rate (%)
Bolivia (Plurinational State of) 108 438 9 694 9 1.8 34 4 277 6.1
Brazil * 832 512 191 972 23 1.0 14 10 304 5.1
Colombia 110 950 45 012 41 1.5 26 8 797 2.5
Ecuador 27 684 13 481 49 1.0 34 8 014 6.5
French Guiana * 8 220 220 3 2.8 24 - -
Guyana 19 685 763 4 -0.1 72 3 064 3.0
Peru 128 000 28 837 23 1.2 29 8 509 9.8
Suriname 15 600 515 3 1.0 25 7 401 5.1
Venezuela (Bolivarian Republic of) 88 205 28 121 32 1.7 7 12 818 4.8
Amazon Basin 1 339 294 318 615 24 1.2 18 9 841 5.1
Angola 124 670 18 021 14 2.7 43 5 820 13.2
Burundi 2 568 8 074 314 3.0 90 383 4.5
Cameroon 47 271 19 088 40 2.3 43 2 195 3.9
Central African Republic 62 300 4 339 7 1.9 62 741 2.2
Congo 34 150 3 615 11 1.8 39 3 949 5.6
Democratic Republic of the Congo 226 705 64 257 28 2.8 66 314 6.2
Equatorial Guinea 2 805 659 23 2.6 61 33 899 11.3
Gabon 25 767 1 448 6 1.8 15 14 575 2.3
Rwanda 2 467 9 721 394 2.8 82 1 027 11.2
Sao Tome and Principe 96 160 167 1.3 39 1 748 5.8
Congo Basin 528 799 129 382 24 2.7 61 1 865 8.3
Brunei Darussalam 527 392 74 1.8 25 50 665 -1.9
Cambodia 17 652 14 562 82 1.7 79 1 951 6.7
Indonesia 181 157 227 345 125 1.2 49 3 994 6.1
Lao People's Democratic Republic 23 080 6 205 27 1.9 69 2 124 7.5
Malaysia 32 855 27 014 82 1.7 30 14 215 4.6
Myanmar 65 755 49 563 75 0.9 67 1 110 3.6
Papua New Guinea 45 286 6 577 15 2.4 88 2 180 6.6
Philippines 29 817 90 348 303 1.8 35 3 513 3.8
Singapore 69 4 615 6 698 2.9 0 49 321 1.1
Thailand 51 089 67 386 132 0.6 67 8 086 2.5
Viet Nam 31 008 87 096 281 1.1 72 2 787 6.2
Southeast Asia 478 295 581 103 121 1.3 54 4 742 4.1
Rainforest Basins 2 346 388 1 029 100 44 1.4 44 5 959 4.8
* = Country estimate. a Total area of the country excluding inland water bodies. The figures are from FAOSTAT (FAO, 2008) unless otherwise indicated.
b General Source: FAOSTAT-PopSTAT (http://faostat.fao.org/site/550/default.aspx#ancor).
c Per capita gross domestic product (GDP) is expressed at purchasing power parity (PPP).
General source: World bank (2010).
Complementary sources: IMF (2010); UNSD (2010); CIA (2010).
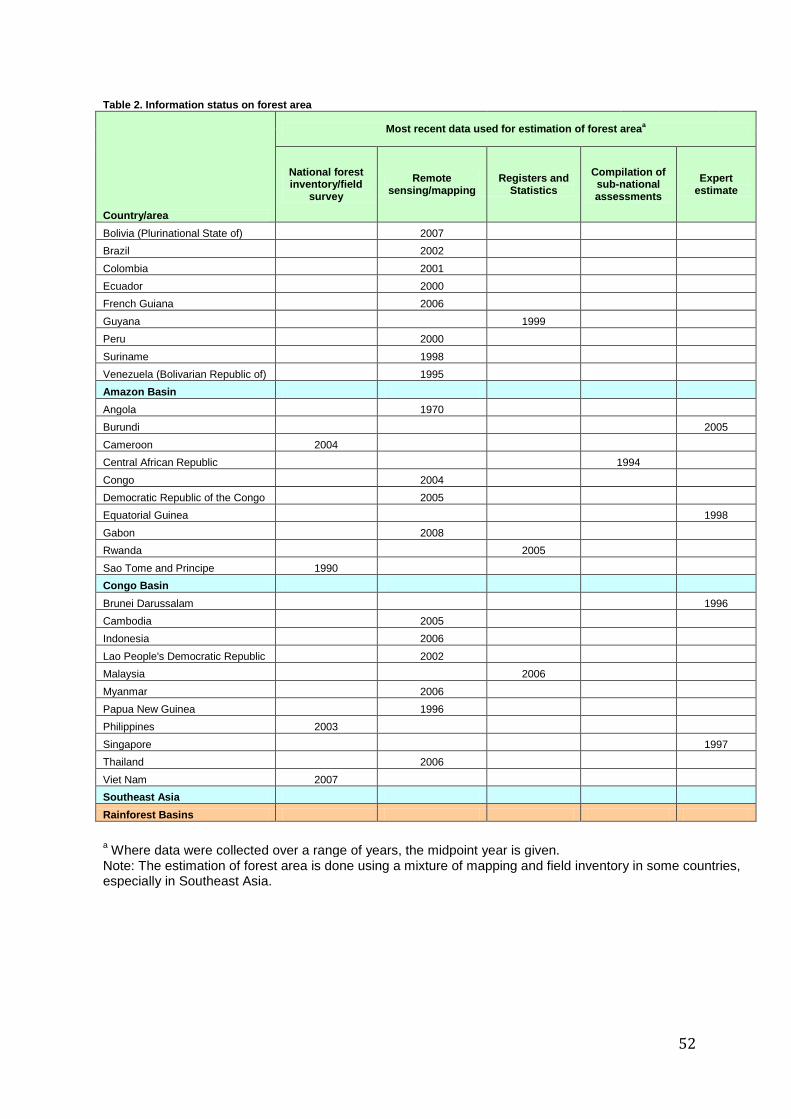
52
Table 2. Information status on forest area
Country/area
Most recent data used for estimation of forest areaa
National forest inventory/field
survey
Remote sensing/mapping
Registers and Statistics
Compilation of sub-national assessments
Expert estimate
Bolivia (Plurinational State of) 2007
Brazil 2002
Colombia 2001
Ecuador 2000
French Guiana 2006
Guyana 1999
Peru 2000
Suriname 1998
Venezuela (Bolivarian Republic of) 1995
Amazon Basin
Angola 1970
Burundi 2005
Cameroon 2004
Central African Republic 1994
Congo 2004
Democratic Republic of the Congo 2005
Equatorial Guinea 1998
Gabon 2008
Rwanda 2005
Sao Tome and Principe 1990
Congo Basin
Brunei Darussalam 1996
Cambodia 2005
Indonesia 2006
Lao People's Democratic Republic 2002
Malaysia 2006
Myanmar 2006
Papua New Guinea 1996
Philippines 2003
Singapore 1997
Thailand 2006
Viet Nam 2007
Southeast Asia
Rainforest Basins
a Where data were collected over a range of years, the midpoint year is given.
Note: The estimation of forest area is done using a mixture of mapping and field inventory in some countries, especially in Southeast Asia.
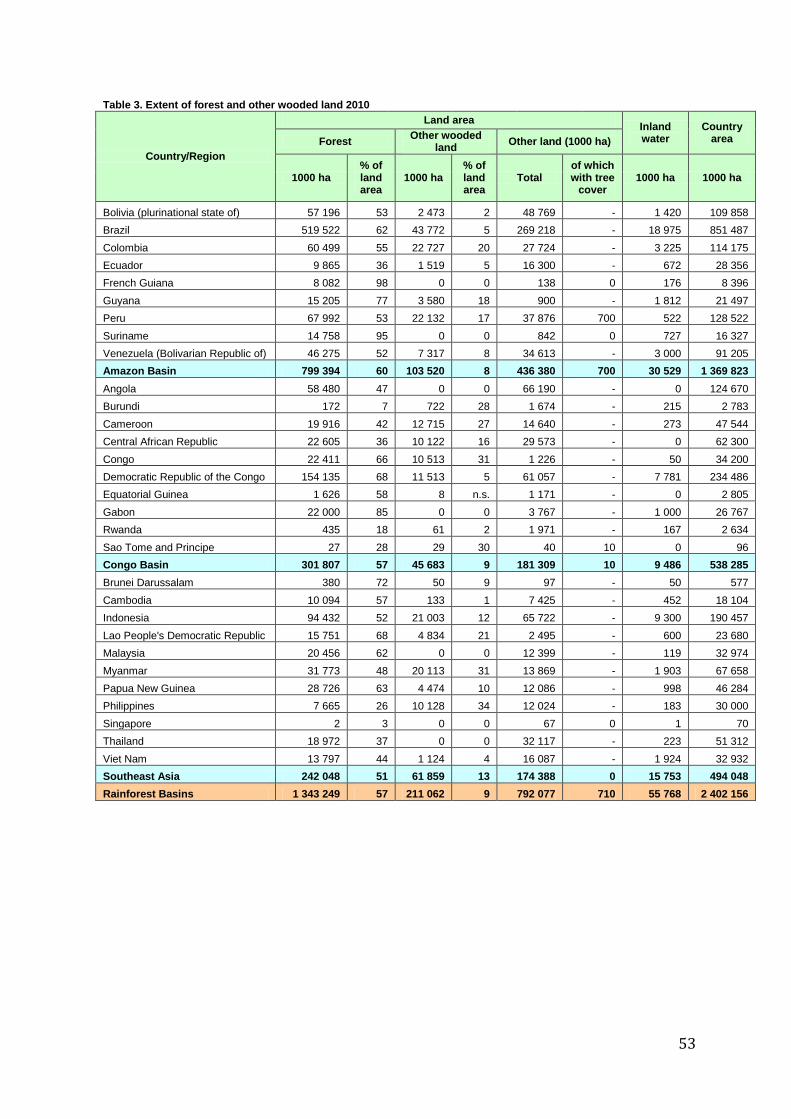
53
Table 3. Extent of forest and other wooded land 2010
Country/Region
Land area Inland water
Country area Forest
Other wooded land
Other land (1000 ha)
1000 ha % of land area
1000 ha % of land area
Total of which with tree
cover 1000 ha 1000 ha
Bolivia (plurinational state of) 57 196 53 2 473 2 48 769 - 1 420 109 858
Brazil 519 522 62 43 772 5 269 218 - 18 975 851 487
Colombia 60 499 55 22 727 20 27 724 - 3 225 114 175
Ecuador 9 865 36 1 519 5 16 300 - 672 28 356
French Guiana 8 082 98 0 0 138 0 176 8 396
Guyana 15 205 77 3 580 18 900 - 1 812 21 497
Peru 67 992 53 22 132 17 37 876 700 522 128 522
Suriname 14 758 95 0 0 842 0 727 16 327
Venezuela (Bolivarian Republic of) 46 275 52 7 317 8 34 613 - 3 000 91 205
Amazon Basin 799 394 60 103 520 8 436 380 700 30 529 1 369 823
Angola 58 480 47 0 0 66 190 - 0 124 670
Burundi 172 7 722 28 1 674 - 215 2 783
Cameroon 19 916 42 12 715 27 14 640 - 273 47 544
Central African Republic 22 605 36 10 122 16 29 573 - 0 62 300
Congo 22 411 66 10 513 31 1 226 - 50 34 200
Democratic Republic of the Congo 154 135 68 11 513 5 61 057 - 7 781 234 486
Equatorial Guinea 1 626 58 8 n.s. 1 171 - 0 2 805
Gabon 22 000 85 0 0 3 767 - 1 000 26 767
Rwanda 435 18 61 2 1 971 - 167 2 634
Sao Tome and Principe 27 28 29 30 40 10 0 96
Congo Basin 301 807 57 45 683 9 181 309 10 9 486 538 285
Brunei Darussalam 380 72 50 9 97 - 50 577
Cambodia 10 094 57 133 1 7 425 - 452 18 104
Indonesia 94 432 52 21 003 12 65 722 - 9 300 190 457
Lao People's Democratic Republic 15 751 68 4 834 21 2 495 - 600 23 680
Malaysia 20 456 62 0 0 12 399 - 119 32 974
Myanmar 31 773 48 20 113 31 13 869 - 1 903 67 658
Papua New Guinea 28 726 63 4 474 10 12 086 - 998 46 284
Philippines 7 665 26 10 128 34 12 024 - 183 30 000
Singapore 2 3 0 0 67 0 1 70
Thailand 18 972 37 0 0 32 117 - 223 51 312
Viet Nam 13 797 44 1 124 4 16 087 - 1 924 32 932
Southeast Asia 242 048 51 61 859 13 174 388 0 15 753 494 048
Rainforest Basins 1 343 249 57 211 062 9 792 077 710 55 768 2 402 156
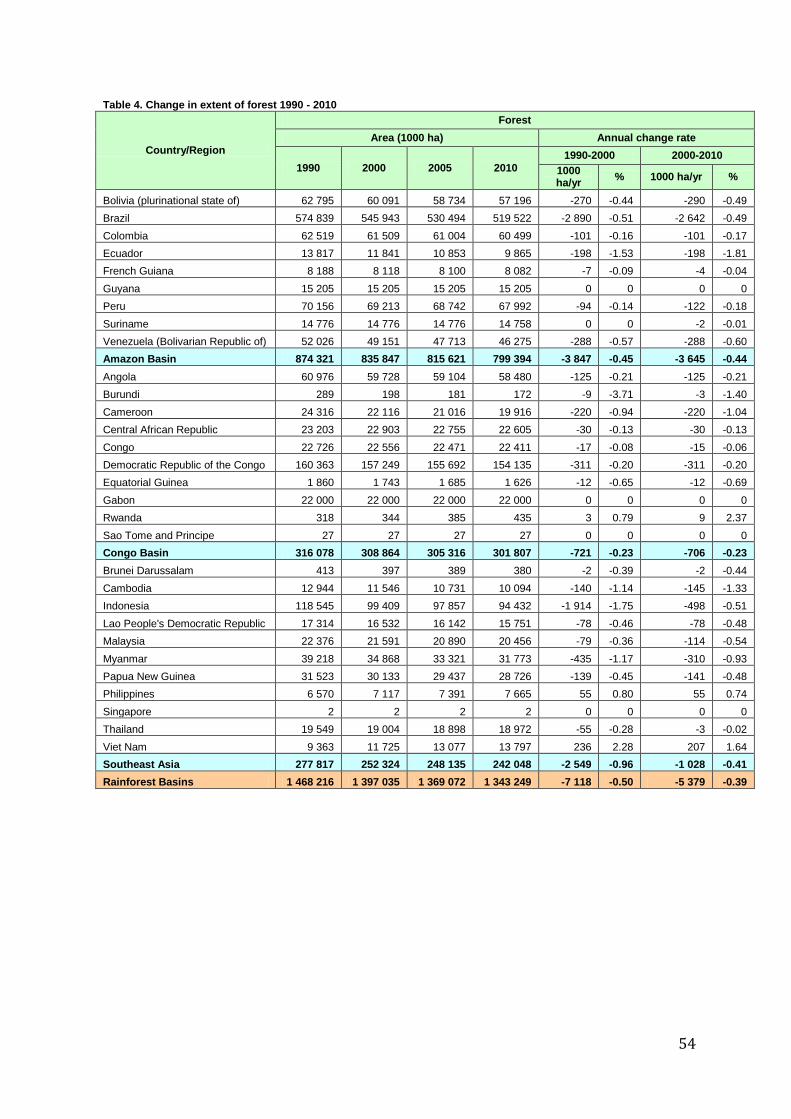
54
Table 4. Change in extent of forest 1990 - 2010
Country/Region
Forest
Area (1000 ha) Annual change rate
1990 2000 2005 2010
1990-2000 2000-2010
1000 ha/yr
% 1000 ha/yr %
Bolivia (plurinational state of) 62 795 60 091 58 734 57 196 -270 -0.44 -290 -0.49
Brazil 574 839 545 943 530 494 519 522 -2 890 -0.51 -2 642 -0.49
Colombia 62 519 61 509 61 004 60 499 -101 -0.16 -101 -0.17
Ecuador 13 817 11 841 10 853 9 865 -198 -1.53 -198 -1.81
French Guiana 8 188 8 118 8 100 8 082 -7 -0.09 -4 -0.04
Guyana 15 205 15 205 15 205 15 205 0 0 0 0
Peru 70 156 69 213 68 742 67 992 -94 -0.14 -122 -0.18
Suriname 14 776 14 776 14 776 14 758 0 0 -2 -0.01
Venezuela (Bolivarian Republic of) 52 026 49 151 47 713 46 275 -288 -0.57 -288 -0.60
Amazon Basin 874 321 835 847 815 621 799 394 -3 847 -0.45 -3 645 -0.44
Angola 60 976 59 728 59 104 58 480 -125 -0.21 -125 -0.21
Burundi 289 198 181 172 -9 -3.71 -3 -1.40
Cameroon 24 316 22 116 21 016 19 916 -220 -0.94 -220 -1.04
Central African Republic 23 203 22 903 22 755 22 605 -30 -0.13 -30 -0.13
Congo 22 726 22 556 22 471 22 411 -17 -0.08 -15 -0.06
Democratic Republic of the Congo 160 363 157 249 155 692 154 135 -311 -0.20 -311 -0.20
Equatorial Guinea 1 860 1 743 1 685 1 626 -12 -0.65 -12 -0.69
Gabon 22 000 22 000 22 000 22 000 0 0 0 0
Rwanda 318 344 385 435 3 0.79 9 2.37
Sao Tome and Principe 27 27 27 27 0 0 0 0
Congo Basin 316 078 308 864 305 316 301 807 -721 -0.23 -706 -0.23
Brunei Darussalam 413 397 389 380 -2 -0.39 -2 -0.44
Cambodia 12 944 11 546 10 731 10 094 -140 -1.14 -145 -1.33
Indonesia 118 545 99 409 97 857 94 432 -1 914 -1.75 -498 -0.51
Lao People's Democratic Republic 17 314 16 532 16 142 15 751 -78 -0.46 -78 -0.48
Malaysia 22 376 21 591 20 890 20 456 -79 -0.36 -114 -0.54
Myanmar 39 218 34 868 33 321 31 773 -435 -1.17 -310 -0.93
Papua New Guinea 31 523 30 133 29 437 28 726 -139 -0.45 -141 -0.48
Philippines 6 570 7 117 7 391 7 665 55 0.80 55 0.74
Singapore 2 2 2 2 0 0 0 0
Thailand 19 549 19 004 18 898 18 972 -55 -0.28 -3 -0.02
Viet Nam 9 363 11 725 13 077 13 797 236 2.28 207 1.64
Southeast Asia 277 817 252 324 248 135 242 048 -2 549 -0.96 -1 028 -0.41
Rainforest Basins 1 468 216 1 397 035 1 369 072 1 343 249 -7 118 -0.50 -5 379 -0.39
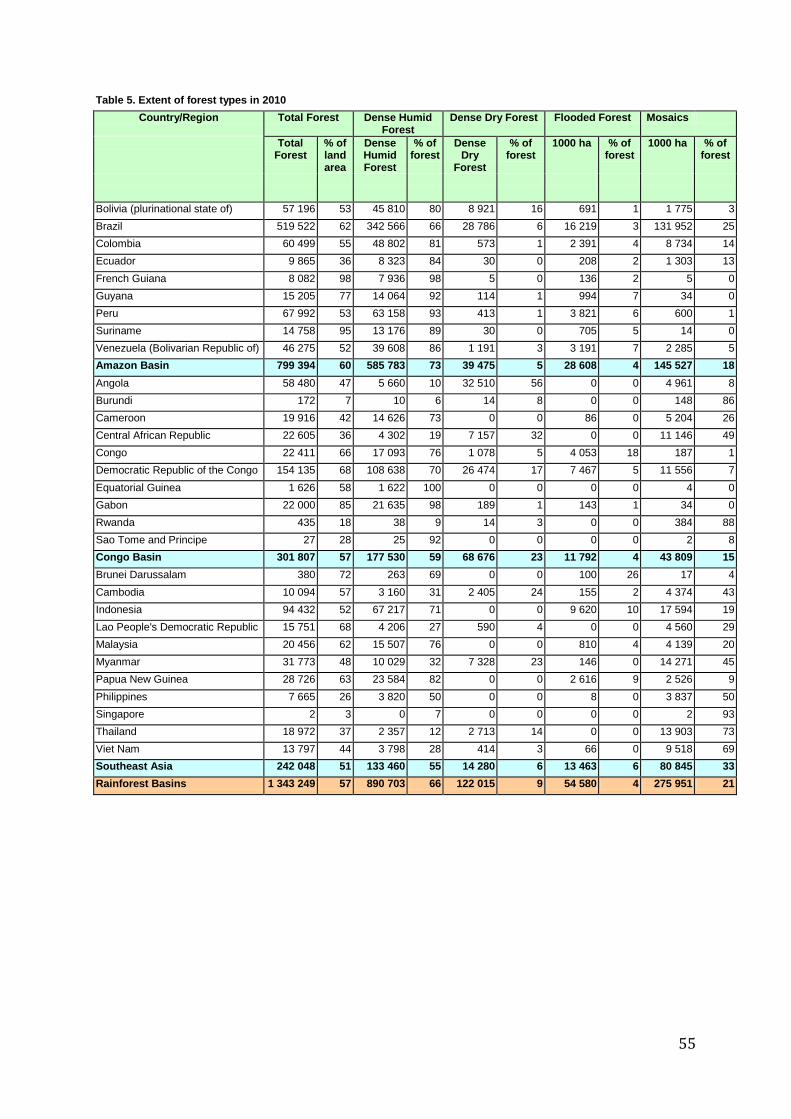
55
Table 5. Extent of forest types in 2010 Country/Region Total Forest Dense Humid
Forest Dense Dry Forest Flooded Forest Mosaics
Total Forest
% of land area
Dense Humid Forest
% of forest
Dense Dry
Forest
% of forest
1000 ha % of forest
1000 ha % of forest
Bolivia (plurinational state of) 57 196 53 45 810 80 8 921 16 691 1 1 775 3
Brazil 519 522 62 342 566 66 28 786 6 16 219 3 131 952 25
Colombia 60 499 55 48 802 81 573 1 2 391 4 8 734 14
Ecuador 9 865 36 8 323 84 30 0 208 2 1 303 13
French Guiana 8 082 98 7 936 98 5 0 136 2 5 0
Guyana 15 205 77 14 064 92 114 1 994 7 34 0
Peru 67 992 53 63 158 93 413 1 3 821 6 600 1
Suriname 14 758 95 13 176 89 30 0 705 5 14 0
Venezuela (Bolivarian Republic of) 46 275 52 39 608 86 1 191 3 3 191 7 2 285 5
Amazon Basin 799 394 60 585 783 73 39 475 5 28 608 4 145 527 18
Angola 58 480 47 5 660 10 32 510 56 0 0 4 961 8
Burundi 172 7 10 6 14 8 0 0 148 86
Cameroon 19 916 42 14 626 73 0 0 86 0 5 204 26
Central African Republic 22 605 36 4 302 19 7 157 32 0 0 11 146 49
Congo 22 411 66 17 093 76 1 078 5 4 053 18 187 1
Democratic Republic of the Congo 154 135 68 108 638 70 26 474 17 7 467 5 11 556 7
Equatorial Guinea 1 626 58 1 622 100 0 0 0 0 4 0
Gabon 22 000 85 21 635 98 189 1 143 1 34 0
Rwanda 435 18 38 9 14 3 0 0 384 88
Sao Tome and Principe 27 28 25 92 0 0 0 0 2 8
Congo Basin 301 807 57 177 530 59 68 676 23 11 792 4 43 809 15
Brunei Darussalam 380 72 263 69 0 0 100 26 17 4
Cambodia 10 094 57 3 160 31 2 405 24 155 2 4 374 43
Indonesia 94 432 52 67 217 71 0 0 9 620 10 17 594 19
Lao People's Democratic Republic 15 751 68 4 206 27 590 4 0 0 4 560 29
Malaysia 20 456 62 15 507 76 0 0 810 4 4 139 20
Myanmar 31 773 48 10 029 32 7 328 23 146 0 14 271 45
Papua New Guinea 28 726 63 23 584 82 0 0 2 616 9 2 526 9
Philippines 7 665 26 3 820 50 0 0 8 0 3 837 50
Singapore 2 3 0 7 0 0 0 0 2 93
Thailand 18 972 37 2 357 12 2 713 14 0 0 13 903 73
Viet Nam 13 797 44 3 798 28 414 3 66 0 9 518 69
Southeast Asia 242 048 51 133 460 55 14 280 6 13 463 6 80 845 33
Rainforest Basins 1 343 249 57 890 703 66 122 015 9 54 580 4 275 951 21
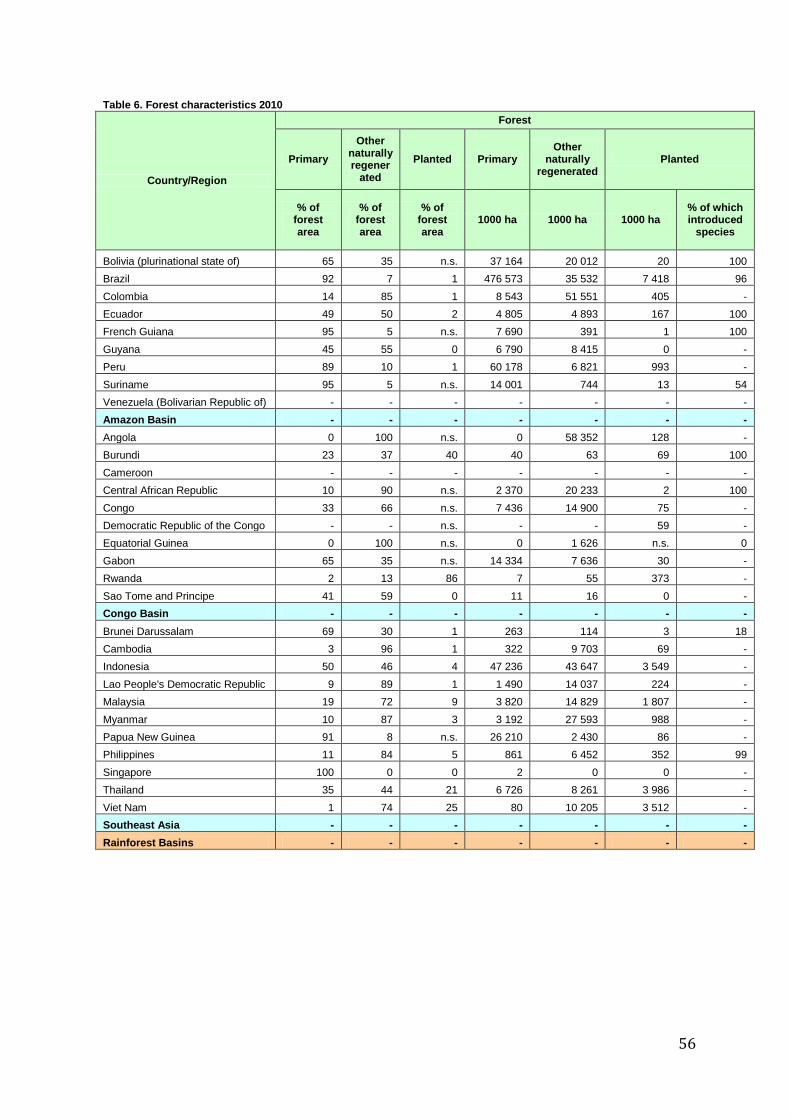
56
Table 6. Forest characteristics 2010
Country/Region
Forest
Primary
Other naturally regener
ated
Planted Primary Other
naturally regenerated
Planted
% of forest area
% of forest area
% of forest area
1000 ha 1000 ha 1000 ha % of which introduced
species
Bolivia (plurinational state of) 65 35 n.s. 37 164 20 012 20 100
Brazil 92 7 1 476 573 35 532 7 418 96
Colombia 14 85 1 8 543 51 551 405 -
Ecuador 49 50 2 4 805 4 893 167 100
French Guiana 95 5 n.s. 7 690 391 1 100
Guyana 45 55 0 6 790 8 415 0 -
Peru 89 10 1 60 178 6 821 993 -
Suriname 95 5 n.s. 14 001 744 13 54
Venezuela (Bolivarian Republic of) - - - - - - -
Amazon Basin - - - - - - -
Angola 0 100 n.s. 0 58 352 128 -
Burundi 23 37 40 40 63 69 100
Cameroon - - - - - - -
Central African Republic 10 90 n.s. 2 370 20 233 2 100
Congo 33 66 n.s. 7 436 14 900 75 -
Democratic Republic of the Congo - - n.s. - - 59 -
Equatorial Guinea 0 100 n.s. 0 1 626 n.s. 0
Gabon 65 35 n.s. 14 334 7 636 30 -
Rwanda 2 13 86 7 55 373 -
Sao Tome and Principe 41 59 0 11 16 0 -
Congo Basin - - - - - - -
Brunei Darussalam 69 30 1 263 114 3 18
Cambodia 3 96 1 322 9 703 69 -
Indonesia 50 46 4 47 236 43 647 3 549 -
Lao People's Democratic Republic 9 89 1 1 490 14 037 224 -
Malaysia 19 72 9 3 820 14 829 1 807 -
Myanmar 10 87 3 3 192 27 593 988 -
Papua New Guinea 91 8 n.s. 26 210 2 430 86 -
Philippines 11 84 5 861 6 452 352 99
Singapore 100 0 0 2 0 0 -
Thailand 35 44 21 6 726 8 261 3 986 -
Viet Nam 1 74 25 80 10 205 3 512 -
Southeast Asia - - - - - - -
Rainforest Basins - - - - - - -
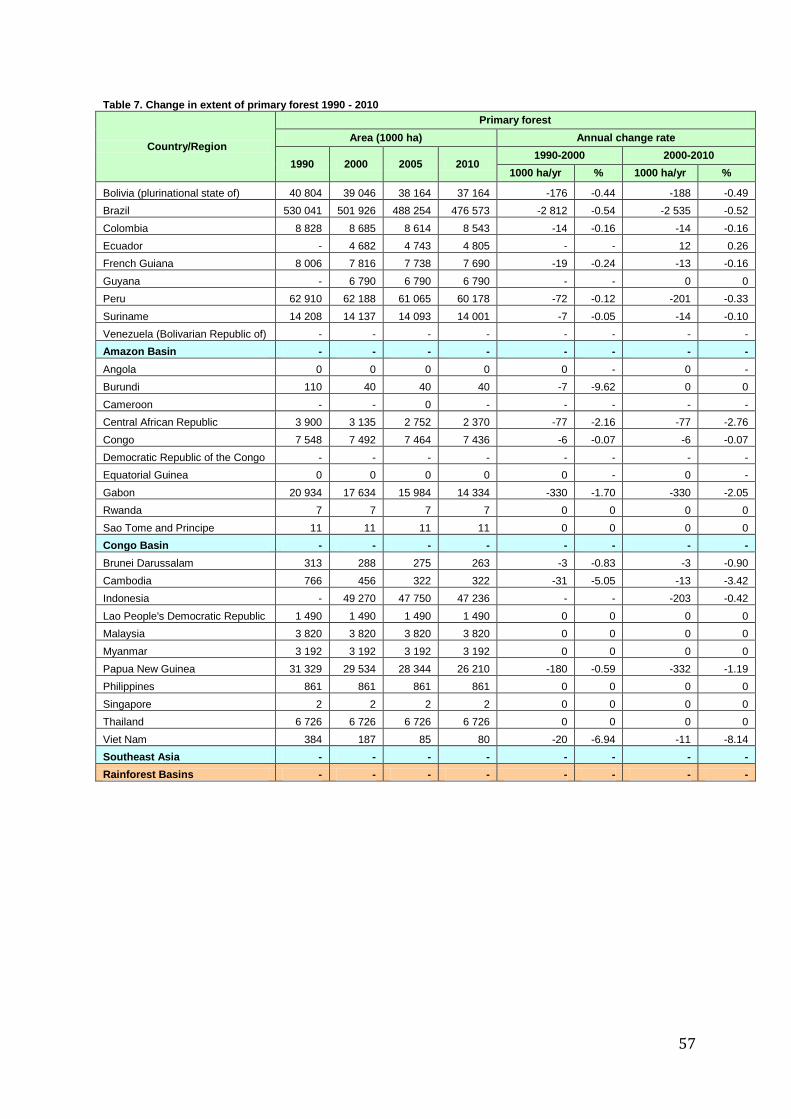
57
Table 7. Change in extent of primary forest 1990 - 2010
Country/Region
Primary forest
Area (1000 ha) Annual change rate
1990 2000 2005 2010 1990-2000 2000-2010
1000 ha/yr % 1000 ha/yr %
Bolivia (plurinational state of) 40 804 39 046 38 164 37 164 -176 -0.44 -188 -0.49
Brazil 530 041 501 926 488 254 476 573 -2 812 -0.54 -2 535 -0.52
Colombia 8 828 8 685 8 614 8 543 -14 -0.16 -14 -0.16
Ecuador - 4 682 4 743 4 805 - - 12 0.26
French Guiana 8 006 7 816 7 738 7 690 -19 -0.24 -13 -0.16
Guyana - 6 790 6 790 6 790 - - 0 0
Peru 62 910 62 188 61 065 60 178 -72 -0.12 -201 -0.33
Suriname 14 208 14 137 14 093 14 001 -7 -0.05 -14 -0.10
Venezuela (Bolivarian Republic of) - - - - - - - -
Amazon Basin - - - - - - - -
Angola 0 0 0 0 0 - 0 -
Burundi 110 40 40 40 -7 -9.62 0 0
Cameroon - - 0 - - - - -
Central African Republic 3 900 3 135 2 752 2 370 -77 -2.16 -77 -2.76
Congo 7 548 7 492 7 464 7 436 -6 -0.07 -6 -0.07
Democratic Republic of the Congo - - - - - - - -
Equatorial Guinea 0 0 0 0 0 - 0 -
Gabon 20 934 17 634 15 984 14 334 -330 -1.70 -330 -2.05
Rwanda 7 7 7 7 0 0 0 0
Sao Tome and Principe 11 11 11 11 0 0 0 0
Congo Basin - - - - - - - -
Brunei Darussalam 313 288 275 263 -3 -0.83 -3 -0.90
Cambodia 766 456 322 322 -31 -5.05 -13 -3.42
Indonesia - 49 270 47 750 47 236 - - -203 -0.42
Lao People's Democratic Republic 1 490 1 490 1 490 1 490 0 0 0 0
Malaysia 3 820 3 820 3 820 3 820 0 0 0 0
Myanmar 3 192 3 192 3 192 3 192 0 0 0 0
Papua New Guinea 31 329 29 534 28 344 26 210 -180 -0.59 -332 -1.19
Philippines 861 861 861 861 0 0 0 0
Singapore 2 2 2 2 0 0 0 0
Thailand 6 726 6 726 6 726 6 726 0 0 0 0
Viet Nam 384 187 85 80 -20 -6.94 -11 -8.14
Southeast Asia - - - - - - - -
Rainforest Basins - - - - - - - -

58
Table 8. Change in extent of planted forests 1990 - 2010
Country/Region
Planted forest
Area (1000 ha) Annual change rate
1990 2000 2005 2010 1990-2000 2000-2010
1000 ha/yr % 1000 ha/yr %
Bolivia (plurinational state of) 20 20 20 20 0 0 0 0
Brazil 4 984 5 176 5 765 7 418 19 0.38 224 3.66
Colombia 137 255 330 405 12 6.41 15 4.73
Ecuador - 161 165 167 - - 1 0.37
French Guiana 1 1 1 1 0 0 0 0
Guyana - 0 0 0 - - 0 -
Peru 263 715 754 993 45 10.52 28 3.34
Suriname 13 13 13 13 0 0 0 0
Venezuela (Bolivarian Republic of) - - - - - - - -
Amazon Basin - - - - - - - -
Angola 140 134 131 128 -1 -0.44 -1 -0.46
Burundi 0 86 78 69 9 - -2 -2.18
Cameroon - - 84 - - - - -
Central African Republic 2 2 2 2 0 0 0 0
Congo 51 51 51 75 0 0 2 3.93
Democratic Republic of the Congo 56 57 57 59 n.s. 0.18 0 0.36
Equatorial Guinea 0 n.s. n.s. n.s. n.s. - - -
Gabon 30 30 30 30 0 0 0 0
Rwanda 248 282 323 373 3 1.29 9 2.84
Sao Tome and Principe 0 0 0 0 0 - 0 -
Congo Basin - - - - - - - -
Brunei Darussalam 1 1 2 3 n.s. 6.93 0 7.46
Cambodia 67 79 74 69 1 1.66 -1 -1.34
Indonesia - 3 672 3 699 3 549 - - -12 -0.34
Lao People's Democratic Republic 3 99 224 224 10 41.86 13 8.51
Malaysia 1 956 1 659 1 573 1 807 -30 -1.63 15 0.86
Myanmar 394 696 849 988 30 5.85 29 3.57
Papua New Guinea 63 82 92 86 2 2.75 0 0.44
Philippines 302 327 340 352 3 0.80 3 0.74
Singapore 0 0 0 0 0 - 0 -
Thailand 2 668 3 111 3 444 3 986 44 1.55 88 2.51
Viet Nam 967 2 050 2 794 3 512 108 7.80 146 5.53
Southeast Asia - - - - - - - -
Rainforest Basins - - - - - - - -

59
Table 9. Forest growing stock and carbon stock 2010
Country/Region
Growing stock Carbon stock (million tonnes)
Total (million m
3)
m3/ha
Carbon in above-ground
biomass
Carbon in below-ground
biomass
Carbon in dead wood
Carbon in litter
Soil carbon
Bolivia (plurinational state of) 4 242 74 3 582 860 - 120 3 718
Brazil 126 221 243 52 745 9 862 3 871 2 283 52 277
Colombia 8 982 148 5 488 1 317 - - -
Ecuador - - - - - - -
French Guiana 2 829 350 1 344 307 115 - 727
Guyana 2 206 145 1 348 281 63 50 669
Peru 8 159 120 6 903 1 657 - 143 3 400
Suriname 3 389 230 2 553 612 - 31 694
Venezuela (Bolivarian Republic of) - - - - - - -
Amazon Basin - - - - - - -
Angola 2 266 39 3 536 849 - 123 2 047
Burundi 20 117 13 3 - n.s. 11
Cameroon 6 141 308 2 174 522 - 42 1 295
Central African Republic 3 776 167 2 307 554 - 47 1 469
Congo 4 539 203 2 773 665 - 47 1 053
Democratic Republic of the Congo 35 473 230 15 838 3 801 - 324 10 019
Equatorial Guinea 268 165 164 39 - 3 106
Gabon 4 895 223 2 186 524 - 46 1 430
Rwanda 79 182 32 8 - 1 20
Sao Tome and Principe 5 167 3 1 - n.s. 1
Congo Basin - - - - - - -
Brunei Darussalam 72 190 58 14 - 1 20
Cambodia 959 95 298 166 - - 384
Indonesia 11 343 120 9 787 3 230 - - -
Lao People's Democratic Republic 929 59 895 179 - 33 -
Malaysia 4 239 207 2 590 622 - 43 -
Myanmar 1 430 45 1 378 276 - 67 -
Papua New Guinea 2 726 95 1 922 384 - - -
Philippines 1 278 167 535 128 73 16 498
Singapore - - - - - - -
Thailand 783 41 693 187 - - -
Viet Nam 870 63 778 214 - 72 651
Southeast Asia - - - - - - -
Rainforest Basins - - - - - - -
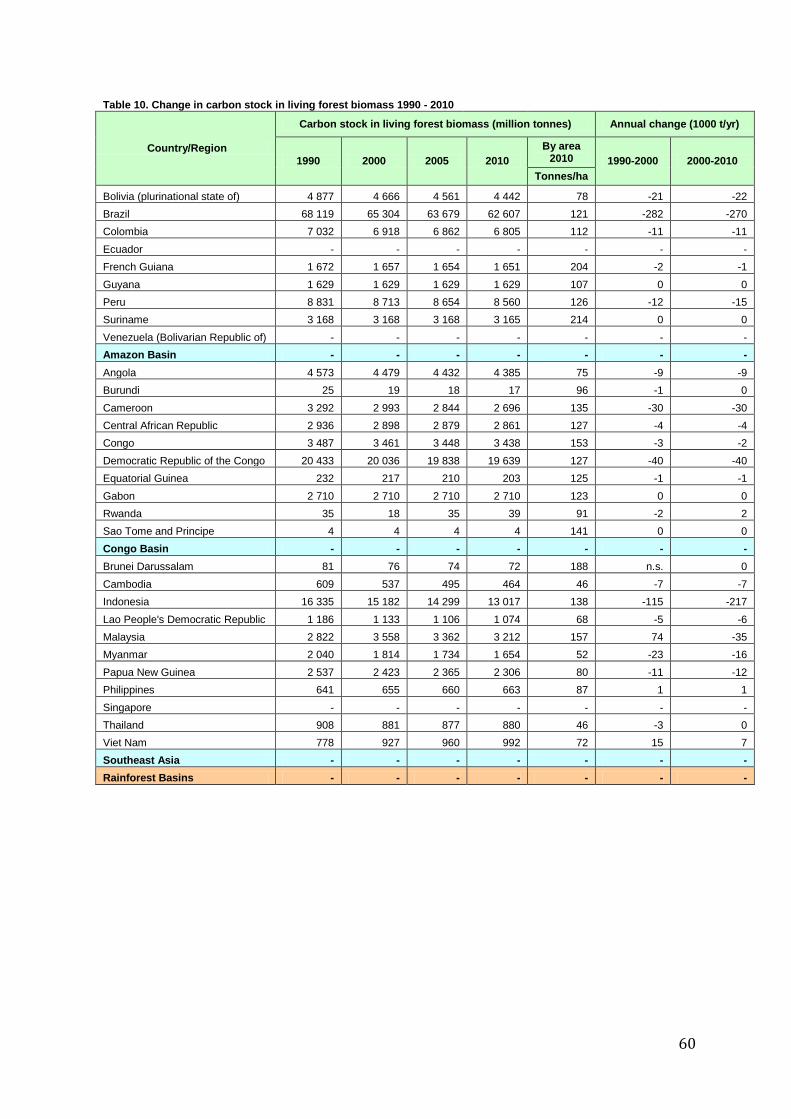
60
Table 10. Change in carbon stock in living forest biomass 1990 - 2010
Country/Region
Carbon stock in living forest biomass (million tonnes) Annual change (1000 t/yr)
1990 2000 2005 2010
By area 2010 1990-2000 2000-2010
Tonnes/ha
Bolivia (plurinational state of) 4 877 4 666 4 561 4 442 78 -21 -22
Brazil 68 119 65 304 63 679 62 607 121 -282 -270
Colombia 7 032 6 918 6 862 6 805 112 -11 -11
Ecuador - - - - - - -
French Guiana 1 672 1 657 1 654 1 651 204 -2 -1
Guyana 1 629 1 629 1 629 1 629 107 0 0
Peru 8 831 8 713 8 654 8 560 126 -12 -15
Suriname 3 168 3 168 3 168 3 165 214 0 0
Venezuela (Bolivarian Republic of) - - - - - - -
Amazon Basin - - - - - - -
Angola 4 573 4 479 4 432 4 385 75 -9 -9
Burundi 25 19 18 17 96 -1 0
Cameroon 3 292 2 993 2 844 2 696 135 -30 -30
Central African Republic 2 936 2 898 2 879 2 861 127 -4 -4
Congo 3 487 3 461 3 448 3 438 153 -3 -2
Democratic Republic of the Congo 20 433 20 036 19 838 19 639 127 -40 -40
Equatorial Guinea 232 217 210 203 125 -1 -1
Gabon 2 710 2 710 2 710 2 710 123 0 0
Rwanda 35 18 35 39 91 -2 2
Sao Tome and Principe 4 4 4 4 141 0 0
Congo Basin - - - - - - -
Brunei Darussalam 81 76 74 72 188 n.s. 0
Cambodia 609 537 495 464 46 -7 -7
Indonesia 16 335 15 182 14 299 13 017 138 -115 -217
Lao People's Democratic Republic 1 186 1 133 1 106 1 074 68 -5 -6
Malaysia 2 822 3 558 3 362 3 212 157 74 -35
Myanmar 2 040 1 814 1 734 1 654 52 -23 -16
Papua New Guinea 2 537 2 423 2 365 2 306 80 -11 -12
Philippines 641 655 660 663 87 1 1
Singapore - - - - - - -
Thailand 908 881 877 880 46 -3 0
Viet Nam 778 927 960 992 72 15 7
Southeast Asia - - - - - - -
Rainforest Basins - - - - - - -
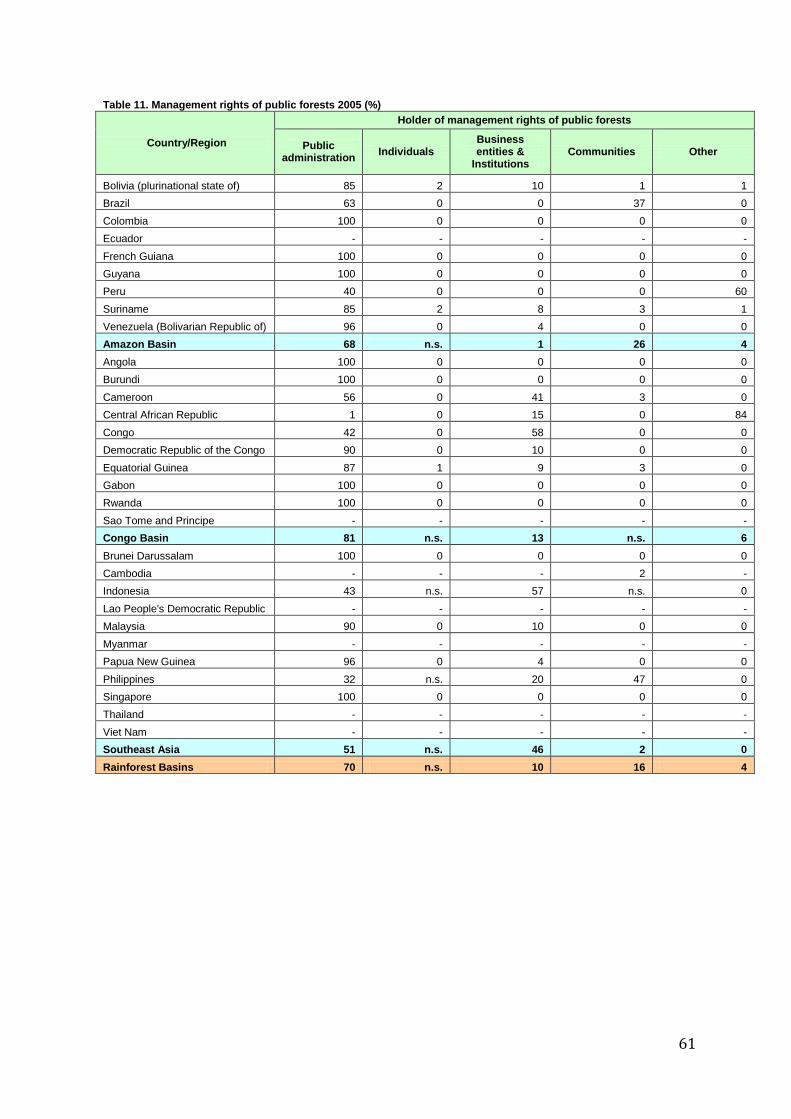
61
Table 11. Management rights of public forests 2005 (%)
Country/Region
Holder of management rights of public forests
Public administration
Individuals Business entities &
Institutions Communities Other
Bolivia (plurinational state of) 85 2 10 1 1
Brazil 63 0 0 37 0
Colombia 100 0 0 0 0
Ecuador - - - - -
French Guiana 100 0 0 0 0
Guyana 100 0 0 0 0
Peru 40 0 0 0 60
Suriname 85 2 8 3 1
Venezuela (Bolivarian Republic of) 96 0 4 0 0
Amazon Basin 68 n.s. 1 26 4
Angola 100 0 0 0 0
Burundi 100 0 0 0 0
Cameroon 56 0 41 3 0
Central African Republic 1 0 15 0 84
Congo 42 0 58 0 0
Democratic Republic of the Congo 90 0 10 0 0
Equatorial Guinea 87 1 9 3 0
Gabon 100 0 0 0 0
Rwanda 100 0 0 0 0
Sao Tome and Principe - - - - -
Congo Basin 81 n.s. 13 n.s. 6
Brunei Darussalam 100 0 0 0 0
Cambodia - - - 2 -
Indonesia 43 n.s. 57 n.s. 0
Lao People's Democratic Republic - - - - -
Malaysia 90 0 10 0 0
Myanmar - - - - -
Papua New Guinea 96 0 4 0 0
Philippines 32 n.s. 20 47 0
Singapore 100 0 0 0 0
Thailand - - - - -
Viet Nam - - - - -
Southeast Asia 51 n.s. 46 2 0
Rainforest Basins 70 n.s. 10 16 4
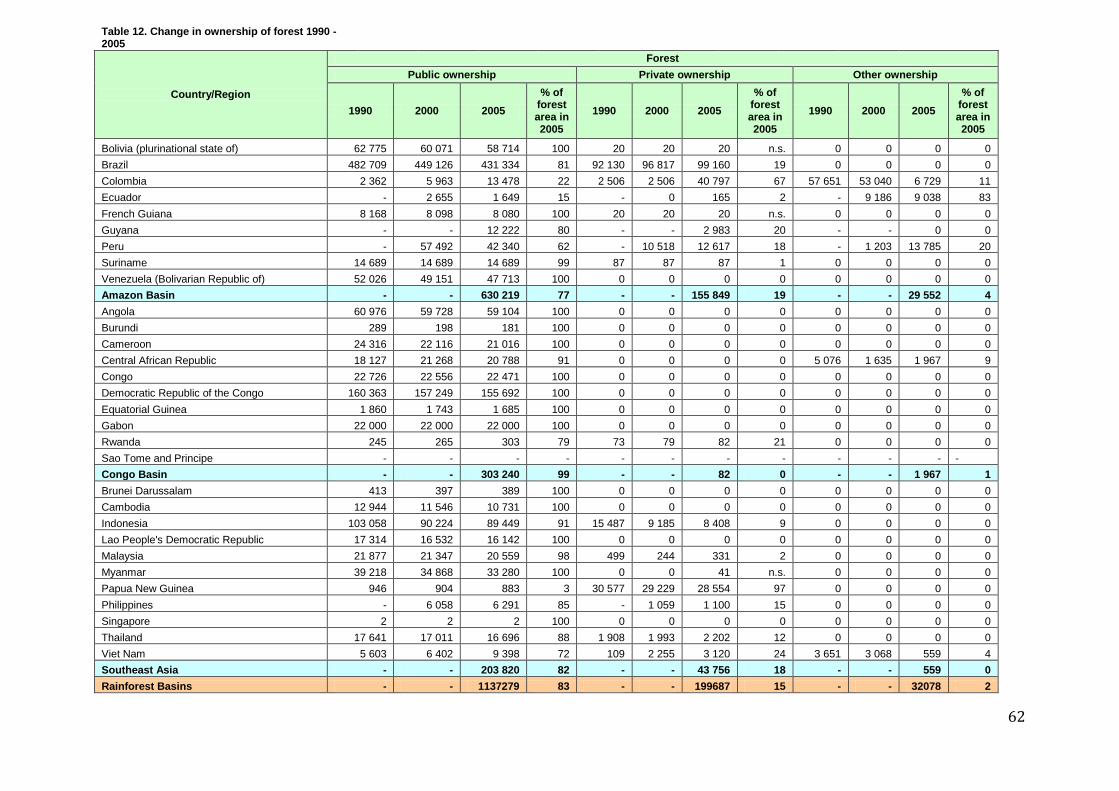
62
Table 12. Change in ownership of forest 1990 - 2005
Country/Region
Forest
Public ownership Private ownership Other ownership
1990 2000 2005
% of forest area in 2005
1990 2000 2005
% of forest area in 2005
1990 2000 2005
% of forest area in 2005
Bolivia (plurinational state of) 62 775 60 071 58 714 100 20 20 20 n.s. 0 0 0 0
Brazil 482 709 449 126 431 334 81 92 130 96 817 99 160 19 0 0 0 0
Colombia 2 362 5 963 13 478 22 2 506 2 506 40 797 67 57 651 53 040 6 729 11
Ecuador - 2 655 1 649 15 - 0 165 2 - 9 186 9 038 83
French Guiana 8 168 8 098 8 080 100 20 20 20 n.s. 0 0 0 0
Guyana - - 12 222 80 - - 2 983 20 - - 0 0
Peru - 57 492 42 340 62 - 10 518 12 617 18 - 1 203 13 785 20
Suriname 14 689 14 689 14 689 99 87 87 87 1 0 0 0 0
Venezuela (Bolivarian Republic of) 52 026 49 151 47 713 100 0 0 0 0 0 0 0 0
Amazon Basin - - 630 219 77 - - 155 849 19 - - 29 552 4
Angola 60 976 59 728 59 104 100 0 0 0 0 0 0 0 0
Burundi 289 198 181 100 0 0 0 0 0 0 0 0
Cameroon 24 316 22 116 21 016 100 0 0 0 0 0 0 0 0
Central African Republic 18 127 21 268 20 788 91 0 0 0 0 5 076 1 635 1 967 9
Congo 22 726 22 556 22 471 100 0 0 0 0 0 0 0 0
Democratic Republic of the Congo 160 363 157 249 155 692 100 0 0 0 0 0 0 0 0
Equatorial Guinea 1 860 1 743 1 685 100 0 0 0 0 0 0 0 0
Gabon 22 000 22 000 22 000 100 0 0 0 0 0 0 0 0
Rwanda 245 265 303 79 73 79 82 21 0 0 0 0
Sao Tome and Principe - - - - - - - - - - - -
Congo Basin - - 303 240 99 - - 82 0 - - 1 967 1
Brunei Darussalam 413 397 389 100 0 0 0 0 0 0 0 0
Cambodia 12 944 11 546 10 731 100 0 0 0 0 0 0 0 0
Indonesia 103 058 90 224 89 449 91 15 487 9 185 8 408 9 0 0 0 0
Lao People's Democratic Republic 17 314 16 532 16 142 100 0 0 0 0 0 0 0 0
Malaysia 21 877 21 347 20 559 98 499 244 331 2 0 0 0 0
Myanmar 39 218 34 868 33 280 100 0 0 41 n.s. 0 0 0 0
Papua New Guinea 946 904 883 3 30 577 29 229 28 554 97 0 0 0 0
Philippines - 6 058 6 291 85 - 1 059 1 100 15 0 0 0 0
Singapore 2 2 2 100 0 0 0 0 0 0 0 0
Thailand 17 641 17 011 16 696 88 1 908 1 993 2 202 12 0 0 0 0
Viet Nam 5 603 6 402 9 398 72 109 2 255 3 120 24 3 651 3 068 559 4
Southeast Asia - - 203 820 82 - - 43 756 18 - - 559 0
Rainforest Basins - - 1137279 83 - - 199687 15 - - 32078 2
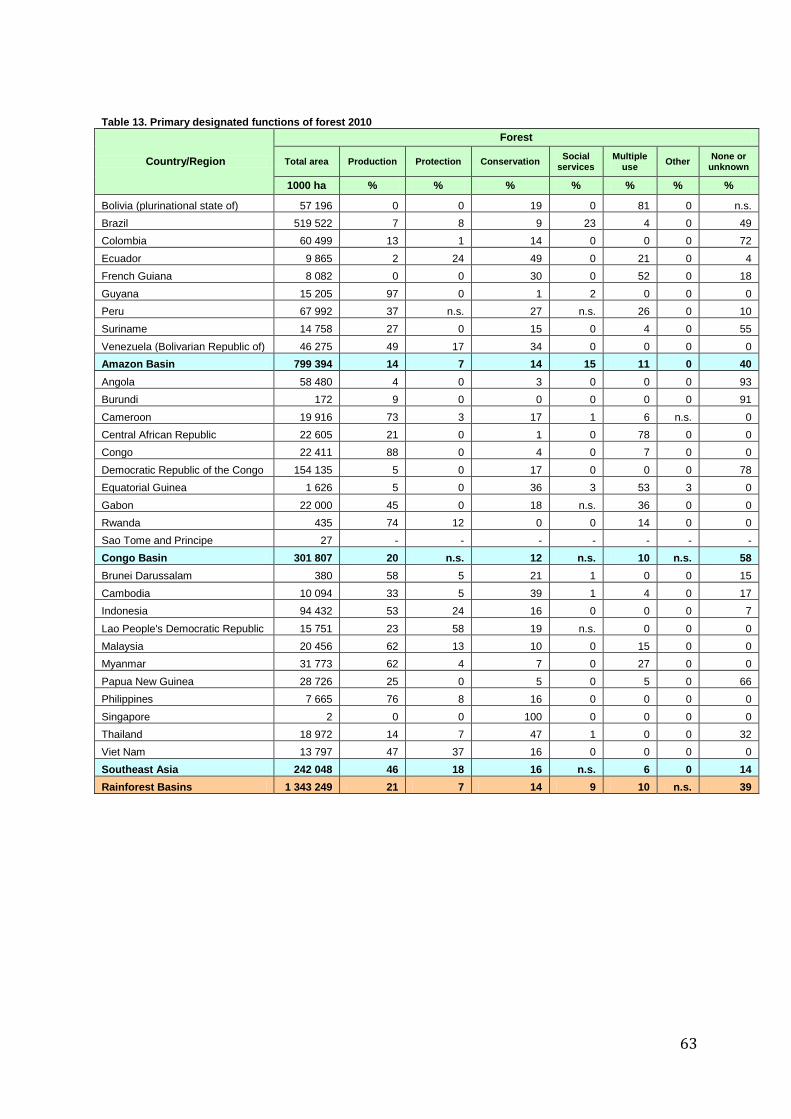
63
Table 13. Primary designated functions of forest 2010
Country/Region
Forest
Total area Production Protection Conservation Social
services Multiple
use Other
None or unknown
1000 ha % % % % % % %
Bolivia (plurinational state of) 57 196 0 0 19 0 81 0 n.s.
Brazil 519 522 7 8 9 23 4 0 49
Colombia 60 499 13 1 14 0 0 0 72
Ecuador 9 865 2 24 49 0 21 0 4
French Guiana 8 082 0 0 30 0 52 0 18
Guyana 15 205 97 0 1 2 0 0 0
Peru 67 992 37 n.s. 27 n.s. 26 0 10
Suriname 14 758 27 0 15 0 4 0 55
Venezuela (Bolivarian Republic of) 46 275 49 17 34 0 0 0 0
Amazon Basin 799 394 14 7 14 15 11 0 40
Angola 58 480 4 0 3 0 0 0 93
Burundi 172 9 0 0 0 0 0 91
Cameroon 19 916 73 3 17 1 6 n.s. 0
Central African Republic 22 605 21 0 1 0 78 0 0
Congo 22 411 88 0 4 0 7 0 0
Democratic Republic of the Congo 154 135 5 0 17 0 0 0 78
Equatorial Guinea 1 626 5 0 36 3 53 3 0
Gabon 22 000 45 0 18 n.s. 36 0 0
Rwanda 435 74 12 0 0 14 0 0
Sao Tome and Principe 27 - - - - - - -
Congo Basin 301 807 20 n.s. 12 n.s. 10 n.s. 58
Brunei Darussalam 380 58 5 21 1 0 0 15
Cambodia 10 094 33 5 39 1 4 0 17
Indonesia 94 432 53 24 16 0 0 0 7
Lao People's Democratic Republic 15 751 23 58 19 n.s. 0 0 0
Malaysia 20 456 62 13 10 0 15 0 0
Myanmar 31 773 62 4 7 0 27 0 0
Papua New Guinea 28 726 25 0 5 0 5 0 66
Philippines 7 665 76 8 16 0 0 0 0
Singapore 2 0 0 100 0 0 0 0
Thailand 18 972 14 7 47 1 0 0 32
Viet Nam 13 797 47 37 16 0 0 0 0
Southeast Asia 242 048 46 18 16 n.s. 6 0 14
Rainforest Basins 1 343 249 21 7 14 9 10 n.s. 39
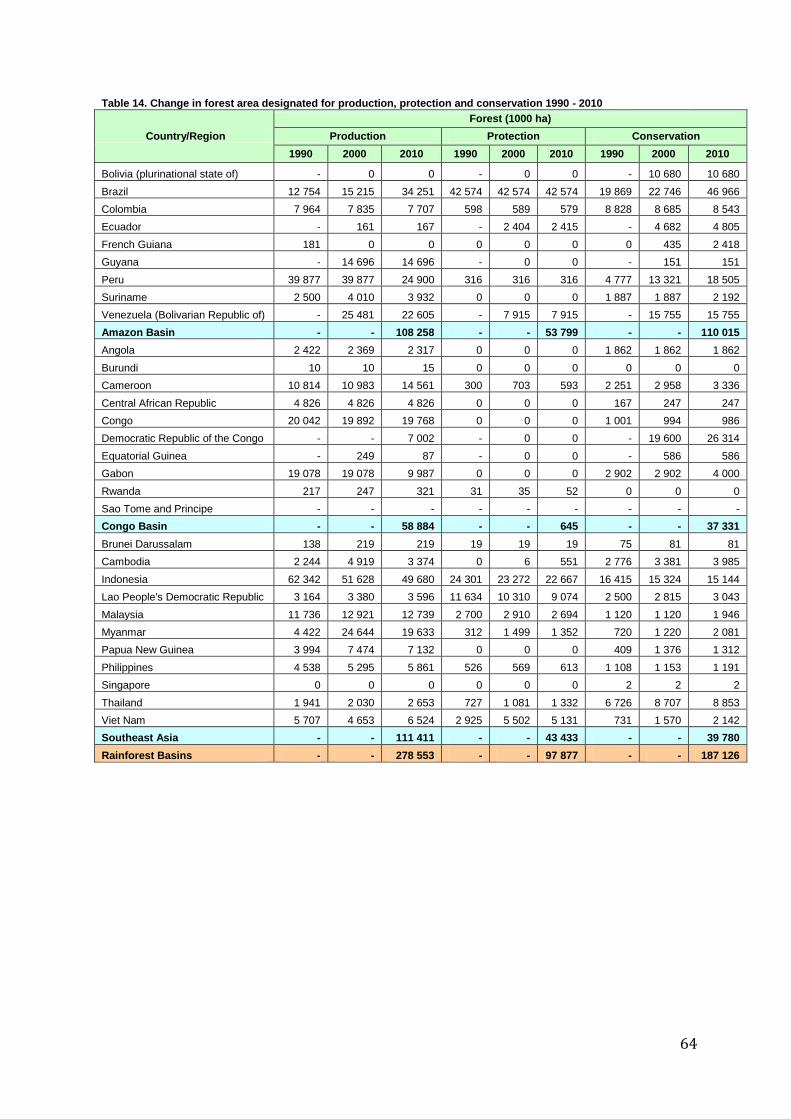
64
Table 14. Change in forest area designated for production, protection and conservation 1990 - 2010
Country/Region
Forest (1000 ha)
Production Protection Conservation
1990 2000 2010 1990 2000 2010 1990 2000 2010
Bolivia (plurinational state of) - 0 0 - 0 0 - 10 680 10 680
Brazil 12 754 15 215 34 251 42 574 42 574 42 574 19 869 22 746 46 966
Colombia 7 964 7 835 7 707 598 589 579 8 828 8 685 8 543
Ecuador - 161 167 - 2 404 2 415 - 4 682 4 805
French Guiana 181 0 0 0 0 0 0 435 2 418
Guyana - 14 696 14 696 - 0 0 - 151 151
Peru 39 877 39 877 24 900 316 316 316 4 777 13 321 18 505
Suriname 2 500 4 010 3 932 0 0 0 1 887 1 887 2 192
Venezuela (Bolivarian Republic of) - 25 481 22 605 - 7 915 7 915 - 15 755 15 755
Amazon Basin - - 108 258 - - 53 799 - - 110 015
Angola 2 422 2 369 2 317 0 0 0 1 862 1 862 1 862
Burundi 10 10 15 0 0 0 0 0 0
Cameroon 10 814 10 983 14 561 300 703 593 2 251 2 958 3 336
Central African Republic 4 826 4 826 4 826 0 0 0 167 247 247
Congo 20 042 19 892 19 768 0 0 0 1 001 994 986
Democratic Republic of the Congo - - 7 002 - 0 0 - 19 600 26 314
Equatorial Guinea - 249 87 - 0 0 - 586 586
Gabon 19 078 19 078 9 987 0 0 0 2 902 2 902 4 000
Rwanda 217 247 321 31 35 52 0 0 0
Sao Tome and Principe - - - - - - - - -
Congo Basin - - 58 884 - - 645 - - 37 331
Brunei Darussalam 138 219 219 19 19 19 75 81 81
Cambodia 2 244 4 919 3 374 0 6 551 2 776 3 381 3 985
Indonesia 62 342 51 628 49 680 24 301 23 272 22 667 16 415 15 324 15 144
Lao People's Democratic Republic 3 164 3 380 3 596 11 634 10 310 9 074 2 500 2 815 3 043
Malaysia 11 736 12 921 12 739 2 700 2 910 2 694 1 120 1 120 1 946
Myanmar 4 422 24 644 19 633 312 1 499 1 352 720 1 220 2 081
Papua New Guinea 3 994 7 474 7 132 0 0 0 409 1 376 1 312
Philippines 4 538 5 295 5 861 526 569 613 1 108 1 153 1 191
Singapore 0 0 0 0 0 0 2 2 2
Thailand 1 941 2 030 2 653 727 1 081 1 332 6 726 8 707 8 853
Viet Nam 5 707 4 653 6 524 2 925 5 502 5 131 731 1 570 2 142
Southeast Asia - - 111 411 - - 43 433 - - 39 780
Rainforest Basins - - 278 553 - - 97 877 - - 187 126

65
Table 15. Change in removal of wood products 1990 - 2009
Country/Region
Wood removals (1000 m3 under bark)
Industrial roundwood Woodfuel
Total volume Total volume
1990 2000 2005 2009 1990 2000 2005 2009
Bolivia (plurinational state of) 372 468 810 910 1 921 2 142 2 251 2 329
Brazil 74 277 102 994 117 987 122 160 120 301 132 408 137 756 141 989
Colombia 3 683 2 164 1 626 2 390 6 766 10 893 10 301 8 826
Ecuador 3 531 546 1 211 1 940 3 113 5 129 5 507 4 090
French Guiana 188 60 72 93 45 75 100 122
Guyana 150 289 497 458 916 880 863 851
Peru 1 073 1 511 1 742 1 347 6 518 7 777 7 364 7 343
Suriname 106 181 182 208 38 43 45 47
Venezuela (Bolivarian Republic of) 938 1 103 1 443 2 348 2 990 3 605 3 843 4 011
Amazon Basin 84 318 109 316 125 570 131 854 142 608 162 951 168 031 169 608
Angola 843 1 096 1 096 1 096 2 342 3 163 3 574 3 917
Burundi 49 333 333 333 5 844 5 420 8 542 9 111
Cameroon 3 136 1 894 1 800 2 616 7 648 9 111 9 485 9 818
Central African Republic 425 955 832 841 3 055 2 000 2 000 0
Congo 1 598 1 362 2 181 2 431 974 1 153 1 369 0
Democratic Republic of the Congo 3 053 3 674 4 198 4 452 44 183 64 903 71 066 75 446
Equatorial Guinea 187 689 419 419 447 447 447 190
Gabon 1 633 2 584 3 200 3 400 452 515 1 070 1 070
Rwanda 20 400 495 1 212 3 000 5 000 5 000 1 865
Sao Tome and Principe 9 9 9 9 79 96 102 106
Congo Basin 10 953 12 996 14 563 16 809 68 024 91 809 102 655 101 525
Brunei Darussalam 215 117 112 112 11 12 12 12
Cambodia 567 179 113 118 11 228 10 119 9 221 8 586
Indonesia 38 366 33 497 37 572 36 354 126 043 88 981 73 720 62 341
Lao People's Democratic Republic 455 567 194 218 5 627 5 872 5 944 5 946
Malaysia 41 260 24 380 25 186 20 126 4 010 3 346 3 068 2 858
Myanmar 3 653 3 612 4 262 4 262 17 645 34 471 38 286 38 286
Papua New Guinea 2 655 2 309 2 614 3 040 5 533 5 533 5 533 5 533
Philippines 4 928 3 079 3 129 3 798 15 176 13 615 12 950 12 469
Singapore 0 0 0 0 0 0 0 0
Thailand 3 093 6 262 8 700 8 700 21 807 20 553 19 866 19 398
Viet Nam 4 669 4 183 4 754 5 850 26 534 26 686 26 350 22 000
Southeast Asia 99 861 78 184 86 635 82 577 233 614 209 187 194 950 177 429
Rainforest Basins 195 131 200 496 226 768 231 240 444 246 463 946 465 636 448 562

66
Table 16. Formal employment in forestry sector, 2006
Country/Region
Roundwood production
(1 000)
Wood processing
(1 000)
Pulp and paper (1 000)
Total for the forestry sector (1 000)
(1 000) (1 000) (1 000) (1 000) (% of total
labour force)
Bolivia (Plurinational State of) 4 3 2 9 0.2
Brazil * 306 503 201 1 010 1.2
Colombia 3 4 18 25 0.1
Ecuador 13 4 7 24 0.4
French Guiana * n.s. n.s. – n.s. 0.3
Guyana 3 5 – 8 1.9
Peru 19 6 6 31 0.3
Suriname 1 3 n.s. 4 2.2
Venezuela (Bolivarian Republic of) 8 25 33 66 0.5
Amazon Basin 358 553 267 1 178 0.9
Angola 2 1 n.s. 3 n.s.
Burundi n.s. 2 n.s. 2 n.s.
Cameroon 12 8 1 20 0.3
Central African Republic 2 2 n.s. 4 0.2
Congo 4 3 n.s. 7 0.5
Democratic Republic of the Congo 6 n.s. – 6 n.s.
Equatorial Guinea 1 n.s. – 1 0.5
Gabon 8 4 n.s. 12 1.9
Rwanda 1 1 – 1 n.s.
Sao Tome and Principe – – – – –
Congo Basin 36 20 1 57 0.1
Brunei Darussalam 1 n.s. – 2 0.9
Cambodia n.s. 1 n.s. 1 n.s.
Indonesia 69 148 104 321 0.3
Lao People's Democratic Republic 1 2 n.s. 3 0.1
Malaysia 88 126 35 248 2.3
Myanmar 24 21 3 48 0.2
Papua New Guinea 8 4 – 12 0.4
Philippines 8 20 21 49 0.1
Singapore 0 2 4 6 0.3
Thailand 8 62 67 137 0.4
Viet Nam 22 120 70 212 0.5
Southeast Asia 230 506 304 1 039 0.4
Rainforest Basins 624 1 078 571 2 274 0.5
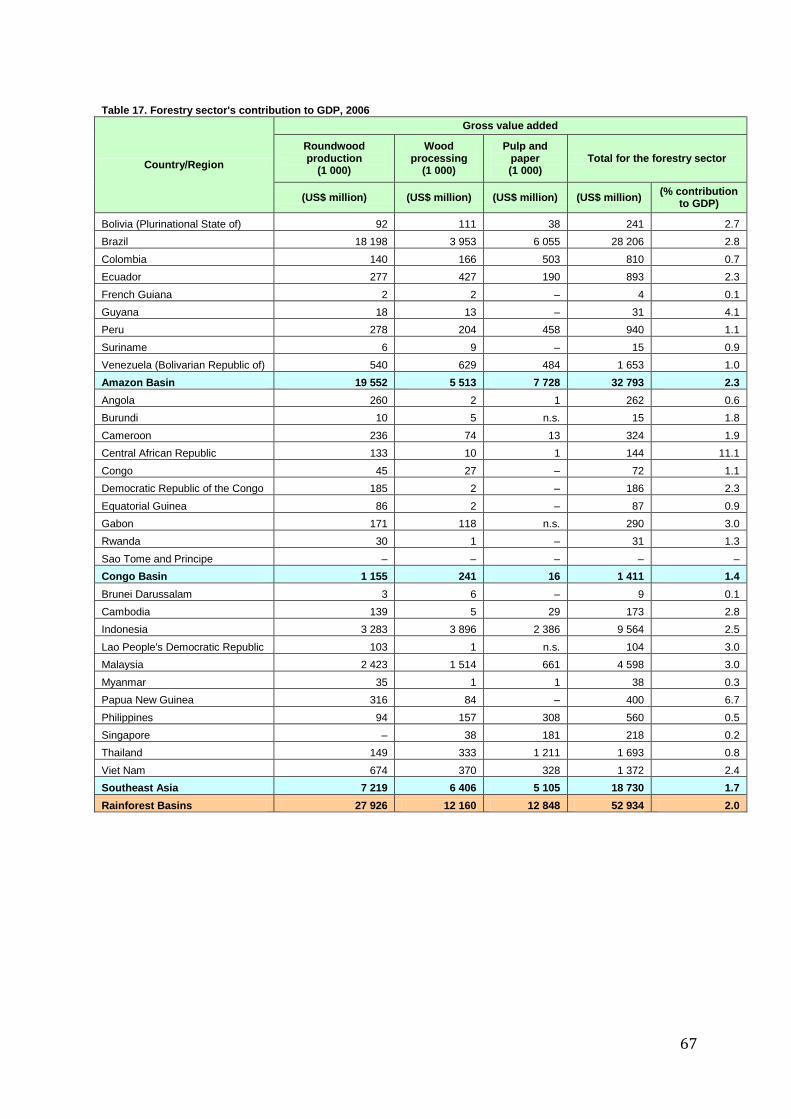
67
Table 17. Forestry sector's contribution to GDP, 2006
Country/Region
Gross value added
Roundwood production
(1 000)
Wood processing
(1 000)
Pulp and paper (1 000)
Total for the forestry sector
(US$ million) (US$ million) (US$ million) (US$ million) (% contribution
to GDP)
Bolivia (Plurinational State of) 92 111 38 241 2.7
Brazil 18 198 3 953 6 055 28 206 2.8
Colombia 140 166 503 810 0.7
Ecuador 277 427 190 893 2.3
French Guiana 2 2 – 4 0.1
Guyana 18 13 – 31 4.1
Peru 278 204 458 940 1.1
Suriname 6 9 – 15 0.9
Venezuela (Bolivarian Republic of) 540 629 484 1 653 1.0
Amazon Basin 19 552 5 513 7 728 32 793 2.3
Angola 260 2 1 262 0.6
Burundi 10 5 n.s. 15 1.8
Cameroon 236 74 13 324 1.9
Central African Republic 133 10 1 144 11.1
Congo 45 27 – 72 1.1
Democratic Republic of the Congo 185 2 – 186 2.3
Equatorial Guinea 86 2 – 87 0.9
Gabon 171 118 n.s. 290 3.0
Rwanda 30 1 – 31 1.3
Sao Tome and Principe – – – – –
Congo Basin 1 155 241 16 1 411 1.4
Brunei Darussalam 3 6 – 9 0.1
Cambodia 139 5 29 173 2.8
Indonesia 3 283 3 896 2 386 9 564 2.5
Lao People's Democratic Republic 103 1 n.s. 104 3.0
Malaysia 2 423 1 514 661 4 598 3.0
Myanmar 35 1 1 38 0.3
Papua New Guinea 316 84 – 400 6.7
Philippines 94 157 308 560 0.5
Singapore – 38 181 218 0.2
Thailand 149 333 1 211 1 693 0.8
Viet Nam 674 370 328 1 372 2.4
Southeast Asia 7 219 6 406 5 105 18 730 1.7
Rainforest Basins 27 926 12 160 12 848 52 934 2.0
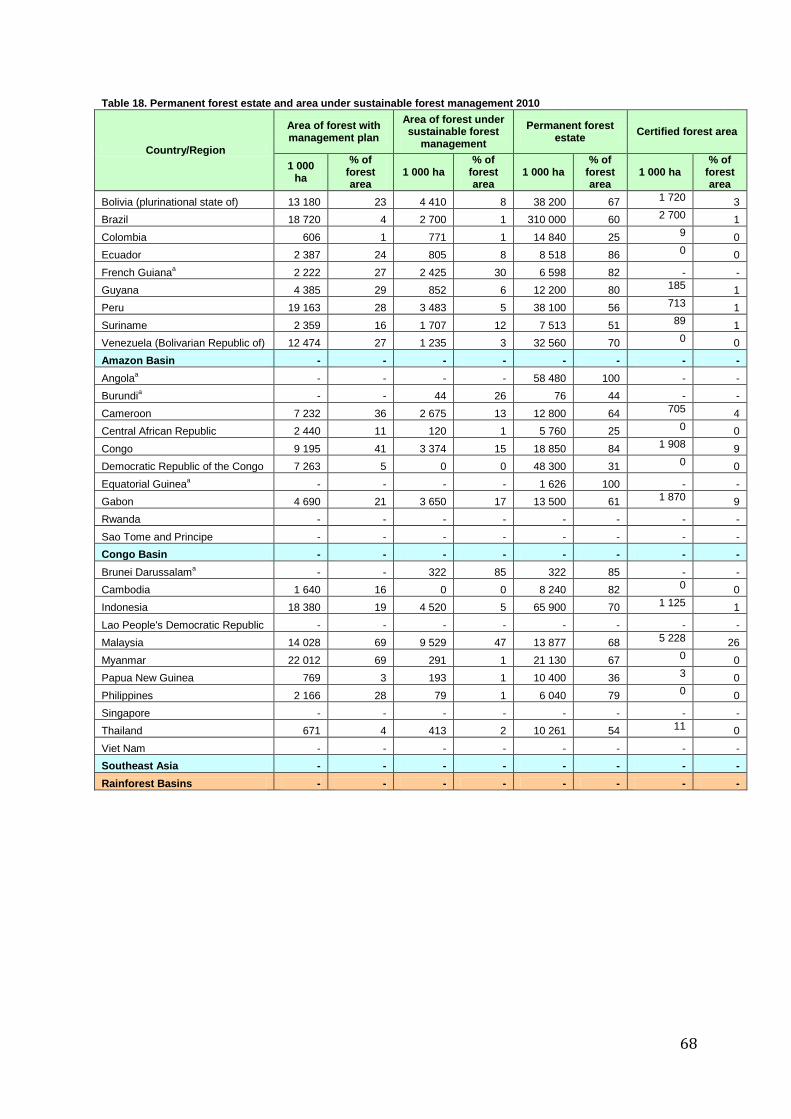
68
Table 18. Permanent forest estate and area under sustainable forest management 2010
Country/Region
Area of forest with management plan
Area of forest under sustainable forest
management
Permanent forest estate
Certified forest area
1 000 ha
% of forest area
1 000 ha % of
forest area
1 000 ha % of
forest area
1 000 ha % of
forest area
Bolivia (plurinational state of) 13 180 23 4 410 8 38 200 67 1 720 3
Brazil 18 720 4 2 700 1 310 000 60 2 700 1
Colombia 606 1 771 1 14 840 25 9 0
Ecuador 2 387 24 805 8 8 518 86 0 0
French Guianaa 2 222 27 2 425 30 6 598 82 - -
Guyana 4 385 29 852 6 12 200 80 185 1
Peru 19 163 28 3 483 5 38 100 56 713 1
Suriname 2 359 16 1 707 12 7 513 51 89 1
Venezuela (Bolivarian Republic of) 12 474 27 1 235 3 32 560 70 0 0
Amazon Basin - - - - - - - -
Angolaa - - - - 58 480 100 - -
Burundia - - 44 26 76 44 - -
Cameroon 7 232 36 2 675 13 12 800 64 705 4
Central African Republic 2 440 11 120 1 5 760 25 0 0
Congo 9 195 41 3 374 15 18 850 84 1 908 9
Democratic Republic of the Congo 7 263 5 0 0 48 300 31 0 0
Equatorial Guineaa - - - - 1 626 100 - -
Gabon 4 690 21 3 650 17 13 500 61 1 870 9
Rwanda - - - - - - - -
Sao Tome and Principe - - - - - - - -
Congo Basin - - - - - - - -
Brunei Darussalama - - 322 85 322 85 - -
Cambodia 1 640 16 0 0 8 240 82 0 0
Indonesia 18 380 19 4 520 5 65 900 70 1 125 1
Lao People's Democratic Republic - - - - - - - -
Malaysia 14 028 69 9 529 47 13 877 68 5 228 26
Myanmar 22 012 69 291 1 21 130 67 0 0
Papua New Guinea 769 3 193 1 10 400 36 3 0
Philippines 2 166 28 79 1 6 040 79 0 0
Singapore - - - - - - - -
Thailand 671 4 413 2 10 261 54 11 0
Viet Nam - - - - - - - -
Southeast Asia - - - - - - - -
Rainforest Basins - - - - - - - -
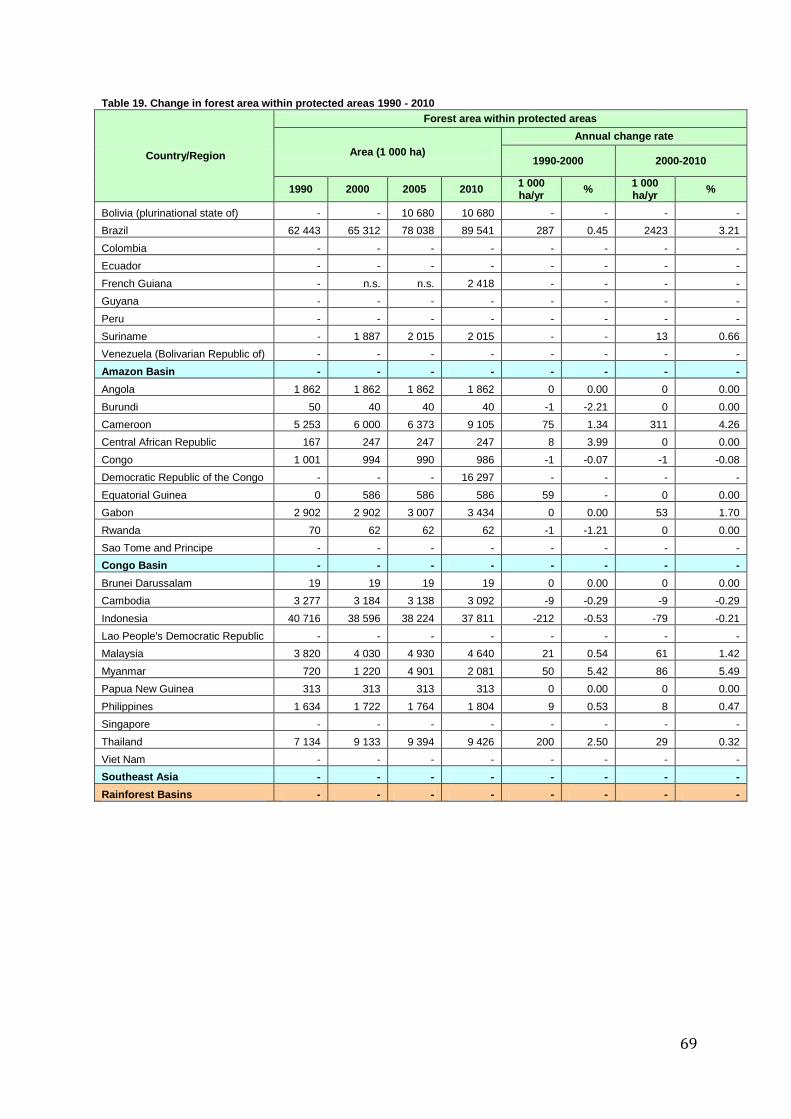
69
Table 19. Change in forest area within protected areas 1990 - 2010
Country/Region
Forest area within protected areas
Area (1 000 ha)
Annual change rate
1990-2000 2000-2010
1990 2000 2005 2010 1 000 ha/yr
% 1 000 ha/yr
%
Bolivia (plurinational state of) - - 10 680 10 680 - - - -
Brazil 62 443 65 312 78 038 89 541 287 0.45 2423 3.21
Colombia - - - - - - - -
Ecuador - - - - - - - -
French Guiana - n.s. n.s. 2 418 - - - -
Guyana - - - - - - - -
Peru - - - - - - - -
Suriname - 1 887 2 015 2 015 - - 13 0.66
Venezuela (Bolivarian Republic of) - - - - - - - -
Amazon Basin - - - - - - - -
Angola 1 862 1 862 1 862 1 862 0 0.00 0 0.00
Burundi 50 40 40 40 -1 -2.21 0 0.00
Cameroon 5 253 6 000 6 373 9 105 75 1.34 311 4.26
Central African Republic 167 247 247 247 8 3.99 0 0.00
Congo 1 001 994 990 986 -1 -0.07 -1 -0.08
Democratic Republic of the Congo - - - 16 297 - - - -
Equatorial Guinea 0 586 586 586 59 - 0 0.00
Gabon 2 902 2 902 3 007 3 434 0 0.00 53 1.70
Rwanda 70 62 62 62 -1 -1.21 0 0.00
Sao Tome and Principe - - - - - - - -
Congo Basin - - - - - - - -
Brunei Darussalam 19 19 19 19 0 0.00 0 0.00
Cambodia 3 277 3 184 3 138 3 092 -9 -0.29 -9 -0.29
Indonesia 40 716 38 596 38 224 37 811 -212 -0.53 -79 -0.21
Lao People's Democratic Republic - - - - - - - -
Malaysia 3 820 4 030 4 930 4 640 21 0.54 61 1.42
Myanmar 720 1 220 4 901 2 081 50 5.42 86 5.49
Papua New Guinea 313 313 313 313 0 0.00 0 0.00
Philippines 1 634 1 722 1 764 1 804 9 0.53 8 0.47
Singapore - - - - - - - -
Thailand 7 134 9 133 9 394 9 426 200 2.50 29 0.32
Viet Nam - - - - - - - -
Southeast Asia - - - - - - - -
Rainforest Basins - - - - - - - -
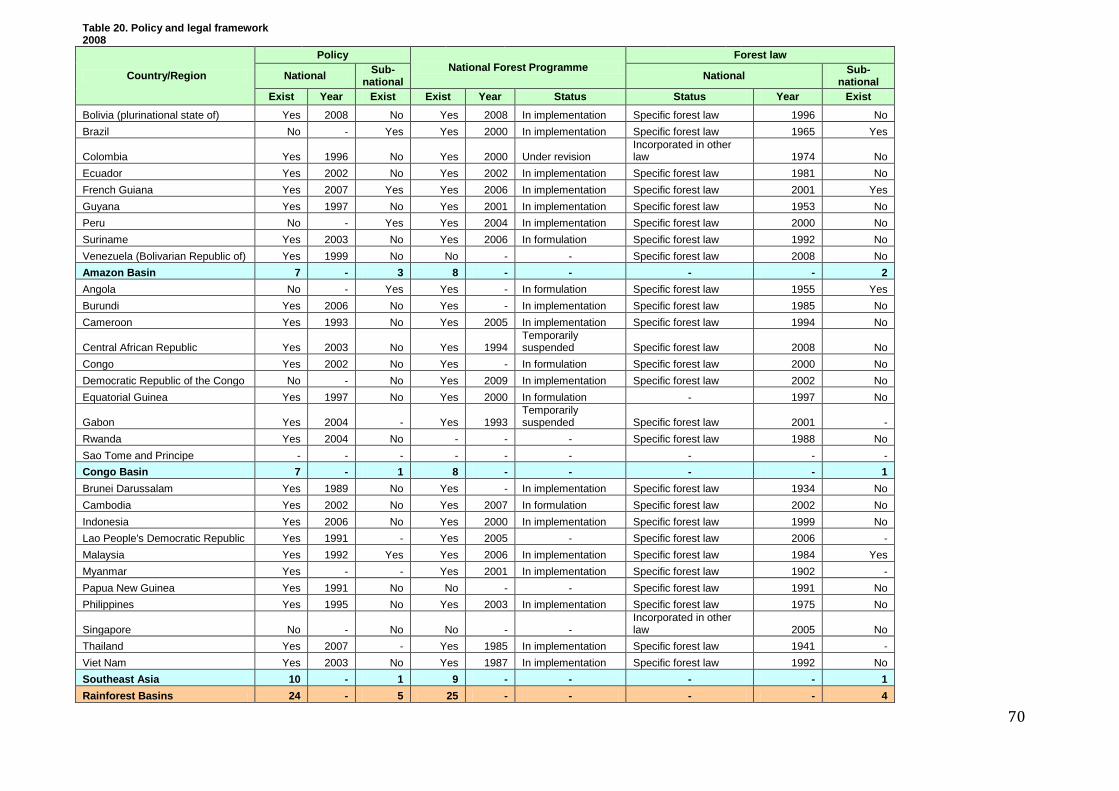
70
Table 20. Policy and legal framework 2008
Country/Region
Policy National Forest Programme
Forest law
National Sub-
national National
Sub-national
Exist Year Exist Exist Year Status Status Year Exist
Bolivia (plurinational state of) Yes 2008 No Yes 2008 In implementation Specific forest law 1996 No
Brazil No - Yes Yes 2000 In implementation Specific forest law 1965 Yes
Colombia Yes 1996 No Yes 2000 Under revision Incorporated in other law 1974 No
Ecuador Yes 2002 No Yes 2002 In implementation Specific forest law 1981 No
French Guiana Yes 2007 Yes Yes 2006 In implementation Specific forest law 2001 Yes
Guyana Yes 1997 No Yes 2001 In implementation Specific forest law 1953 No
Peru No - Yes Yes 2004 In implementation Specific forest law 2000 No
Suriname Yes 2003 No Yes 2006 In formulation Specific forest law 1992 No
Venezuela (Bolivarian Republic of) Yes 1999 No No - - Specific forest law 2008 No
Amazon Basin 7 - 3 8 - - - - 2
Angola No - Yes Yes - In formulation Specific forest law 1955 Yes
Burundi Yes 2006 No Yes - In implementation Specific forest law 1985 No
Cameroon Yes 1993 No Yes 2005 In implementation Specific forest law 1994 No
Central African Republic Yes 2003 No Yes 1994 Temporarily suspended Specific forest law 2008 No
Congo Yes 2002 No Yes - In formulation Specific forest law 2000 No
Democratic Republic of the Congo No - No Yes 2009 In implementation Specific forest law 2002 No
Equatorial Guinea Yes 1997 No Yes 2000 In formulation - 1997 No
Gabon Yes 2004 - Yes 1993 Temporarily suspended Specific forest law 2001 -
Rwanda Yes 2004 No - - - Specific forest law 1988 No
Sao Tome and Principe - - - - - - - - -
Congo Basin 7 - 1 8 - - - - 1
Brunei Darussalam Yes 1989 No Yes - In implementation Specific forest law 1934 No
Cambodia Yes 2002 No Yes 2007 In formulation Specific forest law 2002 No
Indonesia Yes 2006 No Yes 2000 In implementation Specific forest law 1999 No
Lao People's Democratic Republic Yes 1991 - Yes 2005 - Specific forest law 2006 -
Malaysia Yes 1992 Yes Yes 2006 In implementation Specific forest law 1984 Yes
Myanmar Yes - - Yes 2001 In implementation Specific forest law 1902 -
Papua New Guinea Yes 1991 No No - - Specific forest law 1991 No
Philippines Yes 1995 No Yes 2003 In implementation Specific forest law 1975 No
Singapore No - No No - - Incorporated in other law 2005 No
Thailand Yes 2007 - Yes 1985 In implementation Specific forest law 1941 -
Viet Nam Yes 2003 No Yes 1987 In implementation Specific forest law 1992 No
Southeast Asia 10 - 1 9 - - - - 1
Rainforest Basins 24 - 5 25 - - - - 4
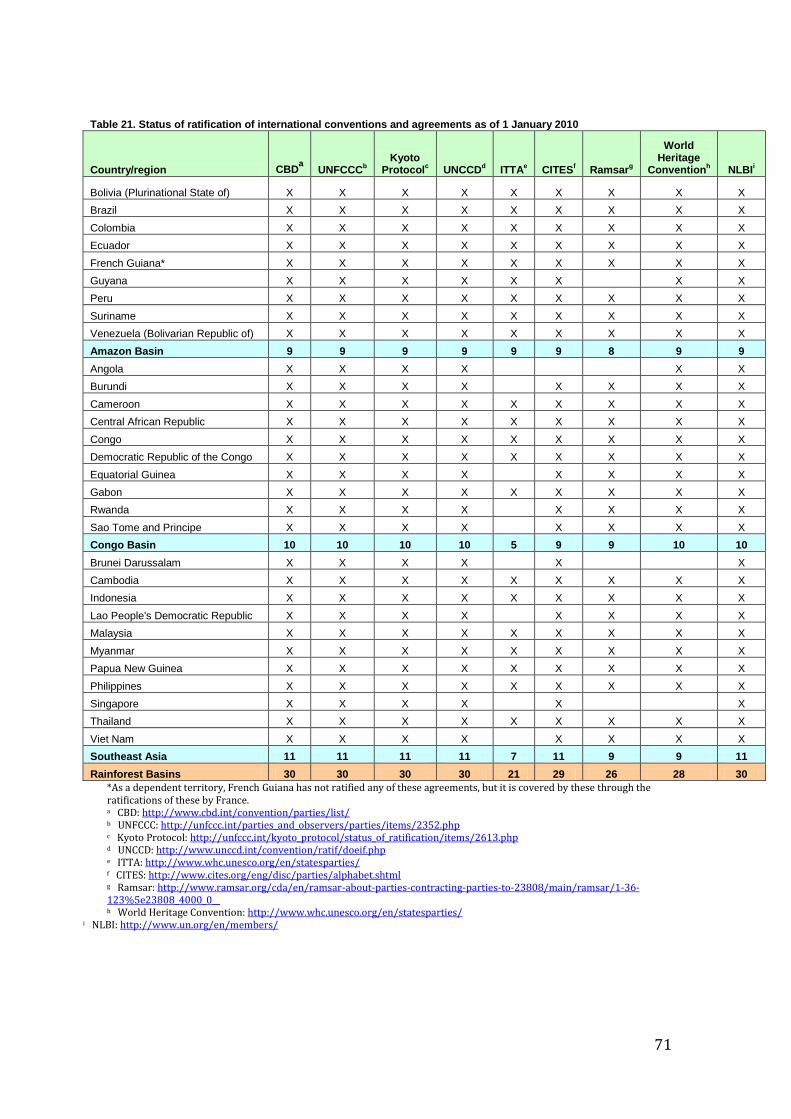
71
Table 21. Status of ratification of international conventions and agreements as of 1 January 2010
Country/region CBDa UNFCCC
b
Kyoto Protocol
c UNCCD
d ITTA
e CITES
f Ramsar
g
World Heritage
Conventionh NLBI
i
Bolivia (Plurinational State of) X X X X X X X X X
Brazil X X X X X X X X X
Colombia X X X X X X X X X
Ecuador X X X X X X X X X
French Guiana* X X X X X X X X X
Guyana X X X X X X X X
Peru X X X X X X X X X
Suriname X X X X X X X X X
Venezuela (Bolivarian Republic of) X X X X X X X X X
Amazon Basin 9 9 9 9 9 9 8 9 9
Angola X X X X X X
Burundi X X X X X X X X
Cameroon X X X X X X X X X
Central African Republic X X X X X X X X X
Congo X X X X X X X X X
Democratic Republic of the Congo X X X X X X X X X
Equatorial Guinea X X X X X X X X
Gabon X X X X X X X X X
Rwanda X X X X X X X X
Sao Tome and Principe X X X X X X X X
Congo Basin 10 10 10 10 5 9 9 10 10
Brunei Darussalam X X X X X X
Cambodia X X X X X X X X X
Indonesia X X X X X X X X X
Lao People's Democratic Republic X X X X X X X X
Malaysia X X X X X X X X X
Myanmar X X X X X X X X X
Papua New Guinea X X X X X X X X X
Philippines X X X X X X X X X
Singapore X X X X X X
Thailand X X X X X X X X X
Viet Nam X X X X X X X X
Southeast Asia 11 11 11 11 7 11 9 9 11
Rainforest Basins 30 30 30 30 21 29 26 28 30
*As a dependent territory, French Guiana has not ratified any of these agreements, but it is covered by these through the ratifications of these by France. a CBD: http://www.cbd.int/convention/parties/list/ b UNFCCC: http://unfccc.int/parties_and_observers/parties/items/2352.php c Kyoto Protocol: http://unfccc.int/kyoto_protocol/status_of_ratification/items/2613.php d UNCCD: http://www.unccd.int/convention/ratif/doeif.php e ITTA: http://www.whc.unesco.org/en/statesparties/ f CITES: http://www.cites.org/eng/disc/parties/alphabet.shtml g Ramsar: http://www.ramsar.org/cda/en/ramsar-about-parties-contracting-parties-to-23808/main/ramsar/1-36-123%5e23808_4000_0__ h World Heritage Convention: http://www.whc.unesco.org/en/statesparties/
i NLBI: http://www.un.org/en/members/
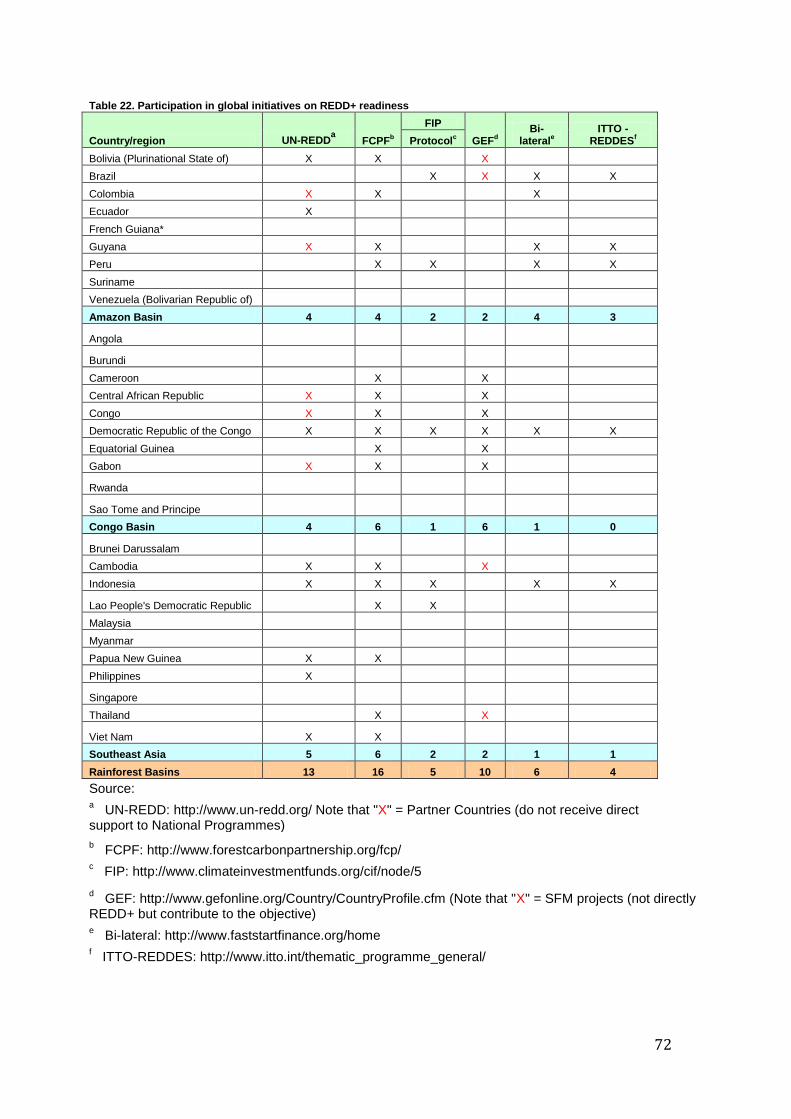
72
Table 22. Participation in global initiatives on REDD+ readiness
Country/region UN-REDDa FCPF
b
FIP
GEFd
Bi-lateral
e
ITTO - REDDES
f Protocol
c
Bolivia (Plurinational State of) X X X
Brazil X X X X
Colombia X X X
Ecuador X
French Guiana*
Guyana X X X X
Peru X X X X
Suriname
Venezuela (Bolivarian Republic of)
Amazon Basin 4 4 2 2 4 3
Angola
Burundi
Cameroon X X
Central African Republic X X X
Congo X X X
Democratic Republic of the Congo X X X X X X
Equatorial Guinea X X
Gabon X X X
Rwanda
Sao Tome and Principe
Congo Basin 4 6 1 6 1 0
Brunei Darussalam
Cambodia X X X
Indonesia X X X X X
Lao People's Democratic Republic X X
Malaysia
Myanmar
Papua New Guinea X X
Philippines X
Singapore
Thailand X X
Viet Nam X X
Southeast Asia 5 6 2 2 1 1
Rainforest Basins 13 16 5 10 6 4
Source: a UN-REDD: http://www.un-redd.org/ Note that "X" = Partner Countries (do not receive direct
support to National Programmes)
b FCPF: http://www.forestcarbonpartnership.org/fcp/
c FIP: http://www.climateinvestmentfunds.org/cif/node/5
d GEF: http://www.gefonline.org/Country/CountryProfile.cfm (Note that "X" = SFM projects (not directly
REDD+ but contribute to the objective) e Bi-lateral: http://www.faststartfinance.org/home
f ITTO-REDDES: http://www.itto.int/thematic_programme_general/