the regional nutrition situation - ncr, philippines
DESCRIPTION
Presentation of Dr. Milagros Elisa V. Federizo (Regional Nutrition Program Coordinator of NCR)TRANSCRIPT
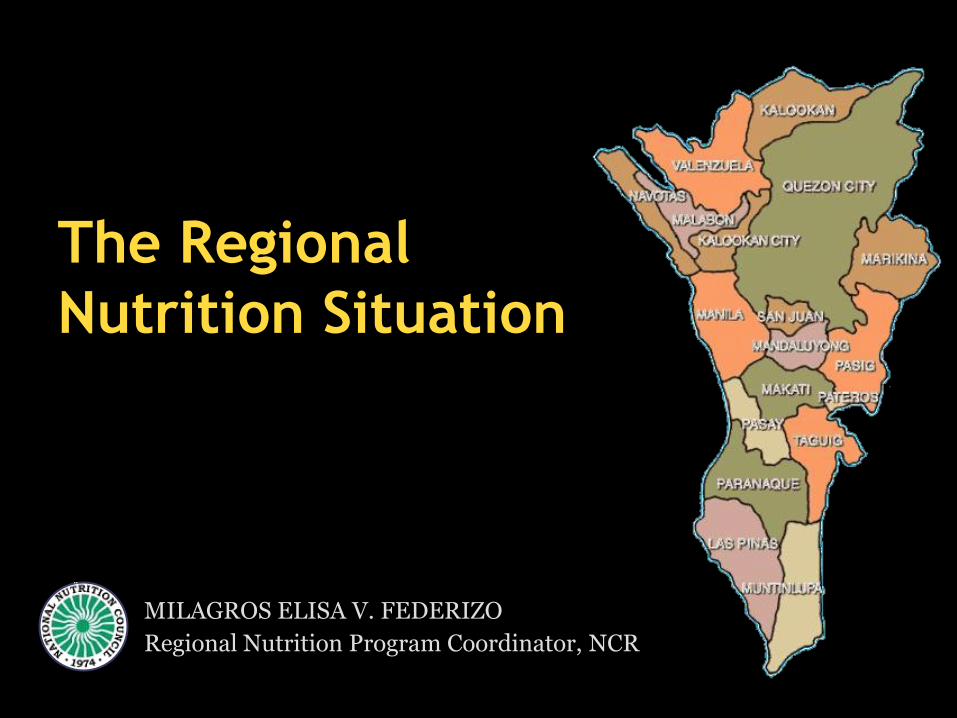
The Regional
Nutrition Situation
MILAGROS ELISA V. FEDERIZO
Regional Nutrition Program Coordinator, NCR
Why are we here?
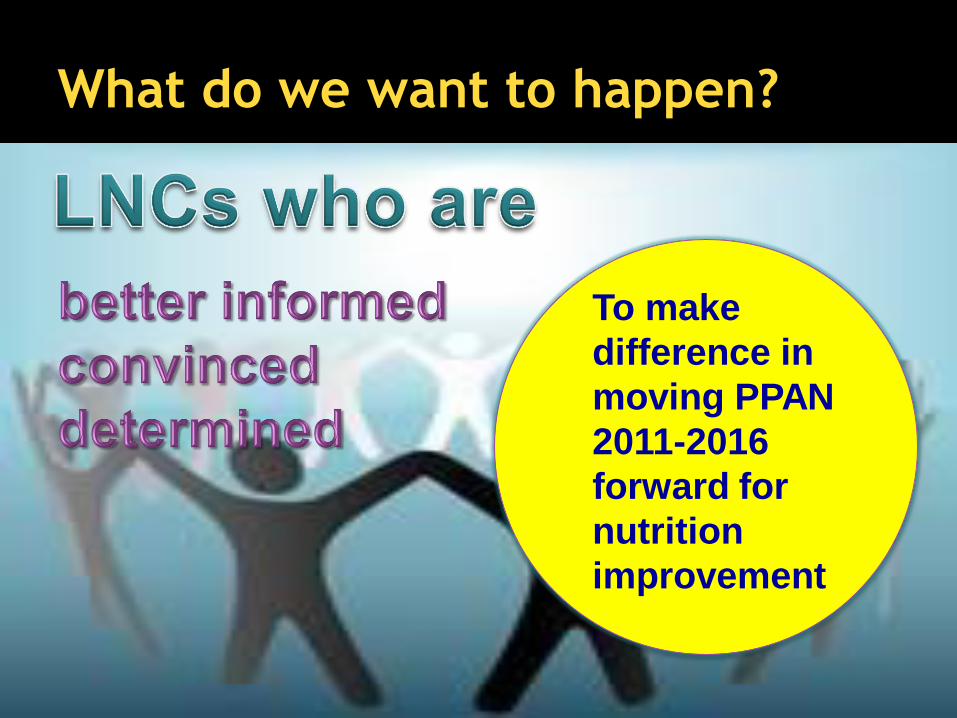
What do we want to happen?
To make
difference in
moving PPAN
2011-2016
forward for
nutrition
improvement
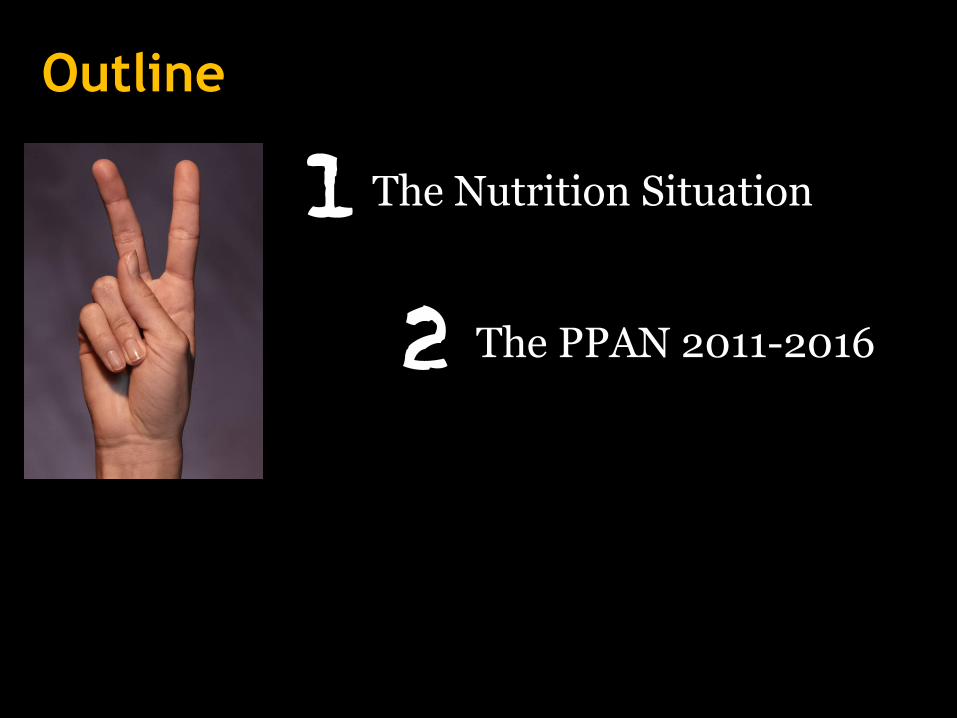
Outline
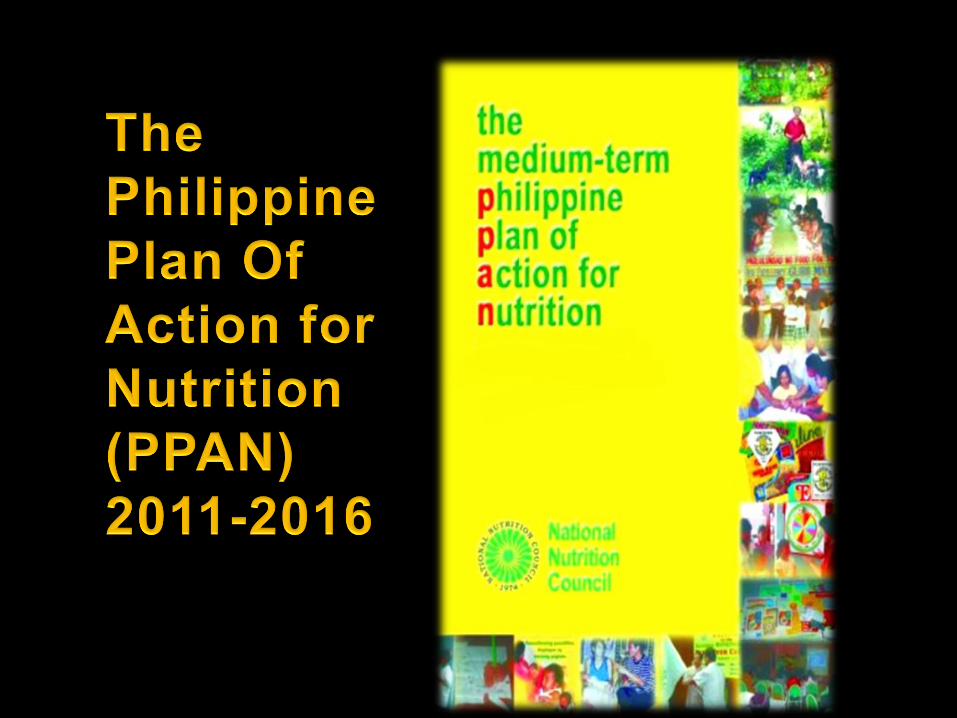
The PPAN 2011-2016
1 The Nutrition Situation
2

Why invest in
Nutrition?
Challenge 1. Hunger
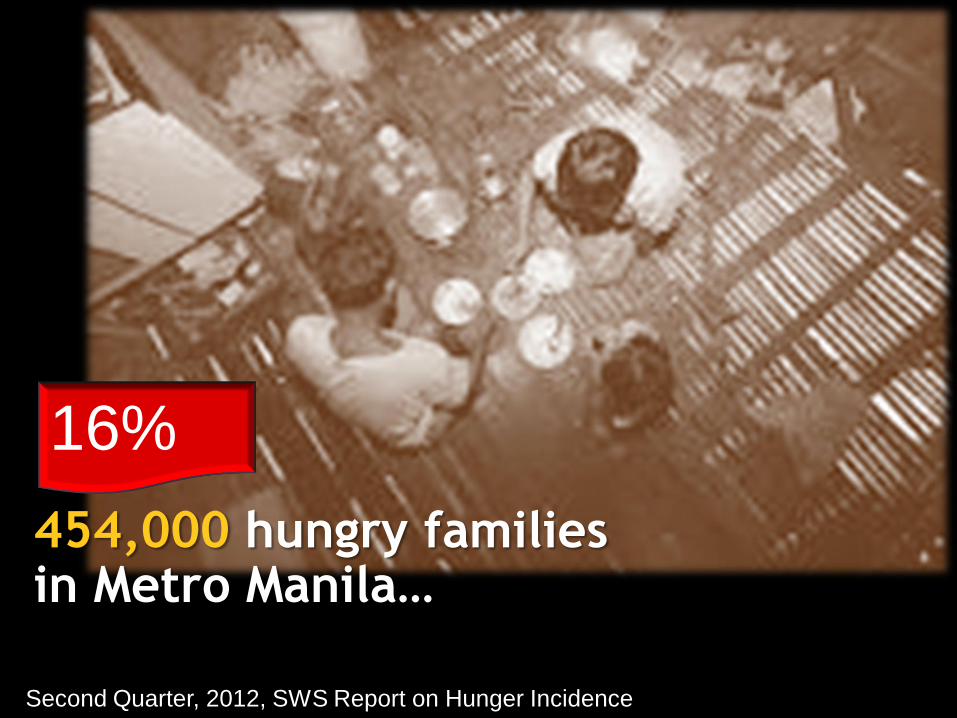
454,000 hungry families in Metro Manila…
Second Quarter, 2012, SWS Report on Hunger Incidence
16%
Challenge 2. Undernutrition
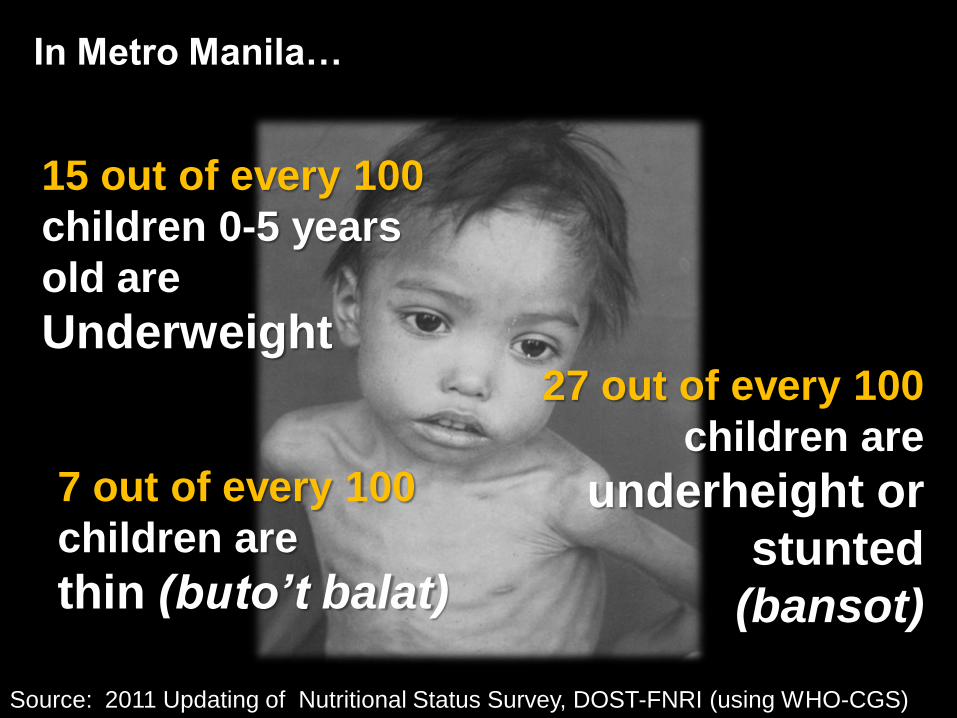
15 out of every 100
children 0-5 years
old are
Underweight
In Metro Manila…
27 out of every 100
children are
underheight or
stunted
(bansot)
7 out of every 100
children are
thin (buto’t balat)
Source: 2011 Updating of Nutritional Status Survey, DOST-FNRI (using WHO-CGS)
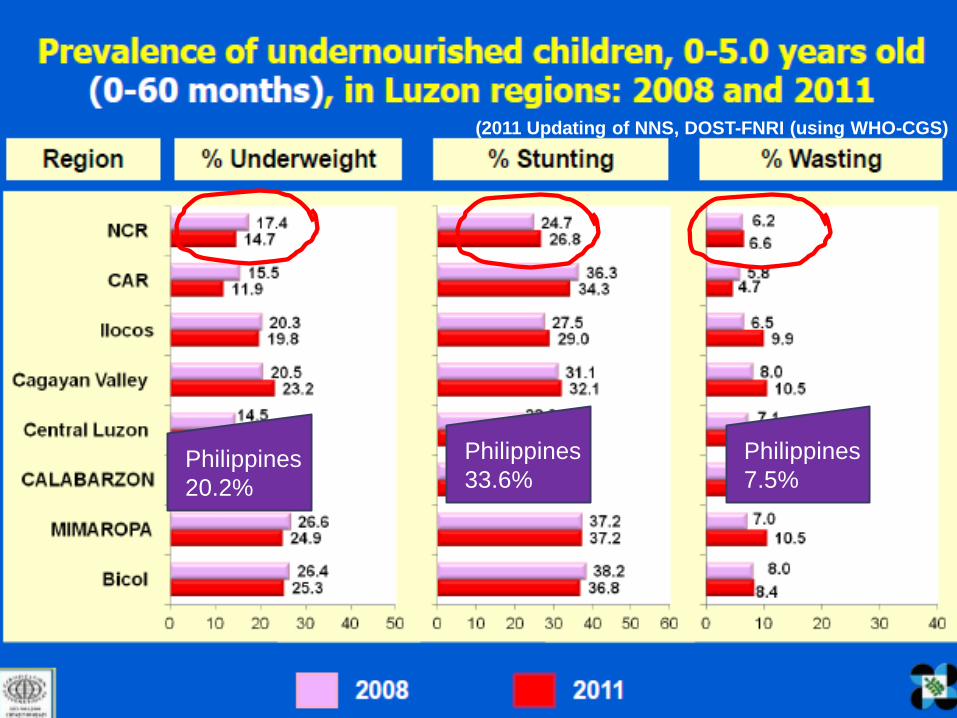
Philippines
20.2%
Philippines
33.6%
Philippines
7.5%
(2011 Updating of NNS, DOST-FNRI (using WHO-CGS)
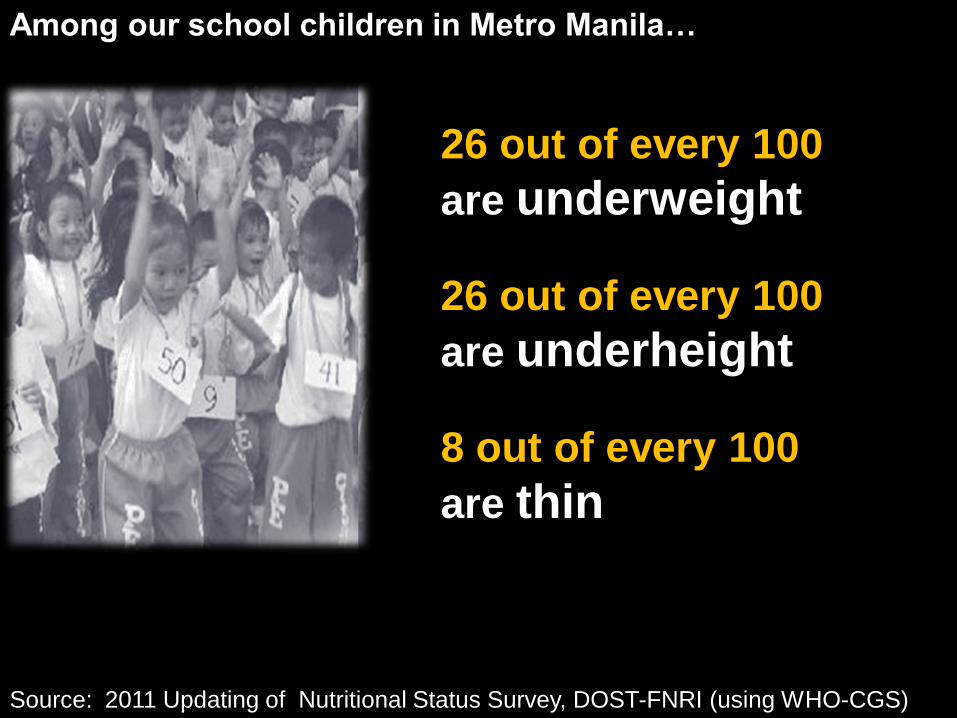
26 out of every 100
are underweight
Among our school children in Metro Manila…
26 out of every 100
are underheight
8 out of every 100
are thin
Source: 2011 Updating of Nutritional Status Survey, DOST-FNRI (using WHO-CGS)
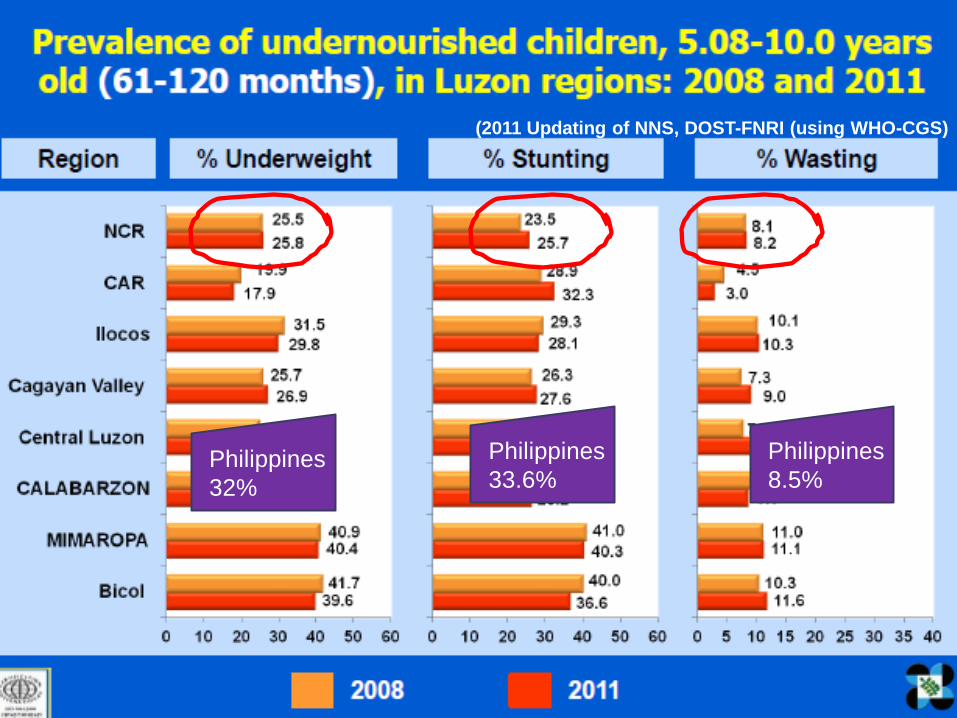
Philippines
32%
Philippines
33.6%
Philippines
8.5%
(2011 Updating of NNS, DOST-FNRI (using WHO-CGS)
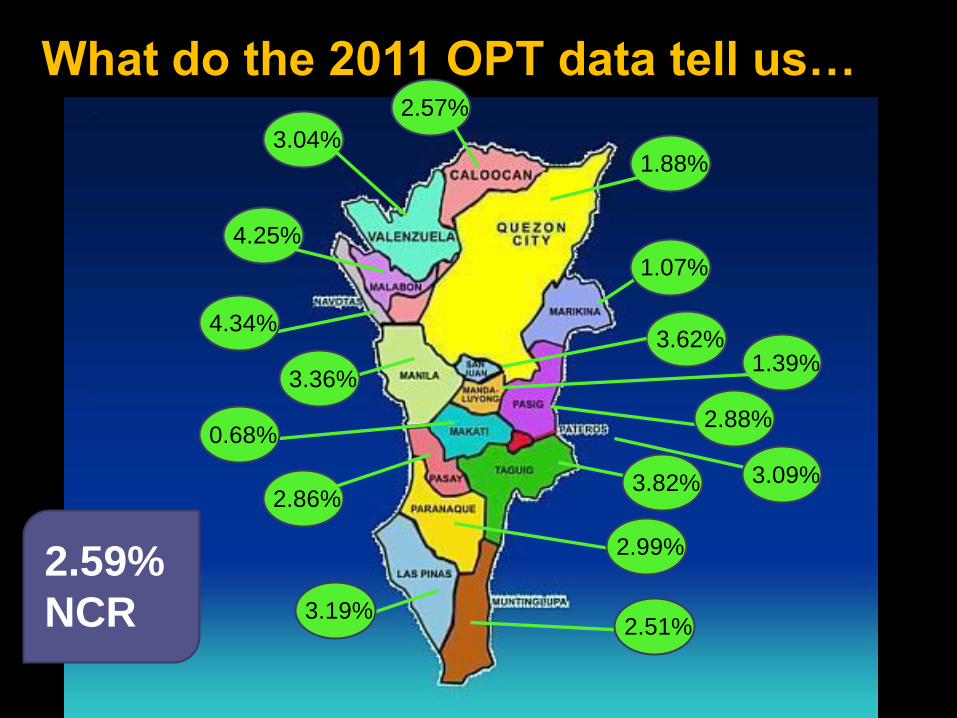
What do the 2011 OPT data tell us…
2.59%
NCR
2.57%
1.88%
1.07%
4.25%
3.04%
4.34% 3.62%
1.39%
2.86%
3.36%
3.19%
0.68% 2.88%
3.09% 3.82%
2.99%
2.51%
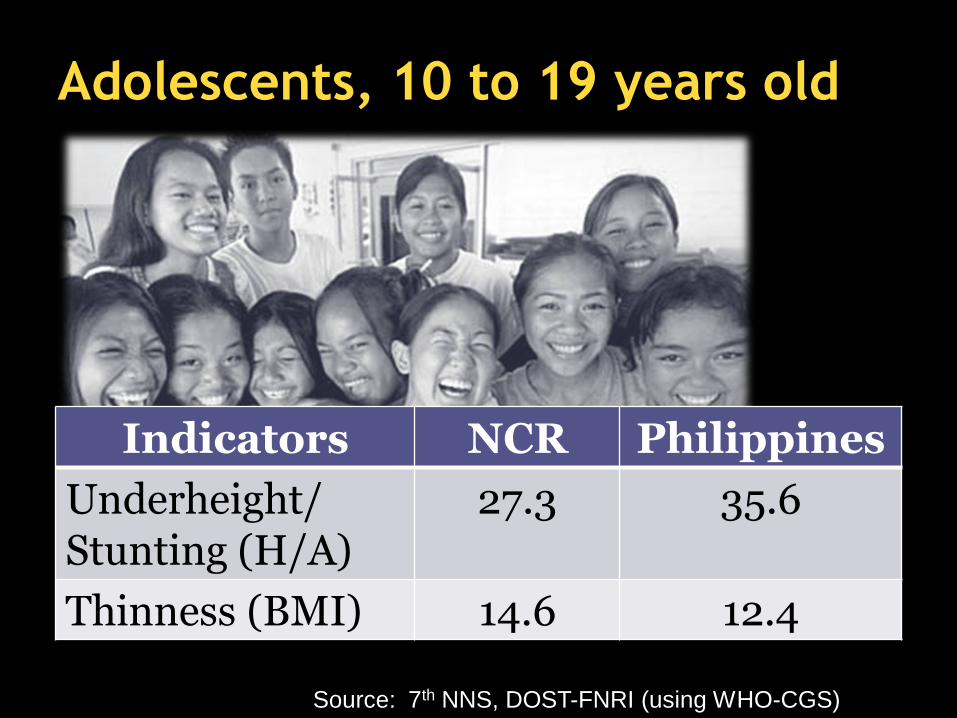
Adolescents, 10 to 19 years old
Indicators NCR Philippines
Underheight/ Stunting (H/A)
27.3 35.6
Thinness (BMI) 14.6 12.4
Source: 7th NNS, DOST-FNRI (using WHO-CGS)
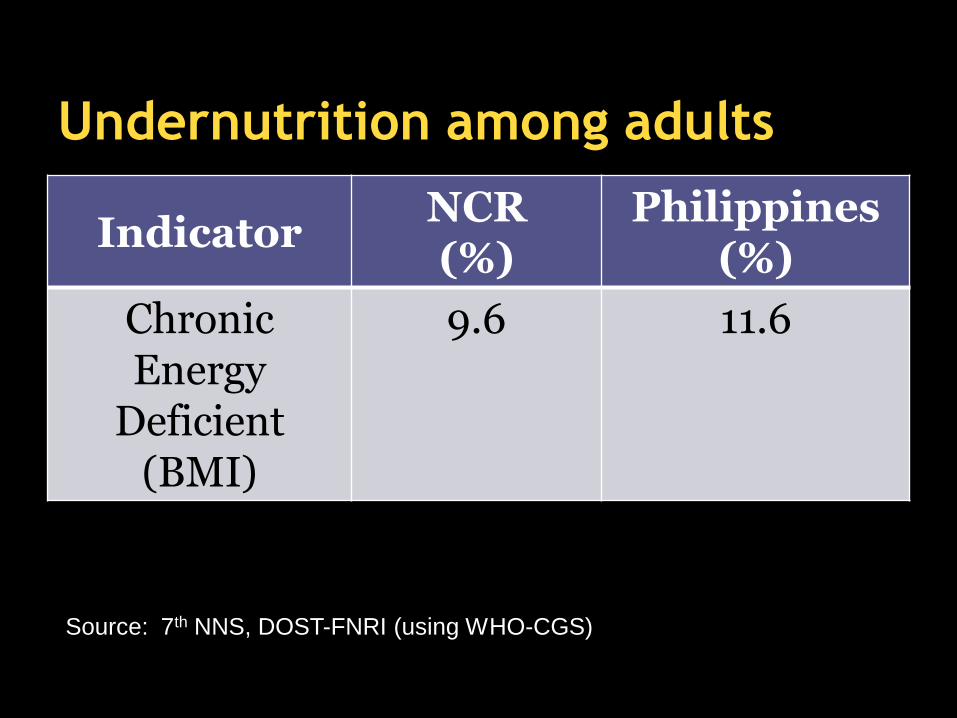
Undernutrition among adults
Indicator NCR (%)
Philippines (%)
Chronic Energy
Deficient (BMI)
9.6 11.6
Source: 7th NNS, DOST-FNRI (using WHO-CGS)
Challenge 3.
Poor Maternal Nutrition
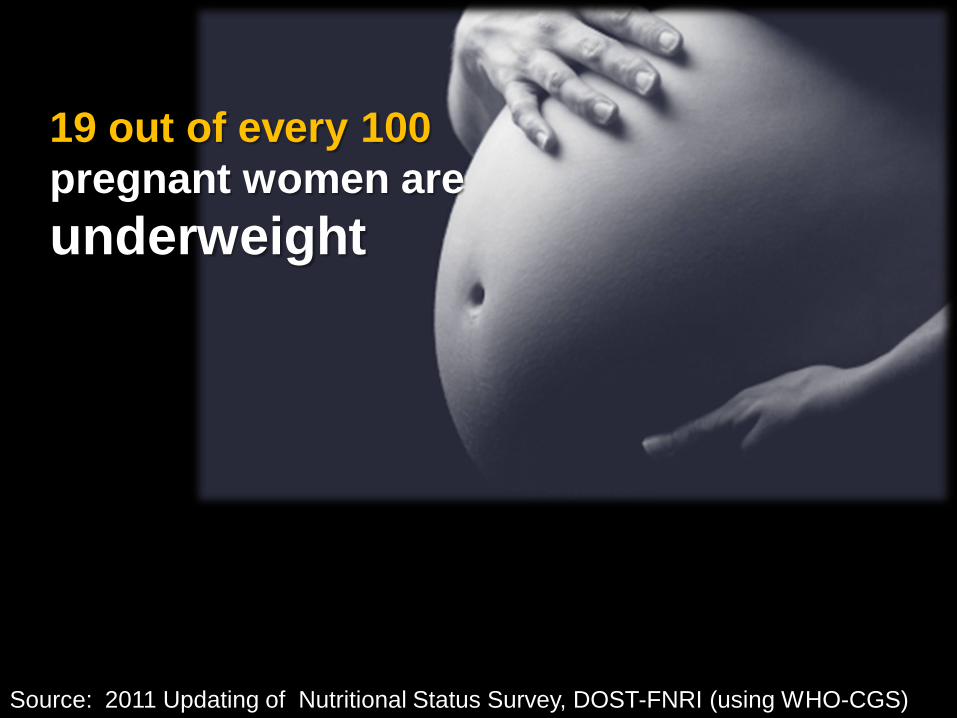
19 out of every 100
pregnant women are
underweight
Source: 2011 Updating of Nutritional Status Survey, DOST-FNRI (using WHO-CGS)
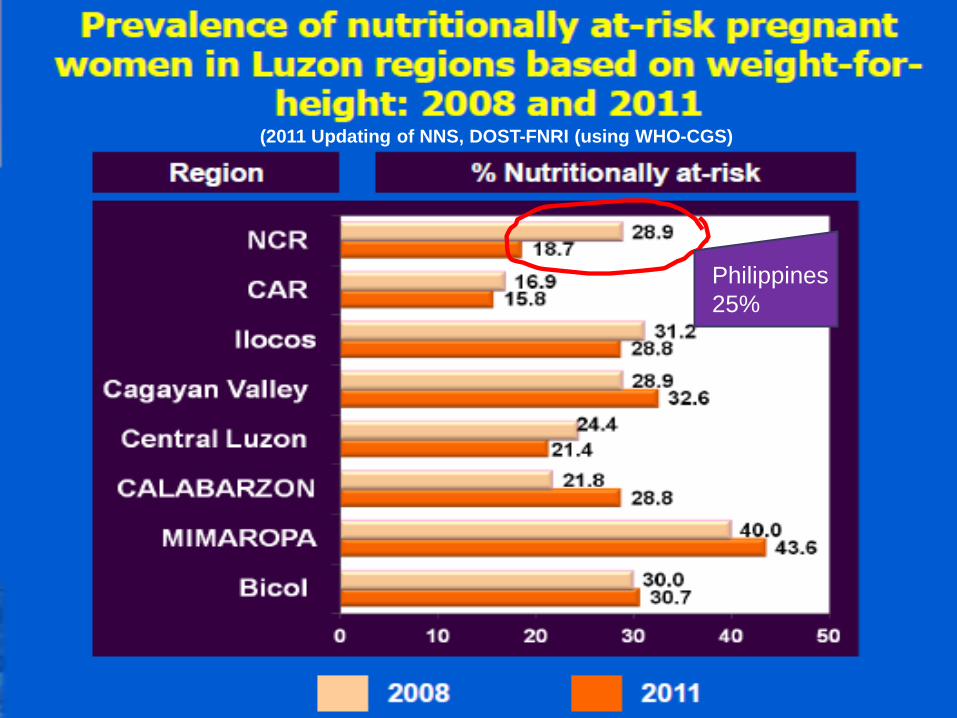
Philippines
25%
(2011 Updating of NNS, DOST-FNRI (using WHO-CGS)
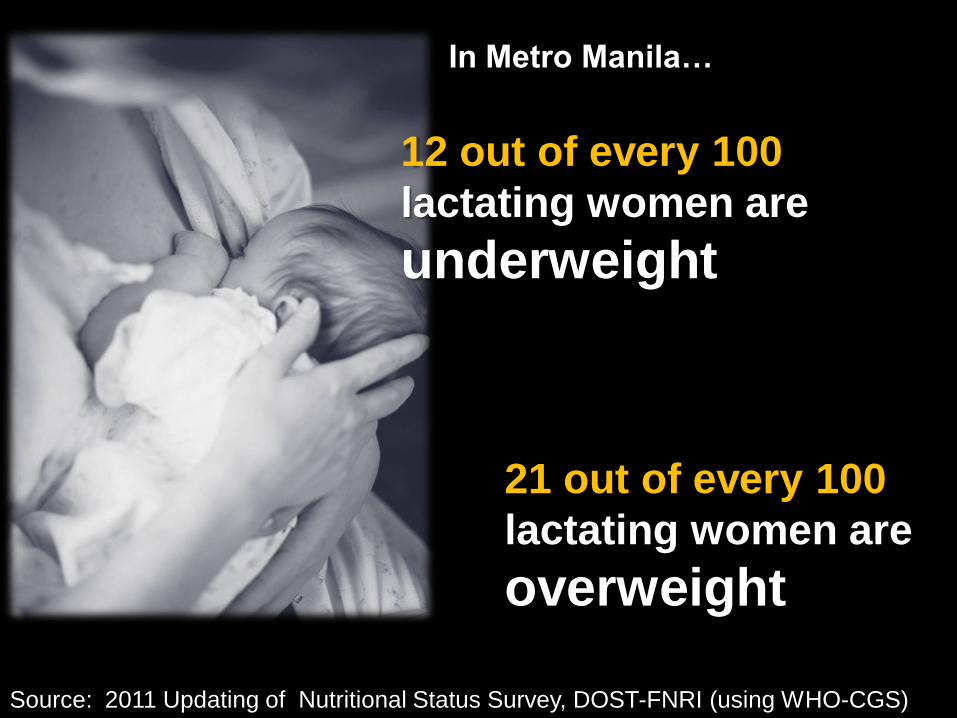
12 out of every 100
lactating women are
underweight
Source: 2011 Updating of Nutritional Status Survey, DOST-FNRI (using WHO-CGS)
21 out of every 100
lactating women are
overweight
In Metro Manila…
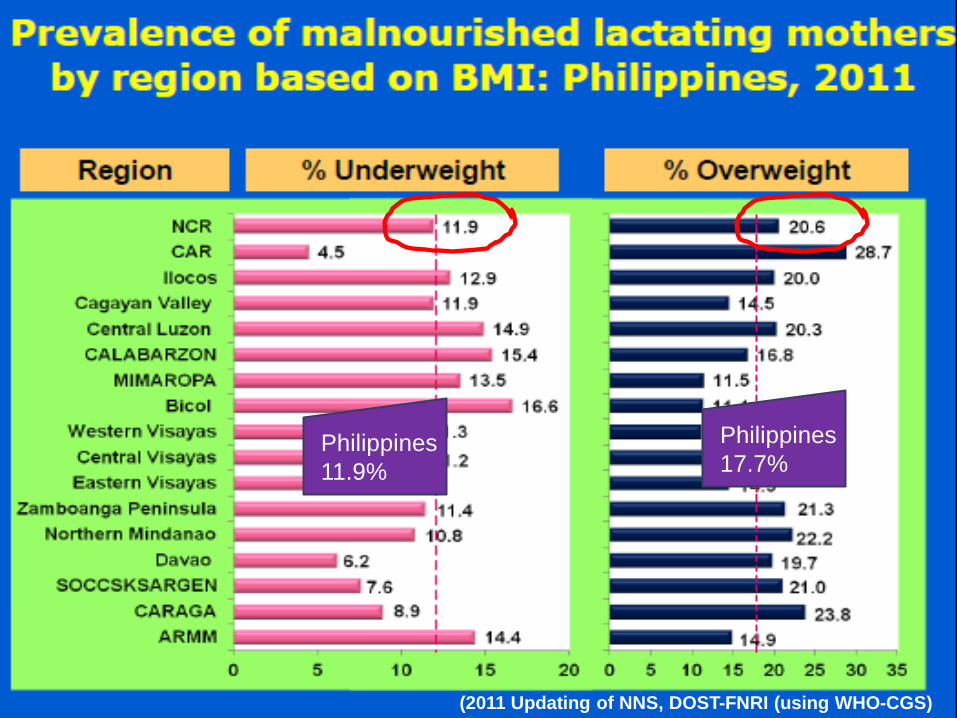
Philippines
11.9%
Philippines
17.7%
(2011 Updating of NNS, DOST-FNRI (using WHO-CGS)
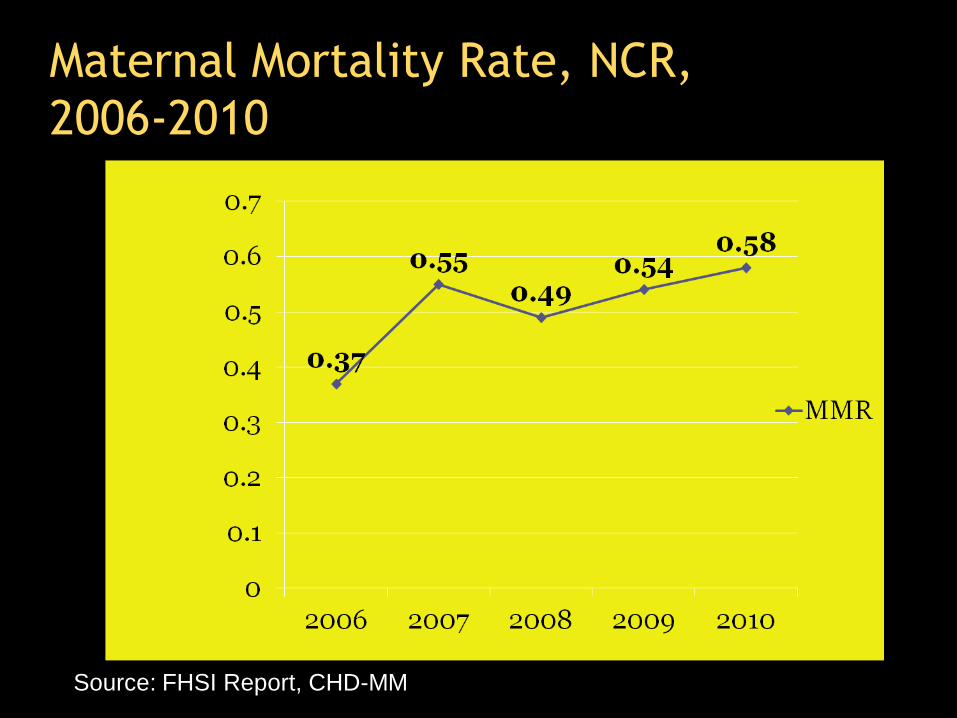
Maternal Mortality Rate, NCR,
2006-2010
Source: FHSI Report, CHD-MM
Challenge 4.
Overweight and Obesity
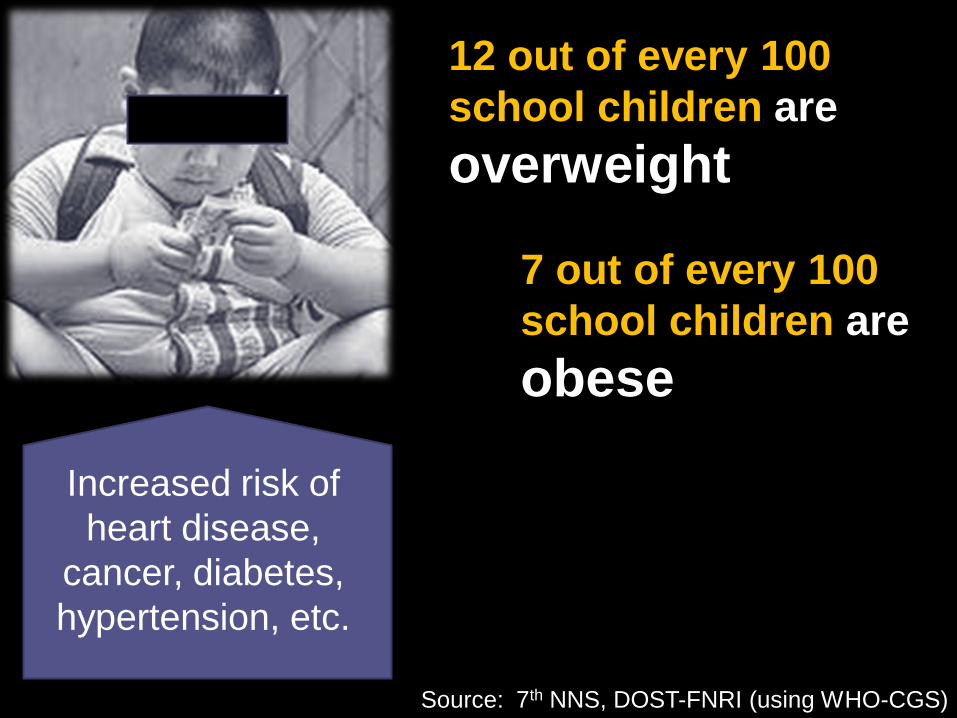
12 out of every 100
school children are
overweight
7 out of every 100
school children are
obese
Source: 7th NNS, DOST-FNRI (using WHO-CGS)
Increased risk of
heart disease,
cancer, diabetes,
hypertension, etc.
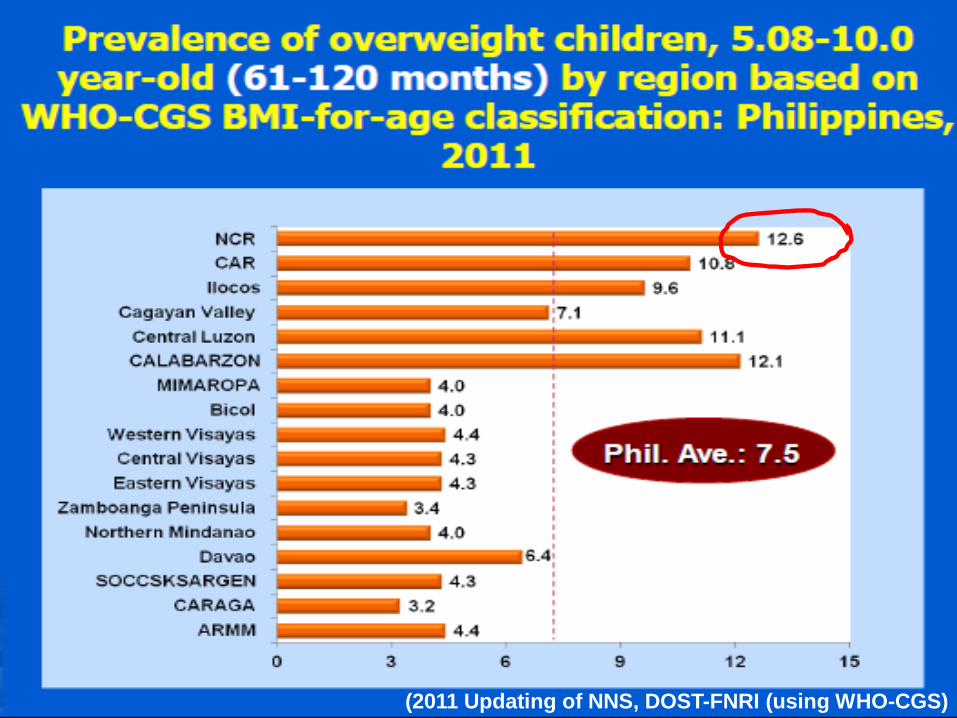
(2011 Updating of NNS, DOST-FNRI (using WHO-CGS)
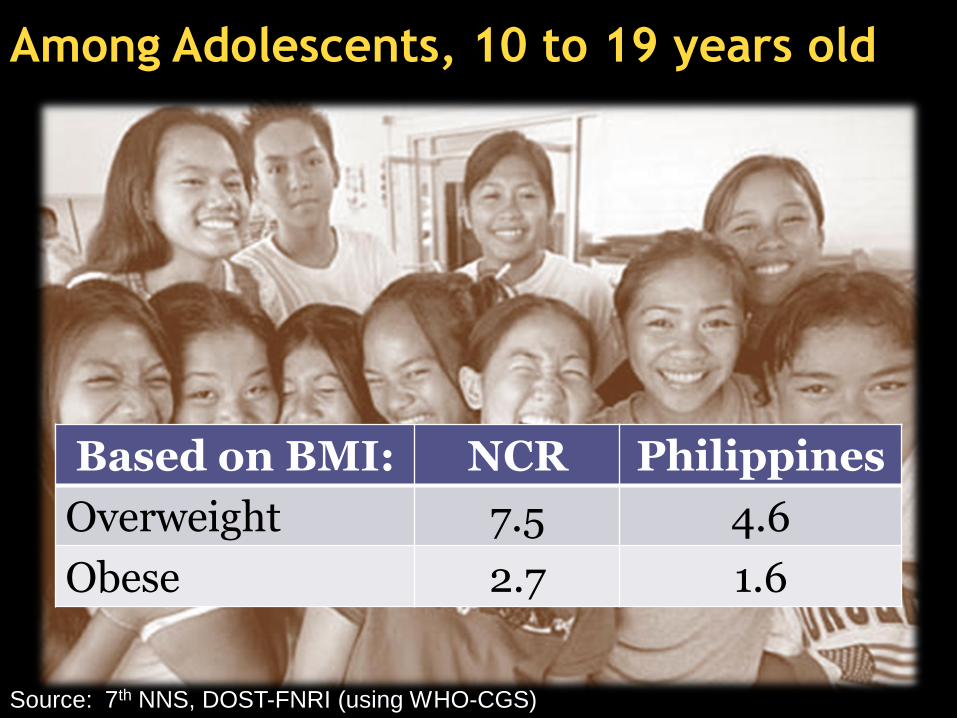
Among Adolescents, 10 to 19 years old
Based on BMI: NCR Philippines
Overweight 7.5 4.6
Obese 2.7 1.6
Source: 7th NNS, DOST-FNRI (using WHO-CGS)
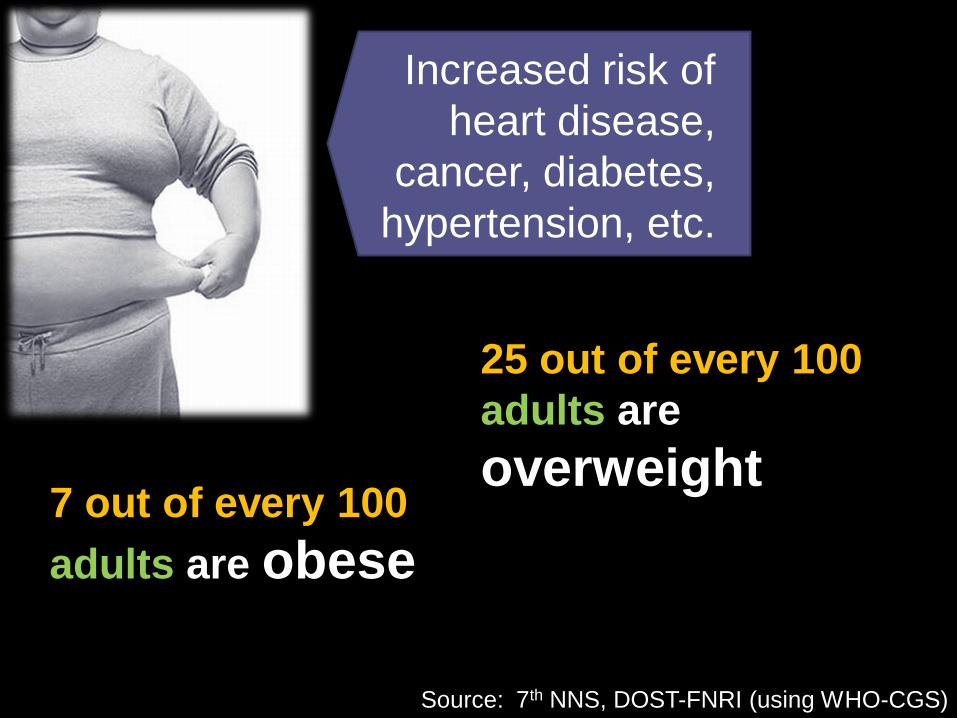
25 out of every 100
adults are
overweight
Source: 7th NNS, DOST-FNRI (using WHO-CGS)
Increased risk of
heart disease,
cancer, diabetes,
hypertension, etc.
7 out of every 100
adults are obese
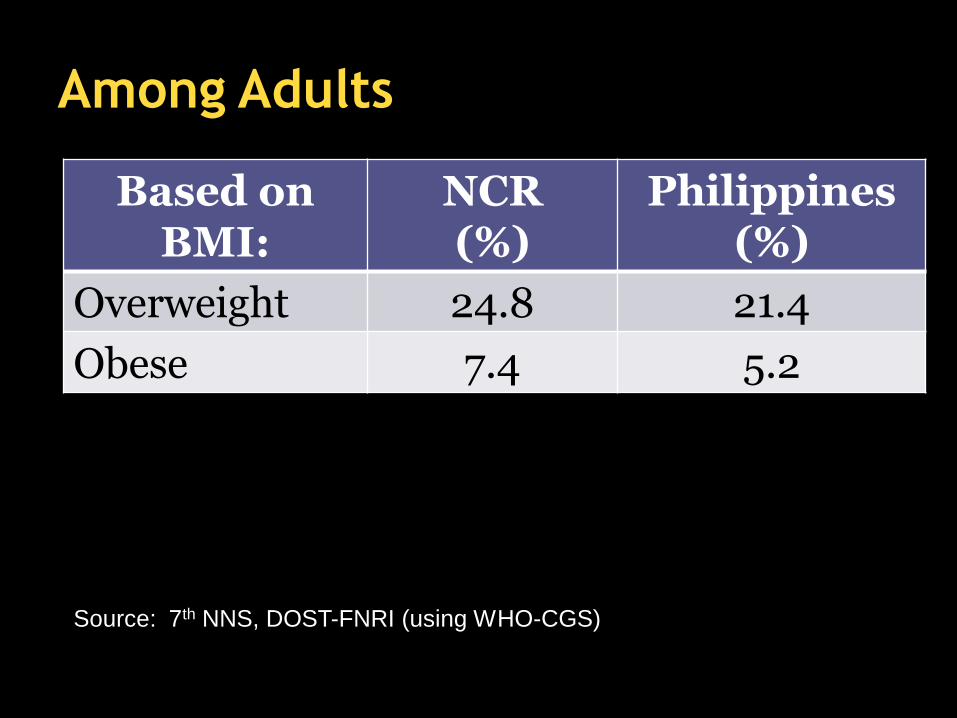
Among Adults
Based on BMI:
NCR (%)
Philippines (%)
Overweight 24.8 21.4
Obese 7.4 5.2
Source: 7th NNS, DOST-FNRI (using WHO-CGS)
Challenge 5.
Deficiencies in Iron, Vitamin A
and Iodine
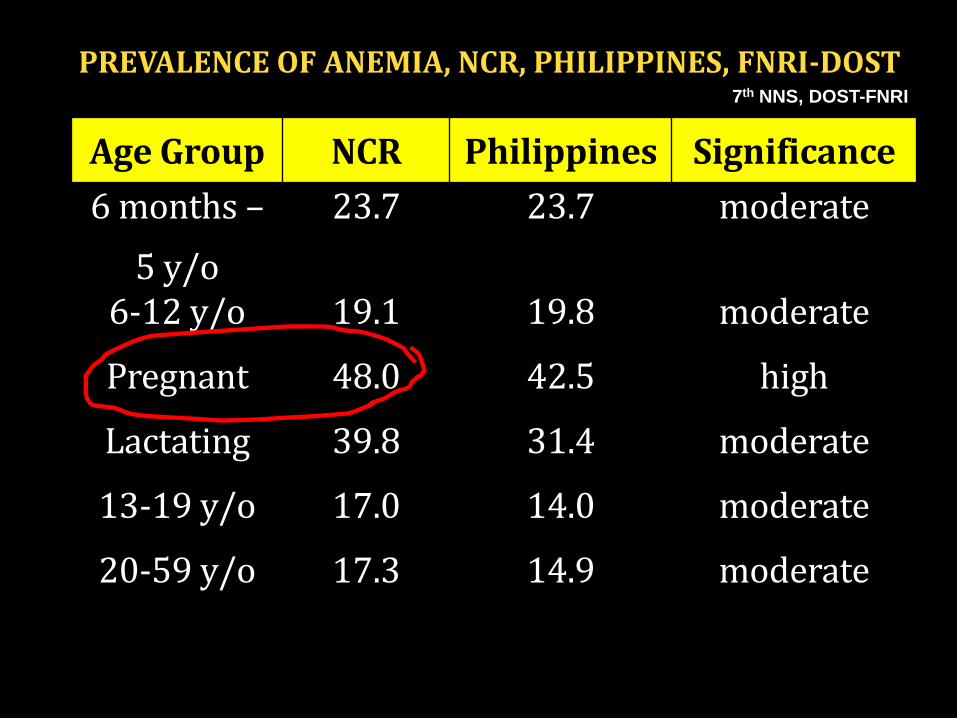
Age Group NCR Philippines Significance
6 months –
5 y/o
23.7 23.7 moderate
6-12 y/o 19.1 19.8 moderate
Pregnant 48.0 42.5 high
Lactating 39.8 31.4 moderate
13-19 y/o 17.0 14.0 moderate
20-59 y/o 17.3 14.9 moderate
PREVALENCE OF ANEMIA, NCR, PHILIPPINES, FNRI-DOST 7th NNS, DOST-FNRI
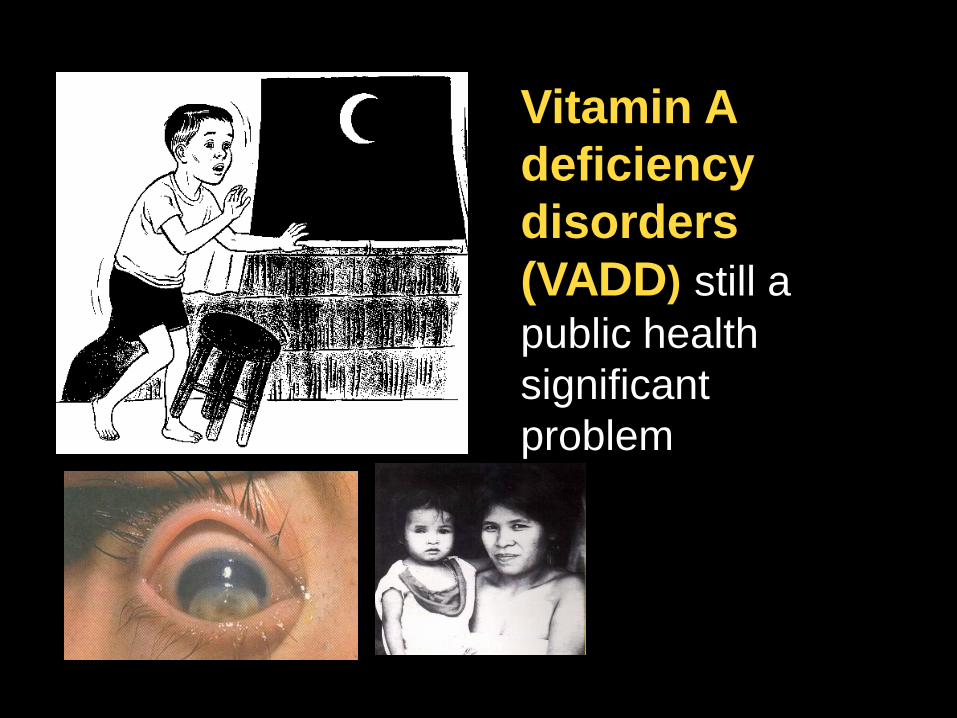
Vitamin A
deficiency
disorders
(VADD) still a
public health
significant
problem
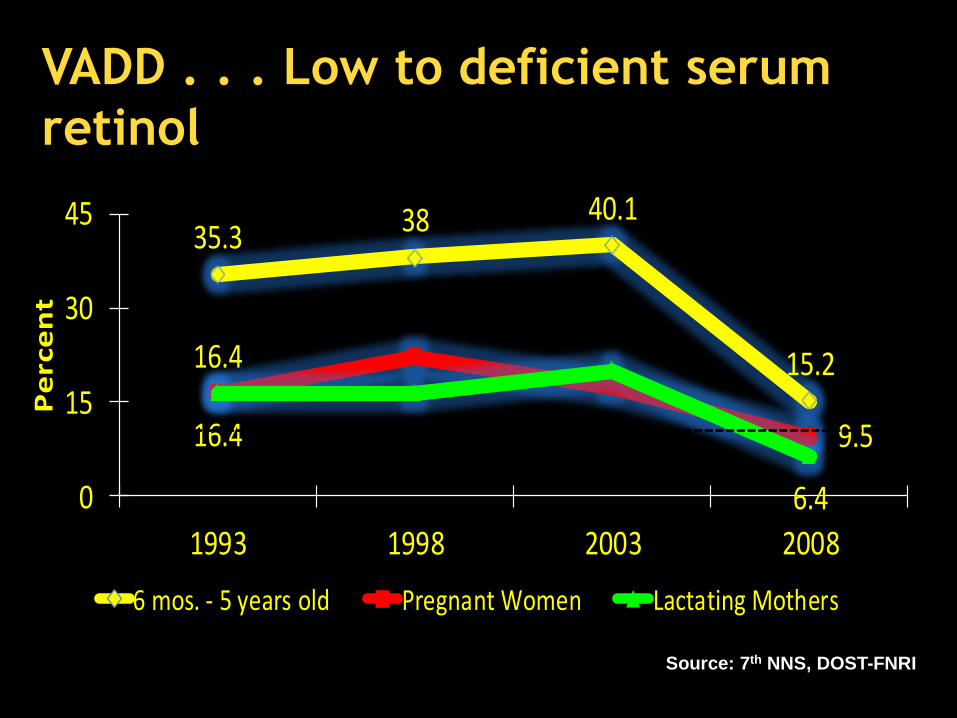
35.3 38 40.1
15.216.4
9.516.4
6.40
15
30
45
1993 1998 2003 2008
Percent
6 mos. - 5 years old Pregnant Women Lactating Mothers
VADD . . . Low to deficient serum
retinol
Source: 7th NNS, DOST-FNRI
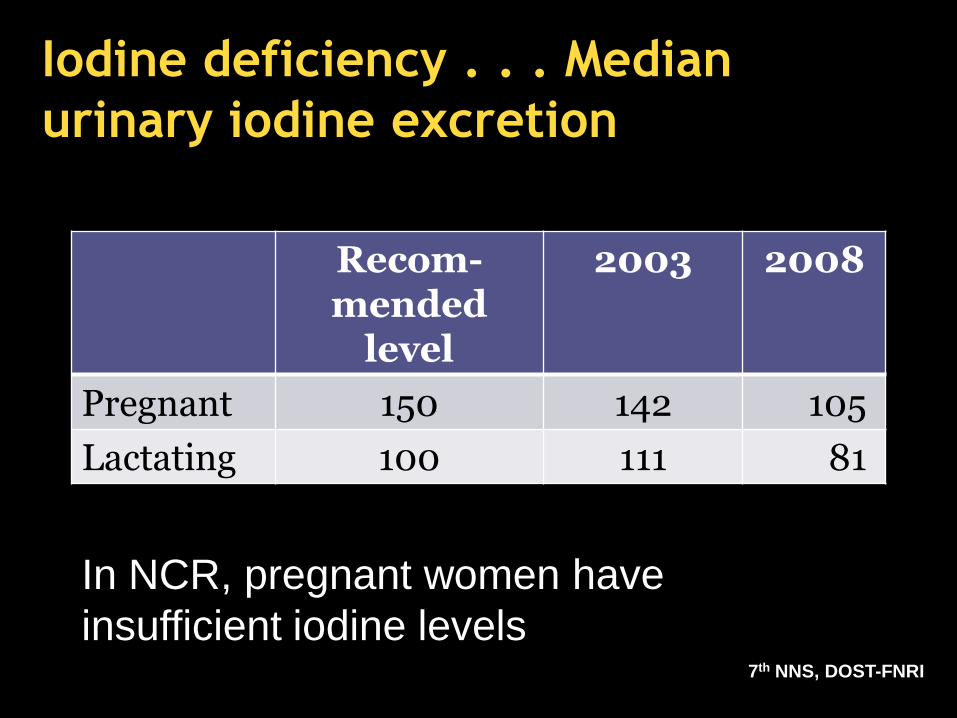
Iodine deficiency . . . Median
urinary iodine excretion
Recom-mended
level
2003 2008
Pregnant 150 142 105
Lactating 100 111 81
In NCR, pregnant women have
insufficient iodine levels 7th NNS, DOST-FNRI
Challenge 6.
Increasing rates of NCDs
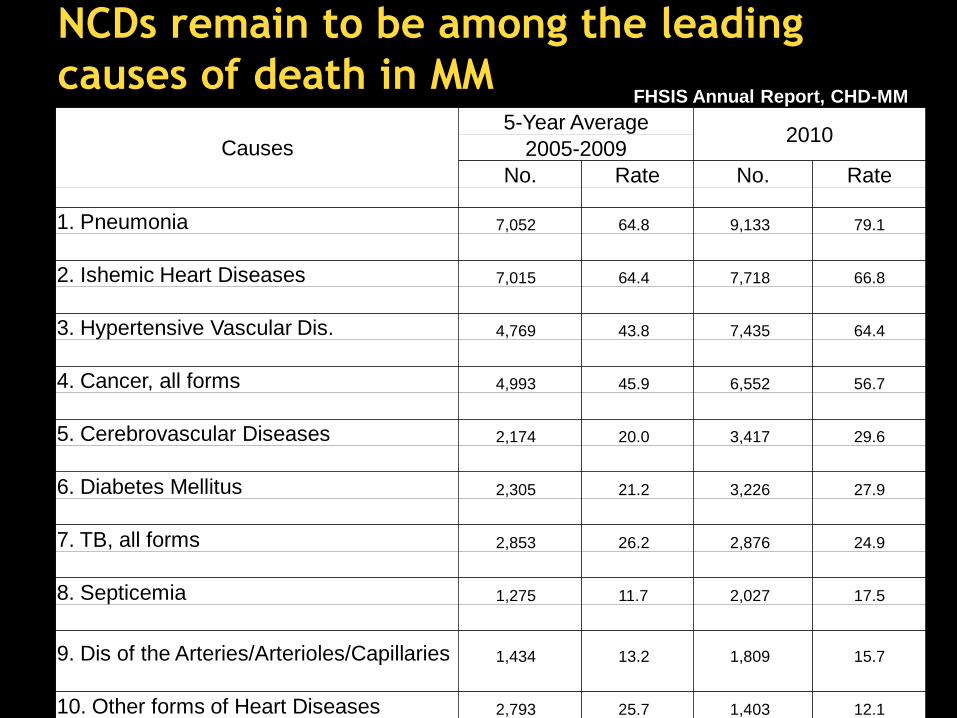
NCDs remain to be among the leading
causes of death in MM
Causes
5-Year Average 2010
2005-2009
No. Rate No. Rate
1. Pneumonia 7,052 64.8 9,133 79.1
2. Ishemic Heart Diseases 7,015 64.4 7,718 66.8
3. Hypertensive Vascular Dis. 4,769 43.8 7,435 64.4
4. Cancer, all forms 4,993 45.9 6,552 56.7
5. Cerebrovascular Diseases 2,174 20.0 3,417 29.6
6. Diabetes Mellitus 2,305 21.2 3,226 27.9
7. TB, all forms 2,853 26.2 2,876 24.9
8. Septicemia 1,275 11.7 2,027 17.5
9. Dis of the Arteries/Arterioles/Capillaries 1,434 13.2 1,809 15.7
10. Other forms of Heart Diseases 2,793 25.7 1,403 12.1
FHSIS Annual Report, CHD-MM
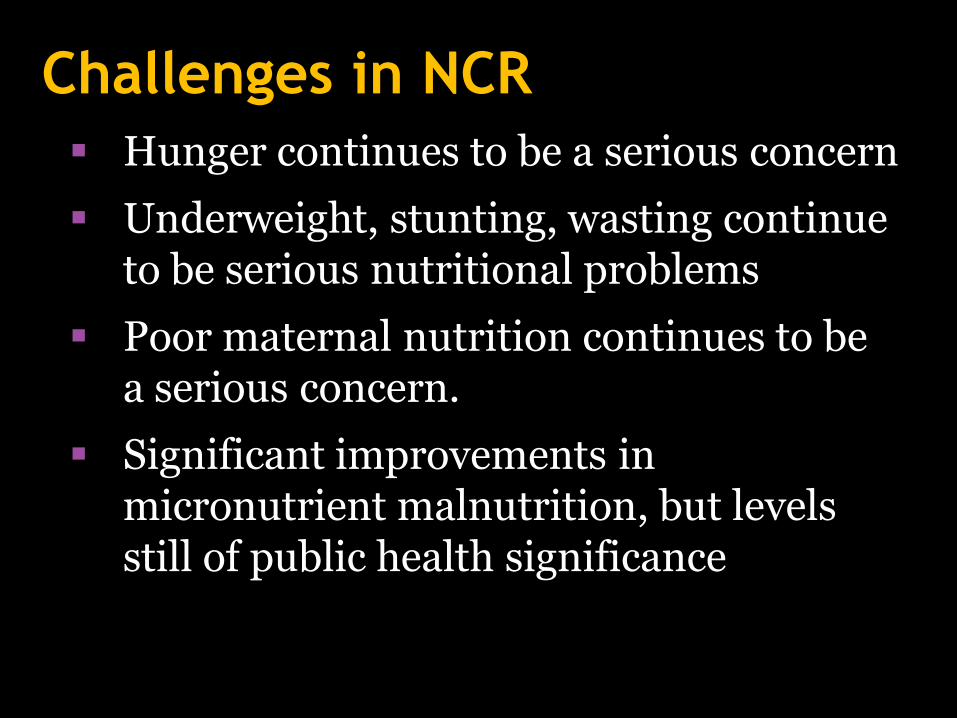
Challenges in NCR
Hunger continues to be a serious concern
Underweight, stunting, wasting continue to be serious nutritional problems
Poor maternal nutrition continues to be a serious concern.
Significant improvements in micronutrient malnutrition, but levels still of public health significance
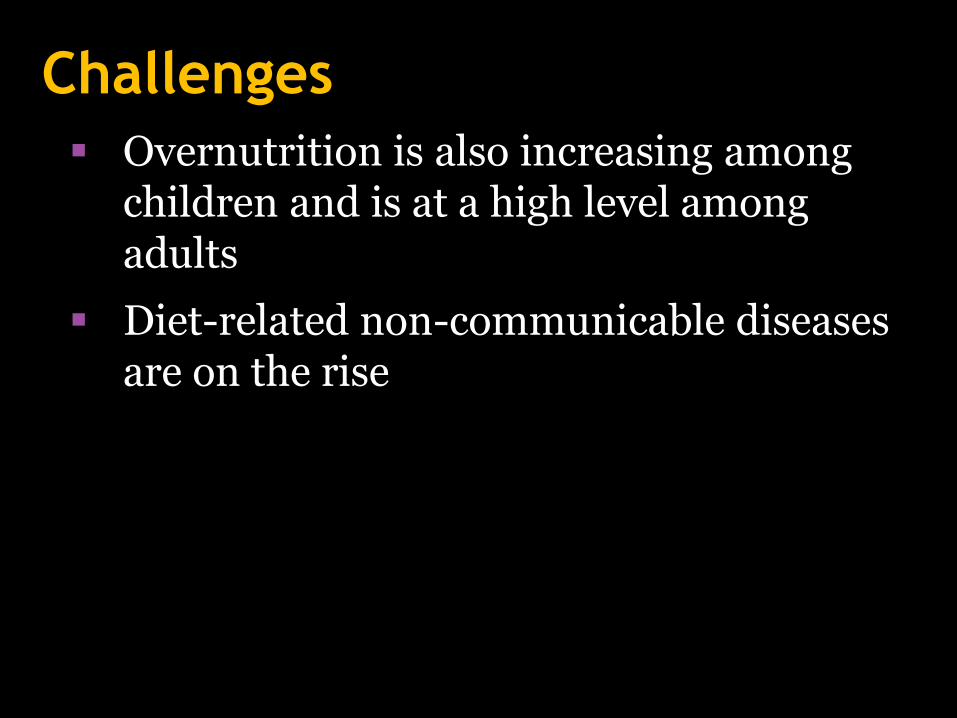
Challenges
Overnutrition is also increasing among children and is at a high level among adults
Diet-related non-communicable diseases are on the rise
Functionality of BNCs in NCR
Why invest in
Nutrition?
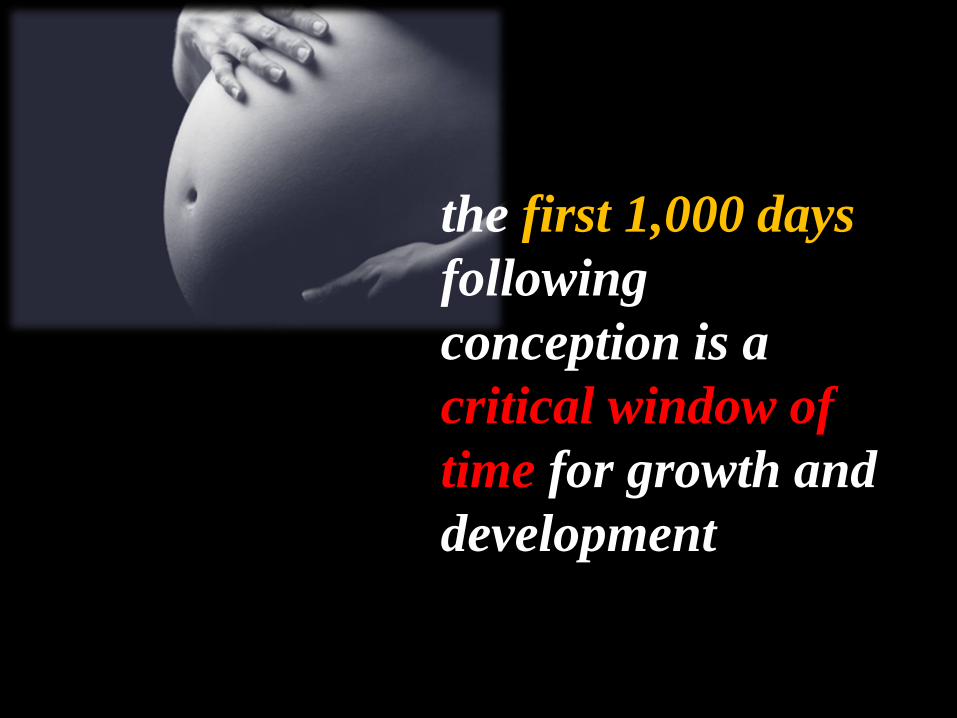
the first 1,000 days
following
conception is a
critical window of
time for growth and
development
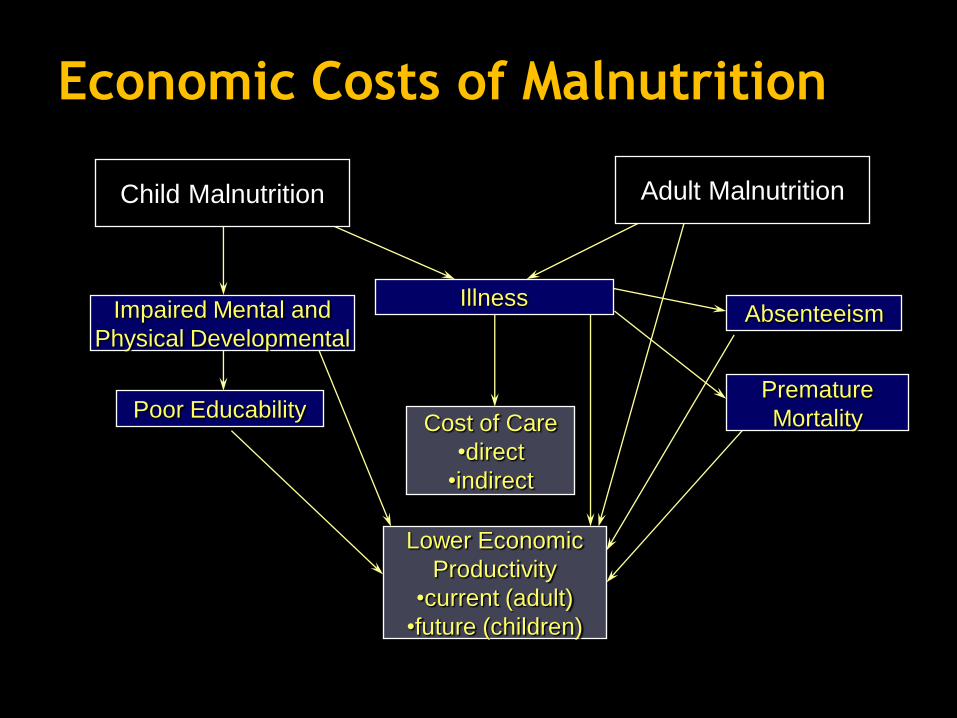
Economic Costs of Malnutrition
Child Malnutrition
Illness
Poor Educability
Impaired Mental and
Physical Developmental Absenteeism
Cost of Care
•direct
•indirect
Lower Economic
Productivity
•current (adult)
•future (children)
Premature
Mortality
Adult Malnutrition

Greatest ASSET of a Community
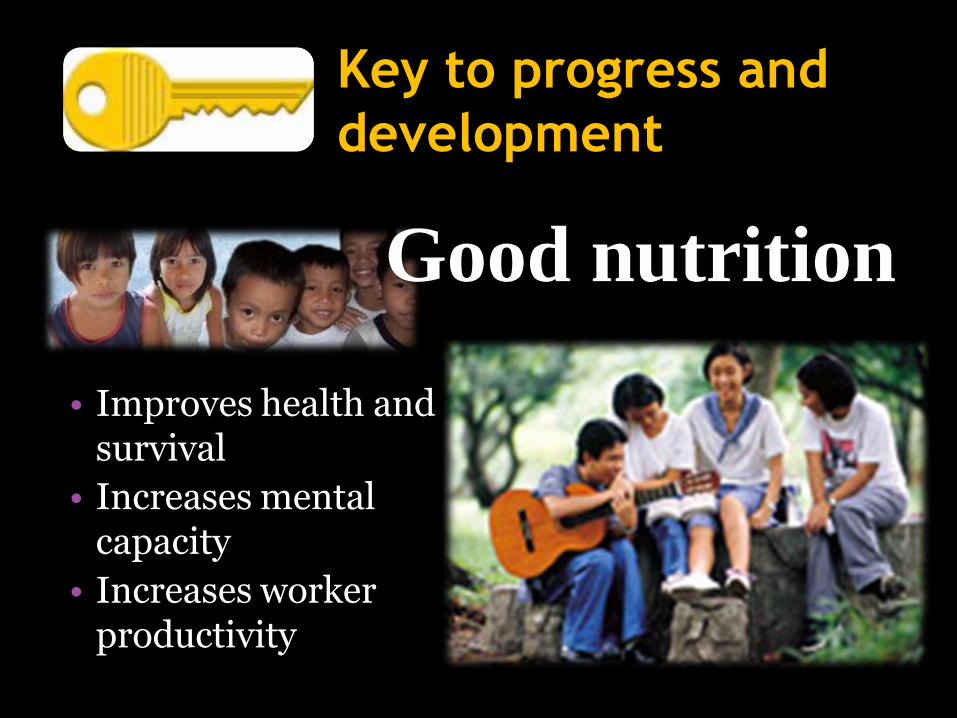
Key to progress and
development
• Improves health and survival
• Increases mental capacity
• Increases worker productivity
Good nutrition
How do we
mitigate hunger
and malnutrition?
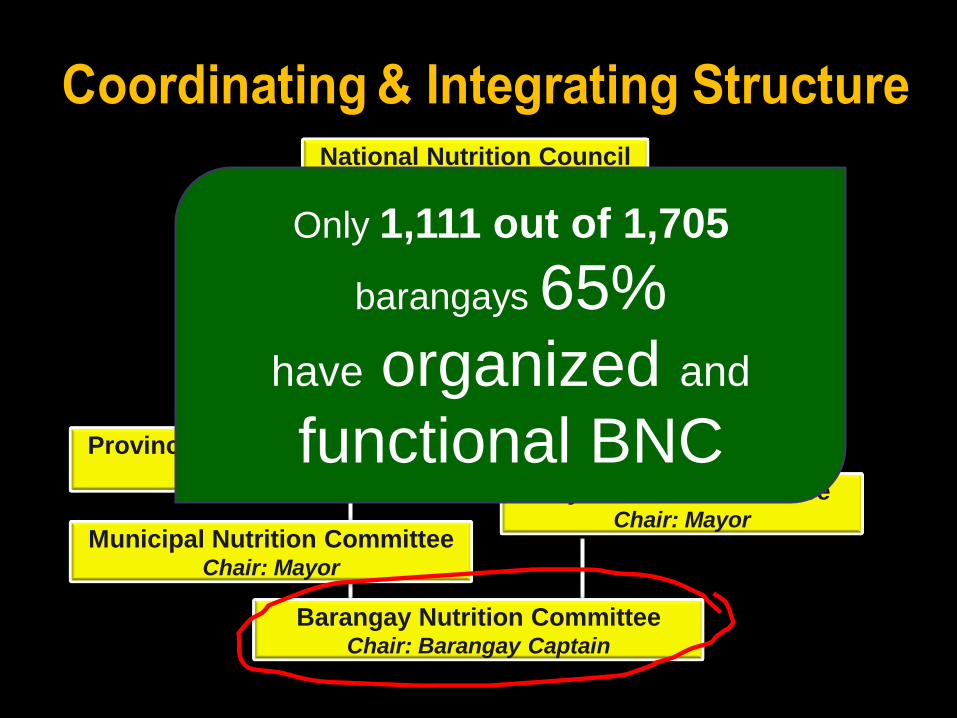
Regional Nutrition Committee Chair: Regional Director
Provincial Nutrition Committee
Chair: Governor City Nutrition Committee
Chair: Mayor Municipal Nutrition Committee
Chair: Mayor
Barangay Nutrition Committee Chair: Barangay Captain
National Nutrition Council
Governing Board
National Nutrition Council
Secretariat
Interagency
Technical
Committee
Only 1,111 out of 1,705
barangays 65%
have organized and
functional BNC
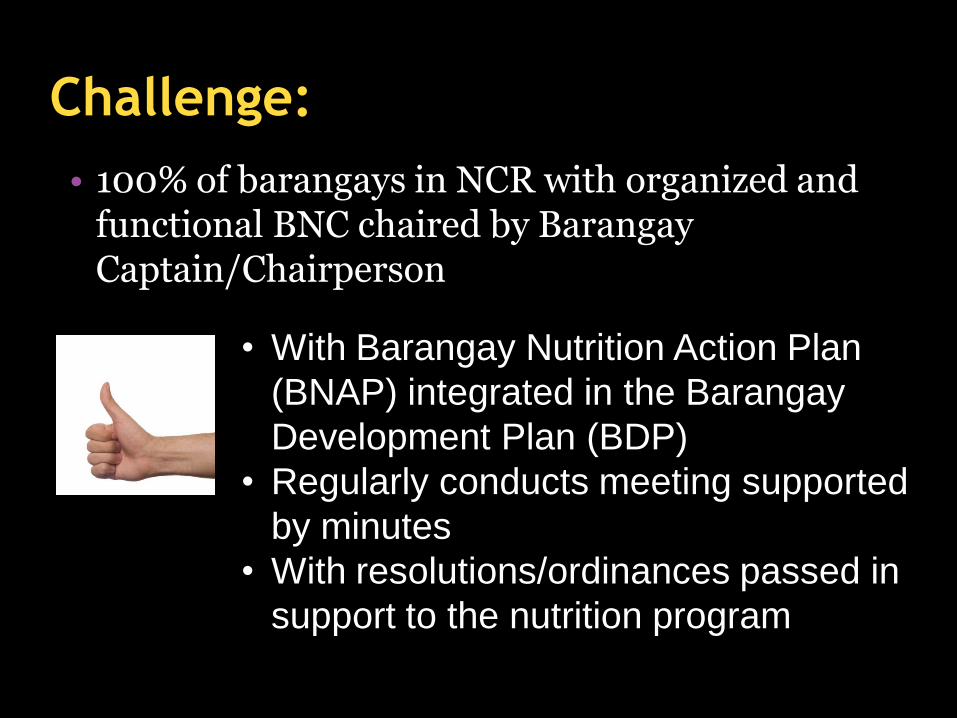
Challenge:
• 100% of barangays in NCR with organized and functional BNC chaired by Barangay Captain/Chairperson
• With Barangay Nutrition Action Plan
(BNAP) integrated in the Barangay
Development Plan (BDP)
• Regularly conducts meeting supported
by minutes
• With resolutions/ordinances passed in
support to the nutrition program
Let us work together to end hunger and
malnutrition
50
For more information
National Nutrition Council-NCR
Contact us at: (02) 533-2713
Website: www.nnc.gov.ph
Email: [email protected]
Like us on Facebook: national nutrition council-ncr