the psychotherapeutic service delivery system
TRANSCRIPT
This article was downloaded by: [Northeastern University]On: 11 October 2014, At: 20:34Publisher: RoutledgeInforma Ltd Registered in England and Wales Registered Number: 1072954Registered office: Mortimer House, 37-41 Mortimer Street, London W1T 3JH, UK
Psychotherapy ResearchPublication details, including instructions for authors andsubscription information:http://www.tandfonline.com/loi/tpsr20
The Psychotherapeutic ServiceDelivery SystemKenneth Howard a , John Vessey a , Robert Lueger b & DianeSchank aa Northwestern Universityb Marquette UniversityPublished online: 25 Nov 2010.
To cite this article: Kenneth Howard , John Vessey , Robert Lueger & Diane Schank (1992)The Psychotherapeutic Service Delivery System, Psychotherapy Research, 2:3, 164-180, DOI:10.1080/10503309212331332954
To link to this article: http://dx.doi.org/10.1080/10503309212331332954
PLEASE SCROLL DOWN FOR ARTICLE
Taylor & Francis makes every effort to ensure the accuracy of all the information(the “Content”) contained in the publications on our platform. However, Taylor& Francis, our agents, and our licensors make no representations or warrantieswhatsoever as to the accuracy, completeness, or suitability for any purpose of theContent. Any opinions and views expressed in this publication are the opinions andviews of the authors, and are not the views of or endorsed by Taylor & Francis. Theaccuracy of the Content should not be relied upon and should be independentlyverified with primary sources of information. Taylor and Francis shall not be liablefor any losses, actions, claims, proceedings, demands, costs, expenses, damages,and other liabilities whatsoever or howsoever caused arising directly or indirectly inconnection with, in relation to or arising out of the use of the Content.
This article may be used for research, teaching, and private study purposes. Anysubstantial or systematic reproduction, redistribution, reselling, loan, sub-licensing,systematic supply, or distribution in any form to anyone is expressly forbidden.Terms & Conditions of access and use can be found at http://www.tandfonline.com/page/terms-and-conditions

Psychotherapy Research 2( 3) 164-180, 1992
THE PSYCHOTHERAPEUTIC SERVICE DELIVERY SYSTEM
Kenneth I. Howard John T. Vessey Northwestern University
Robert Lueger Marquette University
Diane Schank Northwestern University
We can understand the relevance of psychotherapy research for clinical practice only by considering the broader context of the psychotherapy service delivery system. Epidemiologic studies of the incidence and prevalence of emotional disturbance provide estimates of the need for services; surveys of providers and their practice patterns yield estimates of available resources to meet those needs; and studies of patient charac- teristics and patterns of psychotherapy utilization identlfy the con- stituencies served by the psychotherapy delivery system. From these data we know that each person in need of mental health services has available no more than an average of three treatment sessions from a mental health professional in any gven year. Despite the fact that a small proportion of such individuals actually seek service, each such individual who consults the speciality mental health sector has available no more than an average of 10 treatment sessions. The most needy, particularly those lacking in education, are least likely to receive treatment in the psychotherapeutic service delivery system. Further, we argue for a clear- er focus on service episodes and psychotherapy utilization through the tracking of the mental health “careers” of patients.
Discussions of the relevance of psychotherapy research for clinical practice have tended to focus on the process of treatment4or example, on the technical clinical in- terventions of psychotherapists. By contrast, the study of psychotherapy as a service delivery system emphasizes the policy implications of psychotherapy research. The focus of a delivery system model is on input and output-that is, on service providers, service needers, service users, the routes of entry of users into the system, the provision of service, and the subsequent conditions of the users. With the advent of managed mental health services-and the related issues of quality, cost-effectiveness, and cost- efficiency-a better understanding of the psychotherapeutic service delivery system is essential for the establishment of rational policies.
Address correspondence to Dr. Howard at the Department of Psychology, Northwestern University, Evanston, IL 60201.
This is an extended presentation of a paper given at the Nineteenth Annual Meetings of the Society for Psychotherapy Research, June 1988, Santa Fe, New Mexico. This work was partially supported by research grant R 01 MH42901 from the National Institute of Mental Health.
164
Dow
nloa
ded
by [
Nor
thea
ster
n U
nive
rsity
] at
20:
34 1
1 O
ctob
er 2
014
PSYCHOTHERAPEUTIC SERVICE DELIVERY 165
The basic approach to understanding the mental health service delivery system has been through the use of epidemiologic surveys. These surveys are usually of households and have taken three basic forms:
First: national probability samples under the direction of large survey organiza- tions such as the National Opinion Research Corporation (NORC) at the University of Chicago or the Institute for Social Research (ISR) at the University of Michigan. The strength of this approach is that it provides accurate estimates for the total population. Because of the use of national probability sampling techniques, howev- er, these surveys tend to use relatively unsophisticated interviewers and to gather a broad range of relatively superficial information regarding the need for or utilization of services. A recent example is the National Medical Care Utilization and Ex- penditure Survey (NMCUES) of 1980-1981 (Taube, Kessler, & Feuerberg, 1984).
Second: intensive surveys of selected sites, in which interviewers are carefully trained and supervised in the use of a standard psychiatric diagnostic interview. Each site has its own principal investigator and funding is provided on the basis of competitive applications. Consequently the samples are not necessarily representa- tive of the total population; however, in-depth information can be gathered. The most recent example is the Epidemiologic Catchment Area Program (ECA) which began in 1980 (Eaton, Regier, Locke, & Taube, 1981; Regier et al., 1984).
Uhlenhuth, Balter, Mellinger, Cissin, and Clinthorne (1983) devised a method that combined the strengths of the two approaches described above. They de- veloped an index of psychic distress that could be administered by relatively untrained interviewers under minimal supervision. They then demonstrated the relationship between their symptom algorithm and diagnoses based on structured diagnostic interviews conducted by professionals in national probability sample surveys. This represents a significant advance in the field in that it suggests a method for simpllfying data collection while providing some clinically sophisticated in- depth information.
Third: national service provider surveys in which mental health specialists are asked for descriptions of portions of their current patient load (e.g., last five patients seen in individual psychotherapy). Usually some representative sample is selected fkom various lists of mental health professionals (e.g., members of particular pro- fessional organizations). A recent example is the Mental Health Services Providers Survey of 1982-1983 (Knesper, Pagnucco, &Wheeler, 1985). This approach offers a cross-sectional view of who is providing mental health services and what kind of services they are providing.
INCIDENCE AND PREVALENCE OF EMOTIONAL DISTURBANCE
In order to formulate rational national mental health service delivery policies, there has been considerable interest in estimating the number of people in the population that are in need of such services.
The most ambitious of these epidemiologic studies has been the NIMH- sponsored ECA surveys. These have been carried out in seven communities (Balti- more, Denver, Los Angeles, New Haven, Puerto Rico, St. Louis, and the Piedmont area of North Carolina). Each site, with a population of 200,000 to 500,000 people, consists of a geographic catchment area or set of noncontiguous catchment areas in a region. Probability samples of 3,000 to 5,000 individuals per site were drawn and household surveys conducted. The major diagnostic instrument used in these sur- veys was the Diagnostic Interview Schedule (DIS; Robins, Helzer, Croughhan, &
Dow
nloa
ded
by [
Nor
thea
ster
n U
nive
rsity
] at
20:
34 1
1 O
ctob
er 2
014
166 HOWARD ET AL.
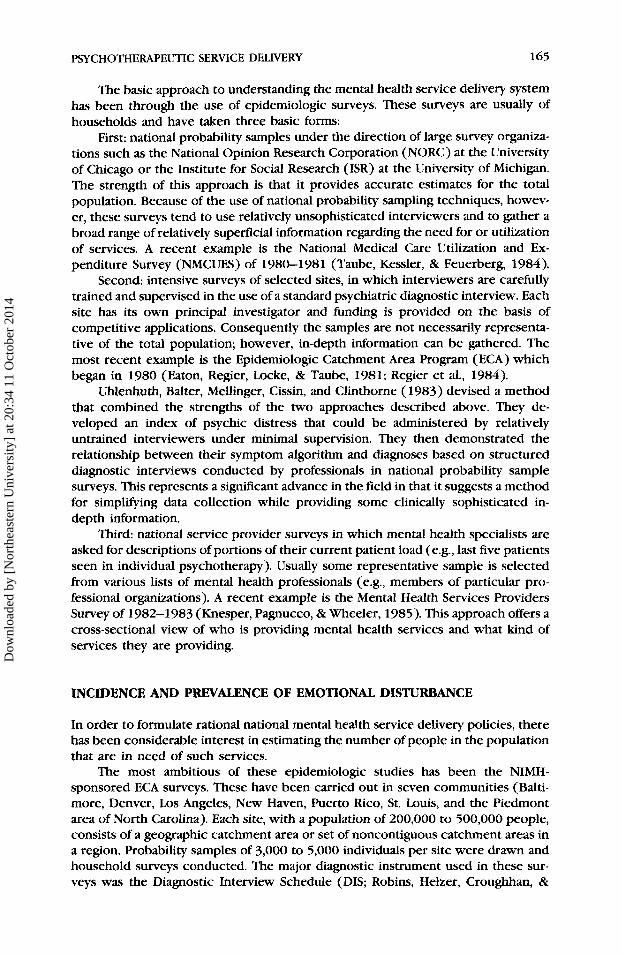
RatcliE, 198l), developed as a measure that can be administered by trained, super- vised lay interviewers. It screens for the presence of DSM-111 diagnoses for cognitive impairment, affective disorders, schizophrenic disorders, substance abuse disorders, anxiety disorders, somatization disorders, antisocial disorders, and anorexia nervosa. Prevalence of these diagnoses was assessed for 1-month, 6-month, and lifetime time frames (Burnam et al., 1987; Canino et al., 1987; Karno et al., 1987; Regier et al., 1988). The results are shown in Table 1. As can be seen, findings from the six reporting sites were fairly consistent. This was true despite various oversamplings in the designs at specific sites (e.g., elderly, Hispanics).
The Psychic Distress Survey was conducted using household surveys of a national probability sample (Uhlenhuth et al., 1983). In this survey symptom algor- ithms were used to determine the presence of an emotional disorder. These authors estimate that 25.6% of the U.S. population experience a period of psychic distress in a 12-month period.
Merman and Weissman ( 1984) have summarized the epidemiologic literature and concluded that “about 40 percent of the population will experience some diagnosable mental illness during their lifetime” (p. 332). They go on to state that “It is likely that in at least 50 percent of families, at least one family member will suffer a definable mental illness at some time during the ‘life of the family’ ” (p. 332). In any one year it is estimated that “about 4 million people are coping with bereavement and mourning over the death of a loved one, 6 million are affected by divorce; 20 million by retirement; 20 million by unemployment; 20 million by chronic medical illness” (p. 334). They estimate further that between 30 and 50 million persons in the United States each year experience a stressful life event that immobilizes their capacity to cope.
Our best estimate is that, overall, there are at least 40 million persons each year that are (symptomatically) in need of services from the specialty mental health sector. Added to this would be relatively asymptomatic individuals who are having difficulty in coping with some aspect of their lives-such as experiencing life difficulties that have not yet manifested themselves in the form of psychiatric symptoms.
PROVIDERS
Estimating the number of mental health providers qualified to offer psychotherapeu- tic services is a challenging task. Membership lists of professional organizations are not all inclusive; for example, the estimated ratio of nonmember to member social
Table 1. Prevalence of DIS (DSM-111) Disorders
Site 1 -Month 6-Month Lifetime
Prevalence Prevalence Prevalence
Baltimore Los Angeles New Haven Piedmont (N.C.) Pueno Rico St. Louis Average
19.8% 24.2% 39.6% 15.4% 18.6% 33.2% 14.5% 19.1% 29.9% 19.3% 23.1% - - 16.0% 28.1%
12.9% 17.2% 32.0% 16.4% 19.7% 32.6%
Dow
nloa
ded
by [
Nor
thea
ster
n U
nive
rsity
] at
20:
34 1
1 O
ctob
er 2
014
PSYCHOTHERAPEUTIC SERVICE DELIVERY 167
workers in the National Association of Social Workers is 1.03, or slightly more nonmembers than members (Knesper et al., 1985). State licensure lists are unreli- able because qualrfying criteria vary widely-some mental health service licenses are specific (e.g., clinical psychologist), whereas others are generic (e.g., psycholo- gist). Use of the terminal degree also is problematic, because some professionals have obtained their training through formal programs (e.g., accredited psychiatric residency) while others use another degree (e.g., PhD in Educational Psychology with appropriate clinical experience) to claim expertise in psychotherapeutic prag- tice. Despite these caveats, a few researchers have made estimates of the number of qualified providers.
Knesper et al. (1985) estimated the number of psychiatrists, clinical psycholo- gists, and social workers offering services in the year 1983. They used membership directories of professional organizations (American Psychiatric Association, Amer- ican Psychological Association, National Association of Social Workers), and clinical affiliation organizations (National Register of Health Care Providers) to identrfy terminal-degree, trained mental health providers. Using available data on nonmem- ber to member ratios, Knesper et al. (1985) computed estimates of the number of providers in each category in 1983. There was a total of 128,192 mental health specialty providers: 28,729 psychiatrists, 44,580 psychologists, and 54,883 psy- chiatric social workers. In addition, they estimated that 116,642 primary care physicians provided mental health services in 1983.
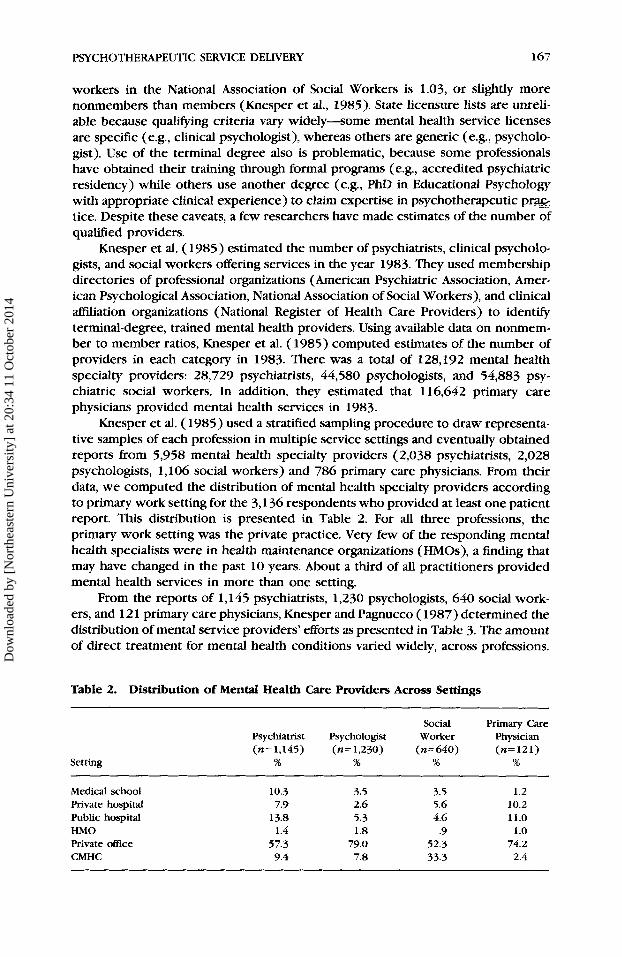
Knesper et al. (1985) used a stratified sampling procedure to draw representa- tive samples of each profession in multiple service settings and eventualiy obtained reports from 5,958 mental health specialty providers (2,038 psychiatrists, 2,028 psychologists, 1,106 social workers) and 786 primary care physicians. From their data, we computed the distribution of mental health specialty providers according to primary work setting for the 3,136 respondents who provided at least one patient report. This distribution is presented in Table 2. For all three professions, the primary work setting was the private practice. Very few of the responding mental health specialists were in health maintenance Organizations (HMOs), a finding that may have changed in the past 10 years. About a third of all practitioners provided mental health services in more than one setting.
From the reports of 1,145 psychiatrists, 1,230 psychologists, 640 social work- ers, and 12 1 primary care physicians, Knesper and Pagnucco ( 1987) determined the distribution of mental service providers’ efforts as presented in Table 3. The amount of direct treatment for mental health conditions varied widely, across professions.
Table 2. Distribution of Mental Health Care Providers Across Settings
Setting
Social Primary Care Psychiatrist Psychologist Worker Physician
% % % % (n=1,145) (n=1,230) (n=640) (n=121)
Medical school Private hospital Public hospital HMO Private office CMHC
10.3 3.5 3.5 1.2 7.9 2.6 5.6 10.2
13.8 5.3 4.6 11.0 1.4 1.8 .9 1.0
57.3 79.0 52.3 74.2 9.4 7.8 33.3 2.4
Dow
nloa
ded
by [
Nor
thea
ster
n U
nive
rsity
] at
20:
34 1
1 O
ctob
er 2
014
168 HOWARD ET AL.
Table 3. Distribution of Mental Health Service Providers’ Efforts
Setting
Social Primary Care Psychiatrist Psychologist Worker Physician ( n = 1 , 1 4 5 ) (n=1,230) ( n = 6 4 0 ) (n= 121)
Total hours worked per week 47.5 41.4 37.3 52.8
Direct treatment for psychiatric (means>.
conditions
Percentage of total hours 69.7% 57.0% 55.2% 23.1% Hours per week 33.1 23.6 20.6 12.2
Standard deviations all ranged from 14 to 15 hours.
This likely reflects multiple roles (e.g., treatment provider, administrator, re- searcher, teacher), setting differences, and variations in work styles. Of the four types of service providers, psychiatrists spent the greatest average number of hours per week and the greatest proportion of their work week providing direct treatment for psychiatric conditions-33.1 hours, or 69.7% of their work week. Psychologists spent 23.6 hours, or 57% of their work week; social workers spent 20.6 hours, or 55.2% of their work week; and primary care physicians spent 12.2 hours, or 23.1% of their work week, treating psychiatric conditions. Psychiatrists had face-to-face contact with an average of about 10 such patients per day; psychologists and social workers averaged about six patients per day; and physicians averaged about one such patient contact per day.
Among the mental health specialty providers, patterns of service delivery differed considerably. There were sharp contrasts among the professions in the number of patients seen in a 60-day period (Knesper & Pagnucco, 1987). Psychi- atrists averaged 78 patients, psychologists 33, and social workers 32 during a 60-day interval. This likely reflects a large number of medication management consultations on the part of psychiatrists. Indeed, 45% of the patients seen by psychiatrists in a 60-day period, compared to 12.5% of patients of psychologists, had diagnoses of schizophrenia, mania, or major depression. Moreover, 58% of patients seen by psychiatrists, compared to 15% of the patients of psychologists, were being treated with medication. Approximately 30% of the patients seen by psychiatrists, but only 1 1 % seen by psychologists, had previously been hospitalized. Psychiatrists saw their patients an average of 15 sessions, compared to psychologists’ 12 sessions and social workers’ 10 sessions. These differences between professionals existed even when level of severity of illness was held constant.
Given the contrasting practice patterns and different distributions of effort across diagnostic clusters, Knesper and Pagnucco (1987) projected that the 128,192 mental health specialty providers who provided mental health visits, plus the 116,642 primary care physicians who provided mental health visits, would serve a total of 1 1.5 million patients in any given 60-day period. About half of these patients (5.4 million) would be served by mental health specialty providers. Of these 5.4 million, about one third would have diagnoses of dysthymia, anxiety, or personality disorders; a little less than one third would be diagnosed as suffering from schizo- phrenia, mania, or major depression; and about one fifth would be seen for relation- ship problems.
VandenBos (1988) has estimated that there are 44,000 psychiatrists, 55,000
Dow
nloa
ded
by [
Nor
thea
ster
n U
nive
rsity
] at
20:
34 1
1 O
ctob
er 2
014
PSYCHOTHERAPEUTIC SERVICE DELIVERY 169
clinical psychologists, 28,000 psychiatric social workers, and 3,000 psychiatric nurses qualified to offer psychotherapeutic services to the public-some 130,000 mental health specialists. These numbers are roughly in line with the numbers computed by Knesper, given annual growth rates in the professions, but may underestimate the number of social workers providing primarily mental health services. Ifwe assume that, on the average, each practitioner offers 1,000 sessions a year, then approximately 130 million sessions of psychotherapy are available an- nually. Linking this figure with the epidemiologic evidence presented earlier, we see that we have the manpower in the mental health specialty sector to provide about three sessions of service per year to each person who has a diagnosable psychiatric disorder.
Primary care physicians provide a large portion of mental health services (in terms of number of patients served), even though they devote only a small portion of their practices to treating mental health conditions. Knesper and Pagnucco (1987) estimated that primary care physicians provide 53% of the mental health services, whereas psychiatrists provide 19%, social workers 15%, and psychologists 13% of such services. Primary care physicians most frequently see patients with dysthymia, anxiety, and personality disorders (25% ), substance abuse or alcoholism (18%), and relationship problems (17%). However, it is uncertain, given the absence of formal training in psychotherapy, just what services primary care physi- cians offer patients with mental health treatment needs. Active listening, advice giving, adding perspective, confirmation of the appropriateness of patient concerns, and referral to mental health care specialists may be offered in addition to medica- tion management.
PATIENTS
Following Kadushin ( 1969), merman and Weissman (1984) identlfy three different constituencies served by the psychotherapy service delivery system: (1) a core population of individuals with a diagnosed illness of fairly long standing; (2) in- dividuals who are having trouble coping with stressful life events; and (3) in- dividuals who are attempting to enhance their lives and achieve a greater measure of happiness, fulfillment, and satisfaction.
In the NIMH ECA surveys (see Table 4), 10.2% of people with a current DSM-I11 disorder, 4.6% of those with a past (more than 6 months previous) disorder, and 1.4% of those without such a disorder made a visit to a mental health specialist in a
Table 4. Percent of People Who Reported Making at Least One Visit to a Mental Health Specialist in the Past 6 Months
Site
Current DSM-I11 Past DSM-111 No DSM-111 Diagnosis Diagnosis Diagnosis
% % %
Baltimore Los Angeles New Haven St. Louis Average
8.1 11.0 12.4 9.3
10.2
4. I 4.1 7.6 2.8 4.6
1.5 2.6 1.3 0.4 1.4
Dow
nloa
ded
by [
Nor
thea
ster
n U
nive
rsity
] at
20:
34 1
1 O
ctob
er 2
014
170 HOWARD ET AL.
6-month period (Hough et al., 1987; Shapiro et al., 1984). This means that, of the 7 million people who made a visit to a mental health specialist in the past 6 months, about 4 million people had a current DSM-I11 diagnosis, 1 million had a past disorder, and 2 million had never qualified for a DSM-I11 diagnosis.
Of those people who had a DSM-111 diagnosis, those suffering from schizophre- nic/schizophreniform disorders during the previous 6 months were the most likely to make a visit to a mental health specialist during that time: 38% of them made such a visit. Only 18% of those diagnosed with a DSM-111 affective disorder in the past 6 months saw a mental health specialist during that time; only 11% of those with an anxiety or somatoform disorder saw a mental health specialist in the previous 6 months; and 10% of those with substance abuse problems saw a mental health specialist during that time (Shapiro et al., 1984). The extent of the lack of services provided for people with mental disorders is underscored by the fact that those suffering from the most prevalent disorders received the least care; substance abusers and people with anxiety/somatoform disorders were less likely to make mental health visits to a mental health specialist than were any other diagnostic groups, except those with cognitive impairment (Shapiro et al., 1984).
Based on frndings from the National Medical Care Expenditure Survey (NMCES, 1977-1978) Horgan (1985) estimated that 4.6% of the noninstitutionalized U.S. population made at least one ambulatory mental health visit in 1977. A mental health visit was defined as any visit with a mental disorder as the reason given for the visit, or any visit to a psychiatrist, psychologist, or a psychiatric clinic regardless of reason. Only two fifths of the people who made a mental health visit made visits to providers in the specialty mental health sector, the other three ftfths made visits to primary care physicians.
In the national household psychic distress survey it was estimated that about 6% of individuals over 18 years of age made a visit to a mental health professional in a 12-month period (Balter, Mellinger, & Uhlenhuth, 1985). These investigators found that 13.4% of the people who scored high on their index of psychological distress made a visit to a mental health professional and 4% of people who scored in the normal range on this index made such a visit in a 12-month period. Since 25.6% of their sample scored high on psychological distress and 74.4% scored in the normal range, they estimated that 6.9 million people were symptomatic and made a visit to a mental health specialist, while 6.0 million people were asymptomatic (on this particular index) and made such a visit in a 12-month period. If 13 million people visit a mental health professional in a given year and if there are 130 million sessions available annually, then we have the manpower to provide 10 sessions to the people who actually enter the mental health service delivery system.
From their representative stratified sample of 5,958 mental health service providers, Knesper et al. (1985) obtained information on the last five adult patients terminated from one-to-one treatment or the last five adult patients just seen in treatment. Then for each provider a single patient was selected at random from the five patients reported. This provided a large sample of patients in treatment (3,186 cases) and produced descriptions of diagnostic clusters and levels of severity, and permitted the analysis of treatments-by-professions-by-settings interactions. Knes- per, Belcher, and Cross ( 1988) report the distribution of diagnoses shown in Table 5 based on the reports of 880 psychiatrists and 966 psychologists for 1,846 patients. Nearly half of the patients in treatment had received diagnoses of neurosis (dysth- ymia), anxiety, or personality disorders. A little less than one fourth carried di- agnoses of major depression or mania. About 40% of patients seen by psychiatrists
Dow
nloa
ded
by [
Nor
thea
ster
n U
nive
rsity
] at
20:
34 1
1 O
ctob
er 2
014
PSYCHOTHERAPEUTIC SERVICE DELIVERY 171
Table 5. Mental Health Service Providers Survey: Distribution of Diagnoses
SchizophrenialSchizophreniform Major depression or mania Neurotic, anxiety, or personality disorder Relationship problem (V-code)
18.2% 22.5% 46.0% 13.3%
and psychologists had disorders involving more serious impairment (defined as a DSM Global Assessment Scale [GAS] score of 49 or less, and including the schizo- phrenias, major depression, and mania).
Patient characteristics differed across treatment settings. The distribution of diagnostic clusters of 12,272 patients reported on by the mental health providers in the Knesper studies is presented in Table 6. All disorders were more frequently seen in private practice ofices than in any other setting. In addition to private practice offices, patients with more serious disorders were also more likely to be seen in public hospitals and community mental health centers. Nearly three out of four patients with neurosis (dysthymia), anxiety or personality disorders, and relation- ship problems were likely to be seen in private practice offices.
The frequency with which patients are seen in different settings varies some- what according to which mental health specialist is providing the treatment. For example, patients treated in community mental health centers and other community settings are seen less often than patients in private practice, if their condition is less serious (GAS score of 50 or more). Patients with more serious disorders are seen less frequently in community settings compared to private practice if the provider is a psychiatrist but not if the provider is a psychologist. These discrepancies in treatment duration existed despite similar initial levels of severity across settings.
UTILIZATION OF OUTPATIENT PSYCHOTHERAPY
The findings regarding the characteristics of people who use the mental health service delivery system have been quite consistent: “The specialty mental health
Table 6. Distribution of Patient Diagnostic Clusters across Treatment Settings
Settings
Medical Private Public Private Diagnostic School Hospital Hospital HMO Ofice CMHC Cluster n % % % % % %
Schizophrenias 1,275 4.9 7.9 24.5 1.0 39.1 22.6 Major mective 1,478 8.8 12.8 1.7 1.7 52.9 15.2 Substance Abuse 676 5.2 11.4 20.7 0.4 47.5 14.8 Somatoform 316 10.8 4.4 4.4 1.9 67.0 11.4 Psychosexual 311 8.7 4.2 4.2 1.6 73.3 8.0 Neurosis, anxiety, 5,540 6.0 4.0 4.4 1 .o 74.5 10.0
or personality disorders
Relationship 2,676 4.3 2.4 4.2 1.0 71.5 16.0
Dow
nloa
ded
by [
Nor
thea
ster
n U
nive
rsity
] at
20:
34 1
1 O
ctob
er 2
014
172 HOWARD ET AL.
sector serves a greater proportion of the young, white people who reside in large cities, who come from households where the head had 13 or more years of schooling, and who reported themselves in excellent or good health” (Horgan, 1985, p. 571).
In the National Medical Care Utilization and Expenditure Survey (NMCUES, 1980-1981), the authors (Taube et al., 1984) report that 44% of the persons who made a mental health visit to an office-based psychologist or psychiatrist made less than four visits and accounted for 6.7% of the total expenditures. By contrast, only 16.2% made more than 24 visits but accounted for 57.4% of total expenditures.
In the NMCES (Horgan, 1985), it was found that, of people making a mental health visit, 52.5% made five or more visits. This group accounted for 89.6% of the total mental health visits in a 12-month period: “Most people who use the specialty sector are not high users-almost one half of persons who used this sector had less than five visits. However, the mean number of visits per person . . . was almost ten, thus suggesting that a small proportion of the user population are particularly heavy users” (Horgan, 1985, p. 571).
Because of the importance of the specialty mental health sector in offering outpatient services, it would be instructive to look at only those people who made a visit to a mental health provider (MHP). A visit to an MHP was defined as any visit to a psychiatrist, psychologist, social worker, or counselor. Of the 11,734 respondents over the age of 17, 352 (3.0%) made at least one visit to an MHP during the 12-month time frame of the NMCUES.
In examining all the visits to an MHP for each of the 352 people who had made at least one such visit in the last 12 months (over 3600 visits), it was noted that several people made a visit to more than one type of MHP. Consequently, we decided to limit our definition of psychotherapy to include only multiple visits to the same type of MHP. This does not guarantee that the visits were to the same therapist (i.e., we only know that the provider was a particular type of provider), but it does identlfy the cases where it is obvious that multiple visits were not to the same therapist.
How many visits does it take to quallfy a patient as being exposed to psy- chotherapy? Because there is no consensus on this matter, several defrnitions (1, 3, 6,8,20, and 26 visits) were examined along with the demographic characteristics of those who met these various definitions. Since several people made visits to a psychiatrist on a once per month (or every 6 weeks, etc.) basis, it was decided that these were probably visits for medication management, and should not count as psychotherapy. The definition of therapy must not only include multiple visits, but multiple visits within a certain time frame. As noted, several definitions of psy- chotherapy were considered: 3 visits in 5 weeks, 6 visits in 10 weeks, 8 visits in 12 weeks, 20 visits in 26 weeks, and 26 visits in 32 weeks. The definitional time frames (e.g., 10 weeks for six sessions) were chosen to allow for missed sessions and scheduling variations.
There were striking differences between the overall sample and the 352 people who made at least one visit to an MHP during the year. There were also differences that increased monotonically over the subsamples as the definition of psychotherapy became more restrictive. But because the number in the subsamples decreased so rapidly (there were only 30 people who met the definition of 26 visits in 32 weeks), 8 visits in 12 weeks was selected as our definition of exposure to psychotherapy. This definition yielded a reasonable sample size (N=80) and is consistent with work that shows that the Effective Dose-50 of psychotherapy is about 8 sessions (Howard, Kopta, Krause, 81 Orlinsky, 1986).
Dow
nloa
ded
by [
Nor
thea
ster
n U
nive
rsity
] at
20:
34 1
1 O
ctob
er 2
014
PSYCHOTHERAPEUTIC SERVICE DELIVERY 173
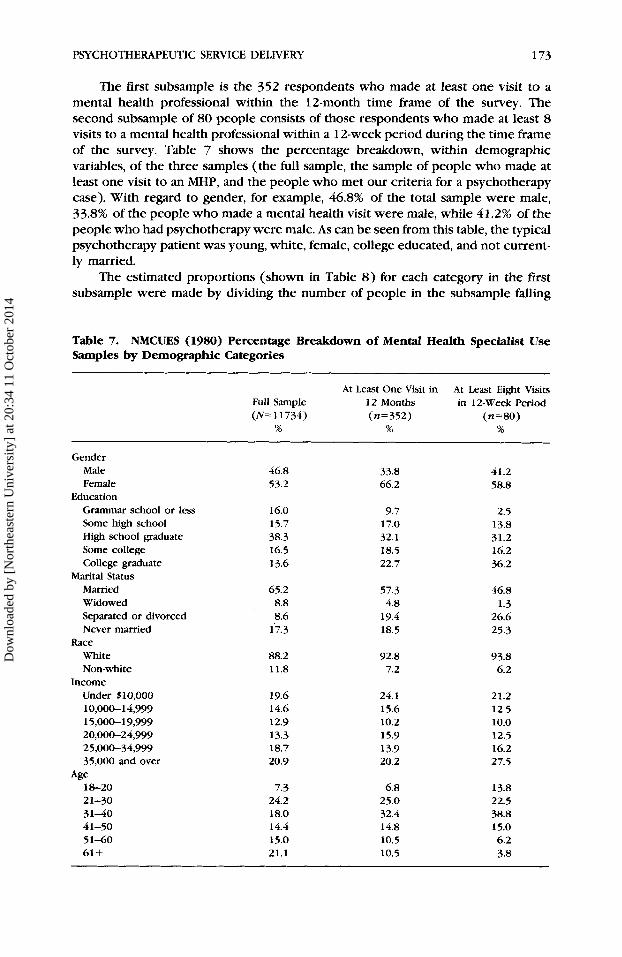
The first subsample is the 352 respondents who made at least one visit to a mental health professional within the 12-month time frame of the survey. The second subsample of 80 people consists of those respondents who made at least 8 visits to a mental health professional within a 12-week period during the time frame of the survey. Table 7 shows the percentage breakdown, within demographic variables, of the three samples (the full sample, the sample of people who made at least one visit to an MHP, and the people who met our criteria for a psychotherapy case). With regard to gender, for example, 46.8% of the total sample were male, 33.8% of the people who made a mental health visit were male, while 41.2% of the people who had psychotherapy were male. As can be seen from this table, the typical psychotherapy patient was young, white, female, college educated, and not current- ly married.
The estimated proportions (shown in Table 8) for each category in the first subsample were made by dividing the number of people in the subsample falling
Table 7. NMCUES (1980) Percentage Breakdown of Mental Health Specialist Use Samples by Demographic Categories
At Least One Visit in At Least Eight Visits Full Sample 12 Months in 12-Week Period (N= 11734) (n=352) (n=80)
% % %
Gender Male Female
Education Grammar school or less Some high school High school graduate Some college College graduate
Marital Status Married Widowed Separated or divorced Never married
White Non-white
Under S10,OOO 10,0061 4,999 15,00619,999 20,00624,999 25,000-34,999 35,000 and over
Race
Income
Age 1 a 2 0 21-30 31-40 41-50 5 1-60 61+
46.8 53.2
16.0 15.7 38.3 16.5 13.6
65.2 8.8 8.6
17.3
88.2 11.8
19.6 14.6 12.9 13.3 18.7 20.9
7.3 24.2 18.0 14.4 15.0 21.1
33.8 66.2
9.7 17.0 32.1 18.5 22.7
57.3 4.8
19.4 18.5
92.8 7.2
24.1 15.6 10.2 15.9 13.9 20.2
6.8 25.0 32.4 14.8 10.5 10.5
41.2 58.8
2.5 13.8 31.2 16.2 36.2
46.8 1.3
26.6 25.3
93.8 6.2
21.2 12.5 10.0 12.5 16.2 27.5
13.8 22.5 38.8 15.0 6.2 3.8
Dow
nloa
ded
by [
Nor
thea
ster
n U
nive
rsity
] at
20:
34 1
1 O
ctob
er 2
014
174 HOWARD ET AL.
into a particular demographic category who made a visit to an MHP by the number of people in the full sample falling into that category. The estimated proportions for each category in the second subsample represent the number of people mak- ing eight MHP visits within 12 weeks divided by the number of people who made at least one visit. Because there was no way of telling whether a respondent who made a visit to an MHP early in the year had made more visits in the pre- vious year or whether a respondent who made a visit late in the sample year con- tinued to make visits in the next year, the conditional probabilities (of making eight visits, given a visit) were calculated on the basis of those respondents who could possibly have made eight visits to an MHP during the sample year (N=249). (We considered only those respondents who made a visit to an MHP during the middle six months; this gave us a sufficient time frame outside of those 6 months to see if the respondents had in fact seen an MHP seven times in the previous 1 1 weeks, or had continued to see an MHP seven more times in the subsequent 11 weeks). This procedure enabled an accurate estimate of the conditional probabilit- ies, assuming that there is negligible seasonal variation in the utilization of psy- chotherapy.
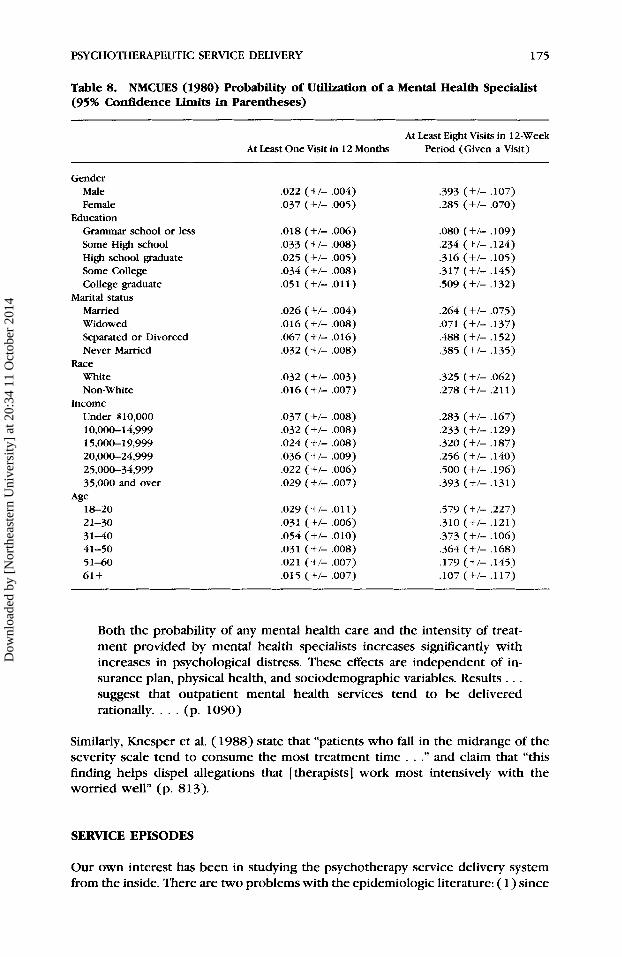
Table 8 shows the probability, within demographic category, of making a visit to an MHP and of entering psychotherapy. With regard to gender, for example, males had a .022 probability of making a mental health visit; males had a .393 probability of entering psychotherapy, if they made a visit to an MHP. Females had a .037 prob- ability of making a mental health visit; females had a .285 probability of en- tering psychotherapy, if they made a visit to an MHP. As Table 8 shows, males were more likely to enter psychotherapy, if they made any mental health visits at all. There was a linear relationship with level of education; a college graduate who made a visit to an MHP had a .509 probability of entering psychotherapy (i.e., mak- ing at least eight visits), while a high school graduate had only a .234 probability. Older people were much less likely to enter psychotherapy. People who were separated or divorced had a relatively high probability of making at least one mental health visit (.07) and a relatively high probability of subsequently engaging in treatment (.49).
National surveys have attempted to relate a number of patient variables to psychotherapy utilization. The effect of insurance coverage has been of particular interest, given the national health policy planning orientation of the investigators. Horgan ( 1985), analyzing the NMCES data, found that number of visits was negative- ly related to (the log of) the percentage of cost paid out-of-pocket-that is, the more out-of-pocket cost, the fewer the visits. Taube et al. (1986), analyzing the NMCUES data, found that demand for mental health service was responsive to price, but not for users with yearly incomes greater than $25,000. In contrast to these findings, Keeler, Wells, Manning, Rumod, & Hanley (1986), reporting on the RAND Health Insurance Experiment, found that, while insurance coverage appeared to influence the decision to use mental health services, it was not related to level of use, given any use. Watts, Scheffler, and Jewel1 (1986), analyzing utilization in a study of the Federal Employees Health Benefit Plan, found that level of use in a heavily insured population within a year was not responsive to price. Knesper and colleagues (1988), in their national survey of psychiatrists and psychologists, also reported that “insurance may only serve to lower entry barriers and not to perpetuate treatment” (p. 815).
Using data from the RAND Health Insurance Experiment, Ware, Manning, Duvan, Wells, and Newhouse (1984) report that
Dow
nloa
ded
by [
Nor
thea
ster
n U
nive
rsity
] at
20:
34 1
1 O
ctob
er 2
014
PSYCHOTHERAPEUTIC SERVICE DELIVERY 175
Table 8. NMCUES (1980) Probability of Utilization of a Mental Health Specialist (95% Contidence Limits in Parentheses)
At Least Eight Visits in 12-Week Period (Given a Visit) At Least One Visit in 12 Months
Gender Male Female
Education Grammar school or less Some High school High school graduate Some College College graduate
Marital status Married Widowed Separated or Divorced Never Married
White Non-White
Under $10,000 10,00&14,999 15,000-19,999 20,000-24,999 25,000-34,999 35,000 and over
Race
Income
Age l a 2 0 21-30 3 1-40 41-50 51-60 61 +
,022 (+/- ,004) ,037 (+/- .005)
,018 (+/- ,006) ,033 (+/- ,008) ,025 (+/- ,005) ,034 (+/- ,008) ,051 (+/- ,011)
.026 (+/- ,004) ,016 (+/- ,008) ,067 (+/- ,016) ,032 (+/- ,008)
,032 (+/- ,003) ,016 (+/- ,007)
.037 (+/- ,008) ,032 (+/- ,008) ,024 (+/- ,008) .036 (+/- ,009) ,022 (+/- ,006) ,029 (+/- ,007)
,029 (+/- ,011) ,031 (+/- ,006)
,031 (+/- ,008) .02 1 (+/- ,007)
,054 (+/- ,010)
,015 (+/- ,007)
,393 (+I- ,107) ,285 (+/- ,070)
,080 (+/- ,109) ,234 (+/- ,124) ,316 (+I- ,105) .317 (+I- ,145) ,509 (+/- ,132)
,264 (+/- ,075) ,071 (+/- ,137) ,488 (+/- ,152) ,385 (+/- ,135)
,325 (+/- ,062) ,278 (+/- ,211)
,283 (+I- ,167) ,233 (+I- ,129) .320 (+/- ,187) ,256 (+/- ,140) ,500 (+/- ,196) .393 (+/- ,131)
,579 (+/- ,227) ,310 (+/- .121) ,373 (+/- ,106) ,364 (+/- .16S) .I79 (+I- .145) ,107 (+/- ,117)
Both the probability of any mental health care and the intensity of treat- ment provided by mental health specialists increases signficantly with increases in psychological distress. These effects are independent of in- surance plan, physical health, and sociodemographic variables. Results . . . suggest that outpatient mental health services tend to be delivered rationally. . . . (p. 1090)
Similarly, Knesper et al. (1988) state that “patients who fall in the midrange of the severity scale tend to consume the most treatment time . . .” and claim that “this finding helps dispel allegations that [therapists] work most intensively with the worried well” (p. 813).
SERVICE EPISODES
Our own interest has been in studying the psychotherapy service delivery system from the inside. There are two problems with the epidemiologic literature: ( 1 ) since
Dow
nloa
ded
by [
Nor
thea
ster
n U
nive
rsity
] at
20:
34 1
1 O
ctob
er 2
014
176 HOWARD ET AL.
surveys use a specific time frame (e.g., “last 6 months”), it is difficult to get estimates of the amount of utilization per patient; and (2) even though sample sizes are large, the number of persons making a visit to a mental health specialist is quite small, thus making it difficult to disaggregate beyond some basic demographic categories. For example, in the NMCUES there were almost 18,000 respondents, but only 715 people made a mental health visit and only 67 made more than 24 visits (Taube, Kessler, & Burns, 1986). Across the ECA sites, we have estimated that about 600 people made a mental health visit to a specialist; of these 220 made more than 8 visits and about 60 made more than 24 visits (Shapiro, 1987).
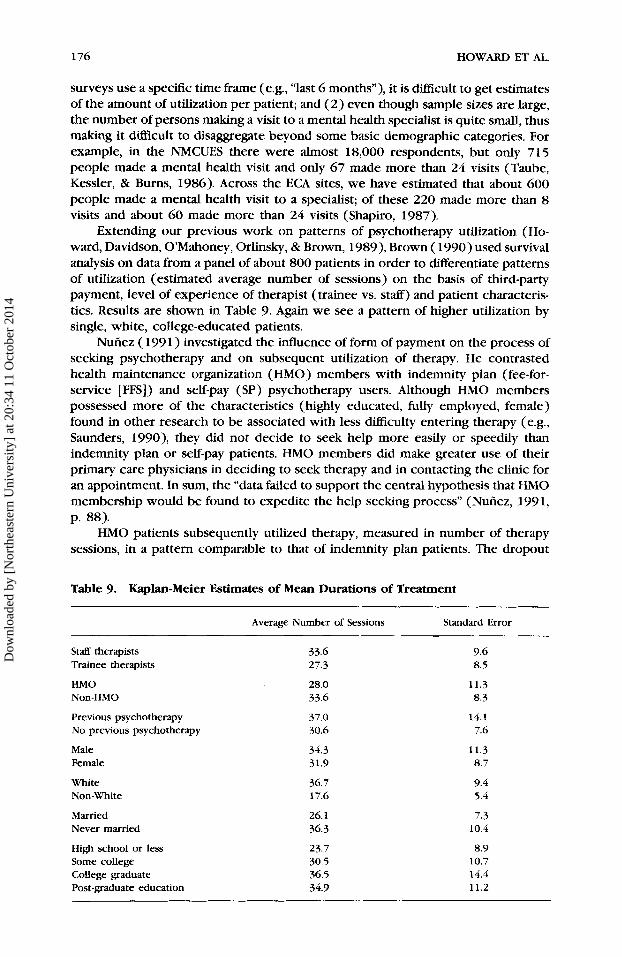
Extending our previous work on patterns of psychotherapy utilization (Ho- ward, Davidson, O’Mahoney, Orlinsky, & Brown, l989), Brown ( 1990) used survival analysis on data from a panel of about 800 patients in order to differentiate patterns of utilization (estimated average number of sessions) on the basis of third-party payment, level of experience of therapist (trainee vs. staff) and patient characteris- tics. Results are shown in Table 9. Again we see a pattern of higher utilization by single, white, college-educated patients.
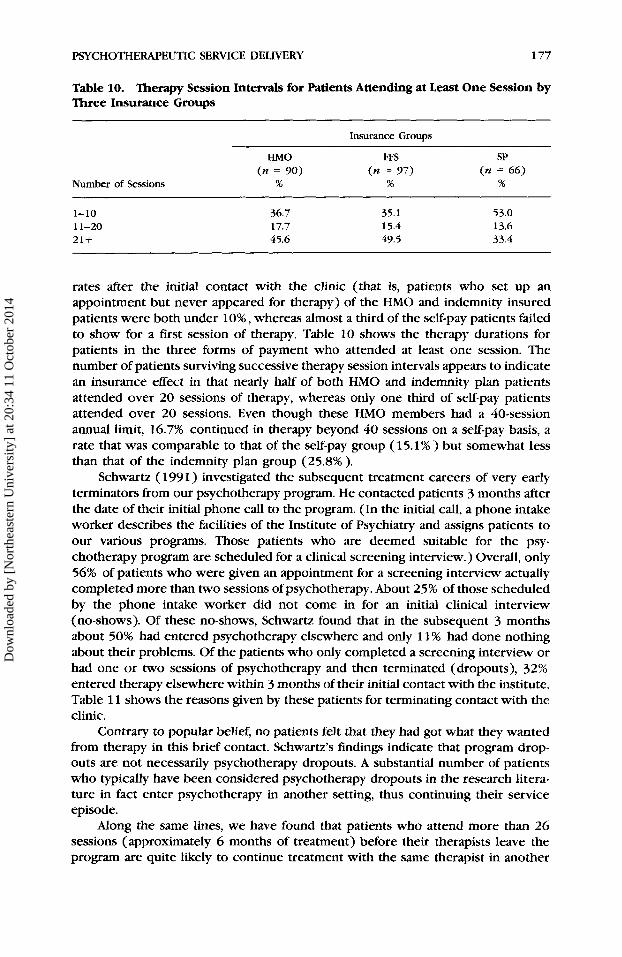
Nuhez ( 1991) investigated the influence of form of payment on the process of seeking psychotherapy and on subsequent utilization of therapy. He contrasted health maintenance organization (HMO) members with indemnity plan (fee-for- service [FFS]) and self-pay (SP) psychotherapy users. Although HMO members possessed more of the characteristics (highly educated, fully employed, female) found in other research to be associated with less difficulty entering therapy ( e g , Saunders, 1990), they did not decide to seek help more easily or speedily than indemnity plan or self-pay patients. HMO members did make greater use of their primary care physicians in deciding to seek therapy and in contacting the clinic for an appointment. In sum, the “data failed to support the central hypothesis that HMO membership would be found to expedite the help seeking process” (Nuhez, 199 1, p. 88).
HMO patients subsequently utilized therapy, measured in number of therapy sessions, in a pattern comparable to that of indemnity plan patients. The dropout
Table 9. Kaplan-Meier Estimates of Mean Durations of Treatment ~
Average Number of Sessions Standard Error
Staff therapists Trainee therapists
HMO Non-HMO
Previous psychotherapy No previous psychotherapy
Male Female
White Non-White
Married Never married
33.6 27.3
28.0 33.6
37.0 30.6
34.3 31.9
36.7 17.6
26.1 36.3
9.6 8.5
11.3 8.3
14.1 7.6
11.3 8.7
9.4 5.4
7.3 10.4
High school or less 23.7 8.9 Some college 30.5 10.7 College graduate 36.5 14.4 Post-graduate education 34.9 11.2
Dow
nloa
ded
by [
Nor
thea
ster
n U
nive
rsity
] at
20:
34 1
1 O
ctob
er 2
014
PSYCHOTHERAPEUTIC SERVICE DELIVERY 177
Table 10. Therapy Session Intervals for Patients Attending at Least One Session by Three Insurance Groups
Insurance Groups
Number of Sessions
HMO FFS SP (n = 90) (n = 97) ( n = 6 6 )
% % %
1-10 11-20 21 +
36.7 17.7 45.6
35.1 15.4 49.5
53.0 13.6 33.4
rates after the initial contact with the clinic (that is, patients who set up an appointment but never appeared for therapy) of the HMO and indemnity insured patients were both under lo%, whereas almost a third of the self-pay patients failed to show for a first session of therapy. Table 10 shows the therapy durations for patients in the three forms of payment who attended at least one session. The number of patients surviving successive therapy session intervals appears to indicate an insurance effect in that nearly half of both HMO and indemnity plan patients attended over 20 sessions of therapy, whereas only one third of self-pay patients attended over 20 sessions. Even though these HMO members had a 40-session annual limit, 16.7% continued in therapy beyond 40 sessions on a self-pay basis, a rate that was comparable to that of the self-pay group ( 15.1 % ) but somewhat less than that of the indemnity plan group (25.8% ).
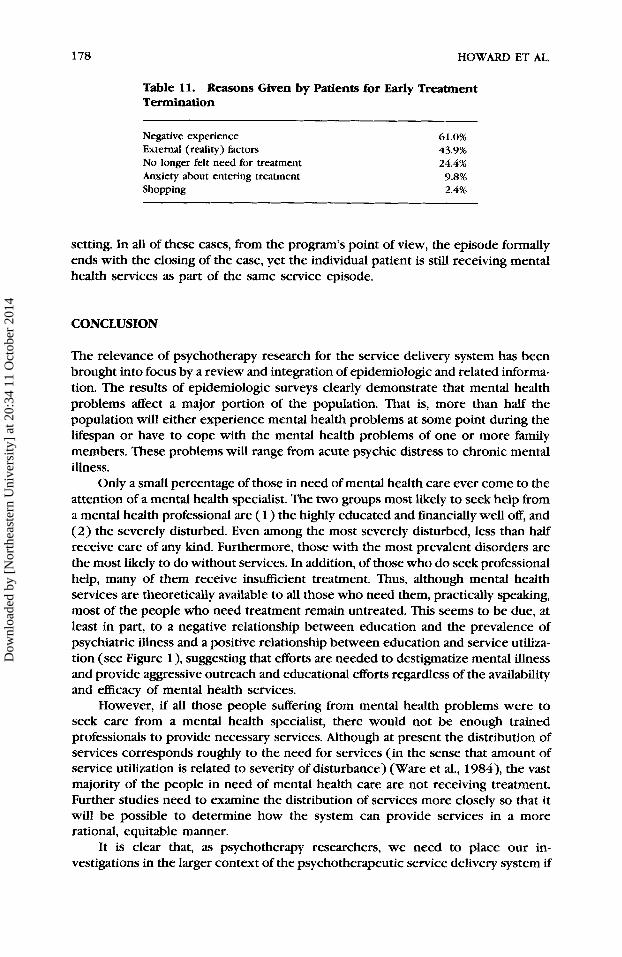
Schwartz (199 1) investigated the subsequent treatment careers of very early terminators from our psychotherapy program. He contacted patients 3 months after the date of their initial phone call to the program. (In the initial call, a phone intake worker describes the facilities of the Institute of Psychiatry and assigns patients to our various programs. Those patients who are deemed suitable for the psy- chotherapy program are scheduled for a clinical screening interview.) Overall, only 56% of patients who were given an appointment for a screening interview actually completed more than two sessions of psychotherapy. About 25% of those scheduled by the phone intake worker did not come in for an initial clinical interview (no-shows). Of these no-shows, Schwartz found that in the subsequent 3 months about 50% had entered psychotherapy elsewhere and only 1 1 % had done nothing about their problems. Of the patients who only completed a screening interview or had one or two sessions of psychotherapy and then terminated (dropouts), 32% entered therapy elsewhere within 3 months of their initial contact with the institute. Table 11 shows the reasons given by these patients for terminating contact with the clinic.
Contrary to popular belief, no patients felt that they had got what they wanted from therapy in this brief contact. Schwartz’s findings indicate that program drop- outs are not necessarily psychotherapy dropouts. A substantial number of patients who typically have been considered psychotherapy dropouts in the research litera- ture in fact enter psychotherapy in another setting, thus continuing their service episode.
Along the same lines, we have found that patients who attend more than 26 sessions (approximately 6 months of treatment) before their therapists leave the program are quite likely to continue treatment with the same therapist in another
Dow
nloa
ded
by [
Nor
thea
ster
n U
nive
rsity
] at
20:
34 1
1 O
ctob
er 2
014
178 HOWARD ET AL.
Table 11. Reasons Given by Patients for Early Treatment Termination
Negative experience External (reality) factors No longer felt need for treatment Anxiety about entering treatment Shopping
61.0% 43.9% 24.4% 9.8% 2.4%
setting. In all of these cases, from the program’s point of view, the episode formally ends with the closing of the case, yet the individual patient is still receiving mental health services as part of the same service episode.
CONCLUSION
The relevance of psychotherapy research for the service delivery system has been brought into focus by a review and integration of epidemiologic and related informa- tion. The results of epidemiologic surveys clearly demonstrate that mental health problems affect a major portion of the population. That is, more than half the population will either experience mental health problems at some point during the lifespan or have to cope with the mental health problems of one or more family members. These problems will range from acute psychic distress to chronic mental illness.
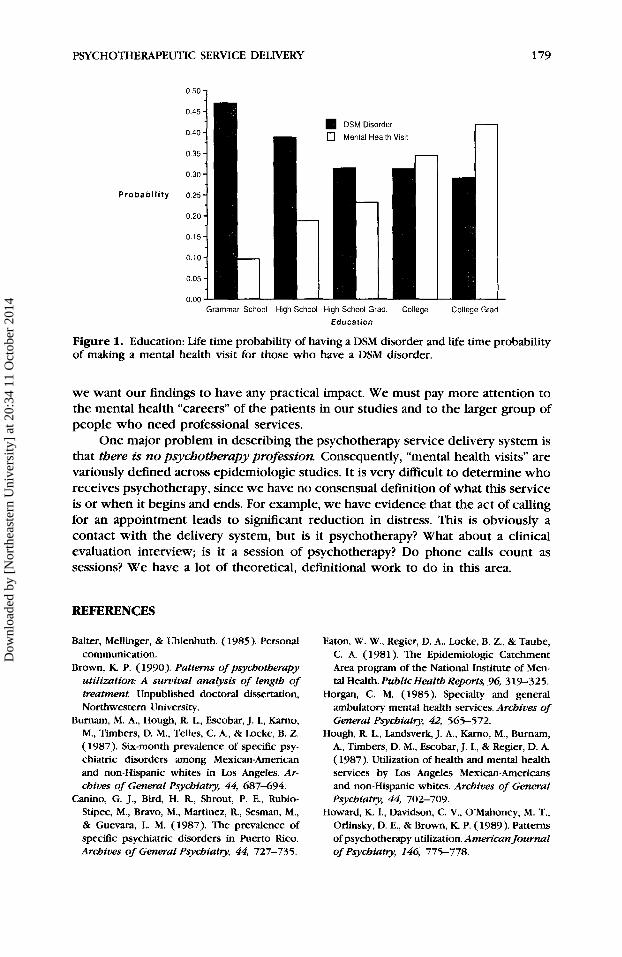
Only a small percentage of those in need of mental health care ever come to the attention of a mental health specialist. The two groups most likely to seek help from a mental health professional are ( 1 ) the highly educated and financially well off, and (2) the severely disturbed. Even among the most severely disturbed, less than half receive care of any kind. Furthermore, those with the most prevalent disorders are the most likely to do without services. In addition, of those who do seek professional help, many of them receive insufficient treatment. Thus, although mental health services are theoretically available to all those who need them, practically speaking, most of the people who need treatment remain untreated. This seems to be due, at least in part, to a negative relationship between education and the prevalence of psychiatric illness and a positive relationship between education and service utiliza- tion (see Figure l), suggesting that efforts are needed to destigmatize mental illness and provide aggressive outreach and educational efforts regardless of the availability and efficacy of mental health services.
However, if all those people suffering from mental health problems were to seek care from a mental health specialist, there would not be enough trained professionals to provide necessary services. Although at present the distribution of services corresponds roughly to the need for services (in the sense that amount of service utilization is related to severity of disturbance) (Ware et al., 1984), the vast majority of the people in need of mental health care are not receiving treatment. Further studies need to examine the distribution of services more closely so that it will be possible to determine how the system can provide services in a more rational, equitable manner.
It is clear that, as psychotherapy researchers, we need to place our in- vestigations in the larger context of the psychotherapeutic service delivery system if
Dow
nloa
ded
by [
Nor
thea
ster
n U
nive
rsity
] at
20:
34 1
1 O
ctob
er 2
014
PSYCHOTHERAPEUTIC SERVICE DELIVERY
0 50 1
DSM Disorder
0 Mental Health Visit
P r o b a b i l i t y
179
Grammar School High School High School Grad. College
Education College Grad
Figure 1. Education: Life time probability of having a DSM disorder and life time probability of making a mental health visit for those who have a DSM disorder.
we want our findings to have any practical impact. We must pay more attention to the mental health “careers” of the patients in our studies and to the larger group of people who need professional services.
One major problem in describing the psychotherapy service delivery system is that there is no psychotherupy profession Consequently, “mental health visits” are variously defined across epidemiologic studies. It is very difficult to determine who receives psychotherapy, since we have no consensual definition of what this service is or when it begins and ends. For example, we have evidence that the act of calling for an appointment leads to sigtllfcant reduction in distress. This is obviously a contact with the delivery system, but is it psychotherapy? What about a clinical evaluation interview; is it a session of psychotherapy? Do phone calls count as sessions? We have a lot of theoretical, definitional work to do in this area.
REFERENCES
Balter, Mellinger, & Uhlenhuth. (1985). Personal communication.
Brown, K P. (1990). Patterns of psychotherapy utilization: A survival analysis of length of treatment. Unpublished doctoral dissertation, Northwestern University.
Burnam, M. A., Hough, R. L., Escobar, J. I., Karno, M., Timbers, D. M., Telles, C. A., & Locke, B. 2. (1987). Six-month prevalence of specific psy- chiatric disorders among Mexican-American and non-Hispanic whites in Los Angeles. Ar- chives of General Psychiatry, 44, 687-694.
Canino, G. J., Bird, H. R, Shout, P. E., Rubio- Stipec, M., Bravo, M., Martinez, R, Sesman, M., & Guevara, L. M. (1987). The prevalence of specific psychiatric disorders in Puerto Rico. Archives of General Psychiatry, 44, 727-735.
Eaton, W. W., Regier, D. A., Locke, B. Z., & Taube, C. A. (1981). The Epidemiologic Catchment Area program of the National Institute of Men- tal Health. PublicHealth Reports, 96, 319-325.
Horgan, C. M. (1985). Specialty and general ambulatory mental health services. Archives of General Psychiatry, 42, 565-572.
Hough, R. L., Landsverk, J. A,, Karno, M., Burnam, A., Timbers, D. M., Escobar, J. I., & Regier, D. A. (1987). Utilization of health and mental health services by Los Angeles Mexican-Americans and non-Hispanic whites. Archives of General psychiatry, 44, 702-709.
Howard, K I., Davidson, C. V., OMahoney, M. T., Orlinsky, D. E., & Brown, K P. (1989). Patterns of psychotherapy utilization. American Journal of Psychiatry, 146, 775-778.
Dow
nloa
ded
by [
Nor
thea
ster
n U
nive
rsity
] at
20:
34 1
1 O
ctob
er 2
014
180 HOWARD ET AL.
Howard, K. I., Kopta, S. M., Krause, M. S., & Orlin- sky, D. E. (1986). The dose-effect relationship in psychotherapy. American Psychologist, 41, 159-164.
Kadushin, C. (1969). Why people go to psychi- atrists. New York: Atherton.
Karno, M., Hough, R. L., Burnam, A,, Escobar, J. I., Timbers, D. M., Santana, F., & Boyd, J. H. (1987). Lifetime prevalence of specific psy- chiatric disorders among Mexican-Americans and nowHispanic whites in Los Angeles. Ar- chives of General Psychiatry, 44, 695-701.
Keeler, E. B., Wells, K B., Manning, W. G., Rumod, J. D., & Hanley, J. (1986). The demand for episodes of mental health (R-342-NIMH). Santa Monica, CA: RAND Corporation.
Klerman, G. L., 81 Weissman, M. M. (1984) An epidemiologic view of mental illness, mental health, and normality. In D. Offer & M. Sabshin (Eds.), Normality and the life cycle (pp. 315- 344). New York: Basic.
Knesper, D. J., Belcher, D. T., & Cross, J. C. ( 1988). Variations in the intensity of psychiat- ric treatment across markets for mental health services in the United States. Health Services Research, 22, 797-8 19.
Knesper, D. J., & Pagnucco, D. J. (1987). Es- timated distribution of effort by providers of mental health services to US. adults in 1982 and 1983. Ammican Journal of Psychiatry, 144, 883-888.
Knesper, D. J., Pagnucco, D. J., & Wheeler, J. R. C. (1985). Similarities and differences across mental health service providers and practice settings in the United States. American Psy- chologist, 40, 1352-1369.
Nunez, P. R. (1991). HMO membership and the process of seeking therapy. Unpublished doc- toral dissertation, Northwestern University.
Regier, D. A., Boyd, J. H., Burke, J. D., Rae, D. S., Myers, J. K, Kramer, M., Robins, L. N., George, L. K, Karno, M., & Locke, B. 2. (1988). One- month prevalence of mental disorders in the United States. Archives of General Psychiatry,
Regier, D. A., Myers, J. K, Kramer, M., Robins, L. N., Blazer, D. G., Hough, R. L., Eaton, W. W., & Locke, B. 2. (1984). The NIMH Epidemiologic Catchment Area Program: Historical context,
45, 977-980.
major objectives, and study population charac- teristics. Archives of General Psychiam, 41, 934-941.
Robins, L. N., Helzer, J. E., Croughhan, J., & Ratc- 18, K S. (1981). National Institute of Mental Health Diagnostic Interview Schedule. Archives of General Psycbiatry, 38, 381-389,
Saunders, S. M. (1990). The process of seeking psychotherapy: Routes, difficulty, and social support. Unpublished doctoral dissertation, Northwestern University.
early terminators from an outpatient clinic. Unpublished doctoral dissertation, Northwest- ern University.
Schwartz, D. (1991). A fOllOW-Up Study Of VWJI
Shapiro, S. ( 1987). Personal communication. Shapiro, S., Skinner, E. A,, Kessler, L. G., Von Korff,
M., German, P. S., Tischler, G. L., Leaf, P. J., Benham, L., Cottler, L., & Regier, D. A. (1984). Utilization of health and mental health ser- vices: Three Epidemiologic Catchment Area sites. Archives of General Psychiatry, 41,
Taube, C. A., Kessler, L. G., & Burns, B. J. (1986). Estimating the probability and level of ambula- tory mental health services use. Health Services Research, 21, 32 1-340.
Taube, C. A., Kessler, L. G., & Feuerberg, M. (1984). Utilization and expenditures for ambu- latory mental health care during 1980. Nation- al Medical Care Utilization and Expenditure Suruq, Data Report 5. Washington, DC: U.S. Department of Health and Human Services.
Uhlenhuth, E. H., Balter, M. B., Mellinger, G. D., Cissin, I. H., & Clinthorne, J. (1983). Symptom checklist syndromes in the general population. Archives of General Psychiatry, 40, 1167- 1173.
VandenBos, G. ( 1988). Personal communication. Ware, J. E., Manning, W. G., Duvan, N., Wells, K B.,
& Newhouse, J. P. (1984). Health status and the use of outpatient mental health services. Amer- ican Psychologist, 39, 1090-1 100.
Watts, C. A,, Scheffler, R. M., & Jewell, N. P. (1986). Demand for outpatient mental health services in a heavily insured population: The case of Blue Cross and Blue Shield Association's Federal Employees Health Benefits Program. Health Seruices Research, 21, 267-289.
97 1-978.
Received August 1, 199 1 Accepted August 22, 1991
Dow
nloa
ded
by [
Nor
thea
ster
n U
nive
rsity
] at
20:
34 1
1 O
ctob
er 2
014