the psychology and pharmacoepidemiology of … psychology and pharmacoepidemiology of deaths and...
TRANSCRIPT
Research Article Open Access
Mental Health in Family Medicine (2016) 12: 324-342
Research Article
2016 Mental Health and Family Medicine Ltd
The Psychology and Pharmacoepidemiology of Deaths and Homicide in Jamaica: An Empirical AssessmentPaul Andrew BourneNorthern Caribbean University, Jamaica
Angela Hudson-DavisCapella University, USA
Charlene SharpeNorthern Caribbean University, Jamaica
Vincent PeterkinNorthern Caribbean University, Jamaica
Marsha PabarueNorthern Caribbean University, Jamaica
ABStrACt
Introduction: Jamaica has been featured among the nations with the highest crime rates in the world, and despite this reality, homicide and other deaths have never been examined for their effect on attendance at Accident and Emergency (A&E) or admissions to government and quasi-government hospitals.
Objectives: This paper evaluates the cross-elasticities of hospitalizations in Jamaica for a 10-year period; the effects of homicide and death rates in predicting attendance rate at A&E departments in government and quasi-government hospitals in Jamaica for a 10-year period; evaluate homicide, death, and maternity rates as predictors of admissions rate to government and quasi-government hospitals in Jamaica for a 10-year period; evaluate homicide, death, and maternity rates as predictive factors of psychiatric admissions rate to a national psychiatric hospital in Jamaica for a 10-year period; and to evaluate if the ln attendance at A&E departments and ln admissions at government and quasi-government hospitals are significantly influenced by psychiatric, homicide, death, and maternity rates in Jamaica for a 10-year periods.
Methods and materials: The data for this study were taken from a Jamaica Government Publication; the Ministry of Health reported attendance to A&E departments and admissions to all government hospitals including the quasi-hospital, University Hospital of the West Indies. The timeline for this research is 2006 through to 2015.
Results: The average number of visits to A&E at public hospitals and the University Hospital of the West Indies for the studied period was 794,596 ± 86,177, 95%CI: 762,417 – 826,775 compared to 189,267 ± 7,863, 95%CI: 186,331 – 192,203 admissions. The OLS table showed that the death rate is not a factor of log attendance rate at government and quasi-government hospitals in Jamaica (P = 0.254 > 0.05). Furthermore, a positive significant statistical correlation existed between homicide rate per 100,000 and log attendance rate per 100, beta = 1.044, P = 0.019 < 0.05), with the goodness of fit for the model being significant linear one (F [2,6] = 5.927, P = 0.038). In addition, the correlation between the two aforementioned variable being a moderately strong one (adjusted R2 = 0.555 or 55.5%).
Conclusion: Our findings support a disaggregation in screening patients who visit health care institutions based on exposure to homicide or other deaths as their impacts are different and must be addressed as such. We are prescribing that while the psychology of death is evident in this work, the matter goes beyond that to the pharmacoepidemiology of deaths.
Mesh Headings/Keywords: Attendance to A&E; Elasticity of hospitalization; Hospitalization; Probability of hospitalization; Mortality
IntroductionMortality (or death) is a ‘vital event’ that is extensively
studied by demographers [1-8], epidemiologists [9-13] as well as public health scholars [14]. Both the UN and WHO have provided various demographic models on mortality as early as the 1950s [15-19]. The UN and WHO defined death as “the permanent disappearance of all evidence of life at any time after birth has taken place” [12,13]. McGehee, et al. [4]
modified the definition of death to exclude deaths prior to (live) births (i.e., called fetal deaths)” [4].
Mortality statistics are derived from the vital statistics registration system, the United Nations, as well as the WHO. The organizations have been using these data for decades to establish life expectancy models [13,15,16] and they continue to do so even today [20-22]. Jamaica, on the other hand, has been using mortality status for many years, although not with the objectives as that of the United Nations
Paul Andrew Bourne, Angela Hudson-Davis, Charlene Sharpe, Vincent Peterkin, Marsha Pabarue.325
or the World Health Organization.
Using mortality data for Jamaica from the 1990’s, Caribbean scholars have empirically established that this information is of a moderate to high quality for this country [23-26]. However, the WHO as well as McCaw-Binns, Mullings, and Holder opined that completeness of mortality data for Jamaica is low [26-28], which is high for other Caribbean nations such as Bahamas, Barbados, Cuba, Dominica, St. Vincent and the Grenadines, and Trinidad and Tobago. Completeness of data was said to be high if it was at least 90%; moderate, 70-90% and low if it was less than 70%. A review of epidemiological and demographic literature did not reveal a single study that has examined the responsivity of hospitalization at psychiatric and maternity institutions to homicide and other deaths. With various studies data illustrating that major crimes are high in Jamaica, especially homicide [29-32] and homicide and psychiatric hospitalization [33], a study on the responsivity of admissions to a psychiatric and maternity hospital would provide insightful information on the matter of homicide and other deaths.
The search to ascertain the responsivity of hospitalization at a psychiatric and maternity institution coupled with births to homicide or other deaths were expanded to PubMed, EBSCOhost, ProQuest, and other academic databases. This research is timely as it evaluates the influence of homicide or other deaths on admissions to a maternity or psychiatric hospital as well as on births. The objectives of this paper are to evaluate: the cross-elasticities of hospitalizations for Jamaica for a 10-year period; the effects of homicide and death rates in predicting attendance rate at A&E departments in government and quasi-government hospitals in Jamaica for a 10-year period; evaluate homicide, death, and maternity rates as predictors of admissions rate to government and quasi-government hospitals in Jamaica for a 10-year period; evaluate homicide, death, and maternity rates as predictive factors of psychiatric admissions rate to a national psychiatric hospital in Jamaica for a 10-year period; and, to evaluate if the ln attendance at A&E departments and ln admissions at government and quasi-government hospitals are significantly influenced by psychiatric, homicide, death and maternity rates in Jamaica for a 10-year period.
Theoretical FrameworkKoppensteiner, et al. [34] forwarded an empirical model
to establish factors that account for birthweight including homicide. They used a linear model to express that homicide and other factors explain birth, equation (1):
0 1 at a t iatiat= + HOM +d +d +uY β β [1]
“where Yiat is the individual outcome variable (birthweight, gestational length, etc.) in area (municipality or neighbourhood) a, at time t, HOMat is the local homicide rate and da and dt are respectively mother’s area of residence and month of conception-fixed effects, while u is an error term” [34]. This paper employs a similar model to explain the
manner in which homicide or death influences hospitalization at a maternity hospital (i.e., Victoria Jubilee Hospital).
Methods and MaterialsThe data for this study were taken from a Jamaica
Government Publication; the Ministry of Health reported attendance to A&E departments and admissions to all government hospitals including the quasi-hospital, University Hospital of the West Indies. The timeline for this research is 2006 through to 2015. Data were recorded, stored and retrieved using the Statistical Packages for the Social Sciences (SPSS) for Windows, Version 24.0. The level of significance that is used to determine statistical significance is less than 5% (0.05) at the 2-tailed level of significance. Ordinary Least Square (OLS) regression was used to ascertain the correlation of attendance, homicide, and other forms of deaths in Jamaica.
In order to assure the OLS application was appropriate for this study; all assumptions were tested before usage. In cases where variables were highly inter-correlated (r > 0.7), tolerance were checked and if multi-collinearity was discovered, one of the variables was dropped and used separately in a model without the highly correlated variable.
One of the assumptions of OLS were not met, linearity, and so this violation meant that the researchers log transform the variable, attendance [35-39] (Annex Figure 9). Whether it is medical research or otherwise, interpreting the correlation coefficients is important [40,41] and Evans provided a platform [42] for correlation coefficient interpretations. Evans outlined that for r [42], very weak is 0 – 0.19; weak is 0.20-0.39; moderate is 0.40 -0.59; strong is 0.60-0.79 and very strong is 0.80-1.00 as well as for r2: very weak is 0 – < 4%; weak is 4-16%; moderate is 16-36%; strong is 36-< 64% and very strong is 64-100%. For this study, Evans’ perspective will be used to interpret the strength of squared r values, which is in keeping with similar positions by Howell [43,44]; and Howitt, et al. [45].
In using the OLS to model the correlations for this study, it was revealed that they are best expressed by curvilinear relationships and so the models are based on curvilinear functions and their correlations are interpreted by way of Evans and others’ works. Outside of OLS, for this study additional statistical techniques were employed such as multivariate analysis of variance (MANOVA), reliabily and factor analysis.
Cross-elasticities of hospitalization
( )( )
% in admissions at national psychiatric hospital i.e., Bellevue=
% in admissions at national maternity hospital i.e.,Victoria Jubilee∆
η∆
Or( )
( )Difference in Hospitalization at national psychiatric hospital i e Bellevue at time t and t
Hospitalization at national psychiatric hospital i e Bellevue at time tDifference in Hospitalizat
. ., +1×100
. .,η = ( )
( )ion at national maternity hospital i.e Victoria Jubilee at time t and t
Hospitalization at national maternity hospital i e Victoria Jubilee at time t., +1
×100. .,
Where ƞ is the elasticity of hospitalization
% ∆ denotes the percentage change in hospitalization at
The Psychology and Pharmacoepidemiology of Deaths and Homicide in Jamaica: An Empirical Assessment 326
t and t +1, where time t is one year and t +1 is the following year.
( )in admissions at national maternity hospital i e Victoria Jubileein homicide
% ∆ . .,η =
% ∆ Or
( )( )
Difference in Hospitalization at national maternity Hospital i e Victoria Jubilee at time t and tHospitalization at national maternity hospital i e Victoria Jubilee at time t
Difference in
. ., +1×100
. .,η = homicide at time t and t hospital
Homicide at time t+1
×100
( )( )
Difference in Hospitalization at national maternity Hospital i e Victoria Jubilee at time t and tHospitalization at national psychiatric hospital i e Victoria Jubilee at time t
Difference i
. ., +1×100
. .,η = n deaths at time t and t
Deaths at time t+1
×100
Or
( )( )
Difference in Hospitalization at national maternity Hospital i e Victoria Jubilee at time t and tHospitalization at national psychiatric hospital i e Victoria Jubilee at time t
Difference i
. ., +1×100
. .,η = n deaths at time t and t
Deaths at time t+1
×100
Interpretations of elasticities results
Ƞ ˃ 1: elastic hospitalization or highly responsive hospitalization meaning that a one percentage change in the denominator will result in a more than 1 percentage change in the numerator;
Ƞ ˂ 1: inelastic hospitalization or lowly responsive hospitalization which denotes that a one percentage change in the denominator will result in a less than 1 percentage change in the numerator;
Interpreting signs of the elasticities
Negative sign means substitution effect or one product can operate outside of the other;
Positive sign means complementary effect or one product operates jointly with another
Substitution effect
Ƞ > - 1: This is a substitution effect that is highly responsive
Ƞ < - 1: This is a substitution effect this is lowly responsive
Complementary effect:
Ƞ > + 1: This is a complementary effect that is lowly responsive
Ƞ ˂ +1: this is a complementary effect that is highly responsive
Death rate
Psychiatric hospitalization rateDeath at time t
Death rateMid year population at time t
= ×1000−∑
∑Homicide at time t
Homicide rateMid year population at time t
= ×1,00,000−
∑∑
Homicide rateHomicide at time t
Homicide rateMid year population at time t
= ×1,00,000−
∑∑
Note: The rates are displayed in the Annex.Attendance at hospital for time period t
Mid year population at time t=
−∑Probability of Attendance
Admission at hospital for time period tAttendance at hospital for time period t
= ∑∑
Probability of Admission
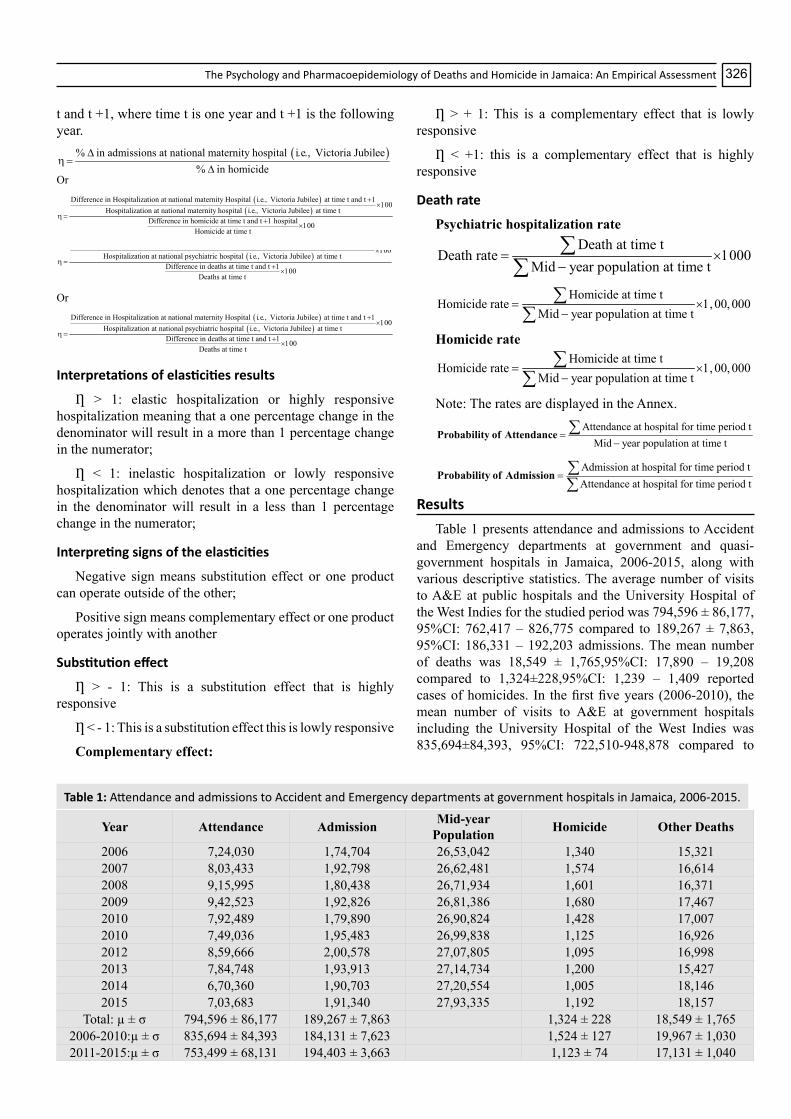
ResultsTable 1 presents attendance and admissions to Accident
and Emergency departments at government and quasi-government hospitals in Jamaica, 2006-2015, along with various descriptive statistics. The average number of visits to A&E at public hospitals and the University Hospital of the West Indies for the studied period was 794,596 ± 86,177, 95%CI: 762,417 – 826,775 compared to 189,267 ± 7,863, 95%CI: 186,331 – 192,203 admissions. The mean number of deaths was 18,549 ± 1,765,95%CI: 17,890 – 19,208 compared to 1,324±228,95%CI: 1,239 – 1,409 reported cases of homicides. In the first five years (2006-2010), the mean number of visits to A&E at government hospitals including the University Hospital of the West Indies was 835,694±84,393, 95%CI: 722,510-948,878 compared to
Year Attendance Admission Mid-year Population Homicide Other Deaths
2006 7,24,030 1,74,704 26,53,042 1,340 15,3212007 8,03,433 1,92,798 26,62,481 1,574 16,6142008 9,15,995 1,80,438 26,71,934 1,601 16,3712009 9,42,523 1,92,826 26,81,386 1,680 17,4672010 7,92,489 1,79,890 26,90,824 1,428 17,0072010 7,49,036 1,95,483 26,99,838 1,125 16,9262012 8,59,666 2,00,578 27,07,805 1,095 16,9982013 7,84,748 1,93,913 27,14,734 1,200 15,4272014 6,70,360 1,90,703 27,20,554 1,005 18,1462015 7,03,683 1,91,340 27,93,335 1,192 18,157
Total: µ ± σ 794,596 ± 86,177 189,267 ± 7,863 1,324 ± 228 18,549 ± 1,7652006-2010:µ ± σ 835,694 ± 84,393 184,131 ± 7,623 1,524 ± 127 19,967 ± 1,0302011-2015:µ ± σ 753,499 ± 68,131 194,403 ± 3,663 1,123 ± 74 17,131 ± 1,040
Table 1: Attendance and admissions to Accident and Emergency departments at government hospitals in Jamaica, 2006-2015.

Paul Andrew Bourne, Angela Hudson-Davis, Charlene Sharpe, Vincent Peterkin, Marsha Pabarue.327
753,499 ± 68,131, 95%CI: 662125 - 844,872 in the latter five years (2011-2015). The results signify that the number of people visiting the A&E departments at government hospitals and the University Hospital of the West Indies (i.e., UHWI) has fallen by 9.8%, which is the reverse for admissions to the same institutions. For the second 5-year period, the mean number of people admitted to A&E government hospitals including UHWI was 194,403 ± 3,663, 95%CI: 189,491-199,316, which represents a 5.6% increase over the first 5-year period (i.e., 184,131 ± 7,623, 95%CI: On the other hand, the mean number of homicide for the two periods (i.e., 2006-2010; 2011-2015) declined by 26.3%, which was the total reverse for other deaths, an increase of 3.5%.
Table 2 presents the probabilities of attendance and
admissions to government hospitals including the University Hospital of the West Indies (i.e., quasi-government hospital, UHWI). The Table illustrates that probabilities of visits to accident and emergency departments at government hospitals and UHWI lies between and include 0.2464 to 0.3515 (i.e. 0.2464 ≤ P(A) ≤ 0.3515), indicating that at most 35.2% of people in Jamaica visit accident and emergency departments at various government and quasi-government hospitals. A graphical display of the probabilities of attendance at government and quasi-government hospitals in Jamaica is depicted on Figure 1.
Table 3 presents a cross-elasticity of attendance at government and quasi-government hospitals in Jamaica from 2006-2015. It can be deduced from the calculations that attendance at government and quasi-government hospitals is equally responsive and irresponsive to deaths. The negative values suggest that there is a corresponding effect between
Year
Probabilities
Attendance[P(A)]
Admission[P(Z)]
2006 0.2729 0.24132007 0.3018 0.24002008 0.3428 0.19702009 0.3515 0.20462010 0.2945 0.22702010 0.2774 0.26102012 0.3175 0.23332013 0.2891 0.24712014 0.2464 0.28452015 0.2519 0.2719
Table 2: Probabilities of attendance and admission to government hospitals in Jamaica, 2006-2015.
Year Attendance(A)
Death(A)
% change
in A
% change
in D
Cross-elasticity
of A2006 7,24,030 15321 - - -2007 8,03,433 16614 10.967 8.439 1.2992008 9,15,995 16371 14.01 -1.463 -9.5792009 9,42,523 17467 2.896 6.695 0.4332010 7,92,489 17007 -15.918 -2.634 6.0442011 7,49,036 16926 -5.483 -0.476 11.5122012 8,59,666 16998 14.77 0.425 34.7212013 7,84,748 15427 -8.715 -9.242 0.9432014 6,70,360 18146 -14.576 17.625 -0.8272015 7,03,683 18157 4.971 -100.00 -0.05
Table 3: Cross-elasticity of attendance and death, 2006-2015.
P(A) denotes the probability of attendance to A&E at government and quasi-government hospitalsFigure 1: Frequency distribution of probabilities of attendance at accident and emergency departments at government and quasi-government hospitals, 2006-2015.

The Psychology and Pharmacoepidemiology of Deaths and Homicide in Jamaica: An Empirical Assessment 328
attendance at government and quasi-government hospitals and deaths, which is mostly irresponsive (i.e., 2014, 2015) and responsive (i.e., 2008) to deaths.
Admissions at government and quasi-government hospitals in Jamaica are mostly responsive to death (i.e., 2007-2012) – Table 4, with minor complementary effects (i.e, operating at the same time) between admissions at government and quasi-government hospitals and other deaths.
Attendance at government and quasi-government hospitals in Jamaica is rarely jointly related with homicide; but most of the data are supporting responsivity of attendance at government and quasi-government hospitals with homicide (Table 5).
Admissions at government and quasi-government hospitals in Jamaica are mostly irresponsive to homicide, with there being equal number of cases of joint effect (i.e., complementary effect) as substitution effect. The joint effects suggest that admissions at government and quasi-government hospitals are operating in tandem with homicide (Table 6). From the data the likelihood is low that homicide is causing a more than 1% change in admissions at government and quasi-government hospitals.
The majority of the instances computed in this study support joint effect (i.e., complementary effect) between psychiatric admissions at government and quasi-government hospitals in reference to homicide. Although psychiatric admissions at government and quasi-government hospitals are mostly irresponsive to changes in homicide, statistical evidence emerge indicating substitution effect and inverse effect between both phenomena (Table 7).
Table 8 presents a summative description of admissions at government maternity hospital in Jamaica and homicide
Year Attendance(A)
Homicide(H) % change in A % change in D Cross-elasticity
2006 724,030 1,340 - - -2007 803,433 1,574 10.9668 17.4627 0.6282008 915,995 1,601 14.0101 1.7154 8.1672009 942,523 1,680 2.8961 4.9344 0.5872010 792,489 1,428 -15.9183 -15.0000 1.0612011 749,036 1,125 -5.4831 -21.2185 0.2582012 859,666 1,095 14.7697 -2.6667 -5.5392013 784,748 1,200 -8.7148 9.5890 -0.9092014 670,360 1,005 -14.5764 -16.2500 0.8972015 703,683 1,192 4.9709 18.6070 0.267
Table 5: Cross-elasticity of attendance to government hospitals and homicide in Jamaica, 2006-2015.
Year Admission(M)
Homicide(H) % change in M % change in D Cross-elasticity
2006 174,704 1,340 - - -2007 192,798 1,574 10.3569 17.4627 0.5932008 180,438 1,601 -6.4109 1.7154 -3.7372009 192,826 1,680 6.8655 4.9344 1.3912010 179,890 1,428 -6.7086 -15.0000 0.4472011 195,483 1,125 8.6681 -21.2185 -0.4092012 200,578 1,095 2.6064 -2.6667 -0.9772013 193,913 1,200 -3.3229 9.5890 -0.3472014 190,703 1,005 -1.6554 -16.2500 0.1022015 191,340 1,192 0.3340 18.6070 0.018
Table 6: Cross-elasticity of admission to government hospitals and homicide in Jamaica, 2006-2015.
Year Admission(M)
Death(D)
% change in M
% change in D
Cross-elasticity of M
2006 174.704 15,321 - - -2007 192.798 16,614 10.3569 8.4394 1.22722008 180.438 16,371 -6.4109 -1.4626 4.38312009 192.826 17,467 6.8655 6.6948 1.02552010 179.890 17,007 -6.7086 -2.6335 3.54742011 195.483 16,926 8.6681 -0.4763 -18.19972012 200.578 16,998 2.6064 0.4254 6.12712013 193.913 15,427 -3.3229 -9.2423 0.35952014 190.703 18,146 -1.6554 17.6249 -0.09392015 191.340 18,157 0.3340 -100.000 -0.0033
Table 4: Cross-elasticity of admissions to government hospitals and death in Jamaica, 2006-2015.

Paul Andrew Bourne, Angela Hudson-Davis, Charlene Sharpe, Vincent Peterkin, Marsha Pabarue.329
from 2006-2015. Hospitalization at government maternity facility in Jamaica is primarily irresponsive to death, with infrequent cases of joint effect between both variables.
Hospitalization at the government maternity institution in Jamaica is substantially highly responsive to death, with infrequent incidences occurring when there is a joint irresponsive effect between admissions at the government maternity department and death (Table 9).
Hospitalization at a psychiatric government institution in Jamaica is highly responsive to death (Table 10), suggesting that death accounts for more than percentage change in admissions at the government psychiatric facility.
( )t t t: logA D ,H≠0H f [1]
Where Ho is the null hypothesis of log attendance rate at government and quasi-government hospitals in Jamaica is
Year Maternity(Z)
Homicide(H) % change in Z % change in H Cross-elasticity
2006 14,101 1340 - - -2007 15,841 1574 12.3396 17.4627 0.7072008 14,928 1601 -5.7635 1.7154 -3.3602009 16,635 1680 11.4349 4.9344 2.3172010 15,885 1428 -4.5086 -15.0000 0.3012011 15,888 1125 0.0189 -21.2185 -0.0012012 16,452 1095 3.5498 -2.6667 -1.3312013 16,895 1200 2.6927 9.5890 0.2812014 15,229 1005 -9.8609 -16.2500 0.6072015 16,688 1192 9.5804 18.6070 0.515
Table 8: Cross-elasticity of admission to national government maternity hospital and homicide in Jamaica, 2006-2015.
Year Maternity(Z)
Death(D) % change in Z % change D Cross-elasticity
2006 14,101 15321 - - -2007 15,841 16614 12.3396 8.4394 1.4622008 14,928 16371 -5.7635 -1.4626 3.9412009 16,635 17467 11.4349 6.6948 1.7082010 15,885 17007 -4.5086 -2.6335 1.7122011 15,888 16926 0.0189 -0.4763 -0.0402012 16,452 16998 3.5498 0.4254 8.3452013 16,895 15427 2.6927 -9.2423 -0.2912014 15,229 18146 -9.8609 17.6249 -0.5592015 16,688 18157 9.5804 0.0606 158.042
Table 9: Cross-elasticity of admission to national government maternity hospital and death in Jamaica, 2006-2015.
Year Psychiatric(P)
Homicide (H) % change in P % change in H Cross-elasticity
2006 1,110 1340 - - -2007 965 1574 -13.0631 17.4627 -0.7482008 972 1601 0.7254 1.7154 0.4232009 1,087 1680 11.8313 4.9344 2.3982010 1,045 1428 -3.8638 -15.0000 0.2582011 957 1125 -8.4211 -21.2185 0.3972012 995 1095 3.9707 -2.6667 -1.4892013 991 1200 -0.4020 9.5890 -0.0422014 1,005 1005 1.4127 -16.2500 -0.0872015 994 1192 -1.0945 18.6070 -0.059
Table 7: Cross-elasticity of admission to national government psychiatric hospital and homicide in Jamaica, 2006-2015.
The Psychology and Pharmacoepidemiology of Deaths and Homicide in Jamaica: An Empirical Assessment 330
not a function of the death rate per 1,000 (Dt) in time period t and the homicide rate per 100,000 (Ht) in time period t.
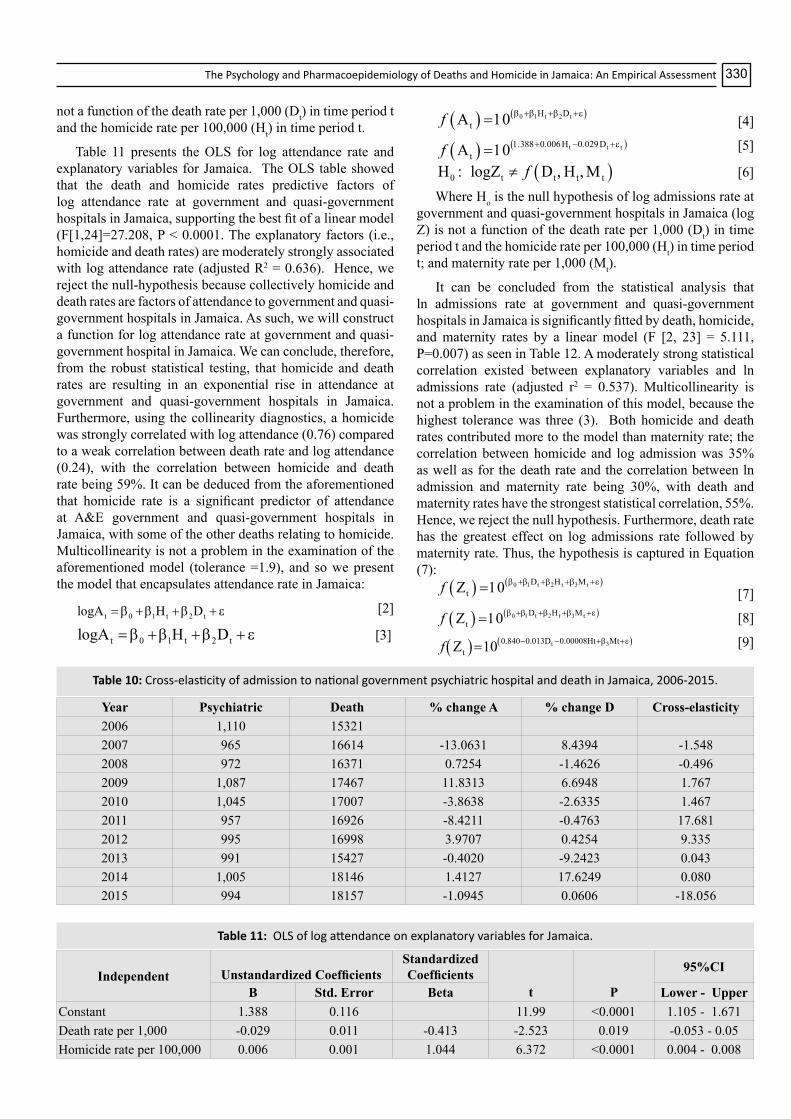
Table 11 presents the OLS for log attendance rate and explanatory variables for Jamaica. The OLS table showed that the death and homicide rates predictive factors of log attendance rate at government and quasi-government hospitals in Jamaica, supporting the best fit of a linear model (F[1,24]=27.208, P < 0.0001. The explanatory factors (i.e., homicide and death rates) are moderately strongly associated with log attendance rate (adjusted R2 = 0.636). Hence, we reject the null-hypothesis because collectively homicide and death rates are factors of attendance to government and quasi-government hospitals in Jamaica. As such, we will construct a function for log attendance rate at government and quasi-government hospital in Jamaica. We can conclude, therefore, from the robust statistical testing, that homicide and death rates are resulting in an exponential rise in attendance at government and quasi-government hospitals in Jamaica. Furthermore, using the collinearity diagnostics, a homicide was strongly correlated with log attendance (0.76) compared to a weak correlation between death rate and log attendance (0.24), with the correlation between homicide and death rate being 59%. It can be deduced from the aforementioned that homicide rate is a significant predictor of attendance at A&E government and quasi-government hospitals in Jamaica, with some of the other deaths relating to homicide. Multicollinearity is not a problem in the examination of the aforementioned model (tolerance =1.9), and so we present the model that encapsulates attendance rate in Jamaica:
t 0 1 t 2 tlogA H D= β + β + β + ε [2]
t 0 1 t 2 tlogA H D= β + β + β + ε [3]
( ) ( )0 1 t 2 tH DtAf β +β +β +ε=10 [4]
( ) ( )t t tH DtAf 1.388+0.006 −0.029 +ε=10
[5]
( )0 t t t tH logZ D Hf: ≠ , ,Μ [6]
Where Ho is the null hypothesis of log admissions rate at government and quasi-government hospitals in Jamaica (log Z) is not a function of the death rate per 1,000 (Dt) in time period t and the homicide rate per 100,000 (Ht) in time period t; and maternity rate per 1,000 (Mt).
It can be concluded from the statistical analysis that ln admissions rate at government and quasi-government hospitals in Jamaica is significantly fitted by death, homicide, and maternity rates by a linear model (F [2, 23] = 5.111, P=0.007) as seen in Table 12. A moderately strong statistical correlation existed between explanatory variables and ln admissions rate (adjusted r2 = 0.537). Multicollinearity is not a problem in the examination of this model, because the highest tolerance was three (3). Both homicide and death rates contributed more to the model than maternity rate; the correlation between homicide and log admission was 35% as well as for the death rate and the correlation between ln admission and maternity rate being 30%, with death and maternity rates have the strongest statistical correlation, 55%. Hence, we reject the null hypothesis. Furthermore, death rate has the greatest effect on log admissions rate followed by maternity rate. Thus, the hypothesis is captured in Equation (7):
( ) ( )0 t t tDtZf 1 2 3β +β +β Η +β Μ +ε=10 [7]
( ) ( )0 t t tDtZf 1 2 3β +β +β Η +β Μ +ε=10 [8]
( ) ( )t 30.840 0.013D 0.00008Ht MttZ 10f − − +β +ε=
[9]
Year Psychiatric Death % change A % change D Cross-elasticity2006 1,110 153212007 965 16614 -13.0631 8.4394 -1.5482008 972 16371 0.7254 -1.4626 -0.4962009 1,087 17467 11.8313 6.6948 1.7672010 1,045 17007 -3.8638 -2.6335 1.4672011 957 16926 -8.4211 -0.4763 17.6812012 995 16998 3.9707 0.4254 9.3352013 991 15427 -0.4020 -9.2423 0.0432014 1,005 18146 1.4127 17.6249 0.0802015 994 18157 -1.0945 0.0606 -18.056
Table 10: Cross-elasticity of admission to national government psychiatric hospital and death in Jamaica, 2006-2015.
Independent Unstandardized CoefficientsStandardized Coefficients
t P
95%CI
B Std. Error Beta Lower - UpperConstant 1.388 0.116 11.99 <0.0001 1.105 - 1.671Death rate per 1,000 -0.029 0.011 -0.413 -2.523 0.019 -0.053 - 0.05Homicide rate per 100,000 0.006 0.001 1.044 6.372 <0.0001 0.004 - 0.008
Table 11: OLS of log attendance on explanatory variables for Jamaica.

Paul Andrew Bourne, Angela Hudson-Davis, Charlene Sharpe, Vincent Peterkin, Marsha Pabarue.331
1 t 2 t tP D H Mt 0=β +β + β + + ε [10]
Where Ho is the null hypothesis of psychiatric hospitalization rate at a government hospital in Jamaica (Pt) is not a function of the death rate per 1,000 (Dt) in time period t; homicide rate per 100,000 (Ht) in time period t; and maternity rate per 1,000 (Mt)
We can conclude that 1 t 2 t tP D H Mt 0=β +β + β + + ε [11]
( )t t t tP 19.947 1.539D 0.094H 7.042Mf = − + + + + ε [12]
The three explanatory factors on psychiatric rate are best fitted by a linear model (F [2,23] =4.037, P=0.019) as seen in Table 12. The three explanatory factors are strongly associated with psychiatric admissions at the national psychiatric facility in Jamaica (adjusted r2 = 0.945). Of the explanatory factors, maternity had the strongest influence on psychiatric rates admission followed by the death rate and then homicide rate.
Multivariate analysis
( )t t t t tH A H , P , D , Mfο : ≠ [13.1]
( )t t t t tH A H , P , D , Mfο : ≠ [13.2]
where Ho is the null hypothesis of attendance rate at A&E in government and quasi-government hospitals in Jamaica (At) is not affected by death rate per 1,000 (Dt) in time period t; homicide rate per 100,000 (Ht) in time period t; maternity rate per 1,000 (Mt), and psychiatric hospitalization rate per 1,000 in time period t in Jamaica for a 10-year period.
( )t t t t tH Z H , P , D , Mfο : ≠ [13.3]
where Ho is the null hypothesis of attendance rate at A&E in government and quasi-government hospitals in Jamaica (At) is not a function of the death rate per 1,000 (Dt) in time period t; homicide rate per 100,000 (Ht) in time period t; maternity rate per 1,000 (Mt), and psychiatric hospitalization rate per 1,000 in time period t in Jamaica for a 10-year period.
Multivariate analysis was used to examine the interactivity among the explanatory variables (i.e., homicide, psychiatric, death and maturity rates) and their effect on the dependent variables (attendance, At, and admission rate, Zt).
Using multivariate regression (Annex Table 12), collectively, there is a significant statistical correlation with the explanatory variables (i.e., homicide, death, maternity and psychiatric rates) and attendance at A&E as well as admissions at government and quasi-government hospitals in Jamaica, with the correlated being a relatively strong one (adjusted r2 = 0.666). However, individually, Table 13 shows that admission to the national psychiatric hospital rate was not correlated with attendance rate at A&E departments (P = 0.338); death rate was not correlated with attendance rate at A&E departments (P = 0.326) as well as maternity rate was not correlated with attendance rate at A&E departments (P = 0.158). Individually, however, homicide rate has a significant correlation with attendance rate at A&E (P < 0.0001). Therefore, the general model is a linear one that expressed predictors of attendance rate at A&E in Jamaica, expressed in Equation [15]:
( )t 0 1 t 2 t 3 t 4 tA H P D Mf =β + β + β + β + β + ε [15.1]
where ƒ(At) is the function of attendance at A&E rate at government and quasi-government hospitals in Jamaica, β0 is the constant and β1-4 are coefficients for each variable, these are expressed in Equation 15.2:
( )t 0 1 t 2 t 3 t 4 tZ H P D Mf =β + β + β + β + β + ε [15.2]
Based on the multivariate regression analysis table (Annex Table 12), collectively, there is a significant statistical correlation with the explanatory variables (i.e., homicide, death, maternity and psychiatric rates) and attendance at A&E as well as admissions at government and quasi-government hospitals in Jamaica, with the correlated being a relatively strong one (adjusted r2 = 0.624). However, individually, Table 13 shows that admission to the national psychiatric hospital rate was not correlated with admissions rate at government and quasi-government hospitals in Jamaica (P = 0.971) as well as homicide and admissions rate at government and quasi-government hospitals in Jamaica (P = 0.522). Death rate was correlated with admissions rate at government and quasi-government hospitals in Jamaica (P = 0.045) as well as maternity rate was not correlated with attendance rate at A&E departments (P = 0.003). It is deduced from the statistical analyses that homicide contributes the most to attendance at A&E, while maternity the most to admissions and death
Dependent Variable Parameter B Std. Error t P
95%CI Partial EtasquaredLower - Upper
In Admission rate
Intercept 0.840 0.088 9.573 <0.0001 0.657 - 1.024 0.821Maternity rate per 1,000 0.017 0.012 1.389 0.180 -0.008 - 0.0242 0.088Homicide rate per100,000 -7.665E-5 0.000 -0.217 0.831 -0.001 - 0.001 0.002Death rate per 1,000 -0.013 0.005 -2.536 0.020 -0.024 - -0.002 0.243
PsychiatricRate per 100,000
Intercept -19.947 3.514 -5.676 .000 -27.362 - -12.533 0.000Maternity rate per 1,000 7.042 0.483 14.579 .000 6.023 - 8.062 0.395Homicide rate per 100,000 0.094 0.013 6.987 .000 .066 - .123 0.041Death rate per 1,000 1.539 0.184 8.384 .000 1.152 - 1.926 0.313
Table 12: Parameter Estimates of selected explanatory variables on particular dependent variables.

The Psychology and Pharmacoepidemiology of Deaths and Homicide in Jamaica: An Empirical Assessment 332
having the second most impact on admissions. Therefore, the general model is a linear one that expressed predictors of admissions rate at government and quasi-government hospitals in Jamaica, which is captured in Equation [16]:
( )t 0 1 t 2 t 3 t 4 tZ H P D M=β + β + β + β + β + ε [16.1]
where ƒ(Zt) is the function of admissions rate at government and quasi-government hospitals in Jamaica, β0 is the constant and β1-4 are coefficients for each variable, these are expressed in Equation 16.2:
( )t t t t tZ 5.622 0.004H P D Mf = − − 0.001 − 0.168 + 0.461 + ε [16.2]
The correlations of the explanatory factors (i.e. death, homicide, psychiatric and maternity rates) and dependent variables (i.e. attendance at A&E rate and admissions rate) are presented in Table 14. From Table 14, moderate-to-strong statistical correlation existed between death rate and homicide rate (r=0.636, P< 0.0001), homicide rate and attendance at A&E rate (r=0.765, P < 0.0001), psychiatric rate and homicide rate (r=0.513, P=0.003), maternity rate and admission rate (r=0.694, P<0.0001), and admission rate
and death rate (r=0.714, P<0.0001).
DiscussionMortality (or death) including homicide (or murder) is
well studied in demography, public health, and criminology [2,10,30-33,46-50]. Although the afore mentioned phenomenon has been studied for decades, the effect of homicide or other deaths on health care utilization has never been empirically examined in the English-Speaking Caribbean. The present research offers an empirical base for understanding the role of homicide and other deaths on the psychology and pharmacoepidemiology of people, particularly Jamaicans, and by doing so it provides critical information to public health planners, demographers and other health specialists on a new theoretical perspective that could be used to guide their thoughts and actions from here onwards.
Health care utilization in government and quasi-government hospitals has been fluctuating for the studied period (2006-2015). It can be deduced from the probabilities
Dependent Variable Parameter
BStd. Error t P
95% CI Partial EtasquareLower - Upper
Attendance at A&E Rate
Intercept 11.093 15.892 0.698 0.492 -21.9 - 44.1 0.022Homicide rate per 100,000 0.394 0.070 5.637 <0.0001 0.2 - 0.5 0.591Psychiatric rate per 100,000 -0.228 0.233 -0.979 0.338 -0.7 - 0.3 0.042
Death rate per 1,000 -0.948 0.944 -1.004 0.326 -2.9 - 1.0 0.044Maternity Rate 2.448 1.676 1.461 0.158 -1.0 -5.9 0.088
Admission Rate
Intercept 5.622 1.331 4.223 <0.0001 2.9 - 8.4 0.448Homicide rate per 100,000 -0.004 0.006 -0.651 0.522 -0.02- 0.01 0.019Psychiatric rate per 100,000 -0.001 0.020 -0.037 0.971 -0.04 - 0.04 0.000
Death rate per 1,000 -0.168 0.079 -2.127 0.045 -0.33 - -0.004 0.171Maternity Rate 0.461 0.140 3.285 0.003 0.17 - 0.75 0.329
Table 13: Multivariate analysis of selected independent variables on log attendance to A&E and admission to government and quasi-government hospitals in Jamaica.
Deathrate per
1000
Homiciderate per1,00,000
Psychiatricrate per1,00,000
Attendancerate
Maternity rate per 1,000
Admission rate
Correlation
Death rate per 1,000 1 6.36E-01 0.478 0.267 -0.47 -0.714Homicide rate per 100,000 0.636 1 0.513 0.765 -0.05 -0.401Psychiatric rate per 100,000 0.478 0.513 1 0.205 -0.308 -0.412Attendance rate 0.267 0.765 0.205 1 0.287 0.183Maternity rate per 1,000 -0.47 -0.05 -0.308 0.287 1 0.694Admission rate -0.714 -0.401 -0.412 0.183 0.694 1
P value
Death rate per 1,000 <0.0001 0.006 0.089 0.007 <0.0001Homicide rate per 100,000 <0.0001 0.003 <0.0001 0.402 0.019Psychiatric rate per 100,000 0.006 0.003 0.153 0.059 0.016Attendance rate 0.089 <0.0001 0.153 0.073 0.18Maternity rate per 1,000 0.007 0.402 0.059 0.073 <0.0001Admission rate <0.0001 0.019 0.016 0.18 <0.0001
Table 14: Factor Correlation Matrix.
Paul Andrew Bourne, Angela Hudson-Davis, Charlene Sharpe, Vincent Peterkin, Marsha Pabarue.333
of attendance at government and quasi-government hospitals in Jamaica that at least 1 in every 4 Jamaican visits the accident and emergency department (i.e., A&E) on an annual basis and 1 out of every 5 is admitted at the institution following medical examination on attendance at A&E. Homicide has a strong positive significance association with attendance at A&E in Jamaica, which offers some insights into the psychological and psychiatric impact of murders on the human’s physiology. Although Gairin et al., empirically establish a correlation [51] between attendance to A&E and suicide, which speaks to the psychiatric state of people who visit A&E. This research found that homicide accounts for increased number of people visiting A&E, and that other deaths have a psychiatric effect on people. This research went further than that of Gairin et al., establishing that while homicide will cause people to visit A&E [51], it will not account for them being admitted, unlike psychiatric issues and other deaths.
Clearly, violence is closely associated with visits to A&E department and this speaks to its influence on the physiology of people, which correlates with the established literature [29,52,53]. Even though violence, especially homicide, in Jamaica influences visitations to government and quasi-government health care institutions, which is the case as outlined by the World Health Organization [53], it accounts for long-term hospitalization compared to other death. In fact, other deaths and pregnancy have been associated with long-term effect on the psychiatric state of people. So, while data on attendance and admissions at hospitals provide an outlook of the health status of the population, it envelopes critical information for crime prevention policy framework, which is already recognized in the literature [54-56]. This reality broadens the discourse of health data from health to criminology, to sociology, to the psychology of human behaviour. This paper has empirically established that there is psychiatric effect of death on living humans that is profound, which is reflected in admissions to hospital after an A&E assessment to include psychiatric hospitalization.
Unlike other studies on violence and health [29,53], this one goes further by uncategorical forwarding here that the physiology of death as well as psychology of death on human behaviour are different based on the nature of the death. The findings that emerged from this work support a conclusion that homicide has shorter term impact on human existence compared to other deaths. While deaths resulting from violence will commence a physiology visitation to an A&E department, it is other deaths that produce the psychiatric disorders by way of hospitalization to a mental health facility. Wright, et al. presented the intercorrelation between violence and attendance [57] to A&E in Scotland, which is evident in Jamaica and this provides some context of the social psychology of violence and relations with human’s physiology.
While Wright, et al. did not examine the psychology and psychiatry of violence, this paper has empirically established such an association [57]. It means, therefore, while violence
accounts for more than a one to one relationship with hospitalization, other deaths within the society have far reaching effect on the psychology and psychiatric state of living being. The findings from this study support a deduction that not all deaths affect living humans the same way and that all deaths should not be classified collectively in examining criminology, psychology, and the treatment of people who enter A&E for health care. The rationale for this conclusion is a clear case that deaths have a certain effect on the mind, which is already contextualized by Feifel [58] and Stillion, et al. [59].
Like Feifel opined [58], death can serve life as is clearly presented in this paper and as was demonstrated by the American Psychology Association [60] as it relates to coping strategies in addressing death, dying, and bereavement [61]. Although the psychology of death has been extensively studied [61-64], it is extremely difficult for humans to effectively accept death with its reality despite even ideas such as ‘staring at the sun: overcoming the terror of death by Yalom [64]. There is a negative psychology to death that cannot be denied and while we seek to mitigate its long-lasting effect on the mind of people, understanding it as presented herein is the first stage of Wong’s prescription on the therapeutic aspect in dealing with death [65]. Our findings support a disaggregation in screening patients who visit health care institutions based on exposure to homicide or other deaths as their impacts are different and must be addressed as such. We are prescribing that while the psychology of death is evident in this work the matter extends to the pharmacoepidemiology of deaths and bereavement.
ConclusionThe statistical evidence of this current work supports a
rationale for the introduction of homicide and other deaths in the study of medicine, especially public and mental health. The deduction of the psychology and psychiatry of homicide and other deaths is valid and that homicide must be brought into medicine particularly from the vantage point of pharmacology, with equal emphasis on epidemiology to merge into pharmacoepidemiology.
REFERENCES
1. Caldwell JC. Demographers and the study of mortality: Scope, perspectives, and theory. Ann N Y Acad Sci 2001; 954: 19-34.
2. Gompertz B. On the Nature of the Function Expressive of the Law of Human Mortality; and on a New Mode of Determining the Value of Life Contingencies, Philosophical Transactions of the Royal Society 1825; 115: 513-585.
3. Keyfitz N. Choice of Function for Mortality Analysis: Effective Forecasting Depends on a Minimum Partameter Representation, in Vallin J, JH, Pollard, Heligman L. Methodologies for the Collection and Analysis of Mortality Data. IUSSP, Ordina Editions. Liege, Belgium. 1984; 225-241.
4. McGehee MA, Hall SD, Murdock SH. Rural and Urban Death Rates by Race/Ethnicity and Gender, Texas: 1990 and 2000. J Multicult Nurs Health 2004; 10: 13-20.

The Psychology and Pharmacoepidemiology of Deaths and Homicide in Jamaica: An Empirical Assessment 334
5. Newell C. Methods and model in demography. New Jersey: John Wiley and Sons.1988.
6. Preston SH. Use of direct and indirect techniques for estimating the completeness of death registration system. In data bases for mortality measurement Papers of the meeting of the United Nations/World Health Organization working group on data bases for measurement of levels. Trends and differentials in mortality. Bangkok 20-23, October 1981. New York: United Nations. 1984.
7. Preston S, Heuveline P, Guillot M. Demography: Measuring and modeling population process. New Jersey: Wiley-Blackwell. 2000.
8. Stockwell EG, Swanson DA, Wilks JW. The age-cause proxy relationship in infant mortality. Social Biology, 1987; 34: 249-253.
9. Bellani G, Laffey JG, Pham T, Fan E, Brochard L, et al. Epidemiology, Patterns of Care, and Mortality for Patients with Acute Respiratory Distress Syndrome in Intensive Care Units in 50 Countries. JAMA 2016; 315: 788-800.
10. Gabriel SE, Michaud K. Epidemiological studies in incidence, prevalence, mortality, and comorbidity of the rheumatic diseases. Arthritis Res Ther 2009; 11: 229.
11. Scott S, Duncan SR, Duncan CJ. Infant Mortality and Famine: A Study in Historical Epidemiology in Northern England. J Epidemiol Community Health 1979; 49: 245-252.
12. United Nations. Principles for a vital statistics system. Statistical Papers, Series M, 1953; 19.
13. World Health Organization (WHO). Official records of the World Health Organization, No. 28. Third World Health Assembly, 1950.
14. Wingard DL. The sex differential in mortality rates: Demographic and behavioral factors. Am J Epidemiol 1982; 115: 205-216.
15. United Nations. Age and Sex Patterns of Mortality: Model Life Tables for Under-Developed Countries.1955.
16. United Nations. Manual III: Methods for Population Projections by Sex and Age. United Nations Publications. 1956.
17. United Nations. Methods for Estimating Basic Demographic Measures from Incomplete Data: Manuals and Methods of Estimating Populations. 1967.
18. Murray CJL, Ahmad OB, Lopez AD, Salomon JA. WHO System of Model Life Tables. 2016.
19. Coale AJ, Demeny P. Regional Model Life Tables and Stable Population, Princeton University Press, Princeton. 1996.
20. United Nations. World population prospects. New York.2012.
21. United Nations. United Nations demographic yearbook. New York 2013.
22. World Health Organization. Life expectancy at birth. 2015.
23. Mathers C, Fat D, Inoue M, Rao C, Lopez AD. Counting
the dead and what they died from: An assessment of the global status of cause of death data. Bull World Health Org 2005; 83: 172-173.
24. Binns AM, Fox K, Williams KE, Ashley DE, Irons B. Registration of births, stillbirths and infant deaths in Jamaica. Int J of Epidemiol 1996; 25: 807-813.
25. McCaw Binns A, Holder Y, Spence K, Strachan G, Nam V, et al. Multi-source method for determining mortality in Jamaica: 1996 and 1998. Consultant Report to the Pan American Health Organization. 2002.
26. McCaw Binns A, Mullings J, Holder Y. The Quality and Completeness of 2008 Perinatal and Under-five Mortality Data from Vital Registration, Jamaica. West Indian Med J 2015; 64: 3-16.
27. World Health Organization (WHO). World health statistics 2010. Geneva: WHO. 2010.
28. World Health Organization. World health statistics 2012. Geneva: WHO. 2012.
29. Bourne PA, Solan I. Health, violent crimes, murder and inflation: public health phenomena. J Behav Health 2012; 1: 59-65.
30. Bourne PA, Hudson-Davis A, Sharpe-Pryce C, Francis C, Solan I, et al. Homicide, rape and carnal abuse in Jamaica, 1970-2013: The New Health Pandemics. Int J Emerg Ment Health 2015a; 17: 588-597.
31. Bourne PA, Hudson-Davis A, Sharpe-Pryce C, Francis C, Solan I, et al. The Effects of Homicides and Economics on Human and Social Biology: A Mental Health Challenge for a Society? Int J Emerg Ment Health 2015b; 17: 495-501.
32. Bourne PA, Hudson-Davis A, Sharpe-Pryce C, Solan I, Nelson S, et al. Homicide, sexual homicide and rape: A comparative analysis of Jamaica and New York, 1970-2013. World Journal of Pharmacy and Pharmaceutical Sciences 2015c; 4: 231-260.
33. Bourne PA, Hudson-Davis A, Does Homicide Influence Psychiatric Hospitalization to a Mental Health Facility? A Mathematical Approach. J Ment Disord Treat 2016; 2: 109
34. Koppensteiner MF, Manacorda M. Violence and Birth Outcomes: Evidence from Homicides in Brazil. 2015.
35. Cohen J, Cohen P. Applied multiple regression/correlation analysis for the behavioral sciences, 2nd ed. New Jersey: Lawrence Elbraum Associates. 1983.
36. Hu TW. Econometrics: An introductory analysis, 2nd. ed. Baltimore: University Park Press.1982.
37. Hill RC, Griffiths WE, Judge GG. Undergraduates econometrics, 2nd. M.A: John Wiley and Sons. 2001.
38. Lewis-Beck M. Applied regreesion: An introduction. London: Sage.1980.
39. Maddala GS. Introduction to econometrics, 2nd ed. New York: Macmillan Publishing company. 1992.
40. Divaris K, Vann WF, Baker AD, Lee JY. Examining the accuracy of caregivers’ assessments of young children’s oral health status. J Am Dent Assoc 2012; 143: 1237-1247.

Paul Andrew Bourne, Angela Hudson-Davis, Charlene Sharpe, Vincent Peterkin, Marsha Pabarue.335
41. Hinkle DE, Wiersma W, Jurs SG. Applied Statistics for the Behavioral Sciences, 5th ed. Boston: Houghton Mifflin.2003.
42. Evans JD. Straightforward Statistics for the Behavioral Sciences. Brooks/Cole Publishing; Pacific Grove, Calif. 1996.
43. Howell DC. Fundamental statistics for the behavioural sciences. Belmont, CA: Wadsworth. 2007.
44. Howell DC. Statistical methods for psychology (7th ed.). Belmont, CA: Wadsworth. 2010.
45. Howitt D. Cramer D. Introduction to statistics in psychology (5th ed.). Harlow, UK: Pearson.2011.
46. Desai P, Hanna B, Melville B, Wint BA. Infant mortality rates in three parishes of western Jamaica, 1980. West Indian Med J 1983; 32: 83-87.
47. Harriott A. Introduction. In: Harriott A, Brathwaite F, Wortley S, eds. Crime and criminal justice in the Caribbean. Kingston: Arawak Publishers. 2004a; 1-7.
48. Harriott A. The Jamaican crime problem: Some policy consideration. In: Harriott A, Brathwaite F, Wortley S, eds. Crime and criminal justice in the Caribbean. Kingston: Arawak Publishers. 2004b; 238-264.
49. Harriott A. Fear of criminal victimization in reputedly violent environment. In: Harriott A, Brathwaite F, Wortley S, eds. Crime and criminal justice in the Caribbean. Kingston: Arawak Publishers. 2004c; 57-86.
50. March C, Bourne PA. The Influence of Macroeconomic Factors on Murders in Jamaica: Should the Police Be Cautious in Interpreting the Murder Statistics? Asian Journal of Business Management 2011;3 4: 257-277.
51. Gairin I, House A, Owens D. Attendance at the accident and emergency department in the year before suicide: retrospective study. The British Journal of Psychiatry, 2003; 183: 28-33.
52. Ford K, Quigg Z, Wood S, Grant C, Hughes K. A case study to demonstrate the use of health data in violence prevention within the voluntary and community sector: Local Solutions. Centre for Public Health, Liverpool John Mores University. 2015.
53. World Health Organization. World report on violence and health. Geneva: WHO. 2002.
54. Ford K, Wood S, Hughes K, Quigg Z. Accident and Emergency department data sharing to support violence prevention in Wigan. Liverpool: Centre for Public health, Liverpool John Moores University. 2014a.
55. Ford K, Wood S, Hughes K, Quigg Z. Accident and Emergency department data sharing to support violence prevention in Lambeth. Liverpool: Centre for Public health, Liverpool John Moores University. 2014b.
56. Ford K, Wood S, Hughes K, Quigg Z. Accident and Emergency department data sharing to support violence prevention in Wirral. Liverpool: Centre for Public health, Liverpool John Moores University. 2014c.
57. Wright J, Kariya A. Assault patients attending a Scottish accident and emergency department. J R Soc Med 1997; 90: 322-326.
58. Feifel H. Psychology and death. Meaningful rediscovery. Am Psychol 1990; 45: 537-543.
59. Stillion J, Attig T. Death, dying and bereavement: Contemporary perspectives, institutions and practice. New York: Springer Publishing Company.2015.
60. American Psychology Association. Death and dying. 2016.
61. McCoyd JL, Walter CA. Grief and loss across the lifespan: A biopsychological perspective, 2nd ed. New York: Springer Publishing Company. 2015.
62. Kubler-Ross E. On death and dying. New York, NY: Macmillan.1969.
63. Kubler-Ross E. On death and dying, 40th anniversary edition. Abingdon, UK: Routledge. 2009.
64. Yalom ID. Staring at the sun: Overcoming the terror of death. San Francisco, CA: Jossey-Bass. 2008.
65. Wong PT. Meaning Therapy: An integrative and positive existential psychotherapy. J Contemp Psychother 2010; 40: 85-93.
ADDRESS FOR CORRESPONDENCE: Paul Andrew Bourne, Adjunct Lecturer, Northern Caribbean University, Jamaica, West Indies, Tel: 1 876 5663088; Email: [email protected]
Submitted 08 August 08, 2016Accepted 07 December, 2016

The Psychology and Pharmacoepidemiology of Deaths and Homicide in Jamaica: An Empirical Assessment 336
Annex Descriptive statistics for attendance at A&E and admissions to government as well as quasi-government hopitals in Jamaica for the period 2006-2015 are presented in Annex Table 1. Using descriptive values for attendance at A&E, based on the value for the skewness (0.379) and the large variance (742, 642, 4045.4), there are clear statistical evidence that errors are present in the data, but that these are contained and should be noted. Furthermore, the kurtosis value for attendance at A&E (-0.915) indicates a flattening of the values away from the centre. Despite this fact, enough statistical proof is there that the distribution is a relatively normal one (Figure 1). This means that the datapoints are relatively close to the mean value represented by the straight line in the graph. Nevertheless, we must be mindful of errors within the datapoints which is captured by the large variance and standard error of the mean. Likewise the same situation exists for admissions at government and quasi-government hospitals in Jamaica, with a higher skewness value suggesting more errors in this variable compared to that of attendance, which is also evident from the test of normality, in which the values are more away from the mean value represented by the straight line (Figure 2). Annex Table 1: Descriptive statistics for attendance and admissions to government as well as quasi-government hospitals in Jamaica, 2006-2015. Statistic Std. Error Attendance
Mean 794596.3 15733.6 95% Confidence Interval for Mean
Lower Bound 762417.4 Upper Bound 826775.2
Median 788618.5 Variance 7.426424045.4 Std. Deviation 86176.7 Minimum 670360.0 Maximum 942523.0 Skewness 0.379 0.427 Kurtosis -0.915 0.833
Admission
Mean 189267.3 1435.5 95% Confidence Interval for Mean
Lower Bound 186331.3 Upper Bound 192203.3
Median 192069.0 Variance 61822437.7 Std. Deviation 7862.7
Minimum 174704.0 Maximum 200578.0 Skewness -0.619 0.427 Kurtosis -0.758 0.833

Paul Andrew Bourne, Angela Hudson-Davis, Charlene Sharpe, Vincent Peterkin, Marsha Pabarue.337
Annex Figure 1: Testing of normality to datapoints.
Annex Figure 2: Testing of normality of the distribution.
Annex Table 2 summarizes the descriptive statistics for homicide and other deaths in Jamaica for the periods 2006-2015. A relatively high standard error of the mean indicates errors with the datapoints, which is supported by the high variance. However, the skewness value was relatively close to zero for other deaths indicating the almost normal distribution of this variable (Annex Figure 3). The skewness for homicide, while being relatively close to zero, was greater than that for homicide, suggesting less normality of the distribution (Annex Figure 4). Furthermore, even though other deaths reflect a relative normal distribution, it had more errors therein compared to homicide, which is noted in the larger variance and standard error of the mean. Based on the skewness, the errors are noted; but they are tolerable for usage.

The Psychology and Pharmacoepidemiology of Deaths and Homicide in Jamaica: An Empirical Assessment 338
Statistic Std. Error Homicide Mean 1324.0 74.8
95% Confidence Interval for Mean
Lower Bound 1154.8
Upper Bound 1493.2 Median 1270.0 Variance 55960.0 Std. Deviation 236.6
Minimum 1005 Maximum 1680 Range 675 Skewness 0.248 Kurtosis -1.469 1.334
Deaths Mean 18548.8 578.3 95% Confidence Interval for Mean
Lower Bound 17240.5
Upper Bound 19857.1 Median 18506.0 Variance 3344805.5 Std. Deviation 1828.9
Minimum 15427 Maximum 21503 Skewness -0.041 0.687 Kurtosis -0.359 1.334
Annex Table 2: Descriptive statistics of homicide and other deaths in Jamaica, 2006-2015.
Testing the Normality Assumption
Annex Figure 3: Testing of normality of the distribution for admission.
Paul Andrew Bourne, Angela Hudson-Davis, Charlene Sharpe, Vincent Peterkin, Marsha Pabarue.339
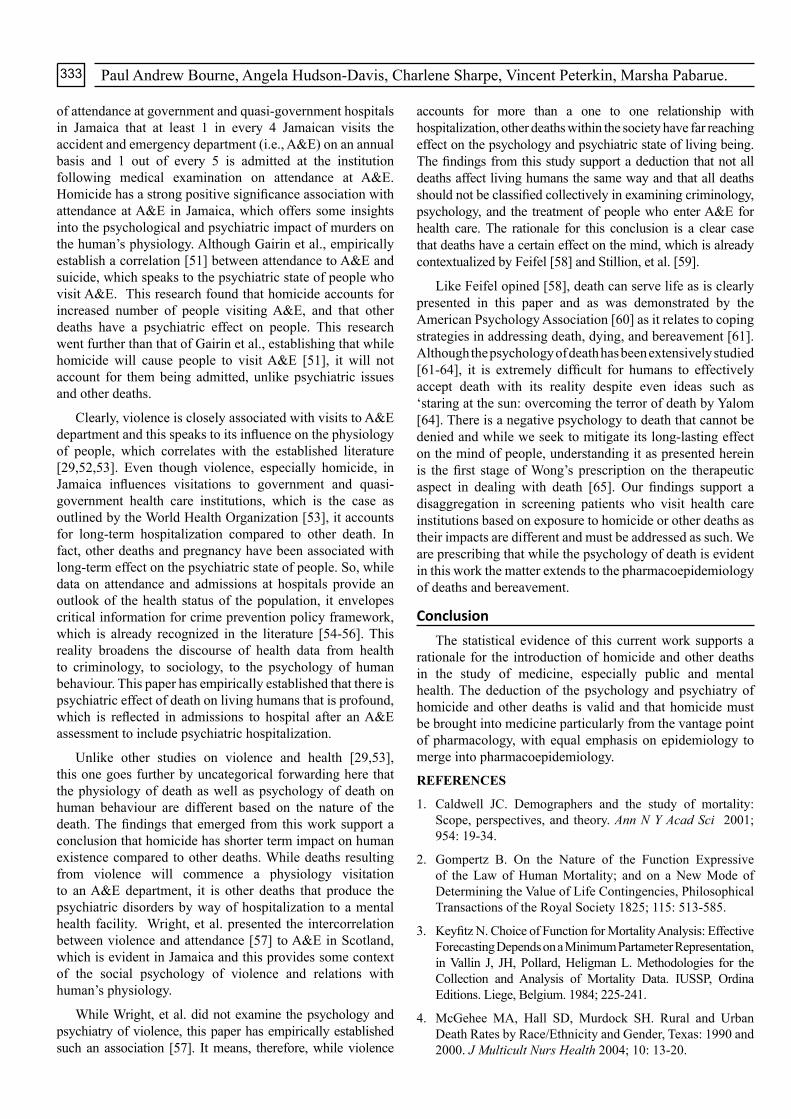
Annex Figure 4: Testing of normality of the distribution for admissions.
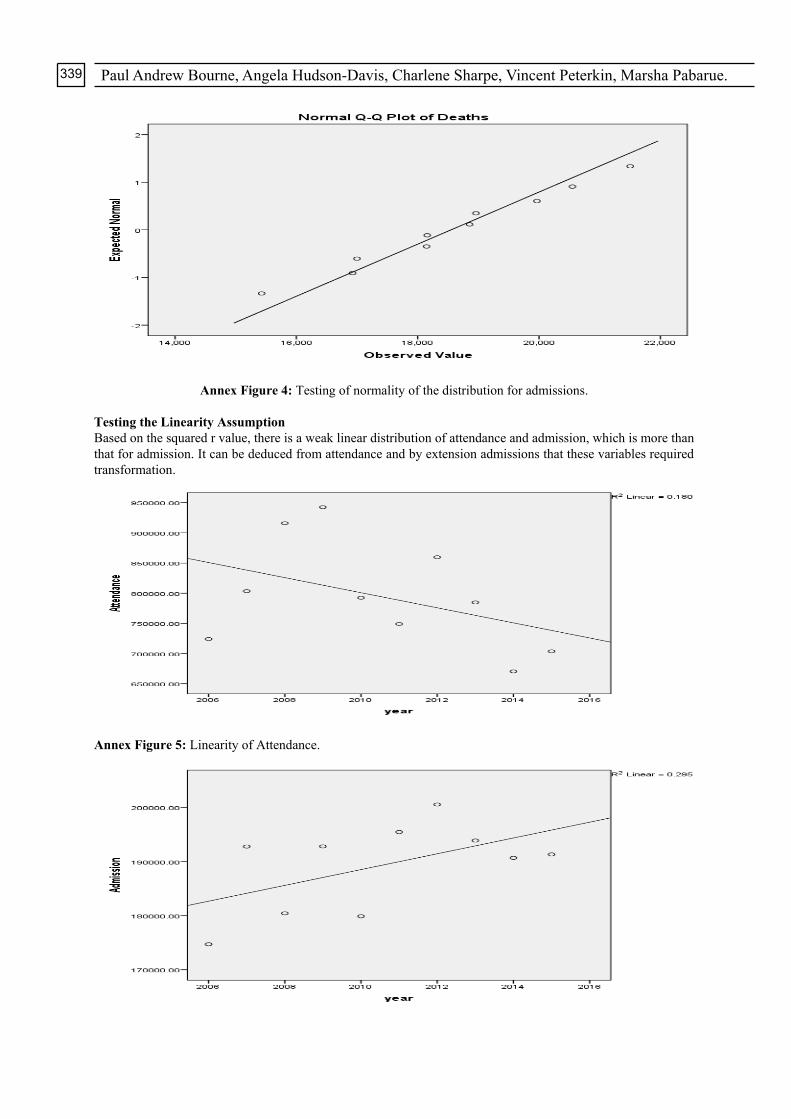
Testing the Linearity Assumption Based on the squared r value, there is a weak linear distribution of attendance and admission, which is more than that for admission. It can be deduced from attendance and by extension admissions that these variables required transformation.
Annex Figure 5: Linearity of Attendance.
The Psychology and Pharmacoepidemiology of Deaths and Homicide in Jamaica: An Empirical Assessment 340
Annex Figure 6: Linearity of Admission.
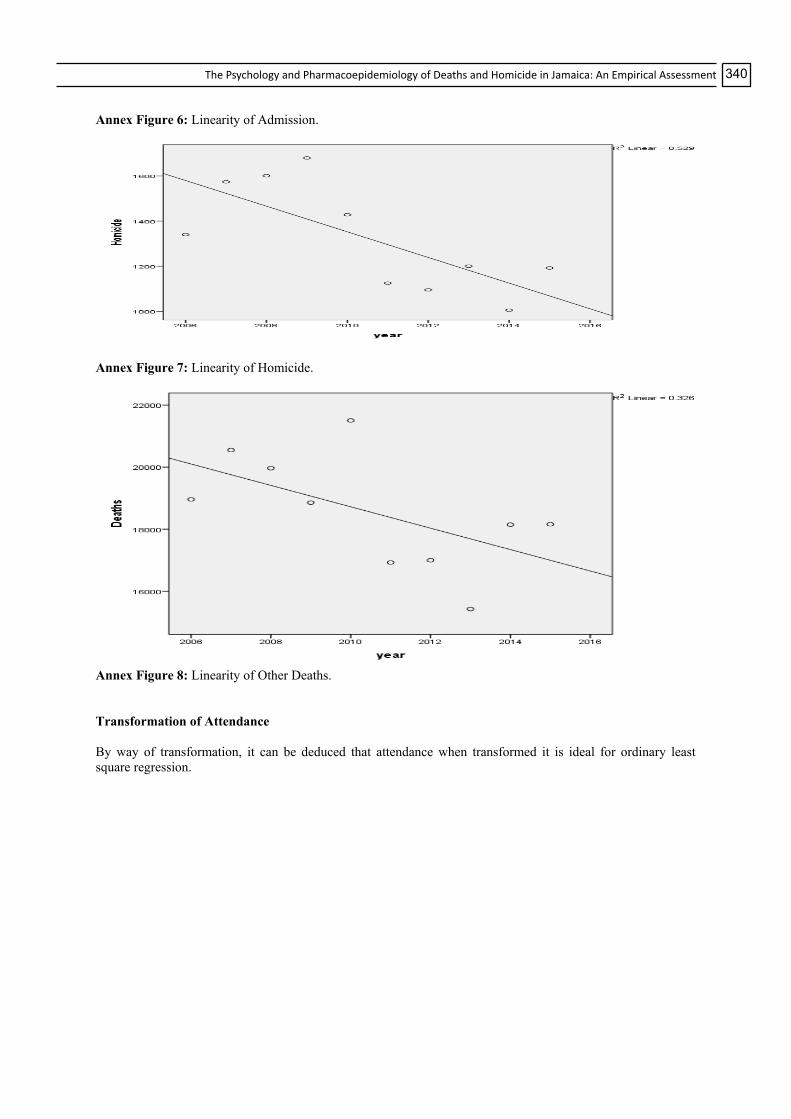
Annex Figure 7: Linearity of Homicide.
Annex Figure 8: Linearity of Other Deaths. Transformation of Attendance By way of transformation, it can be deduced that attendance when transformed it is ideal for ordinary least square regression.

Paul Andrew Bourne, Angela Hudson-Davis, Charlene Sharpe, Vincent Peterkin, Marsha Pabarue.341
Annex Figure 9: log Attendance rate and superimposed function.
Annex Figure 10: Log Admission rate and superimposed function.

The Psychology and Pharmacoepidemiology of Deaths and Homicide in Jamaica: An Empirical Assessment 342
Effect Value F Hypothesis df Error df P Intercept Pillai's Trace 0.630 17.905b 2.000 21.000 <0.000
1 Wilks' Lambda 0.370 17.905b 2.000 21.000 <0.0001 Hotelling's Trace 1.705 17.905b 2.000 21.000 <0.0001 Roy's Largest Root 1.705 17.905b 2.000 21.000 <0.0001 Homiciderateper100000 Pillai's Trace 0.827 50.041b 2.000 21.000 <0.0001 Wilks' Lambda 0.173 50.041b 2.000 21.000 <0.0001 Hotelling's Trace 4.766 50.041b 2.000 21.000 <0.0001 Roy's Largest Root 4.766 50.041b 2.000 21.000 <0.0001 Psychiatricrateper10000
0 Pillai's Trace 0.102 1.186b 2.000 21.000 0.325 Wilks' Lambda 0.898 1.186b 2.000 21.000 0.325 Hotelling's Trace 0.113 1.186b 2.000 21.000 0.325 Roy's Largest Root 0.113 1.186b 2.000 21.000 0.325
Death rate per 1000 Pillai's Trace 0.210 2.790b 2.000 21.000 0.084 Wilks' Lambda 0.790 2.790b 2.000 21.000 0.084 Hotelling's Trace 0.266 2.790b 2.000 21.000 0.084 Roy's Largest Root 0.266 2.790b 2.000 21.000 0.084
Maternity Rate Pillai's Trace 0.397 6.925b 2.000 21.000 0.005 Wilks' Lambda 0.603 6.925b 2.000 21.000 0.005 Hotelling's Trace 0.660 6.925b 2.000 21.000 0.005 Roy's Largest Root 0.660 6.925b 2.000 21.000 0.005
a. Design: Intercept + Homicide rate per 100,000 + Psychiatric rate per 100,000 + Death rate per 1,000 + Maternity rate b. Exact statistic Annex Table 11: Multivariate Testsa. Source Dependent Variable Type III
Sum of Squares
df Mean Square
F P
Corrected Model Attendance at A&E Rate 229.492a 4 57.373 13.958 <0.0001 Admission Rate 1.360b 4 0.340 11.792 <0.0001
Intercept Attendance at A&E Rate 2.003 1 2.003 0.487 0.492 Admission Rate 0.514 1 0.514 17.833 <0.0001
Homicide rate per 100,000
Attendance at A&E Rate 130.607 1 130.607 31.774 <0.0001 Admission Rate 0.012 1 0.012 0.423 0.522
Psychiatric rate per 100,000
Attendance at A&E Rate 3.938 1 3.938 0.958 0.338 Admission Rate 3.891E-5 1 3.891E-5 0.001 0.971
Death rate per 1,000 Attendance at A&E Rate 4.145 1 4.145 1.008 0.326 Admission Rate 0.130 1 0.130 4.523 0.045
Maternity Rate Attendance at A&E Rate 8.772 1 8.772 2.134 0.158 Admission Rate 0.311 1 0.311 10.793 0.003
Error Attendance at A&E Rate 90.431 22 4.110 Admission Rate 0.635 22 0.029
Total Attendance at A&E Rate 23529.145 27 Admission Rate 1314.616 27
Corrected Total Attendance at A&E Rate 319.922 26 Admission Rate 1.995 26
a. R Squared = 0.717 (Adjusted R Squared = 0.666) b. R Squared = 0.682 (Adjusted R Squared = 0.624) Annex Table 12: Tests of Between-Subjects Effects.