the middle east consumer confidence index- november 2012
DESCRIPTION
The Bayt.com Consumer Confidence survey measures the perceptions and attitudes of Middle Eastern consumers regarding their regional economy, their personal financial and job situation, their likelihood to purchase and invest and the employment and jobs market in general. Job seekers surveyed were spread across Dubai, Abu Dhabi, UAE, Kuwait, Oman, Qatar, Bahrain, Jordan, Lebanon, Egypt, Morocco and other Middle Eastern and North African countries. Read the analysis here: http://www.bayt.com/en/press-release-article-14982/TRANSCRIPT

November 2012
Bayt.com Middle EastConsumer Confidence Index

To understand perceptions and attitudes of Middle Eastern consumers regarding the economy of their countries, their personal financial and job situation, their likelihood to purchase and invest and the employment market in general.
Four indices will be extrapolated from these findings on a regular quarterly basis for which the findings of this analysis serve as the twenty fourth period (October 2012) after the base period in April 2007
These are the:
Consumer Confidence Index (CCI)
Consumer Expectation Index (CEI)
Propensity to Consume/Spend Index (PCI)
Employee Confidence Index (ECI)
Objective

Consumer confidence is a measure of the economic well-being of a country
It is a reflection of consumer satisfaction levels and expectations based on various factors in the economy - inflation, stock market performance, job opportunities/salary structures, unemployment, investment avenues/returns, business growth, state economic policies, infrastructure, cost of living, interest rates, exchange rates etc.
Such consumer satisfaction levels and expectations will have an effect on economic variables
For example, if consumers are positive about the economy and have disposable income levels that are perceived as sufficient, they will tend to spend more on consumer goods
This in turn will drive business dependent on consumer spending, thereby creating further economic growth
On the other hand, a pessimistic view of the economy would cause consumers to rein in their spending, creating a spending recession which could effectively cause business losses/ economic downturn
Similarly, if employable adults are optimistic about job prospects and opportunities, job security, have healthy salary expectations and are hopeful about their career growth and development, it will be reflected in their attitudes towards work and the economy as a whole as well as their spending behaviours
Therefore following trends in consumer and employee expectations could help forecast economic variables
This information is useful for professionals, manufacturers/business people, recruitment consultants/agencies, economists and the general public
Project Background
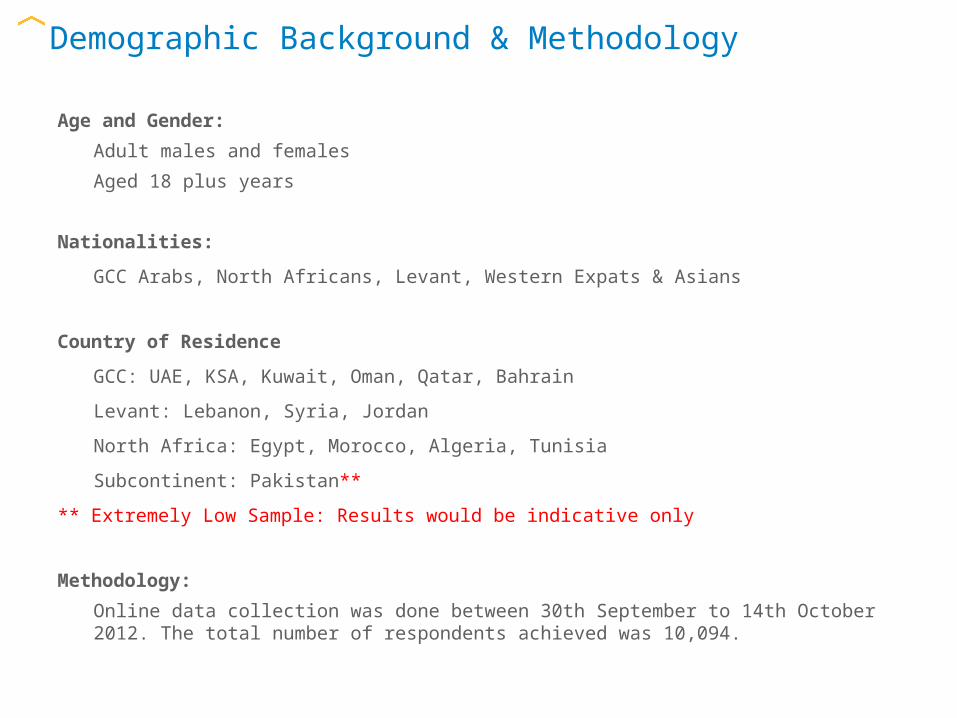
Age and Gender:
Adult males and females
Aged 18 plus years
Nationalities:
GCC Arabs, North Africans, Levant, Western Expats & Asians
Country of Residence
GCC: UAE, KSA, Kuwait, Oman, Qatar, Bahrain
Levant: Lebanon, Syria, Jordan
North Africa: Egypt, Morocco, Algeria, Tunisia
Subcontinent: Pakistan**
** Extremely Low Sample: Results would be indicative only
Methodology:
Online data collection was done between 30th September to 14th October 2012. The total number of respondents achieved was 10,094.
Demographic Background & Methodology

The indices which concentrate on measuring consumer confidence are the: Consumer Confidence Index (CCI) Consumer Expectation Index (CEI) Propensity to Consume/Spend Index (PCI)
The index which aims to measure the confidence that employed and working people have with the job market and their own career prospects is:
Employee Confidence Index (ECI)
The Consumer Confidence Index is composed of the following five questions:
1. We would like to ask you about your financial position currently. How do you think your (and your family’s) current financial position compares with that of last year?
a) Better, b) Same as last year, c) Worse, d) Don’t know/Can’t say2. In what way do you think your (and your family’s) financial position would change in a
year’s time? a) Better, b) Remain the same as this year, c) Worse, d) Don’t know/Can’t say
3. How do you think your current expectations about your country’s economy compare with those that you had 3 months previously?
a) Better, b) Same, c) Worse, d) Don’t know/Can’t say4. In what way do you think your country’s economy would change in a year’s time ?
a) Better, b) Remain the same as this year, c) Worse, d) Don’t know/Can’t say5. How would you rate the current period as a time to buy consumer durable goods such as
television, refrigerator, computer, furniture or vehicles or property? a) Good time, b) Neutral time, c) Bad time, d) Don’t know/Can’t say
Calculation of Indices and Benchmarking

The index is calculated according to the following formula: Index Value = (Current period value / Base period value) * 100 Current period’s value for each question is calculated as = (((Number of optimistic
answers – Number of pessimistic answers) / Achieved sample)*100) + 100 Current period values for each question are summed up to obtain current period’s
value for the overall index The base period of the index is set as April 2007 and the value of the index at this
period is 100 The index has a point of scale ranging from 0 to 200 There are two sub-indexes of CCI: Consumer Expectation Index (CEI) Propensity to Consume/Spend Index (PCI) The CEI is calculated from questions 2 and 4 The PCI is calculated using only the fifth question The methodology for calculating both these sub-indexes is the same as used for
calculating CCI Current period’s value calculated for April 2007 is fixed as the base period value CCI and its sub-indexes will be calculated separately for each country
Calculation of Indices and Benchmarking
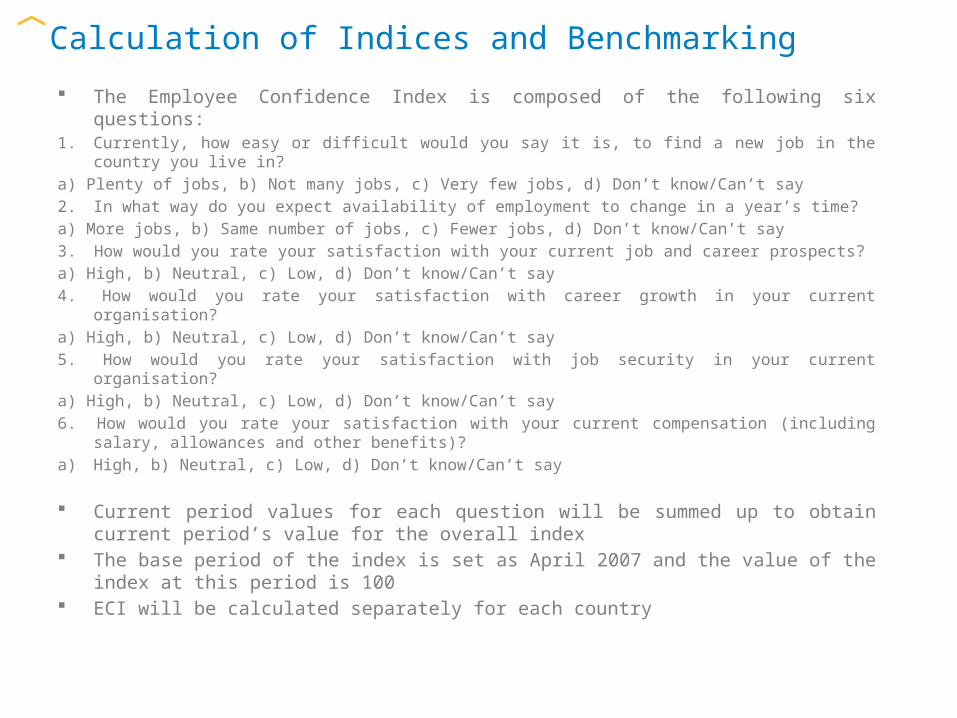
The Employee Confidence Index is composed of the following six questions:1. Currently, how easy or difficult would you say it is, to find a new job in the country you live in? a) Plenty of jobs, b) Not many jobs, c) Very few jobs, d) Don’t know/Can’t say2. In what way do you expect availability of employment to change in a year’s time? a) More jobs, b) Same number of jobs, c) Fewer jobs, d) Don’t know/Can’t say3. How would you rate your satisfaction with your current job and career prospects? a) High, b) Neutral, c) Low, d) Don’t know/Can’t say4. How would you rate your satisfaction with career growth in your current organisation? a) High, b) Neutral, c) Low, d) Don’t know/Can’t say5. How would you rate your satisfaction with job security in your current organisation? a) High, b) Neutral, c) Low, d) Don’t know/Can’t say6. How would you rate your satisfaction with your current compensation (including salary,
allowances and other benefits)? a) High, b) Neutral, c) Low, d) Don’t know/Can’t say
Current period values for each question will be summed up to obtain current period’s value for the overall index
The base period of the index is set as April 2007 and the value of the index at this period is 100
ECI will be calculated separately for each country
Calculation of Indices and Benchmarking
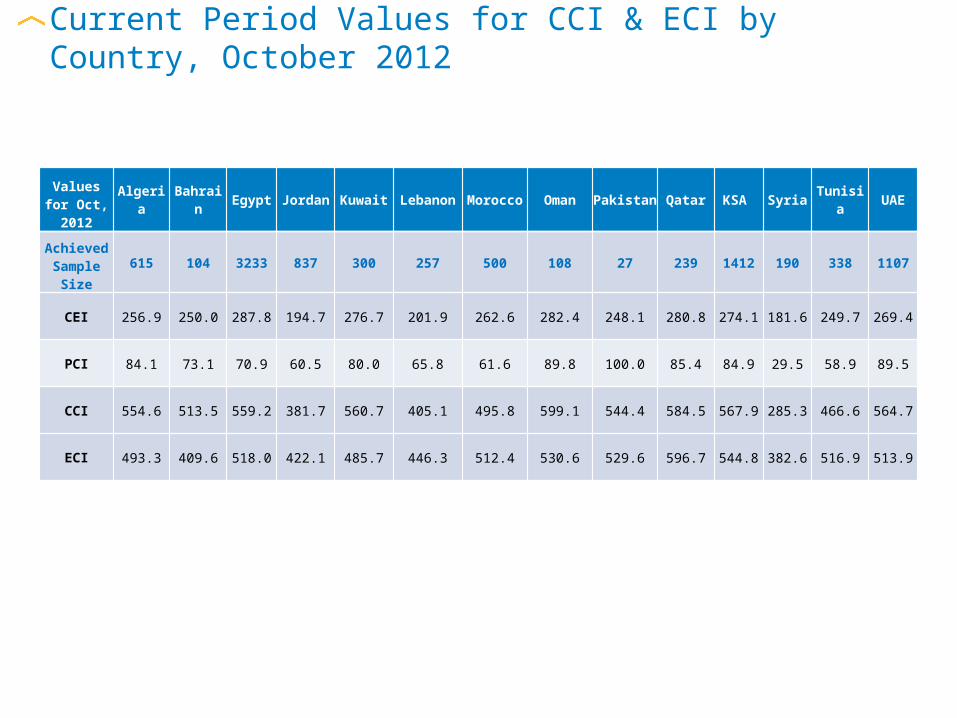
Values for Oct,
2012
AlgeriaBahrai
n Egypt Jordan Kuwait Lebanon Morocco OmanPakista
n Qatar KSA Syria Tunisia UAE
Achieved Sample
Size
615 104 3233 837 300 257 500 108 27 239 1412 190 338 1107
CEI 256.9 250.0 287.8 194.7 276.7 201.9 262.6 282.4 248.1 280.8 274.1 181.6 249.7 269.4
PCI 84.1 73.1 70.9 60.5 80.0 65.8 61.6 89.8 100.0 85.4 84.9 29.5 58.9 89.5
CCI 554.6 513.5 559.2 381.7 560.7 405.1 495.8 599.1 544.4 584.5 567.9 285.3 466.6 564.7
ECI 493.3 409.6 518.0 422.1 485.7 446.3 512.4 530.6 529.6 596.7 544.8 382.6 516.9 513.9
Current Period Values for CCI & ECI by Country, October 2012

Index Algeria Bahrain Egypt Kuwait Lebanon Morocco Qatar KSA Syria UAE
CEI -3.9 -4.1 -4.2 1.0 6.8 -0.9 -0.9 -4.1 -9.6 -0.7
PCI 0.0 -26.0 -6.2 -9.0 -14.9 -4.4 1.6 -3.3 -3.6 1.1
CCI -3.6 -8.6 -4.8 -0.1 4.2 -2.6 -0.3 -4.7 -9.1 1.6
ECI -1.3 -15.0 -3.1 -5.6 0.8 1.0 4.4 -5.0 -10.2 4.2
Differences in Index by Country – October 2012 to August 2012
The following comparison has been done wherever relevant with the previous period of May 2012.
UAE, sees some improvement across most of the indices in comparison to the last wave except the CEI.
Syria also sees a dip across all indices in comparison to the last wave..
Lebanon sees some improvement on 3 out of the 4 indices.
What do the Indices Indicate?Comparison of Oct ‘12 with Previous Period Aug ‘12

Consumer Confidence in the UAE is constant with the past wave.
Respondents in the UAE continue to anticipate some improvement in their personal financial situation in the future.
Only 26% of the total respondents in this wave feel that their personal financial situation is better than last year. 27% opine that it is worse. 49% are optimistic about their future personal financial situation.
47% of the respondents have positive expectations regarding the country’s future economy and financial conditions. Another 22% feel that it would remain the same.
27% of the respondents are of the opinion that now is not a good time to buy consumer durables.
25% say that the current period is a bad time for business. However, 52% say this would improve in a year’s time.
Majority of respondents believe that finding a job is difficult in the UAE in the current situation but have a positive outlook of the future. 38% opine that there are very few jobs available in the market.
Low to moderate satisfaction with current compensation reported by the residents. 34% claim low satisfaction with job security.
66% also claim that salaries are not keeping pace with the cost of living.
What do UAE respondents think?

Respondent profile

Base: Total Sample – N= 10,094
Respondent Profile – Country

Base: Total Sample – N= 10,094Base: Total Sample – N= 10,094
Base: Total Sample – N= 10,094 Base: Married/ used to be married– N= 5,327
Respondent profile - Personal

Base: Total Sample – N= 10,094
Respondent profile - Organizational

Q. How do you think your (and family’s) current financial position compares with that of last year? Q. How do you think your current expectations about your country’s economy compare with those that you had 3 months previously? Q. How would you rate the current period as a time to buy consumer durable goods?
Only 26% of the total respondents in this wave feel that their personal financial situation is better than last year.
Just over a quarter (27%) of the respondents feel optimistic about the current economy of their country.
43% claim now is a ‘bad time’ to buy consumer durables.
Total / Country of residence
Total AlgeriaBahrai
nEgypt Jordan Kuwait Lebanon
Morocco
Oman Pakistan QatarSaudi Arabia
Syria Tunisia UAE
Base Size 10094 615 104 3233 837 300 257 500 108 27 239 1412 190 338 1107
Financial
Better 26 30 20 27 18 32 20 17 30 22 31 34 8 18 26
Same 35 35 40 34 34 34 35 38 39 33 38 36 21 42 39
Worse 32 23 27 31 44 29 42 35 25 26 24 24 69 33 27
Don't know 7 12 13 8 5 4 3 11 6 19 6 6 2 7 8
Country’s economy
Better 27 29 25 34 8 25 11 19 37 37 36 29 5 20 32
Same 30 34 34 28 27 38 32 34 38 22 30 31 17 24 34
Worse 34 22 28 28 56 24 52 30 15 37 25 30 70 48 24
Don't know 10 15 13 10 8 13 5 16 10 4 9 10 8 8 9
Consumer Durables
Good time to buy
15 24 13 15 11 12 10 13 17 37 13 18 7 13 16
Neutral time to buy
35 21 38 33 32 50 42 22 52 15 51 40 14 26 49
Bad time to buy
43 40 39 44 51 32 44 52 27 37 28 34 78 54 27
Don't know 8 14 10 8 6 6 5 13 5 11 8 8 1 7 8
Appraisal of Present Situation – 1/3

Q. How would you rate the current period in terms of business conditions? Q. Currently, how easy or difficult would you say it is, to find a new job in the country you live in?
26% feel that the current period is good for business. 34% opine that it is not good. 43% in the UAE claim it is a Neutral period.
With regards to employment almost half (49%) of the respondents claim there are a ‘very few’ jobs available. This sentiment is strongest in Syria (64%) followed by Jordan and Lebanon (62% each).
Total / Country of residence
Total AlgeriaBahrai
nEgypt Jordan Kuwait Lebanon Morocco
Oman
Pakistan
Qatar
Saudi Arabia
Syria Tunisia UAE
Base Size 10094 615 104 3233 837 300 257 500 108 27 239 1412 190 3381107
Business Conditions
Good time 26 40 10 25 15 20 12 25 34 33 26 40 5 25 24
Neutral time 32 22 34 31 28 45 36 27 37 22 42 31 16 32 43
Bad time 34 24 46 36 47 29 47 32 21 37 23 21 75 34 25
Don't know 9 14 11 7 10 6 4 15 7 7 9 8 4 9 7
Employment
Plenty available 14 13 9 9 6 17 4 9 19 26 32 30 4 7 20
Not many available
33 30 30 35 29 35 32 33 39 44 33 32 28 37 36
Very few available
49 52 57 52 62 46 62 55 36 30 29 32 64 53 38
Don’t know 4 5 5 4 3 2 3 3 6 0 7 5 4 3 6
Appraisal of Present Situation – 2/3
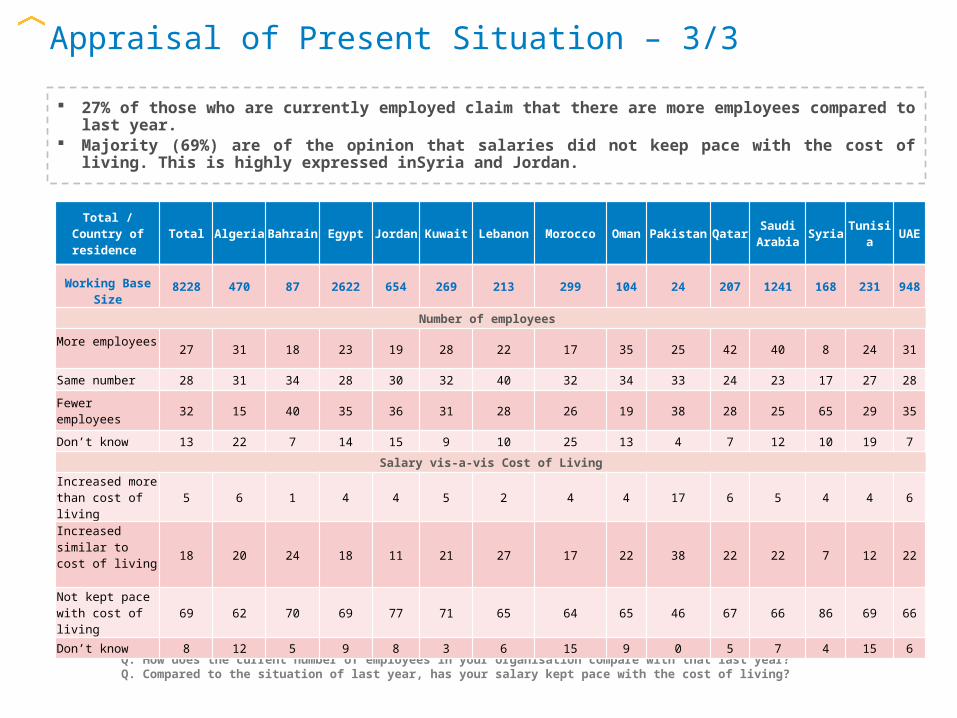
Q. How does the current number of employees in your organisation compare with that last year? Q. Compared to the situation of last year, has your salary kept pace with the cost of living?
27% of those who are currently employed claim that there are more employees compared to last year.
Majority (69%) are of the opinion that salaries did not keep pace with the cost of living. This is highly expressed inSyria and Jordan.
Total / Country of residence
Total AlgeriaBahrai
nEgypt Jordan Kuwait Lebanon Morocco
Oman
Pakistan QatarSaudi Arabia
SyriaTunisi
aUAE
Working Base Size
8228 470 87 2622 654 269 213 299 104 24 207 1241 168 231 948
Number of employees
More employees 27 31 18 23 19 28 22 17 35 25 42 40 8 24 31
Same number 28 31 34 28 30 32 40 32 34 33 24 23 17 27 28
Fewer employees
32 15 40 35 36 31 28 26 19 38 28 25 65 29 35
Don’t know 13 22 7 14 15 9 10 25 13 4 7 12 10 19 7
Salary vis-a-vis Cost of Living
Increased more than cost of living
5 6 1 4 4 5 2 4 4 17 6 5 4 4 6
Increased similar to cost of living
18 20 24 18 11 21 27 17 22 38 22 22 7 12 22
Not kept pace with cost of living
69 62 70 69 77 71 65 64 65 46 67 66 86 69 66
Don’t know 8 12 5 9 8 3 6 15 9 0 5 7 4 15 6
Appraisal of Present Situation – 3/3

Q. In what way do you think your (and family’s) financial position would change in a year’s time? Q. In what way do you think your country’s economy would change in a year’s time?
49% are of the sentiment that their personal finances will become better in a year’s time. Respondents from Egypt show the highest level of optimism with regards to the country’s
economy in the next year.
Total / Country of residence
Total AlgeriaBahrai
nEgypt Jordan Kuwait
Lebanon
Morocco
OmanPakista
nQatar
Saudi Arabia
SyriaTunisi
aUAE
Base Size 10094 615 104 3233 837 300 257 500 108 27 239 1412 190 338 1107
Financial
Will be better 49 45 42 52 37 56 45 44 53 44 54 55 33 49 49
Will remain the same
14 14 24 11 16 14 18 13 18 26 17 17 11 13 18
Become worse 9 5 11 6 15 8 17 7 7 11 8 7 21 9 10
Don’t know 28 37 23 31 32 23 20 37 22 19 21 21 36 28 24
Country’s Economy
Will be better 44 36 41 57 18 43 18 41 48 44 53 46 19 36 47
Will remain the same
16 21 22 10 18 25 23 19 21 11 19 20 5 15 22
Become worse 22 19 23 15 46 14 44 15 11 30 19 20 50 26 17
Don’t know 17 24 13 17 18 18 14 25 19 15 9 14 26 23 15
Expectations for the Year Hence – 1/2

Q. In what way do you expect business conditions to change in a year’s time? Q. In what way do you expect availability of employment to change in a year’s time?
Understandably, better business conditions in the next year are expected in all the countries.
Qatar followed by Egypt expect the highest improvement in employment opportunities.
Total / Country of residence
Total AlgeriaBahrai
nEgypt Jordan Kuwait
Lebanon
Morocco
OmanPakista
nQatar
Saudi Arabia
SyriaTunisi
aUAE
Base Size 10094 615 104 3233 837 300 257 500 108 27 239 1412 190 338 1107
Business Conditions
Will be better 50 43 40 62 26 47 27 47 54 52 53 53 26 48 52
Will remain the same
19 23 28 13 22 26 31 17 21 15 23 22 12 21 23
Become worse 14 10 18 10 31 9 26 10 15 22 11 11 39 13 10
Don’t know 17 23 13 15 22 18 17 26 10 11 13 14 23 18 14
Employment
There will be more jobs available
34 22 20 46 15 31 13 25 33 30 54 37 24 28 37
There will be same number of jobs available
26 32 28 22 27 29 33 28 30 26 21 28 15 32 27
There will be fewer jobs available
24 27 42 16 42 27 39 23 26 41 14 23 39 21 22
Don’t know/Can’t say
16 19 10 17 16 13 14 24 11 4 10 12 21 18 14
Expectations for the Year Hence – 2/2

Q. How would you rate your satisfaction with your current job and career prospects? Q. How would you rate your satisfaction with career growth in your current organisation?
Neutral to low satisfaction with career prospects and career growth within current organisations reported.
Total / Country of residence
Total AlgeriaBahrai
nEgypt Jordan Kuwait
Lebanon
Morocco
OmanPakista
nQatar
Saudi Arabia
SyriaTunisi
aUAE
Working Base Size 8228 470 87 2622 654 269 213 299 104 24 207 1241 168 231 948
Prospects
High 15 19 7 15 15 15 20 16 19 21 21 17 13 19 14
Neutral 37 28 40 41 30 42 35 30 38 42 46 38 27 29 41
Low 40 40 45 36 46 41 39 36 38 33 30 38 55 36 40
Don’t know 8 12 8 8 9 3 6 18 6 4 3 6 5 15 5
Career Growth
High 20 25 14 20 18 18 20 18 20 25 22 21 13 25 18
Neutral 35 24 31 36 29 38 37 37 44 38 46 39 27 29 37
Low 40 41 47 38 47 41 36 32 34 33 30 36 57 35 41
Don’t know 6 10 8 5 6 3 8 13 2 4 1 4 4 10 5
Satisfaction with Career
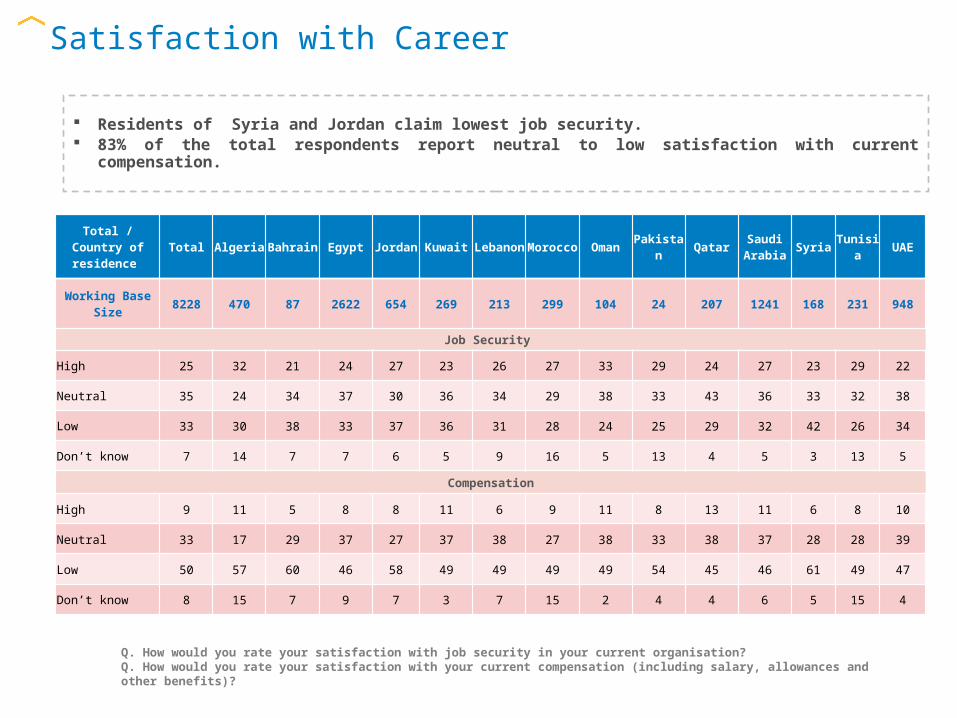
Q. How would you rate your satisfaction with job security in your current organisation? Q. How would you rate your satisfaction with your current compensation (including salary, allowances and other benefits)?
Residents of Syria and Jordan claim lowest job security. 83% of the total respondents report neutral to low satisfaction with current
compensation.
Total / Country of residence
Total AlgeriaBahrai
nEgypt Jordan Kuwait
Lebanon
Morocco
OmanPakista
nQatar
Saudi Arabia
SyriaTunisi
aUAE
Working Base Size 8228 470 87 2622 654 269 213 299 104 24 207 1241 168 231 948
Job Security
High 25 32 21 24 27 23 26 27 33 29 24 27 23 29 22
Neutral 35 24 34 37 30 36 34 29 38 33 43 36 33 32 38
Low 33 30 38 33 37 36 31 28 24 25 29 32 42 26 34
Don’t know 7 14 7 7 6 5 9 16 5 13 4 5 3 13 5
Compensation
High 9 11 5 8 8 11 6 9 11 8 13 11 6 8 10
Neutral 33 17 29 37 27 37 38 27 38 33 38 37 28 28 39
Low 50 57 60 46 58 49 49 49 49 54 45 46 61 49 47
Don’t know 8 15 7 9 7 3 7 15 2 4 4 6 5 15 4
Satisfaction with Career

Q. Would you be planning to invest in a vehicle within the next 12 months? Q. Which of the following types of vehicle would it be?
Only 27% of the total respondents are planning to purchase a new vehicle in the next year. Respondents in KSA show highest intent.
Of those who do plan to purchase a vehicle, 51% claim they would purchase a brand new one.
Total / Country of residence
Total AlgeriaBahrai
nEgypt Jordan Kuwait
Lebanon
Morocco
OmanPakista
nQatar
Saudi Arabia
SyriaTunisi
aUAE
Base Size 10094 615 104 3233 837 300 257 500 108 27 239 1412 190 338 1107
Vehicle
Yes 27 32 26 23 26 28 21 30 25 37 28 32 11 21 30
No 58 52 63 60 60 55 66 51 63 56 60 54 77 65 57
Don’t know 15 17 12 17 14 18 12 19 12 7 12 14 12 14 13
Types of vehicle
Plan to buy base 2715 194 27 742 216 83 55 150 27 10 67 457 21 72 327
New 51 59 41 57 38 33 53 36 44 20 45 59 48 50 49
Used 43 36 56 37 56 64 44 57 52 80 51 36 43 39 45
Don’t know 6 6 4 6 6 4 4 7 4 0 4 5 10 11 6
Investment in Vehicle

Q. Would you be planning to invest in property within the next 12 months? Q. Which of the following types of property would it be?
The trend continues with majority (64%) of respondents not interested in making any investment in property. In the UAE, 67% say they would not be buying any property.
Of those wishing to purchase a property, majority (65%) are likely to opt for a new one.
Total / Country of residence
Total AlgeriaBahrai
nEgypt Jordan Kuwait
Lebanon
Morocco
OmanPakista
nQatar
Saudi Arabia
SyriaTunisi
aUAE
Base Size 7421 557 93 1836 650 208 186 502 131 25 226 1050 121 218 906
Property
Yes 20 24 19 19 12 21 17 21 31 11 27 27 12 15 20
No 64 56 69 65 74 64 72 55 63 81 62 58 76 70 67
Don’t know 15 19 12 16 14 15 11 24 6 7 10 15 12 15 12
Types of property
Plan to buy base 2068 150 20 601 102 62 43 103 34 3 65 380 23 49 223
New 65 61 60 69 69 77 63 59 59 67 68 62 61 63 64
Lived in 24 28 25 19 19 16 19 29 26 33 31 22 22 29 28
Don’t know 12 11 15 11 13 6 19 12 15 0 2 16 17 8 8
Investment in Property

Q. Can you please tell us which of the following are you planning to invest in the next 6 months?
Higher interest in desktop/laptop followed by furniture continues.
Total / Country of residence
Total AlgeriaBahrai
nEgypt Jordan Kuwait
Lebanon
Morocco
OmanPakista
nQatar
Saudi Arabia
SyriaTunisi
aUAE
Base Size 10094 615 104 3233 837 300 257 500 108 27 239 1412 190 338 1107
Desktop or Laptop 25 30 21 25 24 24 18 28 26 41 27 27 22 20 26
Furniture 19 24 22 14 16 21 17 22 25 19 23 25 13 19 23
Digital Camera 12 15 10 10 10 11 12 14 11 26 18 13 5 12 15
LCD or Plasma Television 17 19 18 16 15 16 12 17 17 15 21 19 13 14 18
Washing Machine 9 14 4 5 8 6 5 15 8 15 12 11 5 10 11Air Conditioner 12 17 9 14 12 6 11 9 6 15 13 14 7 11 7
Refrigerator 8 13 8 5 7 5 5 13 12 15 10 10 6 8 9
DVD or VCD Recorder or Player 3 5 3 2 4 2 3 8 3 4 2 3 2 4 4
Vacuum Cleaner 5 5 6 4 7 6 4 4 11 15 9 8 3 3 6
Normal Colour Television 3 8 2 2 3 2 2 8 6 22 3 4 1 5 2
Home Theatre System 5 3 7 3 3 7 3 3 6 7 11 9 3 4 10
Cooking Range 5 8 8 2 4 5 4 6 6 7 6 7 2 2 8
Clothes Dryer 4 5 3 2 3 4 3 8 7 19 6 5 1 5 5
Normal or Digital Camcorder 2 1 1 1 2 2 1 3 2 4 4 2 2 3 3
Video Recorder or Player 2 2 4 1 2 1 1 4 3 11 2 2 1 2 2
Purchase of Electronic Appliances
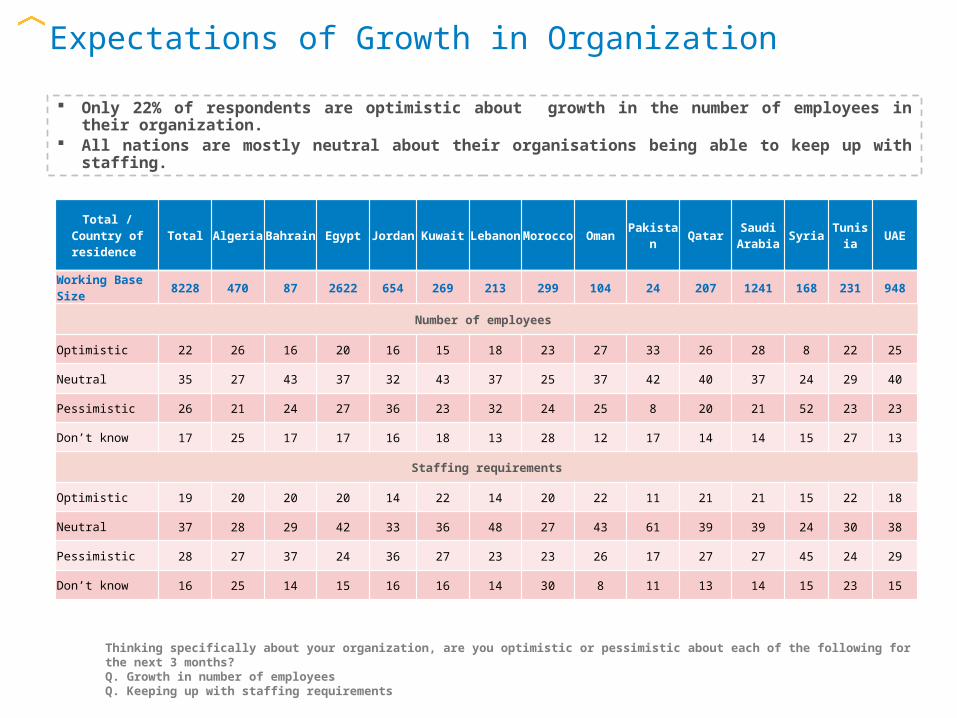
Thinking specifically about your organization, are you optimistic or pessimistic about each of the following for the next 3 months? Q. Growth in number of employees Q. Keeping up with staffing requirements
Only 22% of respondents are optimistic about growth in the number of employees in their organization.
All nations are mostly neutral about their organisations being able to keep up with staffing.
Total / Country of residence
Total AlgeriaBahrai
nEgypt Jordan Kuwait
Lebanon
Morocco
OmanPakista
nQatar
Saudi Arabia
SyriaTunisi
aUAE
Working Base Size 8228 470 87 2622 654 269 213 299 104 24 207 1241 168 231 948
Number of employees
Optimistic 22 26 16 20 16 15 18 23 27 33 26 28 8 22 25
Neutral 35 27 43 37 32 43 37 25 37 42 40 37 24 29 40
Pessimistic 26 21 24 27 36 23 32 24 25 8 20 21 52 23 23
Don’t know 17 25 17 17 16 18 13 28 12 17 14 14 15 27 13
Staffing requirements
Optimistic 19 20 20 20 14 22 14 20 22 11 21 21 15 22 18
Neutral 37 28 29 42 33 36 48 27 43 61 39 39 24 30 38
Pessimistic 28 27 37 24 36 27 23 23 26 17 27 27 45 24 29
Don’t know 16 25 14 15 16 16 14 30 8 11 13 14 15 23 15
Expectations of Growth in Organization

Q. Inflation/Rise in cost of living Q. Cost of real estate (rental or purchase)
Similar to the previous wave, inflation continues to generate a negative outlook across the board.
The cost of real estate is still creating a feeling of negativity in all countries.
Total / Country of residence
Total AlgeriaBahrai
nEgypt Jordan Kuwait
Lebanon
Morocco
OmanPakista
nQatar
Saudi Arabia
SyriaTunisi
aUAE
Working Base Size 8228 470 87 2622 654 269 213 299 104 24 207 1241 168 231 948
Inflation/Rise in cost of living
Positive 18 15 20 19 11 19 16 20 20 29 24 21 12 15 20
Neutral 21 18 29 22 19 19 18 15 29 25 28 23 14 18 28
Negative 39 34 29 37 54 40 47 32 35 17 33 36 61 39 35
Don't know 10 13 11 10 9 12 8 17 9 17 5 10 7 12 9
No Impact 11 21 11 12 8 10 10 15 8 13 10 11 7 17 8
Cost of real estate (rental or purchase)
Positive 16 13 13 15 10 15 15 14 19 29 22 19 12 14 18
Neutral 22 14 30 22 17 19 20 16 35 29 30 21 15 19 29
Negative 36 36 33 30 46 41 42 31 34 13 33 37 53 31 32
Don't know 11 14 13 12 10 10 8 18 5 17 6 9 7 11 11
No Impact 16 23 11 20 17 16 14 20 8 13 9 14 14 25 10
Expectations of Market Economy
Appendix

By country of residenceAppendix

Base: Total Sample – N= 10,094
Appraisal of Personal Financial Situation – (Better option)

Base: Total Sample: May ‘12= Aug ‘12=7,421 and Oct ‘12=10,094
Appraisal of Personal Financial Situation – (Better option)
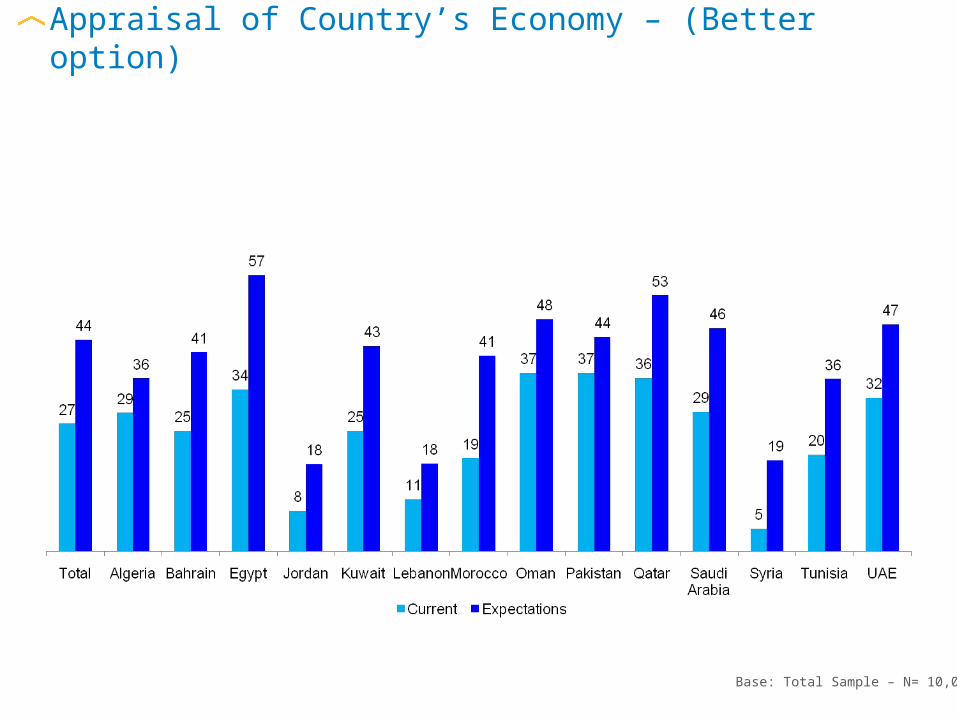
Base: Total Sample – N= 10,094
Appraisal of Country’s Economy – (Better option)

Base: Total Sample: August ‘12 =7,421 and Oct’ 12= 10,094
Appraisal of Country’s Economy – (Better option)

Base: Total Working Sample – N= 8,228
Appraisal of Career - (High Satisfaction Option)

Base: Total Working Sample – N= 8,228
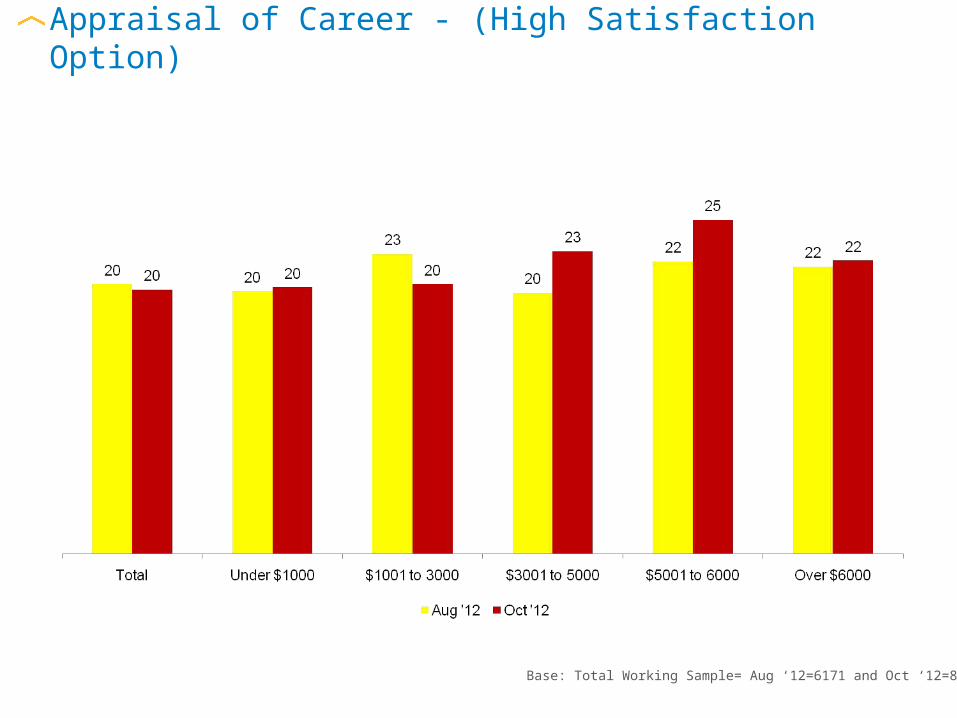
Appraisal of Career - (High Satisfaction Option)

Base: Total Working Sample : Aug ‘12=6,171 and Oct ‘12=8,228
Appraisal of Career - (High Satisfaction Option)

Base: Total Working Sample : Aug ‘12=6,171 and Oct ‘12=8,228
Appraisal of Career - (High Satisfaction Option)

By nationality Appendix

Base: Total Sample – N= 10094
Appraisal of Personal Financial Situation – (Better Option)

Base: Total Sample: Aug ‘12=7,421 and Oct ‘12=10094
Appraisal of Personal Financial Situation – (Better Option)

Base: Total Sample – N= 10094
Appraisal of Country’s Economy – (Better Option)

Base: Total Sample: Aug ‘12=7,421 and Oct ‘12=10094
Appraisal of Country’s Economy – (Better Option)

Base: Total Working Sample – N= 8228
Appraisal of Career - (High Satisfaction Option)

Base: Total Working Sample: Aug ‘12= 6,171 and Oct ‘12=8228
Appraisal of Career - (High Satisfaction Option)

By organizational sectorAppendix

Base: Total Sample – N= 10,094
Appraisal of Personal Financial Situation - (Better Option)

Base: Total Sample: Aug ‘12= 7,421 and Oct ‘12=10,094
Appraisal of Personal Financial Situation - (Better Option)

Base: Total Sample – N= 10094
Appraisal of Country’s Economy – (Better Option)

Base: Total Sample: Aug ‘12=7,421 and Oct ‘12=10094
Appraisal of Country’s Economy – (Better Option)

Base: Total Working Sample – N= 8,228
Appraisal of Career - (High Satisfaction Option)

Base: Total Working Sample : Aug ‘12=6,171 and Oct ‘12=8228
Appraisal of Career - (High Satisfaction Option)

By income Appendix

Base: Total Sample – N= 10094
Appraisal of Personal Financial Situation – (Better Option)

Base: Total Sample: Aug ‘12=7,421 and Oct ‘12=10,094
Appraisal of Personal Financial Situation – (Better Option)

Base: Total Sample – N=8228
Appraisal of Country’s Economy – (Better Option)

Appraisal of Country’s Economy – (Better Option)
Base: Total Sample: Aug ‘12=7,421 and Oct ‘12=10,094

Base: Total Working Sample – N= 8228
Appraisal of Career - (High Satisfaction Option)
Base: Total Working Sample= Aug ‘12=6171 and Oct ‘12=8228
Appraisal of Career - (High Satisfaction Option)

Thank you