the medium-term nickel market outlook
TRANSCRIPT
Macquarie ResearchCommodities
The medium-term nickel market outlook
May 2015
Macquarie Commodities Research
Macquarie Capital (Europe) Limited
Ropemaker Place28 Ropemaker St
London, UK EC2Y 9HD
Jim Lennon – Consultant to Macquarie+44 7768 766 729
In preparing this research, we did not take into account the investment objectives, financial situation and particular needs of the reader. Before making an
investment decision on the basis of this research, the reader needs to consider, with or without the assistance of an adviser, whether the advice is appropriate
in light of their particular investment needs, objectives and financial circumstances. Please see disclaimer.
Page 2
The nickel outlook: take-off delayedFrom being the best-performing base metal in the previous decade,
nickel has been one of the worst performing this decade
Nickel went from best to worst almost entirely due to massive growth in
Chinese nickel pig iron production, fuelled by imports of nickel ore from
Indonesia and (to a lesser extent) the Philippines
Prices rallied prematurely in 2014 following the announcement of a ban
on Indonesian ore exports from January 2014 and have subsequently
retreated to pre-ban lows
The recovery in prices has been delayed by an overhang of Indonesian
ore stocks and higher ore exports from the Philippines
By end-2015, however, we think nickel will move into a structural deficit
pushing prices higher out to 2020 – there are not enough large-scale
projects to meet expected demand growth

Page 3
Growth in nickel pig iron production (fuelled
mainly by Indonesian ore) “killed” nickel market
000t nickel 2006-14
2006 2014 Change
Supply
Production - ex NPI 1324 1518 194
NPI 0 483 483
Total 1324 2001 677
Demand
Ex-China consumption 1149 937 -212
China consumption 287 952 665
Total 1437 1890 453
Source: INSG, Macquarie Research, May 2015
0
200
400
600
800
1,000
1,200
1,400
1,600
1,800
2,000
2006 2007 2008 2009 2010 2011 2012 2013 2014
'000
t N
i
World nickel supply and demand since 2006
World production ex-NPI NPI production
World consumption
Page 4
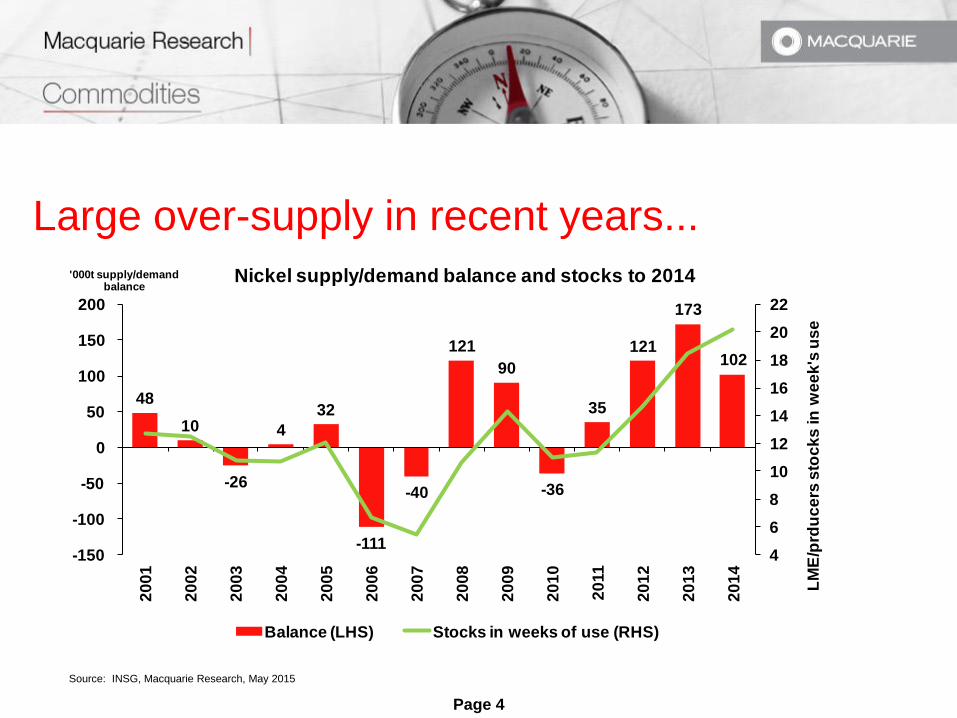
Large over-supply in recent years...
Source: INSG, Macquarie Research, May 2015
48
10
-26
4
32
-111
-40
121
90
-36
35
121
173
102
4
6
8
10
12
14
16
18
20
22
-150
-100
-50
0
50
100
150
200
20
01
20
02
20
03
20
04
20
05
20
06
20
07
20
08
20
09
20
10
20
11
20
12
20
13
20
14
LM
E/p
rdu
ce
rs s
toc
ks
in
we
ek
's u
se
'000t supply/demand balance
Nickel supply/demand balance and stocks to 2014
Balance (LHS) Stocks in weeks of use (RHS)

Page 5
The bigger, longer term picture: stock
overhang is very high
Source: LME, Macquarie Research, May 2015
0
2
4
6
8
10
12
0
10000
20000
30000
40000
50000
60000
1980
1981
1982
1983
1984
1985
1986
1987
1988
1989
1990
1991
1992
1993
1994
1995
1996
1997
1998
1999
2000
2001
2002
2003
2004
2005
2006
2007
2008
2009
2010
2011
2012
2013
2014
2015
LME
sto
cks:
we
eks
' co
nsu
mp
tio
n
$/to
nn
e c
on
stan
t 20
15$
LME stocks and prices since 1980Prices in constant $2015 and stocks as weeks's use
LME price LME stocks in week's demand

Page 6
Total nickel stocks: highest of any of the main
base metals...but falling overall
19.5
22.1
9.8
7.08.3
5.6
0
5
10
15
20
25
30
0
5
10
15
20
25
30
Al Ni Zn Cu Sn Pb
Estimated total stocks for base metals End-April 2014(weeks of annual consumption)
Exchange Other Raw Materials
26.1 26.4
10.9
6.3 7.15.6
0
5
10
15
20
25
30
0
5
10
15
20
25
30
Al Ni Zn Cu Sn Pb
Estimated total stocks for base metals End-Dec 2013(weeks of annual consumption)
Exchange Other Raw Materials
Source: INSG, ICSG, ILZSG, IAI, LME, SHFE, CRU, Comex, Macquarie Research, May 2015

Page 7
The year in retrospect...Following Indonesian ore ban from January 14, 2014, fund buying sent
LME nickel prices and nickel ore prices sharply higher, driven mainly by
fund speculative buying
Rise was premature due to large stockpiles of Indonesian nickel ore built
in China in 2013 and large non-LME stocks (mainly in China)
Higher nickel prices led to a strong restocking cycle in stainless steel
(global production up 16% YoY in Q2 2014)
Philippines ore exports surge from April 2014 and LME stock rises
accelerate from May (Qingdao financing scandal)
Funds took profits and nickel prices started to fall sharply
Stainless steel demand fell sharply in Q4 2014/Q1 2015, leading to mini-
collapse in demand.
Page 8
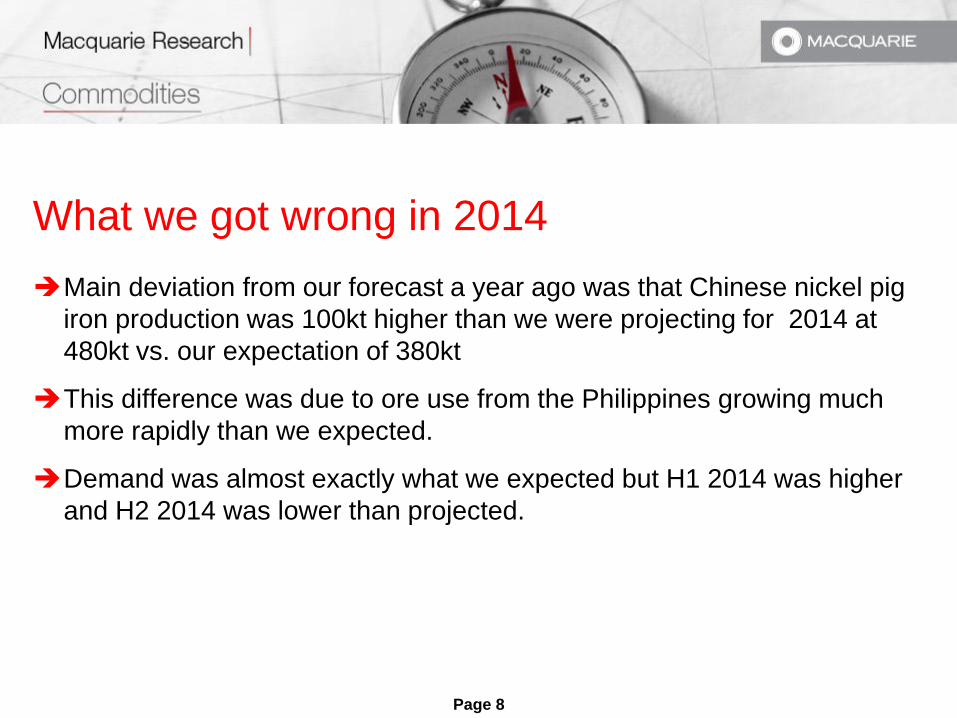
What we got wrong in 2014
Main deviation from our forecast a year ago was that Chinese nickel pig
iron production was 100kt higher than we were projecting for 2014 at
480kt vs. our expectation of 380kt
This difference was due to ore use from the Philippines growing much
more rapidly than we expected.
Demand was almost exactly what we expected but H1 2014 was higher
and H2 2014 was lower than projected.
Page 9
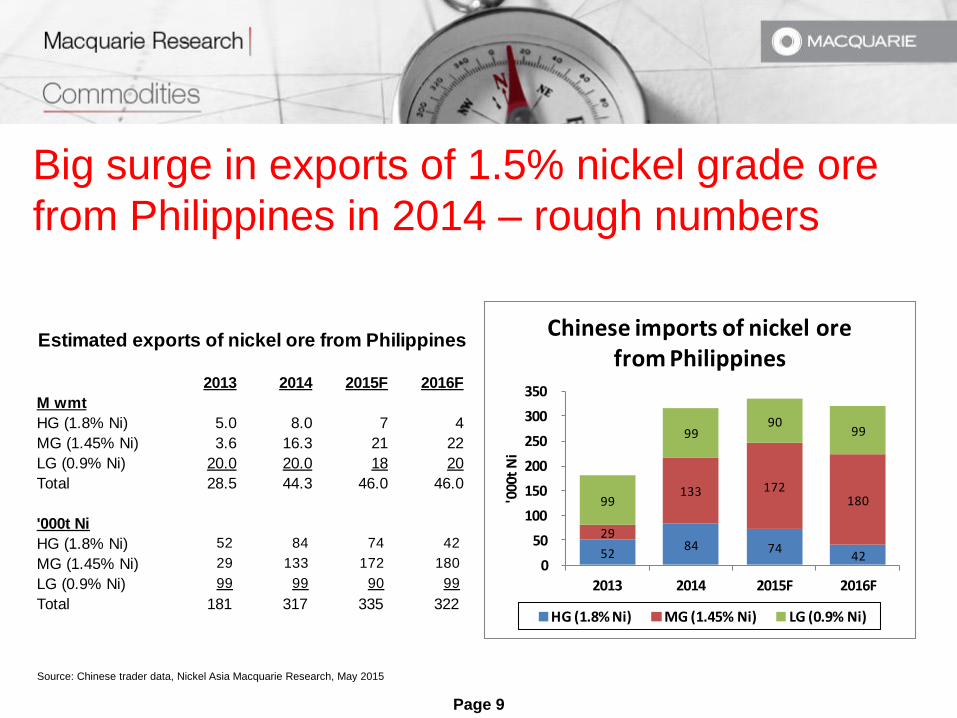
Big surge in exports of 1.5% nickel grade ore
from Philippines in 2014 – rough numbers
Source: Chinese trader data, Nickel Asia Macquarie Research, May 2015
Estimated exports of nickel ore from Philippines
2013 2014 2015F 2016F
M wmt
HG (1.8% Ni) 5.0 8.0 7 4
MG (1.45% Ni) 3.6 16.3 21 22
LG (0.9% Ni) 20.0 20.0 18 20
Total 28.5 44.3 46.0 46.0
'000t Ni
HG (1.8% Ni) 52 84 74 42
MG (1.45% Ni) 29 133 172 180
LG (0.9% Ni) 99 99 90 99
Total 181 317 335 322
52 84 74
42
29
133 172 180 99
99 90
99
0
50
100
150
200
250
300
350
2013 2014 2015F 2016F
'000
t N
i
Chinese imports of nickel ore from Philippines
HG (1.8% Ni) MG (1.45% Ni) LG (0.9% Ni)
Page 10
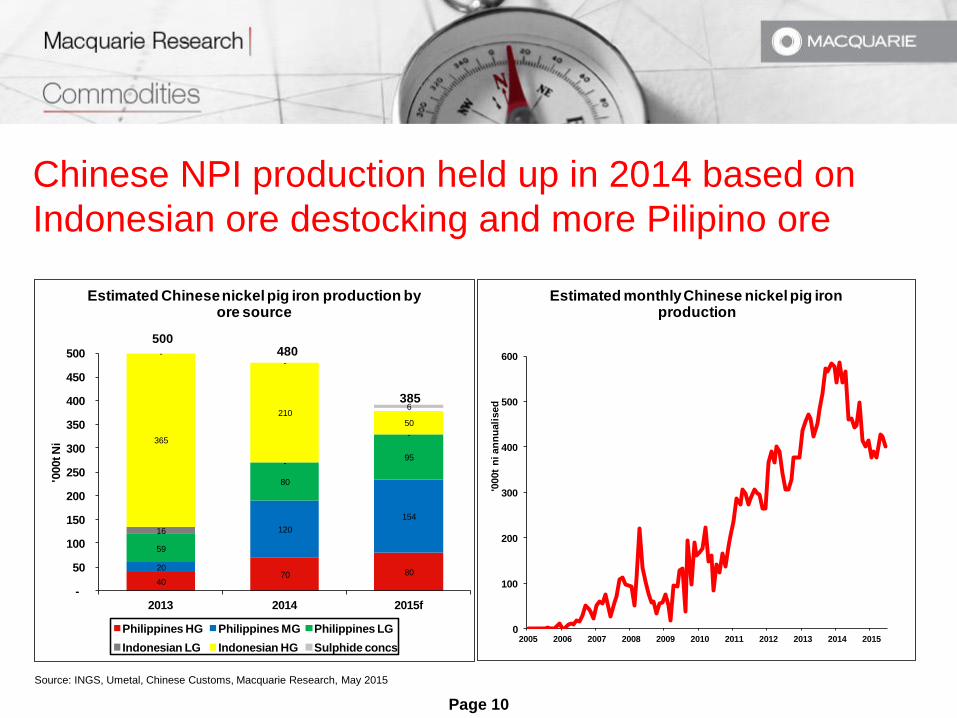
Chinese NPI production held up in 2014 based on
Indonesian ore destocking and more Pilipino ore
Source: INGS, Umetal, Chinese Customs, Macquarie Research, May 2015
40 70 80
20
120
154
59
80
95
16
-
-365
210 50
500 480
385
--
6
-
50
100
150
200
250
300
350
400
450
500
2013 2014 2015f
'000t N
i
Estimated Chinese nickel pig iron production by ore source
Philippines HG Philippines MG Philippines LG
Indonesian LG Indonesian HG Sulphide concs
0
100
200
300
400
500
600
2005 2006 2007 2008 2009 2010 2011 2012 2013 2014 2015
'000t
ni an
nu
ali
sed
Estimated monthly Chinese nickel pig iron production

Page 11
Quarterly nickel supply/demand – short-lived
deficit in Q214...
Source: INSG, Macquarie Research, May 2015
-1
26
36
6055
48
-30
18
-22
-41
2
26
-13 -13
3427
36
-31
21
45 43
34
53
43
28
-19
51
43
11
-60
-40
-20
0
20
40
60
80
250
275
300
325
350
375
400
425
450
475
500
525
550
Q108
Q208
Q308
Q408
Q109
Q209
Q309
Q409
Q110
Q210
Q310
Q410
Q111
Q211
Q311
Q411
Q112
Q212
Q312
Q412
Q113
Q213
Q313
Q413
Q114
Q214
Q314
Q414
Q115F
Bala
nce: '0
00t
SD
: '0
00t N
i
Global nickel supply/demand
Balance Supply Use (not demand)

Page 12
Nickel prices rally, then collapse against background of high
and rising LME stocks – back below where we started!
Source: LME, Macquarie Research, May 2015
250000
275000
300000
325000
350000
375000
400000
425000
450000
12,000
13,000
14,000
15,000
16,000
17,000
18,000
19,000
20,000
21,000
22,000
Jan
-14
Feb
-14
Mar-
14
Ap
r-14
May-1
4
Ju
n-1
4
Ju
l-14
Au
g-1
4
Sep
-14
Oct-
14
No
v-1
4
Dec-1
4
Jan
-15
Feb
-15
Mar-
15
Ap
r-15
May-1
5
LM
E s
tocks: to
nn
es
LM
E c
ash
pri
ce:
$/t
LME price LME stocks

Page 13
Currency has been another factor suppressing
prices in US dollar terms
80
100
120
140
160
180
200
Jan 2014
Feb 2014
Mar 2014
Apr 2014
May 2014
Jun 2014
Jul 2014
Aug 2014
Sep 2014
Oct 2014
Nov 2014
Dec 2014
Jan 2015
Feb 2015
Mar 2015
Apr 2015
May 2015
Ind
ec
Jan
20
14
=1
00
Index of LME nickel prices in different currencies(monthly averages)
Russia
Brazil
Euro
Japan
Aust.
Canada
China
USA
Source: LME, Bloomberg, Macquarie Research, May 2015

Page 14
Weaker energy prices have lowered operating
costs for miners and smelters
Brent crude price$/barrel
Source: Bloomberg, Mysteel, Macquarie Research, May 2015
Chinese coke and coking coal prices$/tonne
0
20
40
60
80
100
120
140
160
2006 2008 2010 2012 2014
Between 10-30% of mining
costs are oil-linked
100
120
140
160
180
200
220
240
260
280
Jan
-12
Mar
-12
May
-12
Jul-
12
Sep
-12
No
v-1
2
Jan
-13
Mar
-13
May
-13
Jul-
13
Sep
-13
No
v-1
3
Jan
-14
Mar
-14
May
-14
Jul-
14
Sep
-14
No
v-1
4
Jan
-15
Mar
-15
$/t
on
ne
ex-
VA
T
Coke Coking coal

Page 15
Role of funds- fund long liquidation since
November 2014 and recently short covering
Source: LME, Macquarie Research, May 2015
12000
13000
14000
15000
16000
17000
18000
19000
20000
21000
22000
800000
900000
1000000
1100000
1200000
1300000
1400000
1500000
1600000
1700000
1800000
1900000
2000000
2100000
Ja
n-1
4
Fe
b-1
4
Ma
r-1
4
Ap
r-1
4
Ma
y-1
4
Ju
n-1
4
Ju
l-1
4
Au
g-1
4
Se
p-1
4
Oc
t-1
4
No
v-1
4
De
c-1
4
Ja
n-1
5
Fe
b-1
5
Ma
r-1
5
Ap
r-1
5
Ma
y-1
5
Pri
ce:
$/t
on
ne
LM
E fu
ture
op
en
in
tere
st:
to
nn
es
LME futures open interest and price
Open interest LME price
11,000
12,000
13,000
14,000
15,000
16,000
17,000
18,000
19,000
20,000
21,000
0
5000
10000
15000
20000
25000
30000
35000
40000
45000
LME
3M
pri
ce:
$/t
on
ne
Lots
: ne
t lo
ngs
Money manager net longs and nickel price
Money manager net longs LME 3-month price
Page 16
Why the Indonesian ban has yet to have a
significant impact on nickel prices
The Chinese built enormous stockpiles of Indonesian ore ahead of the
ban
The Philippines (and Guatemala to a lesser extent) has partly stepped in
as a replacement to Indonesian ore
China had enormous unreported stocks of primary nickel which it
destocked during 2014 and early 2015
The stainless steel market crashed at the end of 2014/early 2015
Page 17
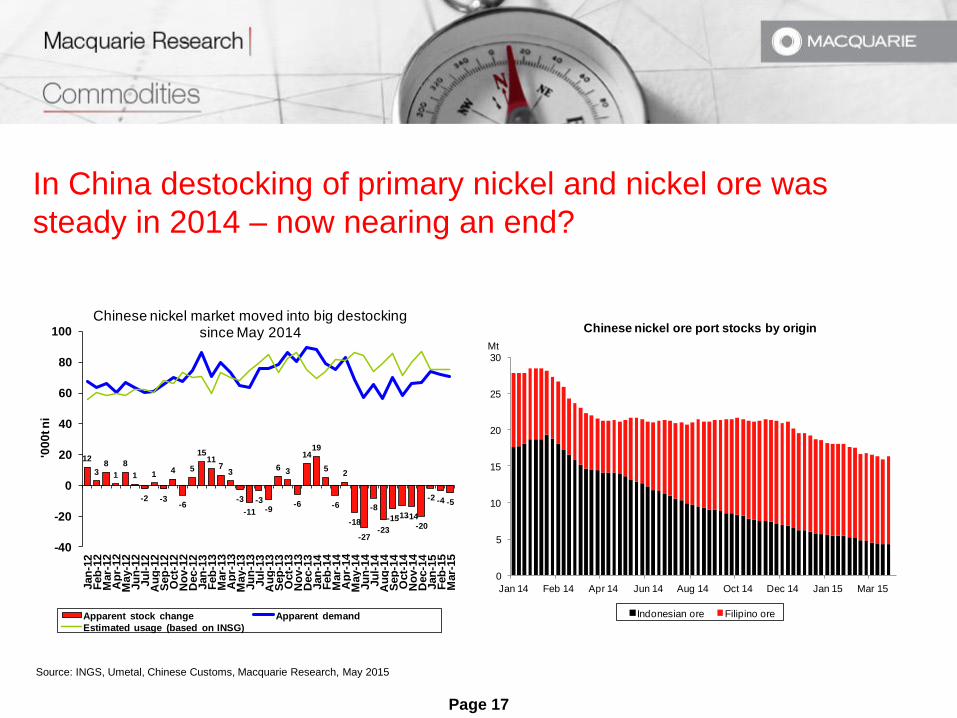
In China destocking of primary nickel and nickel ore was
steady in 2014 – now nearing an end?
Source: INGS, Umetal, Chinese Customs, Macquarie Research, May 2015
12
38
1
8
1
-2
1
-3
4
-6
5
1511
73
-3
-11
-3-9
6 3
-6
1419
5
-6
2
-18
-27
-8
-23
-15-13-14-20
-2 -4 -5
-40
-20
0
20
40
60
80
100
Jan
-12
Feb
-12
Mar-
12
Ap
r-12
May-1
2Ju
n-1
2Ju
l-12
Au
g-1
2S
ep
-12
Oct-
12
No
v-1
2D
ec-1
2Jan
-13
Feb
-13
Mar-
13
Ap
r-13
May-1
3Ju
n-1
3Ju
l-13
Au
g-1
3S
ep
-13
Oct-
13
No
v-1
3D
ec-1
3Jan
-14
Feb
-14
Mar-
14
Ap
r-14
May-1
4Ju
n-1
4Ju
l-14
Au
g-1
4S
ep
-14
Oct-
14
No
v-1
4D
ec-1
4Jan
-15
Feb
-15
Mar-
15
'00
0t n
i
Chinese nickel market moved into big destocking since May 2014
Apparent stock change Apparent demand
Estimated usage (based on INSG)
0
5
10
15
20
25
30
Jan 14 Feb 14 Apr 14 Jun 14 Aug 14 Oct 14 Dec 14 Jan 15 Mar 15
Mt
Chinese nickel ore port stocks by origin
Indonesian ore Filipino ore

Page 18
Chinese price discount to LME narrowing
suggesting less exports and more imports
Source: Chinese Customs, LME, SMM, Macquarie Research, May 2015
5 5
13
-4
4
21
12 11
3027
19
10 10
6
2
11
1 2
68
6
17 17 17
9 8 85 4
2 2
-10.0
-5.0
0.0
5.0
10.0
15.0
20.0
25.0
30.0
35.0
Jan
-14
Feb
-14
Mar
-14
Ap
r-14
May
-14
Jun
-14
Jul-
14
Au
g-14
Sep
-14
Oct
-14
No
v-14
De
c-14
Jan
-15
Feb
-15
Mar
-15
Ap
r-15
'000
t N
i
LME stock changes and Chinese metal exports
LME stock change China nickel exports
-533 -833
-2,035
-1,140
-486 -777 -993
-538
-504
-470 -707
-401
93
127
509
517
-463
-336
-1,606
-1,590
130 77
-1,122
-630
-497
-442
-1,815
-416
6
85
366
563
-2500
-2000
-1500
-1000
-500
0
500
1000
Jan-14
Feb
-14
Mar-14
Ap
r-14
May-14
Jun
-14
Jul-14
Au
g-14
Sep
-14
Oct-14
No
v-14
De
c-14
Jan-15
Feb
-15
Mar-15
Ap
r-15
$/to
nn
e N
i
Chinese nickel prices minus LME price
Jinchuan metal minus LME price 10% NPI minus LME price
Page 19
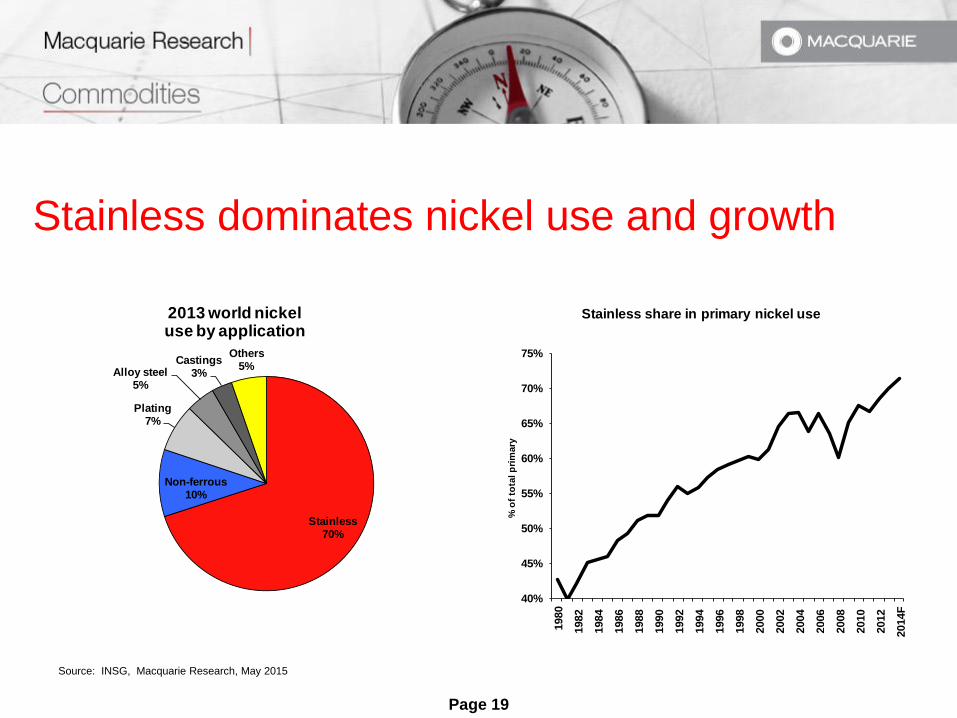
Stainless dominates nickel use and growth
40%
45%
50%
55%
60%
65%
70%
75%
1980
1982
1984
1986
1988
1990
1992
1994
1996
1998
2000
2002
2004
2006
2008
2010
2012
2014F
% o
f to
tal p
rim
ary
Stainless share in primary nickel use
Stainless70%
Non-ferrous10%
Plating7%
Alloy steel5%
Castings3%
Others5%
2013 world nickel use by application
Source: INSG, Macquarie Research, May 2015

Page 20
Q414/Q115 falls in stainless production in
Europe, Korea, Taiwan and Japan
Source: INSG, ISSF, Tex, AISI, CRU Macquarie Research, May 2015
2014 2014 2014 2014 2015
'000t Q1 Q2 Q3 Q4 Q1E
USA 557 607 604 621 659
Japan 838 842 861 790 812
Europe 2059 2024 1610 1537 1915
Korea 529 510 507 492 505
Taiwan 257 310 277 259 258
India 725 739 750 760 792
China 5031 5601 5515 5575 5095
Other 1032 1019 1009 1027 1074
Total 10302 10914 10383 10302 10318
Total Ex-China 5271 5313 4868 4726 5222
Chinese net exports 702 1,059 962 841 734
% change yoy
USA 13.5% 24.9% 14.3% 18.3% 18.3%
Japan 9.5% 6.4% 7.1% -3.0% -3.1%
Europe 0.3% 9.2% 7.3% -13.1% -7.0%
Korea 3.5% -1.3% -6.7% -13.9% -4.5%
Taiwan -7.8% 24.9% 8.4% -13.3% 0.5%
India 12.5% 12.5% 9.1% 9.8% 9.2%
China 12.1% 23.3% 8.4% 4.3% 1.3%
Other 9.5% 5.8% 6.0% 6.4% 4.1%
Total 8.1% 16.1% 7.3% 0.1% 0.2%
Total Ex-China 4.6% 9.3% 6.2% -4.4% -0.9%
Chinese net exports 40.9% 70.8% 76.5% 43.2% 4.6%
7.2% 7.7%
11.4%
13.9%
8.1%
16.1%
7.3%
0.1% 0.2%
-2.5% -3.0%
-0.7%
6.8%
4.6%
9.3%
6.2%
-4.4%
-0.9%
13000
14000
15000
16000
17000
18000
19000
-10%
-5%
0%
5%
10%
15%
20%
Q1 Q2 Q3 Q4 Q1 Q2 Q3 Q4 Q1E
2013 2013 2013 2013 2014 2014 2014 2014 2015
Ni:
$/
ton
ne
% c
ha
ng
e Y
oY
World World Ex-China LME Ni price
Page 21
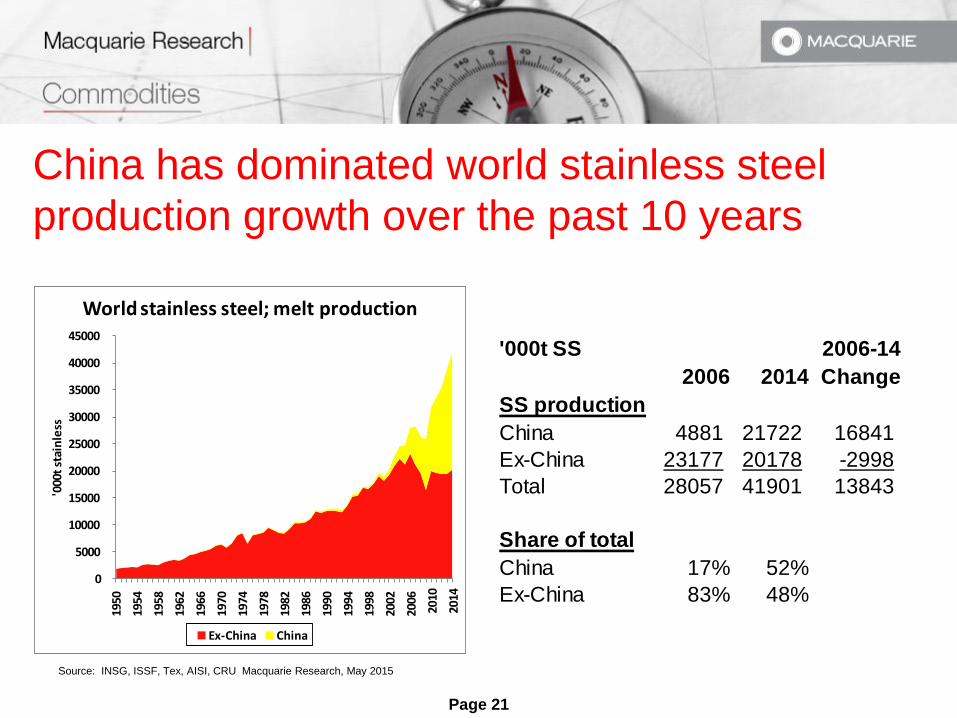
China has dominated world stainless steel
production growth over the past 10 years
0
5000
10000
15000
20000
25000
30000
35000
40000
45000
1950
1954
1958
1962
1966
1970
1974
1978
1982
1986
1990
1994
1998
2002
2006
2010
2014
'000
t st
ain
less
World stainless steel; melt production
Ex-China China
'000t SS 2006-14
2006 2014 Change
SS production
China 4881 21722 16841
Ex-China 23177 20178 -2998
Total 28057 41901 13843
Share of total
China 17% 52%
Ex-China 83% 48%
Source: INSG, ISSF, Tex, AISI, CRU Macquarie Research, May 2015

Page 22
Why did stainless output fall so much ex-China?
Since 2006 China has gone from a
net importer of 2.5mt to a net exporter
of 3mt – a 5.5mt swing
Massive rise in Chinese exports in
2013 and 2014 (net exports rose 46%
and 58% YoY respectively). China’s
net exports rose from 7% of non-
Chinese demand in 2012 to 10% in
2013 and 15% in 2014.
Note that Europe (ex-Turkey)
accounted for 15% of 2014 exports –
in March EU applied large anti-
dumping duties against China and
Taiwan
-20%
-15%
-10%
-5%
0%
5%
10%
15%
20%
-4000
-3500
-3000
-2500
-2000
-1500
-1000
-500
0
500
1000
1500
2000
2500
3000
2000
2001
2002
2003
2004
2005
2006
2007
2008
2009
2010
2011
2012
2013
2014
% o
f n
on
-Ch
inese d
em
an
d
'000t S
S p
rod
ucts
Chinese net exports of stainless steel products
Chinese net imports China % of non-Chinese use
Source: Chinese Customs, WBMS, Macquarie Research, May 2015

Page 23
Chinese net exports of stainless to Europe
plunge in Q1 2015
399,413
495,777437,221
472,350
573,498
861,194
775,854
669,366
590,890
0
100000
200000
300000
400000
500000
600000
700000
800000
900000
1000000
Q113 Q213 Q313 Q413 Q114 Q214 Q314 Q414 Q115
ton
ne
s SS
pro
du
cts
Chinese net exports of stainless steel - total
28,947
56,79150,694
71,987
107,447
151,762153,090
102,038
59,826
0
20000
40000
60000
80000
100000
120000
140000
160000
180000
Q113 Q213 Q313 Q413 Q114 Q214 Q314 Q414 Q115
ton
ne
s SS
pro
du
cts
Chinese net exports of stainless steel - Europe
25,062 25,134 25,091 24,59629,951
42,829
62,936
69,22565,775
0
10000
20000
30000
40000
50000
60000
70000
80000
Q113 Q213 Q313 Q413 Q114 Q214 Q314 Q414 Q115
ton
ne
s SS
pro
du
cts
Chinese net exports of stainless steel - North America
318,662
381,645
323,460337,273
397,097
615,849
509,989
447,116419,332
0
100000
200000
300000
400000
500000
600000
700000
Q113 Q213 Q313 Q413 Q114 Q214 Q314 Q414 Q115
ton
ne
s SS
pro
du
cts
Chinese net exports of stainless steel - Asia
6,353
7,908
10,43911,48811,177
12,509
14,923
12,340
14,956
0
2000
4000
6000
8000
10000
12000
14000
16000
Q113 Q213 Q313 Q413 Q114 Q214 Q314 Q414 Q115
ton
ne
s SS
pro
du
cts
Chinese net exports of stainless steel - Africa
9,28010,428
13,51112,914
15,456
20,633
16,67518,303
14,703
0
5000
10000
15000
20000
25000
Q113 Q213 Q313 Q413 Q114 Q214 Q314 Q414 Q115to
nn
es
SS p
rod
uct
s
Chinese net exports of stainless steel - Middle East
Source: Chinese Customs, WBMS, Macquarie Research, May 2015

Page 24
Pointers to a mid-15 recovery in nickel prices
Post Chinese New Year bounce in Chinese demand.
Chinese primary destocking near an end – LME stocks should start
falling by mid-2015?
Ex-Chinese stainless destocking to end by Q2 2015?
Chinese government stimulus now underway should steady Chinese
growth decline and lead to modest H2 recovery
Chinese port stocks of high-grade ore to be depleted during April-June
period – could trigger rally in ore prices
Fund short-covering

Page 25
China’s impact on market in 2014 – set to be more positive this
year as destocking ends and stainless exports slow?
Source: WBMS, CSSC, Chinese Customs, Macquarie Research, May 2015
Jan-Dec Jan-Dec YoY 14/13 YoY Jan-Dec Jan-Dec YoY YoY
2013 2014 % change change(t) 2014 2013 % change change(t)
Nickel ('000t) Stainless steel (mt)
Production 704.0 696.8 -1.0% -7.2 200 series 6.40 5.74 11.5% 0.66
(of which NPI) 500.0 480.0 -4.0% -20.0 300 series 10.87 9.77 11.2% 1.09
plus 400 series 4.46 3.95 12.8% 0.51
Imports 270.5 244.2 -9.7% -26.4 Total 21.72 19.46 11.6% 2.26
minus
Exports 48.3 118.0 144.3% 69.7 Exports 3.85 2.69 43.4% 1.16
gives Imports 0.82 0.77 7.1% 0.05
Apparent consumption 926.2 822.9 -11.2% -103.3 Net Exports 3.03 1.92 57.9% 1.11
Real consumption 897.9 952.4 6.1% 54.5
Apparent stock change 28.2 -129.6 Chinese apparent demand (melt) 18.16 17.20 5.6% 0.96
Exports of ni in stainless 192.8 278.1 44.2% 85.3
Total Ni exports (Ni+SS) 241.2 396.1 64.3% 155.0
Net exports ni in SS 136.4 217.6 59.6% 81.2
Total net ni exports (Ni +SS) -85.9 91.5 -206.6% 177.3

Page 26
China a net nickel exporter in 2014!(Ex raw
materials). Big swing in 2015?
Source: WBMS, CSSC, Chinese Customs, Macquarie Research, May 2015
Jan-Dec Jan-Dec YoY 15/14 YoY
2014 2015F % change change(t)
Nickel ('000t)
Production 696.8 616.8 -11.5% -7.2
(of which NPI) 480.0 385.0 -19.8% -20.0
plus
Imports 244.2 403.2 65.1% -26.4
minus
Exports 118.0 30.0 -74.6% 69.7
gives
Apparent consumption 822.9 990.0 20.3% -103.3
Real consumption 952.4 1004.5 5.5% 54.5
Apparent stock change -129.6 -14.5
Exports of ni in stainless 278.1 278.1 0.0% 85.3
Total Ni exports (Ni+SS) 396.1 308.1 -22.2% 155.0
Net exports ni in SS 217.6 217.6 0.0% 81.2
Total net ni exports (Ni +SS) 91.5 -155.6 -270.1% 177.3
267 305 277 264 237
418
-36-106 -105
-153-242 -230
-47
-33 -31
-41
-111
-30
-400
-300
-200
-100
0
100
200
300
400
500
2010 2011 2012 2013 2014 2015f
'00
0t
Ni
Primary Ni imports Ni in Stainless Primary Ni exports Total

Page 27
Stainless steel in 2015
World stainless production growth
projected to slow from 9.4% and
7.8% in 2013 and 2014 to 4.2%
this year (previous forecast:5.2%)
US and Chinese growth slowing
while Europe to benefit from less
imports from China and Taiwan
Chinese growth to decelerate
due to much lower growth in
exports and weaker domestic
demand growth
Source: INSG, Vale, ISSF, Macquarie Research, May 2015
Year Year Year
'000t 2013 2014E 2015F
USA 2030 2389 2439
Japan 3175 3331 3364
Europe 7175 7230 7380
Korea 2143 2038 2140
Taiwan 1081 1103 1114
India 2680 2973 3211
China 19461 21722 22846
Other 1143 1115 1152
Total 38887 41901 43646
Total Ex-China 19426 20178 20800
Chinese net exports 2250 3563 3382
% change yoy
USA 2.6% 17.7% 2.1%
Japan 1.4% 4.9% 1.0%
Europe -3.7% 0.8% 2.1%
Korea -1.1% -4.9% 5.0%
Taiwan -2.2% 2.0% 1.0%
India 8.5% 10.9% 8.0%
China 20.8% 11.6% 5.2%
Other 2.0% -2.5% 3.4%
Total 9.4% 7.8% 4.2%
Total Ex-China 0.0% 3.9% 3.1%
Chinese net exports 46.2% 58.4% -5.1%

Page 28
Stainless steel demand – China to slow
Source: INSG, Vale, ISSF, Macquarie Research, May 2015
25
%
-1%
13
%
-6%
42
%
13
%
10
% 16
%
18
%
6% 7%
6%
6%
7%
6%
6%
51
%
37
%
46
%
-5%
38
%
27
%
18
%
15
% 21
%
12
%
5% 6%
6%
6%
5%
5%
-10%
0%
10%
20%
30%
40%
50%
60%
20
05
20
06
20
07
20
08
20
09
20
10
20
11
20
12
20
13
20
14
20
15
F
20
16
F
20
17
F
20
18
F
20
19
F
20
20
F
% c
ha
ng
e y
oy
Annual changes in Chinese stainless production and apparent consumption
App. Cons. Production

Page 29
Nickel use forecasts by main area (‘000t Ni) –
70-80ktpa between now and 2020
Source: INSG, Macquarie Research, May 2015
-200
-150
-100
-50
0
50
100
150
200
250
20
00
20
01
20
02
20
03
20
04
20
05
20
06
20
07
20
08
20
09
20
10
20
11
20
12
20
13
20
14
20
15
F
20
16
F
20
17
F
20
18
F
20
19
F
20
20
F
'00
0t
Ni
World nickel use by area
Rest of world
CIS
Other Asia
India
China
Japan
USA
Europe
Total world

Page 30
Main nickel supply changes…870kt this
decade
Source: Company Reports, INSG, Macquarie Research, May 2015
0
100
200
300
400
500
600
20
10
20
14
20
15
F
20
16
F
20
17
F
20
18
F
20
19
F
20
20
F
'00
0t
Ni
Main capacity increases to 2020Taguang
FeNix
Ramu
Taganito
Ambatovy
Barro Alto
Talvivarra
Rustenburg
Nova-Bollinger
Pomalaa
Kwangyang
Koniambo
Poiseiden
Ban Phuc
Eagle
Enterprise
Kevista
Ravensthorpe
Onca Puma
VNC (Goro)
159
282
361
500 480
385350 350 350
3253000
0
1
23
2555
90125 160 200
0
100
200
300
400
500
600
2010 2011 2012 2013 2014 2015f 2016f 2017f 2018f 2019f 2020f
'000 t
pa N
i in
NP
I
Nickel pig iron production
Indonesia China

Page 31
Will Indonesian ban stay? Will Philippines
impose a ban?
Speculated by some that lack of progress in building NPI plants will lead
to a full or partial rescinding of ore export ban.
Partially relented for those building plants?
We still think that this is unlikely – no indication from top government
officials that this will be the case
Even a partial ban would be disastrous for the market since “everyone”
would say that they are building plants, making enforcement impossible!
Any ban from Philippines would be announced with a multiple-year
delay (up to five years) – no short-term market impact
Page 32
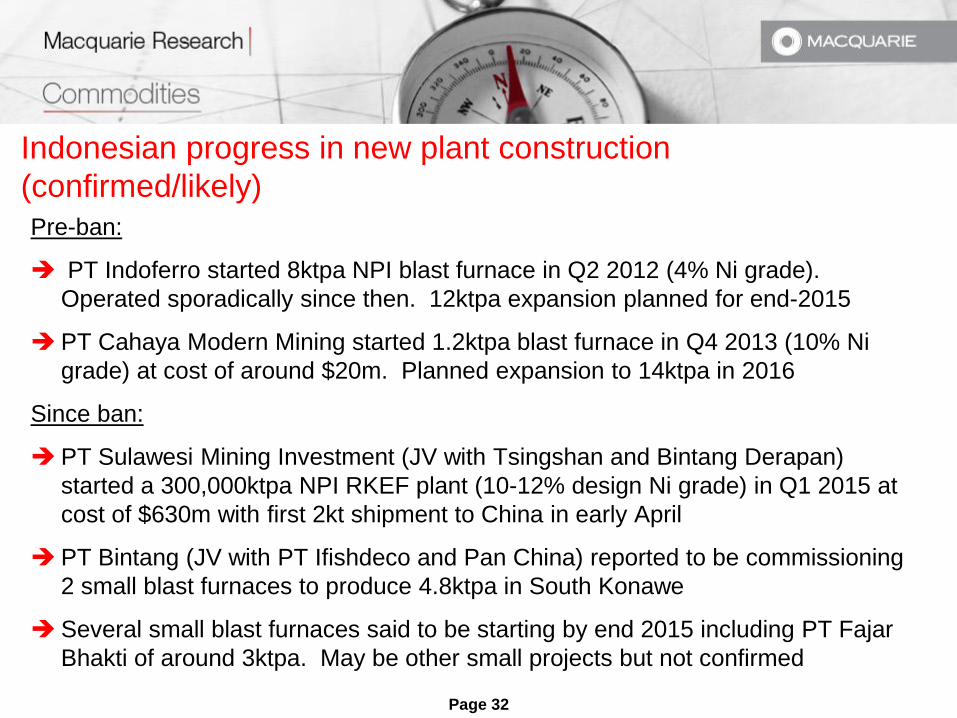
Indonesian progress in new plant construction
(confirmed/likely)
Pre-ban:
PT Indoferro started 8ktpa NPI blast furnace in Q2 2012 (4% Ni grade).
Operated sporadically since then. 12ktpa expansion planned for end-2015
PT Cahaya Modern Mining started 1.2ktpa blast furnace in Q4 2013 (10% Ni
grade) at cost of around $20m. Planned expansion to 14ktpa in 2016
Since ban:
PT Sulawesi Mining Investment (JV with Tsingshan and Bintang Derapan)
started a 300,000ktpa NPI RKEF plant (10-12% design Ni grade) in Q1 2015 at
cost of $630m with first 2kt shipment to China in early April
PT Bintang (JV with PT Ifishdeco and Pan China) reported to be commissioning
2 small blast furnaces to produce 4.8ktpa in South Konawe
Several small blast furnaces said to be starting by end 2015 including PT Fajar
Bhakti of around 3ktpa. May be other small projects but not confirmed

Page 33
Beyond the confirmed there are a multitude of projects...over
250ktpa identified from press/interviews
Source: Jakarta Post, CM Group, Chinese press, interviews with industry, Macquarie Research, May 2015
0
50
100
150
200
250
300
2014F 2015F 2016F 2017F 2018F 2019F
'00
0t
Ni
Projects Indonesian NPI production to 2020
Shenwu-Titan Phase III
Shenwu-Titan Phase II
Delong Ni Industry Zone
Ningxia Hengshun
Brillimetal Phase I1
Indoferro Phase II
Wenzhou Huadi Industry Phase I
PT Multi Baja Industri (Group: RKA)
Hanking Phase I
Hanking Phase I
PT Cahaya Modern Metal Mining Phase 2
PT Central Omega Resources YUSCO
Weiye Toprich Hong Kong
PT. Sambas Mineral Mining
China’s Meng La Chen Feng Mining Development Company Ltd
Zhejiang Baoli mining
Shenwu-Titan Phase I
Shaanxi Energy Metals&minerals Resources
Brillimetal Phase I
Wenzhou Huadi Industry Phase I
Ifshideco
Lianyungang Blackstone International
Zhenshi Holding group
Integra Mining Nusantara
Kembar Emas Sultra
Tsingshan/Sulawesi Mining Phase II
Tsingshan/Sulawesi Mining Phase I
PT Indoferro phase 1
PT Cahaya Modern Metal Mining
0
50
100
150
200
250
300
2014F 2015F 2016F 2017F 2018F 2019F 2020F
'00
0t
Ni i
n N
PI
Indonesian NPI potential projects to 2020
Existing Under construction/likely Possible

Page 34
What is likely?
PT Sulawesi Mining Investment (Tsingshan/Bintang Derapan)
construction of a further 600,000 tpa RKEF NPI plant to be completed by
end 2016 (around 60ktpa Ni) at a capex of $1.02bn
Tsingshan has confirmed plans to build integrated 2mtpa stainless steel
slab plant to come on stream in two phases by mid-2016 and mid-2017
which presumably will absorb all its NPI production by hot metal transfer
We can identify around 150ktpa of committed and likely capacity
(commercial confidentiality precludes more detail!)
Beyond that there are another 130-150ktpa of potential projects but
many announced last year are already “dead”.
Page 35
Issues surrounding projects
Many of the announced projects were based on an assumption that the
Indonesian government would relax the ban for companies with projects
under construction
Major issues regarding building of infrastructure, in particular power
plants – many projects are reliant on third party funding of industrial
estates that would provide shared power and other infrastructure - so far
only PTSMI (Tsingshan) and Well Harvest (for alumina) are under
construction out of 13 possible projects
Many of the projects have yet to secure land/ore access or operating
permits
Many companies are facing losses on iron ore or NPI operations in
China and are financially constrained in a low iron ore/nickel price
environment

Page 36
The economics of NPI are phenomenal compared to
conventional processes at current ore prices
100000
60000
80000
5000
15000 15000
25000
40000
12000 12000 11000
1850015000
21000
1100013500
29500
2250025000
19375 17625
23625
1537520500
0
20000
40000
60000
80000
100000
120000
HPAL (integrated) HPAL (intermediate) FeNi (recent) Old NPI China RKEF (1.8% Ni ore)
China RKEF (1.5% Ni ore)
Indonesian NPI (RKEF)?
Chinese HPAL?
$/t
on
ne
The "economics" of new capacity - based on today's parameters
Capex Opex Incentive price
Source: Company data, Wood Mackenzie, Macquarie Research, April 2015
Page 37
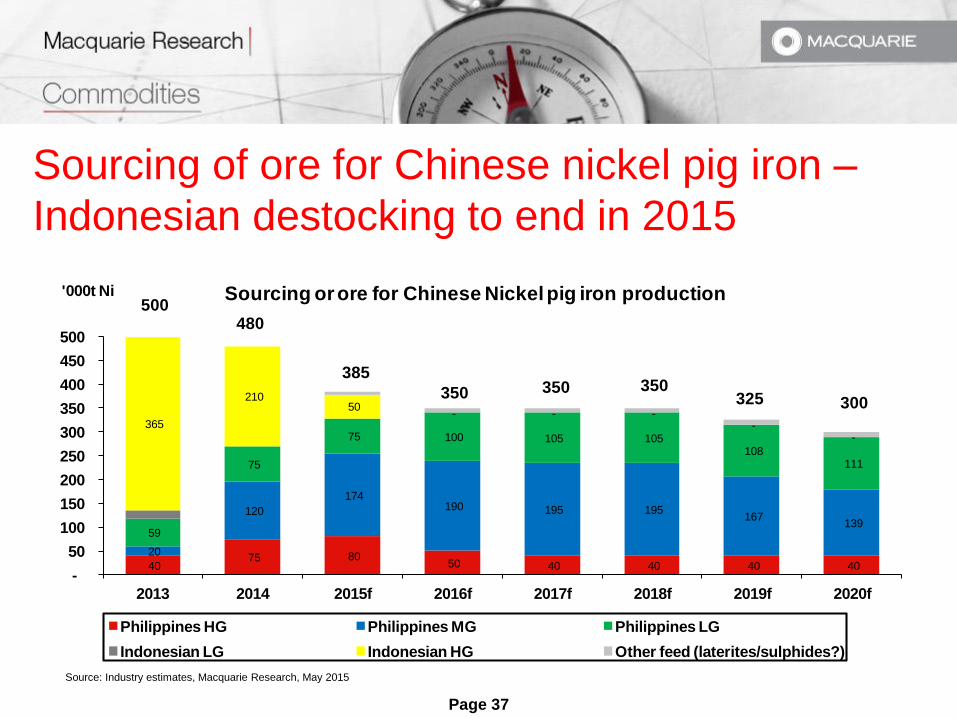
Sourcing of ore for Chinese nickel pig iron –
Indonesian destocking to end in 2015
Source: Industry estimates, Macquarie Research, May 2015
40 75 80
50 40 40 40 40
20
120
174 190 195 195
167 139
59
75
75 100 105 105 108
111
365
210 50
- - --
-
500 480
385
350 350 350 325 300
-
50
100
150
200
250
300
350
400
450
500
2013 2014 2015f 2016f 2017f 2018f 2019f 2020f
'000t Ni Sourcing or ore for Chinese Nickel pig iron production
Philippines HG Philippines MG Philippines LG
Indonesian LG Indonesian HG Other feed (laterites/sulphides?)

Page 38
We think that Chinese nickel pig iron will be
more expensive in future
As ore supply gets reduced, price
of ore relative to LME price will
rise further
Once blending opportunities with
higher grade ore are reduced
(Indonesian stocks exhausted and
high-grade reserves in Philippines
depleted) conversion costs for ore
into NPI will also rise
Higher NPI costs will push up
NPI prices relative to LME price
0%
5%
10%
15%
20%
25%
30%
35%
40%
2009 2010 2011 2012 2013 2014 2015
% o
f L
ME
Nickel in ore as a % of LME price for Chinese NPI producers
1.8% Ni ore 1.5% Ni ore
Source: SMM, LME, Macquarie Research, May 2015

Page 39
Will Chinese stainless steel producers lose
competiveness due to changing NPI landscape?
Source: LME, CRU, SMM, Mysteel, Macquarie Research, May 2015
-5000
0
5000
10000
15000
20000
25000
30000
2010 2011 2012 2013 2014 2015
$/t
on
ne
of
ni
What you pay for nickel differs!Monthly averages, Jan 2010-April 2014
LME Ni
25% Ni FeNi (credit for free Fe)
10% NPI (credit for free Fe)
EU ni in scrap (no free Fe)
1.7% NPI (with scrap credit)
Page 40
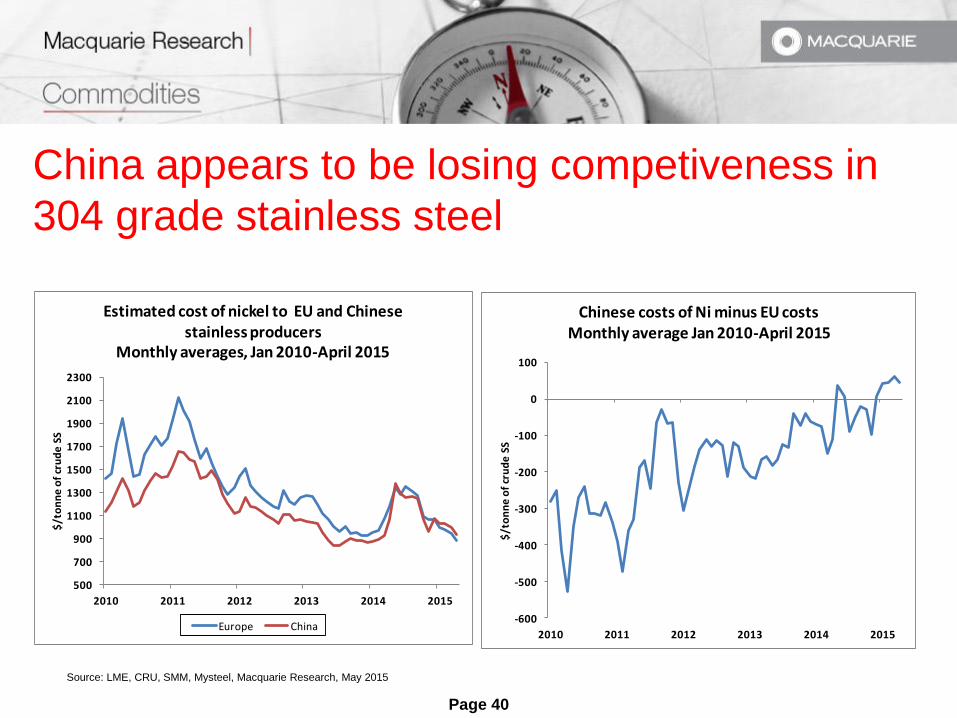
China appears to be losing competiveness in
304 grade stainless steel
-600
-500
-400
-300
-200
-100
0
100
2010 2011 2012 2013 2014 2015
$/t
on
ne
of
cru
de
SS
Chinese costs of Ni minus EU costsMonthly average Jan 2010-April 2015
500
700
900
1100
1300
1500
1700
1900
2100
2300
2010 2011 2012 2013 2014 2015
$/t
on
ne
of
cru
de
SS
Estimated cost of nickel to EU and Chinese stainless producers
Monthly averages, Jan 2010-April 2015
Europe China
Source: LME, CRU, SMM, Mysteel, Macquarie Research, May 2015

Page 41
Nickel is now a much bigger proportion of Chinese
price, but Chinese price is much lower than in Europe
0%
10%
20%
30%
40%
50%
60%
2010 2011 2012 2013 2014 2015
% o
f 3
04
CR
SS
pri
ce
Cost of nickel and chrome in stainless steel price
China-Ni
EU-Ni
EU - Cr
China - Cr
0
500
1000
1500
2000
2500
3000
3500
4000
4500
5000
2010 2011 2012 2013 2014 2015
$/t
on
ne
Domestic prices for 304 CR stainless sheetMonthly averages, Jan 2010-April 2015
Europe premium Europe China
Source: LME, CRU, SMM, Mysteel, Macquarie Research, May 2015
Higher nickel prices in China will most likely push up Chinese stainless
prices relative to European prices?
Page 42
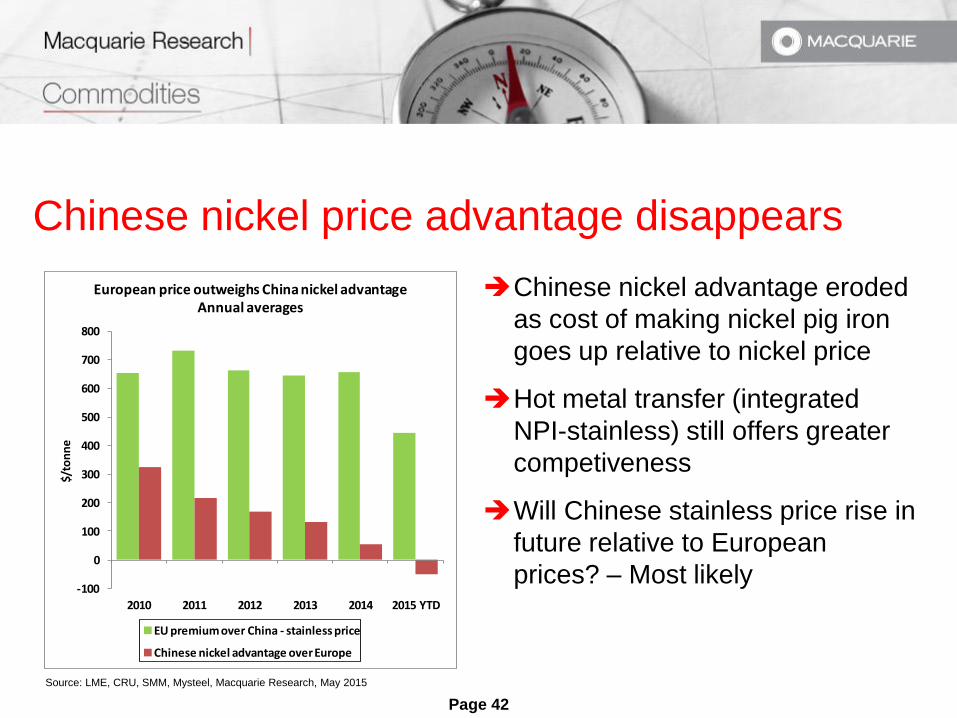
Chinese nickel price advantage disappears
Chinese nickel advantage eroded
as cost of making nickel pig iron
goes up relative to nickel price
Hot metal transfer (integrated
NPI-stainless) still offers greater
competiveness
Will Chinese stainless price rise in
future relative to European
prices? – Most likely-100
0
100
200
300
400
500
600
700
800
2010 2011 2012 2013 2014 2015 YTD
$/to
nn
e
European price outweighs China nickel advantageAnnual averages
EU premium over China - stainless price
Chinese nickel advantage over Europe
Source: LME, CRU, SMM, Mysteel, Macquarie Research, May 2015

Page 43
Our supply/demand balance to 2020
Source: INSG, Macquarie Research, May 2015
`000t 2013 2014 2015f 2016f 2017f 2018f 2019f 2020f
Total SS production 38887 41901 43701 45977 48286 50611 52936 55375
% Change 9.4% 7.8% 4.3% 5.2% 5.0% 4.8% 4.6% 4.6%
300-series SS prod. 21679 23275 24465 25704 26788 28054 29419 30854
% Change 7.7% 7.4% 5.1% 5.1% 4.2% 4.7% 4.9% 4.9%
Use of purchased ni in scrap 659 698 730 771 808 851 900 944
% change 0.9% 5.9% 4.5% 5.6% 4.8% 5.3% 5.7% 4.9%
Primary nickel consumption 1798 1897 1980 2054 2122 2200 2279 2362
% Change 8.0% 5.5% 4.4% 3.7% 3.3% 3.7% 3.6% 3.6%
Nickel Supply 1971 1999 1938 1992 2076 2158 2202 2244
% Change 10.4% 1.4% -3.1% 2.8% 4.2% 3.9% 2.1% 1.9%
(of which NPI) (502) (483) (410) (405) (440) (475) (485) (500)
195
World Market Balance 173 102 -43 -62 -47 -43 -77 -118
Estimated total stocks 650 752 710 647 601 558 481 363
Weeks' world demand 18.4 20.2 18.3 16.1 14.4 12.9 10.8 7.8
LME Cash Price (cents/lb) 681 765 879 1077 1134 1225 1270 1270
LME Cash Price ($/tonne) 15002 16867 15209 20125 22500 24000 25000 28000
Page 44
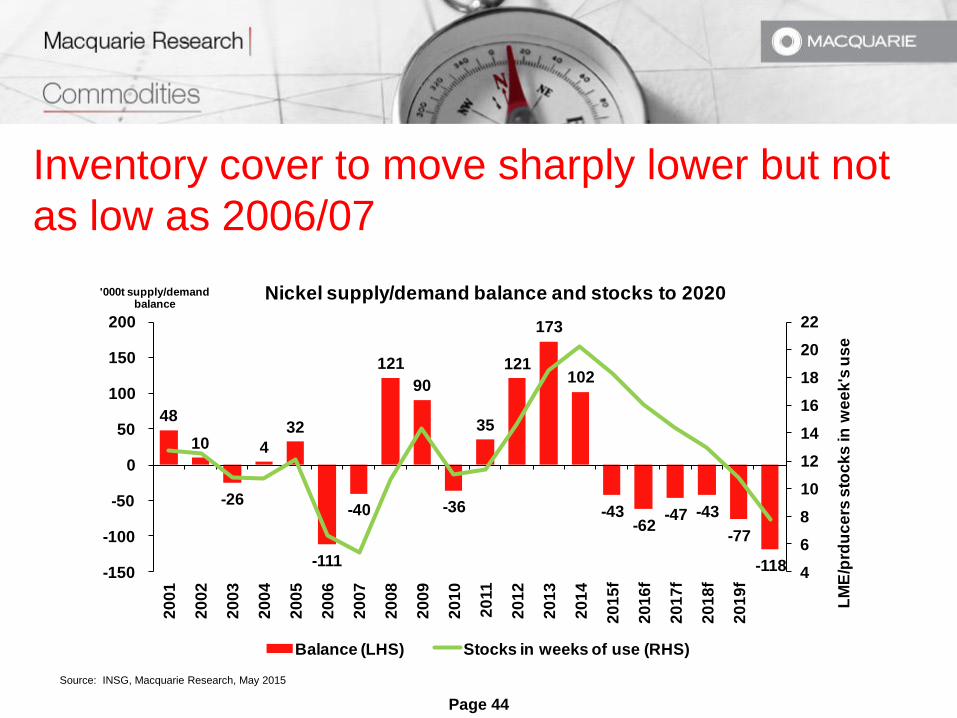
Inventory cover to move sharply lower but not
as low as 2006/07
Source: INSG, Macquarie Research, May 2015
48
10
-26
4
32
-111
-40
121
90
-36
35
121
173
102
-43 -62
-47 -43
-77
-118 4
6
8
10
12
14
16
18
20
22
-150
-100
-50
0
50
100
150
200
20
01
20
02
20
03
20
04
20
05
20
06
20
07
20
08
20
09
20
10
20
11
20
12
20
13
20
14
20
15
f
20
16
f
20
17
f
20
18
f
20
19
f
LM
E/p
rdu
ce
rs s
toc
ks
in
we
ek
's u
se
'000t supply/demand balance
Nickel supply/demand balance and stocks to 2020
Balance (LHS) Stocks in weeks of use (RHS)

Page 45
In conclusion – the medium-term outlook
Deficits should finally arrive from 2015 onwards due to Indonesian ban and prices should move sustainably higher
Out to 2020, a major deficit has been avoided by the Chinese using lower-quality ore from Philippines (at higher cost)
New NPI capacity from Indonesia will not grow fast enough to offset losses from China
China nickel cost advantage in making stainless has been eliminated – this will lead to higher Chinese stainless steel domestic prices
Key to longer run prices is cost of building capacity outside Indonesia – recent experience suggests that if non-Chinese players build it, prices need to be $23-25,000/t to generate a return

Page 46
Important disclosures:
Recommendation definitions
Macquarie - Australia/New Zealand
Outperform – return > 3% in excess of benchmark return
Neutral – return within 3% of benchmark return
Underperform – return > 3% below benchmark return
Benchmark return is determined by long term nominal GDP
growth plus 12 month forward market dividend yield.
Macquarie – Asia/Europe
Outperform – expected return >+10%
Neutral – expected return from -10% to +10%
Underperform – expected <-10%
Macquarie First South - South Africa
Outperform – return > 10% in excess of benchmark return
Neutral – return within 10% of benchmark return
Underperform – return > 10% below benchmark return
Macquarie - Canada
Outperform – return > 5% in excess of benchmark return
Neutral – return within 5% of benchmark return
Underperform – return > 5% below benchmark return
Macquarie - USA
Outperform – return > 5% in excess of benchmark return
Neutral – return within 5% of benchmark return
Underperform – return > 5% below benchmark return
Volatility index definition*This is calculated from the volatility of historic price
movements.
Very high–highest risk – Stock should be expected to
move up or down 60-100% in a year – investors should
be aware this stock is highly speculative.
High – stock should be expected to move up or down
at least 40-60% in a year – investors should be aware
this stock could be speculative.
Medium – stock should be expected to move up or
down at least 30-40% in a year.
Low–medium – stock should be expected to move up
or down at least 25-30% in a year.
Low – stock should be expected to move up or down
at least 15-25% in a year.
* Applicable to Australian/NZ stocks only
Recommendation – 12 months
Note: Quant recommendations may differ from
Fundamental Analyst recommendations
Financial definitions
All "Adjusted" data items have had the following
adjustments made:
Added back: goodwill amortisation, provision for
catastrophe reserves, IFRS derivatives & hedging,
IFRS impairments & IFRS interest expense
Excluded: non recurring items, asset revals, property
revals, appraisal value uplift, preference dividends &
minority interests
EPS = adjusted net profit /efpowa*
ROA = adjusted ebit / average total assets
ROA Banks/Insurance = adjusted net profit /average
total assets
ROE = adjusted net profit / average shareholders funds
Gross cashflow = adjusted net profit + depreciation
*equivalent fully paid ordinary weighted average
number of shares
All Reported numbers for Australian/NZ listed
stocks are modelled under IFRS (International
Financial Reporting Standards).
Recommendation proportions – For quarter ending 31 March 2015
AU/NZ Asia RSA USA CA EUR
Outperform 48.99% 59.51% 49.30% 43.79% 59.59% 52.20% (for US coverage by MCUSA, 7.42% of stocks followed are investment banking clients)
Neutral 34.12% 26.62% 35.21% 50.29% 34.93% 31.32% (for US coverage by MCUSA, 5.68% of stocks followed are investment banking clients)
Underperform 16.89% 13.87% 15.49% 5.93% 5.48% 16.48% (for US coverage by MCUSA, 0.87% of stocks followed are investment banking clients)

Company-Specific Disclosures:
Important disclosure information regarding the subject companies covered in this report is available at www.macquarie.com/disclosures.
Analyst Certification:
The views expressed in this research accurately reflect the personal views of the analyst(s) about the subject securities or issuers and no part of the compensation of the analyst(s) was,
is, or will be directly or indirectly related to the inclusion of specific recommendations or views in this research. The analyst principally responsible for the preparation of this research
receives compensation based on overall revenues of Macquarie Group Ltd ABN 94 122 169 279 (AFSL No. 318062) (MGL) and its related entities (the Macquarie Group) and has taken
reasonable care to achieve and maintain independence and objectivity in making any recommendations.
General Disclaimers:
Macquarie Securities (Australia) Ltd; Macquarie Capital (Europe) Ltd; Macquarie Capital Markets Canada Ltd; Macquarie Capital Markets North America Ltd; Macquarie Capital (USA) Inc;
Macquarie Capital Securities Ltd and its Taiwan branch; Macquarie Capital Securities (Singapore) Pte Ltd; Macquarie Securities (NZ) Ltd; and Macquarie First South Securities (Pty)
Limited; Macquarie Capital Securities (India) Pvt Ltd; Macquarie Capital Securities (Malaysia) Sdn Bhd; Macquarie Securities Korea Limited and Macquarie Securities (Thailand) Ltd are
not authorized deposit-taking institutions for the purposes of the Banking Act 1959 (Commonwealth of Australia), and their obligations do not represent deposits or other liabilities of
Macquarie Bank Limited ABN 46 008 583 542 (MBL) or MGL. MBL does not guarantee or otherwise provide assurance in respect of the obligations of any of the above mentioned
entities. MGL provides a guarantee to the Monetary Authority of Singapore in respect of the obligations and liabilities of Macquarie Capital Securities (Singapore) Pte Ltd for up to SGD 35
million. This research has been prepared for the general use of the wholesale clients of the Macquarie Group and must not be copied, either in whole or in part, or distributed to any other
person. If you are not the intended recipient you must not use or disclose the information in this research in any way. If you received it in error, please tell us immediately by return e-mail
and delete the document. We do not guarantee the integrity of any e-mails or attached files and are not responsible for any changes made to them by any other person. MGL has
established and implemented a conflicts policy at group level (which may be revised and updated from time to time) (the "Conflicts Policy") pursuant to regulatory requirements (including
the FCA Rules) which sets out how we must seek to identify and manage all material conflicts of interest. Nothing in this research shall be construed as a solicitation to buy or sell any
security or product, or to engage in or refrain from engaging in any transaction. In preparing this research, we did not take into account your investment objectives, financial situation or
particular needs. Before making an investment decision on the basis of this research, you need to consider, with or without the assistance of an adviser, whether the advice is appropriate
in light of your particular investment needs, objectives and financial circumstances. There are risks involved in securities trading. The price of securities can and does fluctuate, and an
individual security may even become valueless. International investors are reminded of the additional risks inherent in international investments, such as currency fluctuations and
international stock market or economic conditions, which may adversely affect the value of the investment. This research is based on information obtained from sources believed to be
reliable but we do not make any representation or warranty that it is accurate, complete or up to date. We accept no obligation to correct or update the information or opinions in it.
Opinions expressed are subject to change without notice. No member of the Macquarie Group accepts any liability whatsoever for any direct, indirect, consequential or other loss arising
from any use of this research and/or further communication in relation to this research. Clients should contact analysts at, and execute transactions through, a Macquarie Group entity in
their home jurisdiction unless governing law permits otherwise.
Disclaimer: The information contained in this e-mail is confidential and has been furnished to you solely for your use. You may not disclose, reproduce or distribute the information in any
way. Macquarie does not guarantee the integrity of this e-mail or attached files.
Macquarie Capital (USA) Inc. affiliate research reports and affiliate employees are not subject to the disclosure requirements of FINRA rules. Any persons receiving this report directly from
Macquarie Capital (USA) Inc. and wishing to effect a transaction in any security described herein should do so with Macquarie Capital (USA) Inc. In Germany, this research is issued
and/or distributed by Macquarie Capital (Europe) Limited, Niederlassung Deutschland, which is authorised and regulated by the UK Financial Conduct Authority and in Germany by BaFin.
Macquarie salespeople, traders and other professionals may provide oral or written market commentary or trading strategies to our clients that reflect opinions which are contrary to the
opinions expressed in this research. Macquarie Research produces a variety of research products including, but not limited to, fundamental analysis, macro-economic analysis,
quantitative analysis, and trade ideas. Recommendations contained in one type of research product may differ from recommendations contained in other types of research, whether as a
result of differing time horizons, methodologies, or otherwise.
Page 47
Country-Specific Disclaimers:
Australia: In Australia, research is issued and distributed by Macquarie Securities (Australia) Ltd (AFSL No. 238947), a participating organisation of the Australian Securities Exchange.
New Zealand: In New Zealand, research is issued and distributed by Macquarie Securities (NZ) Ltd, a NZX Firm. Canada: In Canada, research is prepared, approved and distributed by
Macquarie Capital Markets Canada Ltd, a participating organisation of the Toronto Stock Exchange, TSX Venture Exchange & Montréal Exchange. Macquarie Capital Markets North
America Ltd., which is a registered broker-dealer and member of FINRA, accepts responsibility for the contents of reports issued by Macquarie Capital Markets Canada Ltd in the United
States and sent to US persons. Any US person wishing to effect transactions in the securities described in the reports issued by Macquarie Capital Markets Canada Ltd should do so with
Macquarie Capital Markets North America Ltd. The Research Distribution Policy of Macquarie.Capital Markets Canada Ltd is to allow all clients that are entitled to have equal access to our
research. United Kingdom: In the United Kingdom, research is issued and distributed by Macquarie Capital (Europe) Ltd, which is authorised and regulated by the Financial Conduct
Authority (No. 193905). Germany: In Germany, research is issued and distributed by Macquarie Capital (Europe) Ltd, Niederlassung Deutschland, which is authorised and regulated in
the United Kingdom by the Financial Conduct Authority (No. 193905). France: In France, research is issued and distributed by Macquarie Capital (Europe) Ltd, which is authorised and
regulated in the United Kingdom by the Financial Conduct Authority (No. 193905). Hong Kong & Mainland China: In Hong Kong, research is issued and distributed by Macquarie Capital
Securities Ltd, which is licensed and regulated by the Securities and Futures Commission. In Mainland China, Macquarie Securities (Australia) Limited Shanghai Representative Office
only engages in non-business operational activities excluding issuing and distributing research. Only non-A share research is distributed into Mainland China by Macquarie Capital
Securities Ltd. Japan: In Japan, research is Issued and distributed by Macquarie Capital Securities (Japan) Limited, a member of the Tokyo Stock Exchange, Inc., Osaka Securities
Exchange Co. Ltd. (Financial Instruments Firm, Kanto Financial Bureau (kin-sho) No. 231, a member of Japan Securities Dealers Association and The Financial Futures Association of
Japan and Japan Investment Advisers Association). India: In India, research is issued and distributed by Macquarie Capital Securities (India) Pvt. Ltd. (CIN: U65920MH1995PTC090696),
formerly known as Macquarie Capital (India) Pvt. Ltd., 92, Level 9, 2 North Avenue, Maker Maxity, Bandra Kurla Complex, Bandra (East), Mumbai – 400 051, India, which is a SEBI
registered stockbroker having membership with National Stock Exchange of India Limited (INB231246738), BSE Limited (INB011246734) and has applied to SEBI for a certificate under
the SEBI (Research Analysts) Regulations, 2014. Malaysia: In Malaysia, research is issued and distributed by Macquarie Capital Securities (Malaysia) Sdn. Bhd. (Company registration
number: 463469-W) which is a Participating Organisation of Bursa Malaysia Berhad and a holder of Capital Markets Services License issued by the Securities Commission. Taiwan: In
Taiwan, research is issued and distributed by Macquarie Capital Securities Ltd, Taiwan Branch, which is licensed and regulated by the Financial Supervisory Commission. No portion of
the report may be reproduced or quoted by the press or any other person without authorisation from Macquarie. Nothing in this research shall be construed as a solicitation to buy or sell
any security or product. Research Associate(s) in this report who are registered as Clerks only assist in the preparation of research and are not engaged in writing the research. Thailand:
In Thailand, research is produced, issued and distributed by Macquarie Securities (Thailand) Ltd. Macquarie Securities (Thailand) Ltd. is a licensed securities company that is authorized
by the Ministry of Finance, regulated by the Securities and Exchange Commission of Thailand and is an exchange member of the Stock Exchange of Thailand. The Thai Institute of
Directors Association has disclosed the Corporate Governance Report of Thai Listed Companies made pursuant to the policy of the Securities and Exchange Commission of Thailand.
Macquarie Securities (Thailand) Ltd does not endorse the result of the Corporate Governance Report of Thai Listed Companies but this Report can be accessed at: http://www.thai-
iod.com/en/publications.asp?type=4. South Korea: In South Korea, unless otherwise stated, research is prepared, issued and distributed by Macquarie Securities Korea Limited , which is
regulated by the Financial Supervisory Services. Information on analysts in MSKL is disclosed at
http://dis.kofia.or.kr/websquare/index.jsp?w2xPath=/wq/fundMgr/DISFundMgrAnalystStut.xml&divisionId=MDIS03002001000000&serviceId=SDIS03002001000. South Africa: In South
Africa, research is issued and distributed by Macquarie First South Securities (Pty) Limited, a member of the JSE Limited. Singapore: In Singapore, research is issued and distributed by
Macquarie Capital Securities (Singapore) Pte Ltd (Company Registration Number: 198702912C), a Capital Markets Services license holder under the Securities and Futures Act to deal in
securities and provide custodial services in Singapore. Pursuant to the Financial Advisers (Amendment) Regulations 2005, Macquarie Capital Securities (Singapore) Pte Ltd is exempt
from complying with sections 25, 27 and 36 of the Financial Advisers Act. All Singapore-based recipients of research produced by Macquarie Capital (Europe) Limited, Macquarie Capital
Markets Canada Ltd, Macquarie First South Securities (Pty) Limited and Macquarie Capital (USA) Inc. represent and warrant that they are institutional investors as defined in the
Securities and Futures Act. United States: In the United States, research is issued and distributed by Macquarie Capital (USA) Inc., which is a registered broker-dealer and member of
FINRA. Macquarie Capital (USA) Inc, accepts responsibility for the content of each research report prepared by one of its non-US affiliates when the research report is distributed in the
United States by Macquarie Capital (USA) Inc. Macquarie Capital (USA) Inc.’s affiliate’s analysts are not registered as research analysts with FINRA, may not be associated persons of
Macquarie Capital (USA) Inc., and therefore may not be subject to FINRA rule restrictions on communications with a subject company, public appearances, and trading securities held by a
research analyst account. Information regarding futures is provided for reference purposes only and is not a solicitation for purchases or sales of futures. Any persons receiving this report
directly from Macquarie Capital (USA) Inc. and wishing to effect a transaction in any security described herein should do so with Macquarie Capital (USA) Inc. Important disclosure
information regarding the subject companies covered in this report is available at www.macquarie.com/disclosures, or contact your registered representative at 1-888-MAC-STOCK, or
write to the Supervisory Analysts, Research Department, Macquarie Securities, 125 W.55th Street, New York, NY 10019.
© Macquarie Group
Page 48