global outlook and development trends for copper - … outlook - pmc...global outlook and...
TRANSCRIPT

© 2012 CRU International Limited confidential1
Global Outlook andDevelopment Trends for Copper
Richard Schodde
Philippines Mining Conference, Manila20 September 2012
31 Mount Pleasant, London
WC1X 0AD UK
Tel +44 20 7903 2000
www.crugroup.com

© 2012 CRU International Limited confidential2
• Will the average copper price in 2012 be higher thanthat in 2011?
• In terms of price, is copper one of the favourednon-ferrous commodities for 2012 and beyond?
• Is the market still considered attractive for new copperprojects?
Key messages in a nutshell …
NoNo
YesYes
YesYes

© 2012 CRU International Limited confidential3
• Copper prices have slid from 2011 highs but remain well above thecost of production
• Supply remains tight, and recent decisions by mining companiesto sell or delay mining projects will keep supply tight further out
• However, the global economic picture is not rosy. Questions arebeing asked about China, in particular.
• Global consumption has seen lower than expected growth thisyear.
Copper has its strong points but it is affectedby the uncertain macro-economic situation

© 2012 CRU International Limited confidential4
Global economic news has been pretty gloomy

© 2012 CRU International Limited confidential5
Previous recessions typically lasted 36-48 months ...
Index of OECD Industrial Production
Data: OECD
80
84
88
92
96
100
104
-6 -4 -2 0 2 4 6 8 10 12 14 16 18 20 22 24 26 28 30 32 34 36 38 40 42 44 46 48 50
Current
Mid-1970s
Early 1980s
Early 2000s
Early 1990s
months after cyclical peak

© 2012 CRU International Limited confidential6
This time around, recovery from the 2008 GFC has stalled
Index of OECD Industrial Production
Data: OECD
80
84
88
92
96
100
104
-6 -4 -2 0 2 4 6 8 10 12 14 16 18 20 22 24 26 28 30 32 34 36 38 40 42 44 46 48 50
Current
Mid-1970s
Early 1980s
Early 2000s
Early 1990s
months after cyclical peak
Have another coupleof years to go ??
Have another coupleof years to go ??

© 2012 CRU International Limited confidential7
Of concern that China’s growth is decelerating..
1716
13
6
10 9
12
18
1516
141315
14 1413
12
10
0
5
10
15
20
25
Q108
Q3 Q109
Q3 Q110
Q3 Q111
Q3 Q112
Industrial Productiony-o-y % change
%
111010
7
16
1819
21
15131313
111010 98 8
0
5
10
15
20
25
Q108
Q3 Q109
Q3 Q110
Q3 Q111
Q3 Q112
Constructiony-o-y % change
%

© 2012 CRU International Limited confidential8
...and this slowdown is impacting copper consumption –leading CRU to revise down its estimates for the latestquarter
Current view = <2.0MtCu in Q2 2012
Jan 2012estimate was~130Kt higher
Refined Copper Consumption in China (Mt Cu)
© 2012 CRU International Limited confidential9
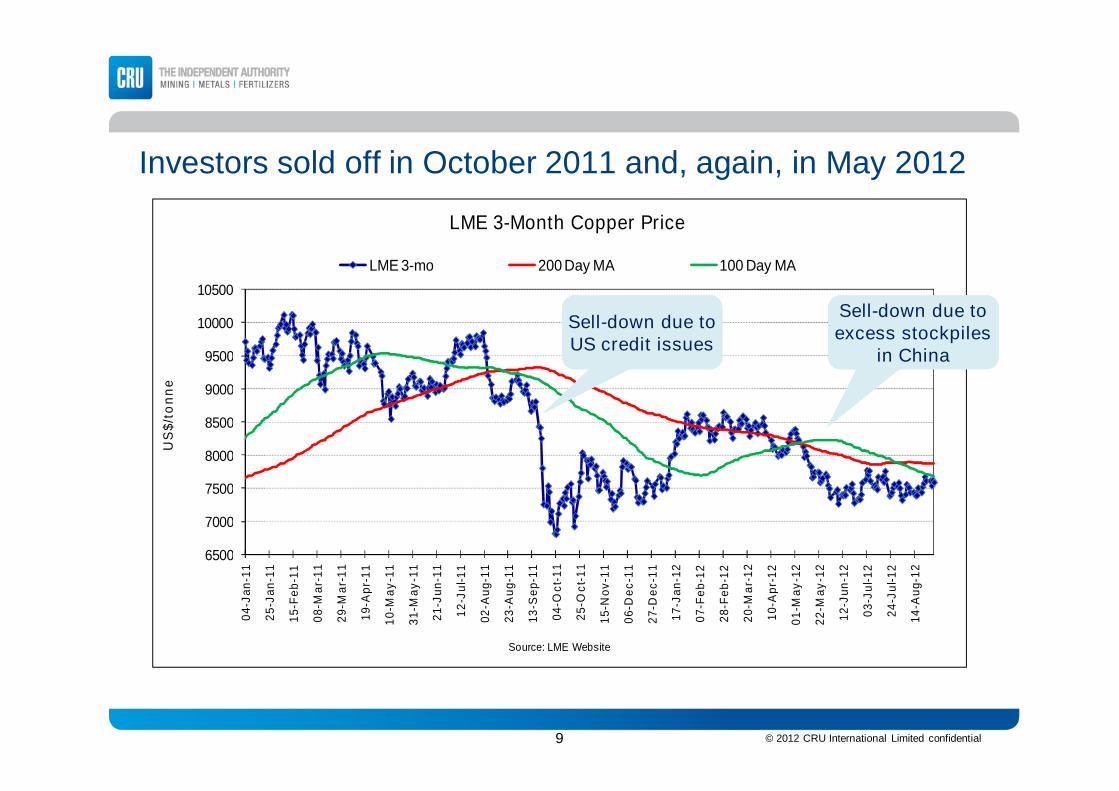
6500
7000
7500
8000
8500
9000
9500
10000
10500
04
-Ja
n-1
1
25
-Ja
n-1
1
15
-Fe
b-1
1
08
-Ma
r-1
1
29
-Ma
r-1
1
19
-Ap
r-1
1
10
-Ma
y-1
1
31
-Ma
y-1
1
21
-Ju
n-1
1
12
-Ju
l-1
1
02
-Au
g-1
1
23
-Au
g-1
1
13
-Se
p-1
1
04
-Oc
t-1
1
25
-Oc
t-1
1
15
-No
v-1
1
06
-De
c-1
1
27
-De
c-1
1
17
-Ja
n-1
2
07
-Fe
b-1
2
28
-Fe
b-1
2
20
-Ma
r-1
2
10
-Ap
r-1
2
01
-Ma
y-1
2
22
-Ma
y-1
2
12
-Ju
n-1
2
03
-Ju
l-1
2
24
-Ju
l-1
2
14
-Au
g-1
2
US
$/t
on
ne
Source: LME Website
LME 3-Month Copper Price
LME 3-mo 200 Day MA 100 Day MA
Investors sold off in October 2011 and, again, in May 2012
Sell-down due toUS credit issuesSell-down due toUS credit issues
Sell-down due toexcess stockpiles
in China
Sell-down due toexcess stockpiles
in China

© 2012 CRU International Limited confidential10
-2,000
0
2,000
4,000
6,000
8,000
10,000
12,000PriceUS$/t
Investment Factors $4,305Copper Fundamentals $5,325/t
Source: CRU Copper Price Perspective, March 2011.
SupplyDemandInventory
Shortterm
Investors
HedgeFunds
IndexFunds
TotalPrice
ChinaBalance
EnergyCurrency
Copper prices are set by cost inputs and investment demand
MARCH 2011
$9630
PhysicalETFs
$4.36 / lb

© 2012 CRU International Limited confidential11
-2,000
0
2,000
4,000
6,000
8,000
10,000
12,000 Investment Factors $1,525/tCopper Fundamentals $5,970/t
Source: CRU
PhysicalETFs
Low-growth China and the strong US dollar have causedinvestors to exit copper, and commodities in general
PriceUS$/t
$7495
AUGUST 2012
SupplyDemandInventory
Shortterm
Investors
HedgeFunds
IndexFunds
TotalPrice
ChinaBalance
EnergyCurrency
RisingCostsRisingCosts
Subdued interestby investors
Subdued interestby investors
$3.40 / lb

© 2012 CRU International Limited confidential12
As of last month, total investor influence in copper was atits lowest point since October 2009
-2000
-1000
0
1000
2000
3000
4000
5000
Jan-0
6
Apr-
06
Jul-06
Oct-
06
Jan-0
7
Apr-
07
Jul-07
Oct-
07
Jan-0
8
Apr-
08
Jul-08
Oct-
08
Jan-0
9
Apr-
09
Jul-09
Oct-
09
Jan-1
0
Apr-
10
Jul-10
Oct-
10
Jan-1
1
Apr-
11
Jul-11
Oct-
11
Jan-1
2
Apr-
12
Jul-12
$/t
on
ne
Investor Influence on the LME Copper Price
Long-term Investors Index Fund Investors
Short-term Speculators Physical ETFs
Investor Influence

© 2012 CRU International Limited confidential13
• Will the average copper price in 2012 be higher thanthat in 2011?
• In terms of price, is copper one of the favourednon-ferrous commodities for 2012 and beyond?
• Is the market still considered attractive for new copperprojects?
Key messages in a nutshell …
NoNo
YesYes
YesYes

© 2012 CRU International Limited confidential14
0%
0%
-1%
-6%
-10%
-10%
-12% -10% -8% -6% -4% -2% 0% 2%
Copper
Aluminium
Nickel
Lead
Tin
Zinc
Copper avoids slump seen in most other LME metals in H1
LME 3-month contracts, % change between 30th Dec 2011 and 29th Jun 2012
Data: LME
Copper traded sideways while mostother metals slid in first half of this yearCopper

© 2012 CRU International Limited confidential15
Regular CRU product coverage
Bespoke CRU product coverage
CRU covers other metals too!
Some of these are important for copper (as competitors and as co-products)

© 2012 CRU International Limited confidential16
Vanadium, Palladium, Tin,Aluminium,
Met Coke, Silver, Alumina, Uranium,
Copper, Platinum, Iron Ore, Gold,
Zinc, Lead, Manganese,
Phosphate DAP, Coking Coal,
Potash, Nickel, Cobalt
Urea, Ammonia, Sulphuric Acid,Sulphur,
CRU sees copper as “mild” in H2 2012 and “warm” in 2013
Hot> 15%
Warm5% to 15%
Cold-5% to 15%
Freezing< -15%
Mild0% to 5%
Cool0% to -5%
*2012 & 2013 annual average price forecast (nominal $or benchmark) versus 2012 Q2 average actual prices
CRU Commodity Heat for the next 18 months
Palladium, Manganese , Platinum,Silver
Uranium, Gold, Zinc, Aluminium, Met
Coke, Tin, Lead, Iron Ore, Copper,Sulphuric Acid,
Alumina, Phosphate DAP, Cobalt,Vanadium, Sulphur, Potash,
Coking Coal, Ammonia, Nickel, Urea
H2 2012 2013
Metals importantto the PhilippinesMetals importantto the Philippines

© 2012 CRU International Limited confidential17
• Will the average copper price in 2012 be higher thanthat in 2011?
• In terms of price, is copper one of the favourednon-ferrous commodities for 2012 and beyond?
• Is the market still considered attractive for new copperprojects?
Key messages in a nutshell …
NoNo
YesYes
YesYes
© 2012 CRU International Limited confidential18
8
10
12
14
16
18
20
22
24
1997 1999 2001 2003 2005 2007 2009 2011 2013 2015 2017 2019 2021
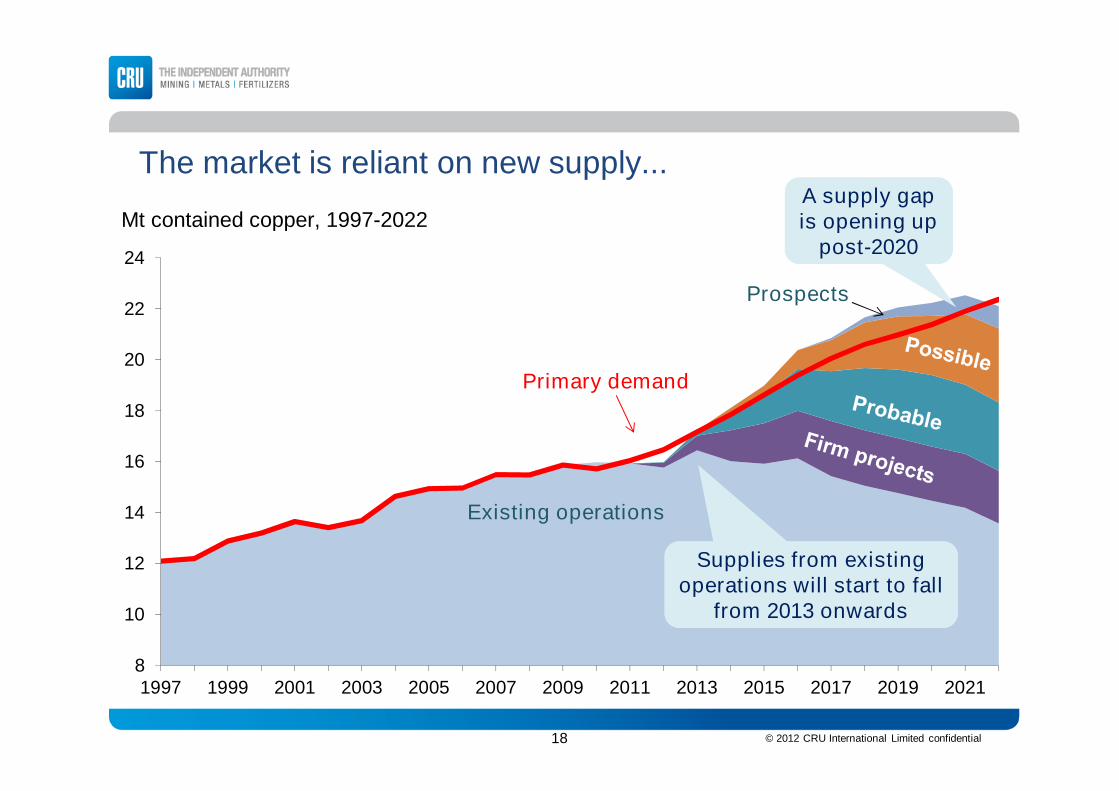
The market is reliant on new supply...
Mt contained copper, 1997-2022
Primary demand
A supply gapis opening up
post-2020
A supply gapis opening up
post-2020
Supplies from existingoperations will start to fall
from 2013 onwards
Supplies from existingoperations will start to fall
from 2013 onwards
Existing operations
Prospects

© 2012 CRU International Limited confidential19
%Cu
0.60
0.65
0.70
0.75
0.80
0.85
1997 2001 2005 2009
..but the copper industry, particularly the mining sector, hasstruggled to meet demand increases for the last decade

© 2012 CRU International Limited confidential20
Governments worldwide look to increase revenue from copperRecent changes and developments in government policy in copper mining countries
Poland: Largeroyalties increase in
March 2012
Poland: Largeroyalties increase in
March 2012
Chile: Royalties increasedin 2010; legal framework
drafted around ILO-169 inJune 2012
Chile: Royalties increasedin 2010; legal framework
drafted around ILO-169 inJune 2012
Australia: Higher Cu taxesmooted but left out of final
draft of new mining tax
Australia: Higher Cu taxesmooted but left out of final
draft of new mining tax
Zambia: Royalties doubled to 6% for 2012budget, April announcement that raw
material exports to be banned; intensepublic debate over raising mineral taxes
Zambia: Royalties doubled to 6% for 2012budget, April announcement that raw
material exports to be banned; intensepublic debate over raising mineral taxes
Peru: Royaltiesincreased in 2011Peru: Royalties
increased in 2011
Indonesia: New 20% mineral exporttax, May 2012. FCX, Newmontexempt for now, but required to
submit plans for domesticprocessing in future.
Indonesia: New 20% mineral exporttax, May 2012. FCX, Newmontexempt for now, but required to
submit plans for domesticprocessing in future.
Philippines: Mining law reviewcomplete June 2012, government
intends to increase royaltiesbefore moratorium is lifted. OPmining ban in South Cotabato.
Philippines: Mining law reviewcomplete June 2012, government
intends to increase royaltiesbefore moratorium is lifted. OPmining ban in South Cotabato.
DRC: Mining code underreview, increased taxes
planned
DRC: Mining code underreview, increased taxes
planned

© 2012 CRU International Limited confidential21
0.60
0.70
0.80
0.90
1997 1999 2001 2003 2005 2007 2009 2011
Ore grades have declined quite rapidly,constraining production
(% Cu), 1997-2011, world annual average
0.81%
0.65%

© 2012 CRU International Limited confidential22
0.0%
0.5%
1.0%
1.5%
0 100 200 300 400 500Current Resource (Mt of Cu metal)
Data: MinEx Consulting
Refers to projects at the Exploration and Feasibility Study Stages containing >500kt Cu
The average grade for the next generation of mineswill be even lower
Size and Cu grade of undeveloped open pit copper projects in the World
Weighted averagegrade is 0.45% CuWeighted averagegrade is 0.45% Cu

© 2012 CRU International Limited confidential23
750
1,250
1,750
2,250
2,750
3,250
3,750
4,250
Aitik Batu Hijau Buenavista(Concs)
Collahuasi(Concs)
Cerro Verde(Concs)
Mount Isa
-20% -10% Current +10% +20%
Lower ore grades also lead to higher operating costsEstimated change in net of by-product cash costs in 2011 when ore grades are adjustedup and down, for randomly selected mines, US$/t contained copper
US$/t
The overall impactvaries by project
due to by-product creditsand processing costs
The overall impactvaries by project
due to by-product creditsand processing costs

© 2012 CRU International Limited confidential24
Location of major copper deposits
Data: MinEx Consulting
There is a wide distribution ofcopper deposits around the world
There is a wide distribution ofcopper deposits around the world
On a per km2
basis thePhilippines iswell-endowed
On a per km2
basis thePhilippines iswell-endowed
By-ProductCopper
PrimaryCopper
50100
200
101
Mt Cu

© 2012 CRU International Limited confidential25
By-ProductCopper
PrimaryCopper
50100
200
101
Mt Cu
Data: MinEx Consulting
Location of major undeveloped copper deposits
There are 560 deposits containing 880 Mt Cupotentially available for development
There are 560 deposits containing 880 Mt Cupotentially available for development
Tampakan
Pebble
Reko Diq
Udokan
Resolution
Cobre Panama
Los SulfatosLa Granja
El Pachon
Frieda River
Top 10 undeveloped depositscontain 200 Mt Cu
Top 10 undeveloped depositscontain 200 Mt Cu

© 2012 CRU International Limited confidential26
Not all copper projects get developed as mines
0%
20%
40%
60%
80%
100%
19
50
-54
19
55
-59
19
60
-64
19
65
-69
19
70
-74
19
75
-79
19
80
-84
19
85
-89
19
90
-94
19
95
-99
20
00
-04
20
05
-09
20
10
+
Stalled
Advanced Exploration
Feasibility - New Project
Development Construction
Operating Mine
Care & Maintenance
Closed Mine
Analysis based on 384 copper deposits >0.5 Mt Cu found in the World 1950-2011
Discovery Year
~60% of copper discoverieseventually get developed.Caution: Rate varies withsize, grade and location
~60% of copper discoverieseventually get developed.Caution: Rate varies withsize, grade and location
Data: MinEx Consulting
Current status of copper deposits by discovery year

© 2012 CRU International Limited confidential27
For those projects that do get developed there is, on average,a 15 year delay between discovery and production
Discovery Year
Start-up Year 0 Years delay10 Years20 Years
11 Years
Discoveries in LowRisk Countries arequicker to develop
Discoveries in LowRisk Countries arequicker to develop
Time delay between Discovery & Mine Start-up for copper projects in the Western World
19 Years
18 Years
19 Years
Data: MinEx Consulting
In 1960s mostnew mines
were in LowRisk countries.
Today, most arein High Riskcountries.
In 1960s mostnew mines
were in LowRisk countries.
Today, most arein High Riskcountries.
1950
1960
1970
1980
1990
2000
2010
1950 1960 1970 1980 1990 2000 2010
Low
Moderate
High
Very High

© 2012 CRU International Limited confidential28
2012-18
Chile Peru North America Other S&C America Africa Asia Other
2026-322019-25
Most of the future growth will be in the AmericasLocation of new production* from 170 Tier 1 & 2 projects during each period
Mix of USbrown- andgreenfields
Mix of USbrown- andgreenfields
Total 6 years production = 23.4Mt Total production = 68.4Mt Total production = 99.2Mt
Major Chileanbrownfieldexpansion/extensions
Major Chileanbrownfieldexpansion/extensions
Asiangreenfieldsstart up
Asiangreenfieldsstart up
PeruviangreenfieldsPeruviangreenfieldsBrownfield
expansions inthe Copperbelt
Brownfieldexpansions inthe Copperbelt
*Production after estimated disruption allowance and probable contribution (dictated by project status), projects with 50Kt/y capacity or more contained Cu

© 2012 CRU International Limited confidential29
Miner Project Announcement Reason
BHP BillitonOlympic Dam
expansionDelayed Capex
Xstrata Frieda River Plans to sell stake ?
Newmont Minas Conga Suspended Local opposition
Barrick Cerro Casale Suspended Capex
Nautilus Minerals Solwara-1 Delay risk Government dispute
However, the same factors constraining supply, and thereforesupporting prices, make project development a risky businessCu miners that have announced project delays, delay risks or withdrawal plans in the last year

© 2012 CRU International Limited confidential30
Conclusions …1/3
The average copper price in 2012 will be lower than 2011
• Uncertainty around the banking and sovereign debt crises in Europeare a significant constraint to economic growth everwhere.
• The recent bounce in China’s economy is in jeopardy due to weakexternal demand.
• Prices have been range-bound since May and investor impact hasbeen relatively limited.
– Investor buying in “commodities” requires a weaker US dollar and aglobal economic recovery.
– Copper-specific buying requires that deficit conditions are a nearcertainty for at least one year.

© 2012 CRU International Limited confidential31
Conclusions … 2/3
In the medium-term copper prices will be favourable
• Copper projects continue to be an attractive investment sector becausethe industry struggles to keep up with demand. Despite a near-termwave of new supply coming in from 2013, new deficits are likely to occurin the medium to long term.
• This is caused by lengthy development times and numerous disruptivefactors to mining.

© 2012 CRU International Limited confidential32
Conclusions … 3/3
In the longer term, there is strong demand for new copper projects.As always, the challenge will be how to manage the business risks
• Ore grades are declining, constraining production and raising costs.
• Only 60% of all copper discoveries get developed as mines.
• The time delay between discovery and development is likely to increase(beyond the current 15 years).
• Increasing percentage of projects located in riskier parts of the world.
• “Resource nationalism” is becoming a major risk.
• However, we have to note that the problems that harm a given projectactually help support copper prices for the others !
So … will the Philippines be part of the problem or part of the solution?

© 2012 CRU International Limited confidential33
THANK YOU
Richard SchoddeMelbourne
Tel: +61 418 909 769Email: [email protected]
Philip SewellSydney
Tel: +61 418 290 342Email: [email protected]
LONDON | SEATTLE | PHILADELPHIA | BEIJING | SYDNEY | SANTIAGO | RIO DE JANEIRO| MUMBAI