the mass spectra of giant molecular clouds in the local group
TRANSCRIPT

The Mass Spectra of Giant Molecular Clouds in the Local GroupAuthor(s): E. RosolowskySource: Publications of the Astronomical Society of the Pacific, Vol. 117, No. 838 (December2005), pp. 1403-1410Published by: The University of Chicago Press on behalf of the Astronomical Society of the PacificStable URL: http://www.jstor.org/stable/10.1086/497582 .
Accessed: 26/05/2014 18:19
Your use of the JSTOR archive indicates your acceptance of the Terms & Conditions of Use, available at .http://www.jstor.org/page/info/about/policies/terms.jsp
.JSTOR is a not-for-profit service that helps scholars, researchers, and students discover, use, and build upon a wide range ofcontent in a trusted digital archive. We use information technology and tools to increase productivity and facilitate new formsof scholarship. For more information about JSTOR, please contact [email protected].
.
The University of Chicago Press and Astronomical Society of the Pacific are collaborating with JSTOR todigitize, preserve and extend access to Publications of the Astronomical Society of the Pacific.
http://www.jstor.org
This content downloaded from 194.29.185.236 on Mon, 26 May 2014 18:19:43 PMAll use subject to JSTOR Terms and Conditions

1403
Publications of the Astronomical Society of the Pacific, 117:1403–1410, 2005 December� 2005. The Astronomical Society of the Pacific. All rights reserved. Printed in U.S.A.
The Mass Spectra of Giant Molecular Clouds in the Local Group
E. Rosolowsky
Center for Astrophysics, 60 Garden Street, MS-66, Cambridge, MA 02138; [email protected]
Received 2005 August 2; accepted 2005 August 30; published 2005 November 17
ABSTRACT. We reanalyze the catalogs of molecular clouds in the Local Group to determine the parametersof their mass distributions in a uniform manner. The analysis uses the error-in-variables method of parameterestimation, which accounts not only for the variance of the sample when drawn from a parent distribution, butalso for errors in the mass measurements. Testing the method shows that it recovers the underlying propertiesof cumulative mass distribution without bias while accurately reflecting uncertainties in the parameters. Cloudsin the inner disk of the Milky Way follow a truncated power-law distribution with index andg p �1.5� 0.1maximum mass of . The distributions of cloud mass for the outer Milky Way and M33 show significantly6.510 M,
steeper indices ( and , respectively), with no evidence of a cutoff. Theg p �2.1� 0.2 g p �2.9� 0.4OMW M33
mass distribution of clouds in the Large Magellanic Cloud has a marginally steeper distribution than the innerdisk of the Milky Way ( ) and also shows evidence of a truncation, with a maximum mass ofg p �1.7� 0.2
. The mass distributions of molecular clouds vary dramatically across the Local Group, even after6.510 M,
accounting for the systematic errors that arise in comparing heterogeneous data and catalogs. These differencesshould be accounted for in studies that aim to reproduce the molecular cloud mass distributions, or in studiesthat use the mass spectrum as a parameter in a model.
1. INTRODUCTION
The mass distribution of molecular clouds is one of the pri-mary characteristics of the their population. In the inner diskof the Milky Way, the mass distribution follows a power lawwith , . More recent surveys of moleculargdN ∝ M dM g ∼ �1.5clouds throughout the Local Group find that the mass spectrumalso follows a power law, but the indices are steeper than ininner Milky Way (e.g., Engargiola et al. 2003; Mizuno et al.2001). Indeed, the mass spectrum may be theonly feature ofthe molecular cloud population that varies between systems,since other cloud properties (e.g., cloud radius and line width)obey the relationships established in the Milky Way (Wilson& Scoville 1990; Rosolowsky et al. 2003; Mizuno et al. 2001).Careful attention to accurately determining the parameters ofthe mass spectrum is critical in using the mass spectrum toquantify differences between cloud populations. In addition,the empirically derived mass distribution is an important pa-rameter for theoretical and modeling work. Several studies aimto reproduce the mass distribution of molecular clouds (Kwan1979; Elmegreen & Falgarone 1996; Vazquez-Semadeni et al.1997; Stutzki et al. 1998; Wada et al. 2000) or use the massspectrum as inputs to models (McKee & Williams 1997; Tan2000; Krumholz & McKee 2005). Most of these studies focuson the canonical value of adopted from the innerg ≈ �1.5Milky Way, neglecting any variation in the distribution. Judgingfrom the scope of these other studies, measuring the mass dis-tribution of molecular clouds is essential for understanding both
cloud formation and the importance of star-forming clouds inregulating large-scale star formation.
Since the parameters of the cloud mass distribution arewidely used in the study of the star-forming interstellar me-dium, this paper outlines some of the pitfalls associated withthe standard methods of estimating the parameters of power-law distributions and suggests improvements to minimize in-accuracy (§ 2). With these improvements, we reanalyze datafrom existing catalogs of molecular clouds (§ 3) and note in-teresting results (§ 4). This work stresses the importance ofaccounting for the observational uncertainties and systematiceffects that bedevil the study of molecular clouds. Accuratelyderiving the index of a power-law distribution is also usefulfor studying populations of other objects. In particular, the de-rived mass spectrum of clumps within molecular clouds is sub-ject to systematics that are identical to the mass distributionsstudied in this work. The methods developed in this study, aswell as their attendant cautions, are directly applicable to thestudy of clump mass distributions and their relevance in theformation of individual stars (e.g., Williams et al. 1994; Stutzki& Gusten 1990). Luminosity and mass distributions of starsand galaxies are characterized by nonlinear distributions, andthe techniques presented in this paper readily extend to thestudy of these objects.
2. FITTING MASS SPECTRA
The mass distribution of a population of molecular cloudsis usually expressed in a differential form, namely the number
This content downloaded from 194.29.185.236 on Mon, 26 May 2014 18:19:43 PMAll use subject to JSTOR Terms and Conditions

1404 ROSOLOWSKY
2005 PASP,117:1403–1410
of clouds that would be found in a range of masses. In thelimit of a small mass bin, this is expressed as
dNp f (M). (1)
dM
This expression can be integrated to give the cumulative massdistribution
′M
′N(M 1 M) p f (M) dM p g(M), (2)�Mmax
which gives the number of clouds with masses greater than areference mass as a function of that reference mass. For mo-lecular clouds, both forms of the mass spectrum obey powerlaws: and , with in all knowng g�1f (M) ∝ M g(M) ∝ M g ! �1cases. Some mass distributions lack clouds above some max-imum mass . To account for this feature, we adopt a truncatedM0
power-law distribution as suggested by Williams & McKee(1997), and alter their formalism to our notation. The full formof the cumulative distribution is
g�1M′N(M 1 M) p N � 1 , (3)0 ( )[ ]M0
where is the maximum mass in the distribution and isM N0 0
the number of clouds more massive than , the point1/(g�1)2 M0
where the distribution shows a significant deviation from apower law. If , there is no such deviation. For this formN ∼ 10
of the cumulative mass distribution,
gdN N M0p (g � 1) , M ! M . (4)0( )dM M M0 0
In most studies, only the indexg is reported, since is as-N0
sumed to be 1 and is the maximum-mass cloud in theM0
sample. The index is the most important parameter, since itdescribes how the integrated mass is distributed between thehigh- and low-mass members of the cloud population. For val-ues of , the majority of the mass is contained in theg 1 �2high-mass clouds, and the reverse is true for . Wheng ! �2
, the integrated mass diverges as , implying ag ! �2 M r 0break in the power-law behavior of the mass spectrum at orbelow the completeness limit to ensure a finite integrated mass.Distributions with are also physically interesting, sinceN 1 10
they have a characteristic feature in an otherwise featurelessmass distribution. In the Milky Way, Williams & McKee (1997)report evidence that is significantly different from unity,N0
implying a cutoff at high mass ( ) in the Galaxy.63 # 10 M,
The parameters of the mass distribution are important both aspredictions of theories as well as inputs to models. It is critical
to estimate these parameters with minimum bias from the massmeasurements of a cloud population.
2.1. Binned Mass Spectra
Most studies of the mass spectrum of giant molecular clouds(GMCs) estimate the slope of the mass spectrum by fitting anapproximation of the differential formulation (eq. [1]). Theygenerate this approximation by separating the mass measure-ments into logarithmically spaced bins. Then the number ineach bin ( ) is divided by the width of the bin :N DMbin
. The uncertainties in these bins are then as-dN/dM ≈ N /DMbin
sumed to arise from counting errors, so . Stud-�j p N /DMbin bin
ies using this technique include Solomon et al. (1987), Williams& McKee (1997), Engargiola et al. (2003), Mizuno et al.(2001), Heyer et al. (2001), and many others.
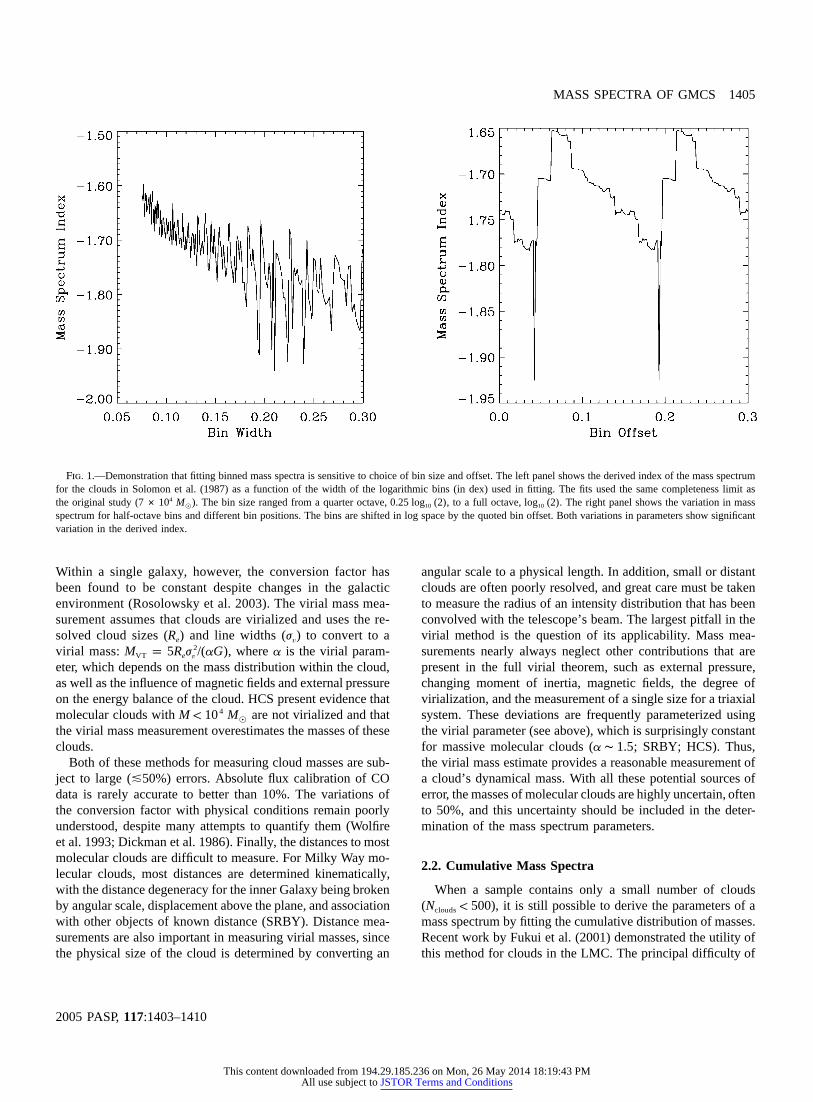
There are two principal drawbacks to this technique: (1) itis sensitive to the selected values of bin size and bin spacing,and (2) it neglects errors in the mass determination of theclouds, which can be substantial. Figure 1 shows the variationin the derived index of the mass spectrum for different choicesof bin size and bin position. To generate these figures, we usedthe mass data from Solomon et al. (1987, hereafter SRBY),with the same completeness limit of as is quoted47 # 10 M,
in their paper. For a given set of bin parameters, we fit a power-law differential mass spectrum to all data that are at least onefull bin above the completeness limit. We follow the methodof Williams & McKee (1997) for the fit and the determinationof errors in the mass distribution. The systematic error in theparameters is comparable to the errors typically quoted in thesestudies. Such errors become negligible in the limit of largenumbers of clouds. In the study by Heyer et al. (2001, hereafterHCS), there are over 1300 clouds above the completeness limit,as opposed to only 200 in the SRBY study. When the sameexperiment is performed on this much larger sample, the var-iation in the derived index reduces to�0.05 and agrees withthe�1.8 quoted in the HCS paper. To use binned mass spectrato estimate the parameters of the mass distribution, the sampleshould have to reduce errors to less than 0.1 inN 1 500clouds
the index.In addition to large variations in derived bin parameters, the
binning method also neglects the principal source of uncer-tainty, namely the mass measurement itself. The mass of amolecular cloud is notoriously difficult to calculate. The prin-cipal methods for deriving the mass are to use the CO-to-H2
conversion factor and the virial theorem. The conversion factorlinearly scales the integrated CO surface brightness to a col-umn density along a line of sight. With a distance measure-ment, the column density of the cloud and the area on thesky are combined to calculate the cloud mass. The conversionfactor is empirically tested to trace H2 column density acrossa variety of environments (Bloemen et al. 1986), althoughvariation is reported among galaxies (Arimoto et al. 1996).
This content downloaded from 194.29.185.236 on Mon, 26 May 2014 18:19:43 PMAll use subject to JSTOR Terms and Conditions
MASS SPECTRA OF GMCS 1405
2005 PASP,117:1403–1410
Fig. 1.—Demonstration that fitting binned mass spectra is sensitive to choice of bin size and offset. The left panel shows the derived index of the mass spectrumfor the clouds in Solomon et al. (1987) as a function of the width of the logarithmic bins (in dex) used in fitting. The fits used the same completeness limitasthe original study ( ). The bin size ranged from a quarter octave, , to a full octave, . The right panel shows the variation in mass47 # 10 M 0.25 log (2) log (2), 10 10
spectrum for half-octave bins and different bin positions. The bins are shifted in log space by the quoted bin offset. Both variations in parameters show significantvariation in the derived index.
Within a single galaxy, however, the conversion factor hasbeen found to be constant despite changes in the galacticenvironment (Rosolowsky et al. 2003). The virial mass mea-surement assumes that clouds are virialized and uses the re-solved cloud sizes ( ) and line widths ( ) to convert to aR je v
virial mass: ,wherea is the virial param-2M p 5R j /(aG)VT e v
eter, which depends on the mass distribution within the cloud,as well as the influence of magnetic fields and external pressureon the energy balance of the cloud. HCS present evidence thatmolecular clouds with are not virialized and that4M ! 10 M,
the virial mass measurement overestimates the masses of theseclouds.
Both of these methods for measuring cloud masses are sub-ject to large (�50%) errors. Absolute flux calibration of COdata is rarely accurate to better than 10%. The variations ofthe conversion factor with physical conditions remain poorlyunderstood, despite many attempts to quantify them (Wolfireet al. 1993; Dickman et al. 1986). Finally, the distances to mostmolecular clouds are difficult to measure. For Milky Way mo-lecular clouds, most distances are determined kinematically,with the distance degeneracy for the inner Galaxy being brokenby angular scale, displacement above the plane, and associationwith other objects of known distance (SRBY). Distance mea-surements are also important in measuring virial masses, sincethe physical size of the cloud is determined by converting an
angular scale to a physical length. In addition, small or distantclouds are often poorly resolved, and great care must be takento measure the radius of an intensity distribution that has beenconvolved with the telescope’s beam. The largest pitfall in thevirial method is the question of its applicability. Mass mea-surements nearly always neglect other contributions that arepresent in the full virial theorem, such as external pressure,changing moment of inertia, magnetic fields, the degree ofvirialization, and the measurement of a single size for a triaxialsystem. These deviations are frequently parameterized usingthe virial parameter (see above), which is surprisingly constantfor massive molecular clouds ( ; SRBY; HCS). Thus,a ∼ 1.5the virial mass estimate provides a reasonable measurement ofa cloud’s dynamical mass. With all these potential sources oferror, the masses of molecular clouds are highly uncertain, oftento 50%, and this uncertainty should be included in the deter-mination of the mass spectrum parameters.
2.2. Cumulative Mass Spectra
When a sample contains only a small number of clouds( ), it is still possible to derive the parameters of aN ! 500clouds
mass spectrum by fitting the cumulative distribution of masses.Recent work by Fukui et al. (2001) demonstrated the utility ofthis method for clouds in the LMC. The principal difficulty of
This content downloaded from 194.29.185.236 on Mon, 26 May 2014 18:19:43 PMAll use subject to JSTOR Terms and Conditions

1406 ROSOLOWSKY
2005 PASP,117:1403–1410
using this method arises in assessing errors for the data in thecumulative mass spectrum. Uncertainties appear in both themass of the cloud and in the variance of a random sample beingdrawn from an infinite parent distribution. Practically, this re-sults in fitting a truncated power-law function to data with errorsin both coordinates. The mass coordinate has an uncertaintyfrom the measurement error, and the cumulative number hasan uncertainty characterized by a counting error, equal to .�N
To fit the data, we use the “error-in-variables” method forparameter estimation in nonlinear functions that have uncer-tainties in both coordinates. We use a method developed byBritt & Luecke (1973) that is the full development of a methodoriginally suggested by Deming (1943). An equivalent methodwas developed into an algorithm by Reilly et al. (1993) thathas been incorporated into StatLib.1 It is this algorithm uponwhich the present work is based, although the error-in-variablesmethod was also presented to the astronomical community inthe work of Jefferys (1980). The method maximizes the like-lihood that a set of data with associated uncertainties(M, N)
can be drawn from a distribution with parameters(j , j )M N
. Since the equations of condition cannot be solved{N , M , g}0 0
algebraically for the parameters (as they can in the linear case),the minimization is performed iteratively in two interleavedphases. First, the true values of the data (i.e., without mea-surement errors) are estimated by maximizing the likelihoodof being drawn from a distribution with some initial guess ofparameters. Then, using the estimate of the true values of thedata, the optimal values of the parameters are determined. Theprocess is iterated until estimates of both the true data valuesand the parameters are determined.
Instead of performing the fit to the data using the modelgiven by equation (3), we use the algebraically equivalentexpression
v2y p v x � v (5)i 1 i 3
to improve independent estimates of and , which areM N0 0
highly covariant in the original formulation. Once the algorithmhas converged on a vector of parameters , we transform thev
elements of back to the parameters of interest. We use av
bootstrapping technique to estimate uncertainties in the derivedparameters, using 100 trials to sample the distribution of de-rived parameters, which is often non-Gaussian. The quotedvalues of the uncertainties in the parameters are the medianabsolute deviations of the transformed parameter distributionfrom the bootstrapping trials. Examination of the parameterdistributions using a large number of bootstrap trials showsthat the medians adequately characterize the uncertainties. Forsome distributions, there are more high-mass clouds than ex-pected from the distribution at lower mass (i.e., the oppositeof a truncation). In this case, the parameter converges tov3
zero. When this occurs, we fit a power law to a distribution of
1 See http://lib.stat.cmu.edu.
the form
′ g�1( )N(M 1 M) p M/M (6)0
and report only andg.M0
We validated our method by fitting the model to randomdata drawn from power-law distributions with known param-eters. The trial data have normal deviates of known dispersionadded to them to simulate the effects of measurement error. Inthese simulations, we find that the method both recovers theproperties of the distribution without bias and produces errorestimates from bootstrapping that agree well with the scatterin derived parameters around the known parameters. This im-plies that we are properly accounting for the error in the sample,as well as recovering the properties of the underlying distri-bution. These tests demonstrate that the error-in-variables fitto the cumulative mass distribution should be favored over afit to the binned mass distribution.
2.3. Systematic Effects
In addition to the errors in the mass measurement, there arealso systematic errors in the generation of mass spectra. Thetwo dominant contributions to the systematic errors are thechoice of the mass measurement (virial vs. luminous) and themethod used to generate the cloud catalog. SRBY report
in their sample, which implies that determinations0.8M ∝ MVT lum
of the index g can vary by 10%, depending on the massmeasurement.
The process used to generate the catalogs is likely the dom-inant systematic in measuring the parameters of the mass dis-tribution. In particular, the resulting parameters of the mass dis-tribution depend on which algorithm is used to assign flux tothe physically significant substructures for which the masses aredetermined. Such decompositions include (1) human assignmentto clouds (e.g., Wilson & Scoville 1990), (2) assignment bygrouping neighboring pixels above a cut in brightness (SRBY;HCS), and (3) computer algorithms such asclumpfind (Wil-liams et al. 1994) orgaussclumps (Stutzki & Gusten 1990).Assigning multiple distinct structures to a single cloud artifi-cially drives the index of the mass spectrum toward more pos-itive values. Such blending is most likely to occur when usingkinematic data to untangle emission in the inner Milky Way.Conversely, overzealous decomposition of objects can erro-neously split high-mass objects into lower mass objects, de-creasing the value of the index or creating an artificial trun-cation in the distribution. Predicting the quantitative impact ofthese systematics is beyond the scope of this work.
Ideally, the mass distribution should be derived using thesame decomposition algorithms and mass determinations fromboth observations and simulations in order to minimize thesesystematic effects. However, the magnitude of these systematiceffects can be estimated by analyzing the same data set withdifferent methods. Using the derived parameters from the het-
This content downloaded from 194.29.185.236 on Mon, 26 May 2014 18:19:43 PMAll use subject to JSTOR Terms and Conditions

MASS SPECTRA OF GMCS 1407
2005 PASP,117:1403–1410
TABLE 1Parameters of Mass Spectra for GMCs in Local Group Studies
Object Name Type Number g N05M /(10 M )0 ,
Inner MW . . . . . . . SRBY VT 190 �1.53 � 0.07 36.� 12. 29.� 5.0CO 173 �1.53 � 0.06 27.� 11. 41.� 9.5
Inner MW . . . . . . . SYSCW VT 107 �1.58 � 0.15 14.� 10. 26.� 7.6CO 97 �1.41 � 0.12 21.� 13. 29.� 7.2
Outer MWa . . . . . . HCS VT 227 �2.56 � 0.11 … 3.2� 0.78CO 81 �2.06 � 0.15 … 6.3� 3.1
Outer MW . . . . . . . BKP VT 336 �2.29 � 0.08 4.5� 3.5 2.9� 1.0CO 81 �2.16 � 0.17 2.7� 2.9 2.0� 1.0
M33 . . . . . . . . . . . . . EPRB CO 58 �2.85 � 0.36 2.5� 2.7 8.6� 3.3LMC . . . . . . . . . . . . . NANTEN VT 44 �1.71 � 0.19 10.� 6.5 23.� 4.6
CO 55 �1.72 � 0.12 6.1� 3.6 82.� 32.
a The mass distribution shows an excess of clouds at high mass, implying there is no truncation inthe sample. A pure power law has been fit to the data (eq. [6]).
Fig. 2.—Mass distribution of the SRBY virial mass measurements. A trun-cated power-law fit to the data using the methods of this study is shown as asolid line. The data show a significant break around , and the fit recoversN p 50this feature well.
erogeneous data sets in this study, we find that the index canbe robustly determined, in spite of these systematic effects.Identifying truncations and maximum masses are complicatedby these systematic effects and require care to accurately re-cover them (see below).
3. LOCAL GROUP MASS SPECTRA
Using fits to the cumulative mass distribution, we have rean-alyzed the catalogs of GMCs in the Local Group. Our resultsshow significant differences in the mass distributions of the
GMC populations. For each of the catalogs discussed below,we fit a power law to the cumulative mass distribution, in-cluding a truncation if appropriate (see above). Unless other-wise stated, when both virial and luminous measurements ofthe mass are reported, we use an error equal to half the dif-ference between the two mass measurements, plus a 10% flux-calibration error added in quadrature. The results of the newfits to the Local Group mass distributions are summarized inTable 1. The reported errors are the median absolute deviationof the derived parameters for 100 bootstrapping trials. To il-lustrate a fit to the data, we plot the results of the fit to thevirial mass data of SRBY in Figure 2.
3.1. The Inner Milky Way
There are two major studies of GMCs in the inner MilkyWay. Both SRBY and Scoville et al. (1987, hereafter SYSCW)analyzed FCRAO survey data from the first quadrant of theGalaxy, decomposing the emission into clouds using differentalgorithms. Comparing the results of these two studies high-lights the systematic effects of using different decompositionalgorithms. Both studies identified clouds as contiguous regionsabove a fixed antenna temperature cutoff, but chose differentthresholds and methods for decomposing substructure. We usetheir measurements for virial mass and luminous mass, cor-recting for differences in virial definitions and Galactic scales,as summarized in Williams & McKee (1997). The index of thepower law is unaffected by the choice of conversion factor.Typical mass errors are factors of∼15%. We fit all clouds withmasses greater than in the SRBY study, which51 # 10 M,
approximates their reported completeness level. For theSYSCW study, we compared the virial and luminous massmeasurements after scaling the data, and we find that the virialmass estimates are a factor of 2 higher than the luminous massmeasurements for the high-mass clouds. To place the sampleson equal footing, we scaled the luminous mass of the cloudsby a factor of 2 to bring the mass estimates into agreement.We then examined the distributions and established a com-
This content downloaded from 194.29.185.236 on Mon, 26 May 2014 18:19:43 PMAll use subject to JSTOR Terms and Conditions

1408 ROSOLOWSKY
2005 PASP,117:1403–1410
pleteness limit of , based on where the distribution45 # 10 M,
departed from a power law on the low-mass end. Fitting toboth the virial and luminous masses for both studies finds anindex and a significant cutoff, with∼25 clouds atg ≈ �1.5the cutoff. For all four fits, . The relatively6M ≈ 3 # 10 M0 ,
small differences between the derived parameters, despite thedifferent catalog methods, suggests that systematic effects aresmall in this case. Since the cataloging methods are concep-tually similar in the two studies, this result is not surprising.The derived value of is slightly higher in the SRBY methodN0
than in SYSCW, suggesting that there is some influence of thecatalog method on the cutoff values.
The mass distribution for the inner Milky Way is shallowerthan that found for other systems. Two effects may bias theresults toward a shallower index. First, line-of-sight blendingwill make several less massive clouds appear as a single, moremassive cloud, shifting the index toward shallower values. Themethods used to generate the SRBY and SYSCW catalogs dolittle to split up blends of emission. Second, incorrectly re-solving the distance ambiguity will also bias the mass distri-bution toward shallow indices. If every cloud has the sameprobability of having its distance incorrectly determined, thenmore low-mass clouds in the near distance will be erroneouslycounted as a high-mass clouds at the far distance than in thereverse, simply because there are more low-mass clouds. Thislatter bias can increase the index of the mass distribution byas much as 0.2 for 20% of the clouds that are assigned thewrong distance. Thus, the index of the mass distribution forthe inner Milky Way very likely is steeper than can be derivedfrom the current observational data.
3.2. Outer Milky Way
The data used for the outer Milky Way are from an FCRAOsurvey of a section of the second quadrant (Heyer et al. 1998)that were subsequently analyzed by both HCS and Brunt et al.(2003, hereafter BKP). HCS used a cloud extraction algorithmsimilar to SRBY, but defined cloud properties from the intensitydistributions slightly differently. In contrast, BKP used a mod-ified clumpfind algorithm to identify peaks in the emissiondistribution as the nuclei of distinct clouds. Their algorithmextracts roughly∼50% more sources than the work of HCS.They assign cloud properties to the emission distribution in afashion similar to HCS. Mass errors in the HCS study are givenas half the difference between mass measurements plus a fluxerror, and errors in BKP are reported in their study. Since cloudsin the outer Galaxy with masses smaller than 104 M, are notvirialized, we set as the lower mass limit for the fits410 M,
to these catalogs. Adopting this truncation includes many morevirial mass measurements than luminous mass measurements,since the virial mass tends to overestimate the mass of cloudswith . Thus, the luminous mass distribution4M ! 10 Mlum ,
likely represents the underlying mass distribution better thanthe virial mass distribution. We also require the kinematic dis-
tance to be larger than 2 kpc to minimize errors in the distancedetermination. We find that the index of the mass distributionis steeper than reported in HCS, which is due to the improvedfitting methods ( vs.�1.8 in HCS). Since the luminousg p �2.1mass is likely a better tracer of cloud mass, we also perform afit to the luminous mass data alone, using a lower limit of
, and derive an index of .32 # 10 M g p �2.05� 0.06,
The catalog of HCS shows more clouds than would be ex-pected at high mass, given a power-law extrapolation fromlower masses. Such an excess is not seen in the BKP catalog,because of the more aggressive decomposition algorithm em-ployed in the latter study. Without careful analysis of the in-dividual clouds, it is impossible to say what represents the truedistribution of clouds at high mass in the outer Galaxy. Sinceevidence for a cutoff appears in the BKP catalog but not inthe HCS catalog, comparing these two studies illustrates thesystematic effects of different catalog methods. The strong evi-dence for a truncation that is found for the inner Galaxy datais lacking in the outer Galaxy. This is likely because there aretoo few molecular clouds to populate the distribution up to thetruncation mass. Nonetheless, the index of the mass distributionis well determined and is significantly steeper than that foundin the inner Milky Way.
3.3. M33
M33 is the only spiral galaxy for which a catalog of GMCsexists with a known completeness limit (Engargiola et al. 2003,hereafter EPRB). Since the galaxy is seen from an externalperspective, blending effects are dramatically reduced com-pared to Milky Way studies. However, there are only 59 cloudsabove the reported completeness limit of , and51.5# 10 M,
the clouds have only CO masses reported, since the individualclouds are not resolved. A follow-up study (Rosolowsky et al.2003) has shown that the virial mass is proportional to theluminous mass for GMCs in M33, and that the doesM /MCO VT
not vary significantly over the galaxy. We estimate the errorin their measurements as the difference between the measuredand corrected mass discussed in EPRB, plus their quoted 25%calibration error in the flux scale of the interferometer. Thederived value of the mass index ( ) is very steep. M33g p �2.9is also the most distant galaxy in this reanalysis, and obser-vational biases may affect the index of the mass distribution.However, the potential biases would only make the mass spec-trum appear shallower than it actually is. In particular, blendingeffects will make several less massive clouds appear as a singlemassive cloud, and underestimates of the completeness limit willcause the number of low-mass clouds to be underestimated. Theinfluence of either of these effects would imply that the massindex is actually steeper than what is measured, .g ≤ �2.9
It is likely that the extremely steep slope of the mass dis-tribution is actually the tail of a distribution with a cutoff massbelow the completeness limit of the survey. EPRB estimate acharacteristic mass between 3#104 and 7#104 M,, which
This content downloaded from 194.29.185.236 on Mon, 26 May 2014 18:19:43 PMAll use subject to JSTOR Terms and Conditions

MASS SPECTRA OF GMCS 1409
2005 PASP,117:1403–1410
could simply be a cutoff mass in a truncated power-law dis-tribution. To illustrate the effects of fitting a truncated power-law distribution above the cutoff mass, we repeated the analysisof clouds in the inner Milky Way, restricting the sample toclouds near the cutoff mass ( ). Fitting to the6M 1 2 # 10 M,
restricted sample gives with no evidence of trun-g p �2.2cation, instead of with a truncation. This supportsg p �1.5our conjecture that the steep slope of the M33 mass distributioncan be attributed to fitting a power-law distribution above themass cutoff.
3.4. Large Magellanic Cloud
The only other complete survey of GMCs in a galaxy wascompleted using the NANTEN 4 m telescope to observe theLMC. Mizuno et al. (2001) report the most recent catalog ofGMCs, including 55 resolved GMCs for which virial massescan be measured. A subsequent paper (Fukui et al. 2001) reportsan index of , using CO and virial masses from ag p �1.9currently unavailable catalog of more GMCs. All of the re-solved clouds have masses above the completeness limit of thesurvey. Using the virial masses for the 55 clouds reported, wederive a mass spectrum index that is consistent with Fukui etal. (2001), with some evidence of truncation. The index on themass distribution derived from the virial masses is likely alower limit (i.e., ), because the reported virial massg 1 �1.9measurements do not account for beam convolution. The er-ror-in-variables fit to the data finds that the mass distributionis shallower ( ) than that reported in Fukui etg p �1.7� 0.2al. (2001), with some evidence of a cutoff. The maximummass in the LMC is similar to that in the inner Milky Way( ), but the value is poorly constrained by the lim-63 # 10 M,
ited number of clouds in the catalog.
4. DISCUSSION
There is a real variation in the mass distribution of GMCs acrossthe Local Group, with indices ranging from to�1.5.g p �2.9There are cutoffs at a maximum mass of in catalogs6.510 M,
from the inner Milky Way and the LMC. In general, the dif-ferences in the mass distributions have been unappreciated ortrivialized; but they are, in fact, significant. In the inner MilkyWay, the top-heavy mass distribution means that studying themost massive clouds encompasses most of the star formationin that part of the Galaxy. In contrast, low-mass clouds containa substantial fraction of the molecular mass in the outer MilkyWay and M33. In systems with bottom-heavy mass distribu-tions, the star-forming properties of these low-mass clouds mustbe examined to obtain a complete picture of the star-forminginterstellar matter. Using is appropriate for the innerg ≈ �1.5Milky Way, but not for all galaxies.
Since molecular cloudsof a given mass appear to be similaracross the Local Group (Heyer et al. 2001; Rosolowsky et al.2003), variation among the mass distributions is one of theonly distinguishing features among molecular cloud popula-
tions. Owing to relatively short molecular cloud lifetimes (Blitz& Shu 1980; Leisawitz et al. 1989; Yamaguchi et al. 2001),molecular clouds have little time to increase significantly inmass, due to cloud collisions and accretion. However, the de-struction of molecular clouds by their stellar progeny willchange their mass through photodissociation and hydrodynamiceffects. Observations show that the star formation rate scalesroughly with cloud mass in the Milky Way (Mooney & Sol-omon 1988). If this is approximately correct throughout theLocal Group, then differences in the mass distribution of mo-lecular clouds are not likely to arise from different star for-mation rates. It seems likely that differences observed in themass distributions must be due primarily to the formation mech-anism of molecular clouds. Since many studies seek to explainthe mass distribution of molecular clouds (Kwan 1979; El-megreen & Falgarone 1996; Vazquez-Semadeni et al. 1997;Stutzki et al. 1998; Wada et al. 2000), these explanations mustbe expanded in scope to encompass the variety of mass dis-tributions observed in the Local Group.
It is interesting to note that the environment with the steepestindex of the mass distribution (M33) is also the region that ismost gravitationally stable with respect to gravitational insta-bility (Martin & Kennicutt 2001). This behavior might be ex-pected if two mechanisms dominated the cloud formation pro-cess, each producing different mass distributions, and if oneof the mechanisms were regulated by gravitational instability.For example, if the molecular clouds that form in spiral armsare more massive than those that form in the field, then a steepermass index is expected in M33 where the disk is stable. Anotherpossibility is that the galactic environment establishes the cutoffmass for the mass distribution. In both the inner Milky Way andthe LMC, where there is reasonably clear evidence for a cutoffmass, that mass is roughly . However, in M33 the63 # 10 M,
characteristic mass of molecular clouds must be smaller than thecompleteness limit in the study ( ) and is likely51.5# 10 M,
∼ . The outer Milky Way does not appear to show45 # 10 M,
a characteristic mass that could be attributed to the absence ofsufficient molecular material to populate the distribution atmasses near the cutoff. It remains an open question as to whatphysics would establish the characteristic mass in these systemsand why the characteristic mass in M33 would be 2 orders ofmagnitude less massive than in the Milky Way and the LMC.
5. CONCLUSIONS
This study emphasizes the importance of performing a uni-form analysis to generate mass spectra. Using the error-in-variables method of parameter determination, we reanalyzedthe molecular cloud catalogs for the Local Group of galaxiesand report the following conclusions:
1. Fits to the cumulative mass distribution using the error-in-variables method produce a reliable estimate of the param-eters of the mass distribution. Bootstrapping produces reason-able uncertainties these parameters. The adopted method is
This content downloaded from 194.29.185.236 on Mon, 26 May 2014 18:19:43 PMAll use subject to JSTOR Terms and Conditions

1410 ROSOLOWSKY
2005 PASP,117:1403–1410
superior to the standard technique of fitting a binned approx-imation to the differential mass spectrum, since it is insensitiveto bin selection and it also accounts for uncertainties in themass estimate.
2. There is significant variation in the mass distributions ofmolecular clouds across the Local Group, even after accountingfor systematic effects and biases. Differences in the methodused to catalog the molecular emission affect the derived pa-rameters of the mass distribution. In particular, the presenceand magnitude of a cutoff in the mass distribution is affectedby the decomposition algorithm. Unless the cutoff is quite sig-nificant (as it is in the inner Milky Way), the presence of atruncation should be regarded with some suspicion. However,the index of the mass distribution is far less sensitive to theparticulars of the mass determination and decomposition al-gorithm, resulting in systematic errors in the index (g) of �0.1.
3. The mass distribution in the inner Milky Way has a measuredindex of , with good evidence for a truncationg p �1.5� 0.1in the distribution setting a maximum mass of .System-6.510 M,
atic errors particular to the study of the inner Milky Way sug-gest that the true mass distribution may be steeper than thisderived value. Using is appropriate for the innerg ≈ �1.5Milky Way but does not approximate the mass distribution ofmolecular clouds across all galaxies.
4. The mass distribution of molecular clouds in the outer Milky
Way is significantly steeper than that found in the inner Galaxy.The mass distribution has an index of , steeperg p �2.1� 0.2than previously claimed, and shows no evidence of a cutoff athigh mass.
5. The GMCs in M33 show the steepest distribution foundin this study, with no evidence of a cutoff. It is possible thatthe distribution actually has a cutoff below the completenesslimit of the sample, which accounts for the derived index.
6. The LMC has a mass distribution that is steeper than thatof the inner Milky Way ( ), but also showsg p �1.7� 0.2LMC
some evidence of a cutoff near that was previously6.510 M,
unknown. An expanded catalog of clouds is needed to confirmthis result.
This work was supported by an NSF postdoctoral fellowship(AST-0502605). I thank Adam Leroy for lengthy discussionsregarding parameter estimation and maximum likelihood. I amgrateful to Leo Blitz for a careful reading of this work which,as always, improved its clarity. The comments of an anonymousreferee helped to clarify the motivation for this paper. Researchpresented here relied heavily on the use of NASA’s Astro-physics Data System and the efforts of the Center for Astro-statistics at the University of Pennsylvania.
REFERENCES
Arimoto, N., Sofue, Y., & Tsujimoto, T. 1996, PASJ, 48, 275Blitz, L., & Shu, F. H. 1980, ApJ, 238, 148Bloemen, J. B. G. M., et al. 1986, A&A, 154, 25Britt, H., & Luecke, R. 1973, Technometrics, 15, 233Brunt, C. M., Kerton, C. R., & Pomerleau, C. 2003, ApJS, 144, 47
(BKP)Deming, W. E. 1943, Statistical Adjustment of Data (New York:
Wiley)Dickman, R. L., Snell, R. L., & Schloerb, F. P. 1986, ApJ, 309, 326Elmegreen, B. G., & Falgarone, E. 1996, ApJ, 471, 816Engargiola, G., Plambeck, R. L., Rosolowsky, E., & Blitz, L. 2003,
ApJS, 149, 343 (EPRB)Fukui, Y., Mizuno, N., Yamaguchi, R., Mizuno, A., & Onishi, T. 2001,
PASJ, 53, L41Heyer, M. H., Brunt, C., Snell, R. L., Howe, J. E., Schloerb, F. P.,
& Carpenter, J. M. 1998, ApJS, 115, 241Heyer, M. H., Carpenter, J. M., & Snell, R. L. 2001, ApJ, 551, 852
(HCS)Jefferys, W. H. 1980, AJ, 85, 177Krumholz, M. R., & McKee, C. F. 2005, ApJ, 630, 250Kwan, J. 1979, ApJ, 229, 567Leisawitz, D., Bash, F. N., & Thaddeus, P. 1989, ApJS, 70, 731Martin, C. L., & Kennicutt, R. C. 2001, ApJ, 555, 301
McKee, C. F., & Williams, J. P. 1997, ApJ, 476, 144Mizuno, N., et al. 2001, PASJ, 53, 971Mooney, T. J., & Solomon, P. M. 1988, ApJ, 334, L51Reilly, P., Reilly, H., & Keeler, S. 1993, Appl. Stat., 42, 693Rosolowsky, E. W., Plambeck, R., Engargiola, G., & Blitz, L. 2003,
ApJ, 599, 258Scoville, N. Z., Yun, M. S., Sanders, D. B., Clemens, D. P., & Waller,
W. H. 1987, ApJS, 63, 821 (SYSCW)Solomon, P. M., Rivolo, A. R., Barrett, J., & Yahil, A. 1987, ApJ,
319, 730 (SRBY)Stutzki, J., Bensch, F., Heithausen, A., Ossenkopf, V., & Zielinsky,
M. 1998, A&A, 336, 697Stutzki, J., & Gusten, R. 1990, ApJ, 356, 513Tan, J. C. 2000, ApJ, 536, 173Vazquez-Semadeni, E., Ballesteros-Paredes, J., & Rodriguez, L. F.
1997, ApJ, 474, 292Wada, K., Spaans, M., & Kim, S. 2000, ApJ, 540, 797Williams, J. P., de Geus, E. J., & Blitz, L. 1994, ApJ, 428, 693Williams, J. P., & McKee, C. F. 1997, ApJ, 476, 166Wilson, C. D., & Scoville, N. 1990, ApJ, 363, 435Wolfire, M. G., Hollenbach, D., & Tielens, A. G. G. M. 1993, ApJ,
402, 195Yamaguchi, R., et al. 2001, PASJ, 53, 985
This content downloaded from 194.29.185.236 on Mon, 26 May 2014 18:19:43 PMAll use subject to JSTOR Terms and Conditions