giant molecular clouds in local group galaxies · giant molecular clouds in local group galaxies...
TRANSCRIPT
Giant Molecular Clouds in Local Group Galaxies
Leo BlitzUniversity of California, Berkeley
Yasuo FukuiNagoya University
Akiko KawamuraNagoya University
Adam LeroyUniversity of California, Berkeley
Norikazu MizunoNagoya University
Erik RosolowskyHarvard-Smithsonian Center for Astrophysics
We present the first comparative study of extragalactic GMCs using complete data setsfor entire galaxies and a uniform set of reduction and analysis techniques. We present resultsbased on CO observations for the LMC, SMC, M33, M31, IC10 and the nucleus of M64, andmake comparisons with archival Milky Way observations. Our sample includes large spiralsand dwarf irregulars with metallicities that vary by an order of magnitude. GMCs in H Irich galaxies are seen to be well-correlated with H I filaments that pervade the galactic disks,suggesting that they form from pre-existing H I structures. Virial estimates of the ratio of COline strength to H2 column density, XCO, suggests that a value of 4 ×1020 cm−2(K km s−1)−1
is a good value to use in most galaxies (except the SMC) if the GMCs are virialized. However,if the clouds are only marginally self-gravitating, as appears to be the case judging from theirappearance, half the virial value may be more appropriate. There is no clear trend of XCO
with metallicity. The clouds within a galaxy are shown to have the about the same H2 surfacedensity and differences between galaxies seem to be no more than a factor of ∼ 2. We showthat hydrostatic pressure appears to be the main factor in determining what fraction of atomicgas is turned into molecules. In the high-pressure regions often found in galactic centers, theobserved properties of GMCs appear to be different from those in the found in the Local Group.From the association of tracers of star formation with GMCs in the LMC, we find that about 1/4of the GMCs exhibit no evidence of star formation and we estimate that the lifetime of a typicalGMC in these galaxies is 20–30 Myr.
1. INTRODUCTION
Although a great deal of progress has been made on thetopic of star and planet formation since the last Protostarsand Planets conference in Santa Barbara, little work hasbeen done to connect what we know about star formationin the Milky Way to star formation in the Universe as awhole. Fundamental limitations include only a weak un-derstanding of how the massive stars form, how clustersand associations form, and the constancy of the IMF. Af-ter all, in external galaxies, we generally observe only theeffects of massive star formation and the formation of starclusters. Furthermore, knowledge of the initial conditionsfor star formation at all masses remains elusive both within
and outside of the Milky Way.Since nearly all stars form in Giant Molecular Clouds
(GMCs), one way to make progress is to examine the prop-erties of GMCs in a number of different extragalactic en-vironments to see how they differ. From the similaritiesand differences, it might be possible to make some gen-eral conclusions about how star formation varies through-out the Universe. Although individual, extragalactic GMCshad been observed previously at high enough resolution toat least marginally resolve them (e.g., Vogel et al., 1987;Lada et al., 1988), the first attempts to do this in a system-atic way were by Christine Wilson (Wilson and Scoville,1990; Wilson and Reid, 1991; Wilson and Rudolph, 1993;
1

TABLE 1
LOCAL GROUP GMC DATA
Galaxy Telescope Metallicity Spatial Resolution Reference
LMC NANTEN 0.33 Z� 40 pc 1SMC NANTEN 0.1 Z� 48 pc 2IC10 OVRO/BIMA 0.25 Z� 14 – 20 pc 3M33 BIMA 0.1 – 1.0 Z� 20 – 30 pc 4M31 BIMA 0.5 Z� 26 – 36 pc 5
References. — (1) Fukui et al. (2006) (2) Mizuno et al. (2006) (3) Leroy etal. (2006) (4) Engargiola et al. (2003) (5) Rosolowsky (2006)
Wilson, 1994) using the OVRO and BIMA interferometers.Her efforts were hampered by small survey areas in a fewgalaxies, so general conclusions could only be made by ex-trapolation. Numerous other authors subsequently studiedone or a few extragalactic GMCs, both in the Local Groupand beyond. An exhaustive list of their efforts is beyond thescope of the present article.
The situation has changed in the last five years as a re-sult of the construction of the NANTEN telescope in theSouthern Hemisphere and the completion of the 10-elementBIMA Array. The former made it possible to map the Mag-ellanic Clouds completely with high enough spatial resolu-tion and signal-to-noise to identify all of the GMCs withmasses > 3 × 10⁴ M�; the completion of the BIMA in-terferometer made it possible to identify GMCs in other,more distant galaxies in the Local Group. Because of theirrelatively large fields of view, these two telescopes couldcompletely survey nearby galaxies. Thus, the first completesurvey of GMCs in any galaxy was of the LMC (Fukui etal., 1999; Mizuno et al., 2001b) and not the Milky Way(MW). Although the molecular gas in the MW has beenessentially completely mapped, velocity crowding in manydirections makes it impossible to generate a full catalogof GMCs. Similarly, the first complete CO surveys of theMagellanic Clouds were by Cohen et al. (1988) and Rubioet al. (1991), but the resolution was too poor to determinethe properties of individual molecular clouds.
In this paper, we review the recent surveys of CO inLocal Group galaxies that (1) have sufficient resolution tostudy individual molecular clouds and (2) span all or mostof the target galaxy. We compare the results of observationsof GMCs in the four external Local Group galaxies thathave been mapped in their entirety in CO: the Large Mag-ellanic Cloud (LMC, Fukui et al., 2001; Fukui et al., 2006),the Small Magellanic Cloud (SMC, Miznuo et al., 2001a;Mizuno et al., 2006), IC 10 (Leroy et al., 2006), and M33(Engargiola et al., 2003). We have also made observationsin a small strip in M31 (Rosolowsky, 2006), and we com-pare the properties of the GMCs in all of these galaxiesto clouds in the outer MW (from Dame et al., 2001) us-
ing a uniform set of analytic techniques. The LMC andSMC observations were made with the single-dish NAN-TEN telescope in Chile, the remaining galaxies were ob-served with the BIMA millimeter-wave interferometer atHat Creek, California (combined with obsevations from theCaltech OVRO millimeter interferometer for IC 10). A tab-ulation of the galaxies we observed, their metallicities andthe resolution used to observe them is given in Table 1.
2. THE GALAXIES
In this section, we examine the distribution of CO emis-sion in the surveyed galaxies and we compare the CO toemission in other wavebands.
2.1. The LMC
Fig. 1 shows the molecular clouds detected with theNANTEN Survey (Fukui et al., 2001; Fukui et al., 2006)on an optical image of the LMC. Except for a region nearthe eastern edge of the galaxy (left side of Fig. 1) below 30Doradus, the clouds appear to be spatially well-separatedand it is possible to pick them out individually by eye.The long string of bright CO emission along the easternedge of the galaxy is likely composed of several clouds thatcannot be separated at this resolution. Some have specu-lated that this feature is due to hydrodynamical collisionbetween the LMC and SMC (Fujimoto and Noguchi, 1990)or ram pressure pileup of gas due to the motion of the LMCthrough a halo of hot, diffuse gas (de Boer et al., 1998;Kim et al., 1998). Supershells may also be playing a rolein the formation of GMCs as in the case LMC4 (Yamaguchiet al., 2001a). A comprehensive comparison between su-pergiant shells and GMCs shows that only about 1/3 ofthe GMCs are located towards supershells, suggesting theeffects of supershells are not predominant (Yamaguchi etal., 2001b). There is neither an excess nor a deficit of COassociated with the stellar bar, but the bright H II regionsare all clearly associated with molecular clouds. Individ-ual clouds are frequently associated with young clusters of
2

stars. Not every cluster of young stars is associated with acloud nor does every cloud show evidence of massive starformation. Using this association and the ages of the stel-lar clusters, we can establish the evolutionary time scale forGMCs (Section 6).
Fig. 1.— Optical image of the LMC with GMCs mapped with theNANTEN telescope indicated within the boundary of the surveyarea. The CO is well correlated with H II regions. The GMCs areeasily identified by eye except for the region south of 30 Doraduswhere they appear as a vertical line of clouds and the individualGMCs may be overlapping in this region.
2.2. The SMC
Fig. 2 shows the GMCs superimposed on a grayscale im-age made using the 3.6, 4.5, and 8.0 µm bands from theIRAC instrument on the Spitzer Space Telescope (Bolattoet al., 2006). The CO map is from the NANTEN telescope(Mizuno et al., 2006). As in the LMC, the GMCs in theSMC are easily identified by eye. Unlike the LMC, they arenot spread throughout the galaxy but appear preferentiallyon the northern and southern ends of the galaxy. Anothergrouping is located to the east (left) of the SMC along theH I bridge that connects the LMC and SMC, apparentlyoutside the stellar confines of the galaxy. The Spitzer im-age traces the stellar continuum as well as warm dust andPAH emission. The 8.0 µm emission is associated withthe molecular gas traced by CO, but appears to be moreextended than the CO emission. The SMC has the lowestmetallicity in our sample and provides an opportunity to ex-plore the behavior of molecular gas in chemically primitiveenvironments.
2.3. M33
Fig. 3 shows the locations of GMCs in M33 from theBIMA telescope (Engargiola et al., 2003) superimposed onan Hα image of the galaxy (Massey et al., 2001). The twolow-contrast spiral arms (Regan and Vogel, 1994) are well-traced by GMCs, but the GMCs are not confined to thesearms as is evident in the center of the galaxy. There isgood spatial correlation between the GMCs and the H IIregions. Once again, the correlation is not perfect and thereare GMCs without H II regions and vice versa. Unlike theother images, we show the locations of the GMCs as circleswith areas proportional to the CO luminosity of each GMC;the CO luminosity is expected to be proportional to theH2 mass of each GMC. Note that the most massive GMCs(∼ 106 M�) are not found toward the center of the galaxybut along spiral arms north of the galactic nucleus. Thesemassive clouds are relatively devoid of Hα emission. Thecompleteness limit of this survey is about 1.5 ×10⁵ M�;thus there are presumably many lower mass clouds belowthe limit of sensitivity. Many of these low mass clouds arelikely associated with the unaccompanied H II regions inthe figure.
2.4. IC 10
Fig. 4 is an image of the GMCs in IC 10 from a 50 fieldCO mosaic with the BIMA telescope (Leroy et al., 2006)superimposed on a 2 µm image of the galaxy made from2MASS data (Jarrett et al., 2003). As with the MagellanicClouds and M33, the GMCs show no obvious spatial corre-lation with old stellar population – some massive clouds arefound where there are relatively few stars.
Fig. 2.— GMCs in the SMC observed with the NANTEN tele-scope overlayed on an a near-infrared image of the galaxy from theSpitzer Space Telescope (Bolatto et al., 2006). The lines indicatethe survey boundary. The CO clouds are clearly associated withregions of transiently heated small grains or PAHs that appear asdark, nebulous regions in the image.
3

Fig. 3.— The locations of GMCs in M33 as derived from the 759field BIMA mosaic of Engargiola et al. (2003). Since sources ofCO emission in a map would be too small to identify in the figure,the locations of GMCs are instead indicated by light gray circles.The area of the circles is scaled to the CO luminosity which shouldbe proportional to the H2 mass. The GMC locations are overlayedon a continuum subtracted Hα image of the galaxy (Massey etal., 2001). There is significant correlation between the GMCs andmassive star formation as traced by Hα.
2.5. The Correlation with H I
The distribution of GMCs in these four galaxies showslittle correlation with old stars (see Figs. 1 and 4). The ob-vious correlations with Hα (Figs. 1 and 3) and young stellarclusters (Fig. 1) are expected since these trace the star for-mation that occurs within GMCs. That the correlation is notperfect can be used to deduce information about the evolu-tion of the clouds (Section 6). To examine the relationshipof GMCs to the remainder of the neutral ISM, we plot thelocations of CO emission on top of H I maps of these fourgalaxies in Fig. 5. A strong correlation between the atomicand molecular gas is immediately apparent. Every GMC ineach of the galaxies is found on a bright filament or clumpof H I, but the reverse is not true: there are many brightfilaments of H I without molecular gas. In M33, the largestof the fully mapped galaxies, the ratio of H I to CO in thefilaments in the center of the galaxy is smaller than in theouter parts. In the LMC, the CO is generally found at peaksof the H I, but most of the short filaments have no associ-ated CO. In the SMC, the H I is so widespread that the COclouds appear as small, isolated clouds in a vast sea of H I.Apparently, H I is a necessary but not a sufficient conditionfor the formation of GMCs in these galaxies.
Figs. 1 – 4 show that the molecular gas forms from theH I, rather than the H I being a dissociation product of
Fig. 4.— The GMCs in IC 10 made from a 50 field mosaic of thegalaxy with the BIMA telescope overlayed on a 2 µm image of thegalaxy from the 2MASS survey. The dark gray area corresponds toCO brightness above 1 K km s−1; the light gray area correspondsto CO brightness above 10 K km s−1. The black region in thecenter has the highest stellar surface density. The rms noise of theCO data is ∼ 0.3 K km s−1in each channel map; the peak value inthe integrated intensity map is 48 K km s−1(Leroy et al., 2006).
the molecular clouds as some have advocated (e.g., Allen,2001). First, in all four galaxies the H I is much morewidespread than the detected CO emission. Thus, most ofthe H I cannot be dissociated H2 without violating massconservation if the GMC lifetimes are as short as we derivein Section 6. Second, there is no CO associated with mostof the filaments in the LMC, M33, and IC 10 and the col-umn density of these CO-free filaments is about the sameas the column density of filaments which have CO emis-sion. Because there is no transition in H I properties at radiiwhere one observes CO, and the radii where it is absent, itis difficult to imagine that two separate origins for the H Iwould produce a seamless transition. Finally, the H I in thefilaments between GMCs has the wrong geometry to be adissociation product; there is too much gas strung out alongthe filaments to have come from dissociation of the molec-ular gas.
2.6. Implications for GMC Formation
What can the morphology of the atomic gas tell us aboutGMCs and their formation? All the H I images are char-acterized by filamentary structures that demarcate holes inthe atomic distribution. In IC 10, there is good evidencethat some of the holes are evacuated by the action of su-pernovae or stellar winds which sweep up the atomic gas
4

into the observed filamentary structure (Wilcots and Miller,1998). In contrast, most of the large holes observed in theM33 H I distribution are not likely to be caused by super-novae. The large holes require about 1053 ergs to evacu-ate, but there are no obvious stellar clusters remaining atthe center of the holes. Furthermore, x-ray emission is notconcentrated in the holes. The large holes in M33 are thuslikely to have a gravitational or density-wave origin. Smallholes with D < 200 pc, on the other hand, are found tobe well correlated with OB associations (Deul and van derHulst, 1987); these tend to be concentrated toward the cen-ter of the galaxy.
This leads to some qualitative conclusions about the for-mation of GMCs and ultimately the star formation that oc-curs within them. Because the CO forms from H I fila-ments and not the other way around, it is the filaments ina galaxy that must form first as precursors to the GMCs.In some of the galaxies, such as M33 and apparently in theLMC and the SMC, most of the filaments are not associ-ated with energetic phenomena. This clearly rules out theself-propagating star formation picture that was promotedsome years back by Gerola and Seiden (1978) for mostof our galaxies. In their picture, GMC formation and thusstar formation propagates by means of supernovae that ex-plode in regions of a galaxy adjacent to a previous episodeof star formation. However, in IC 10, because there is ev-idence that some of the H I morphology may be the re-sult of energetic events from previous generations of stars,self-propagating star formation may be a viable mechanism.The critical element of GMC formation across all these sys-tems appears to be the assembly of H I filaments, thoughthe mechanism that collects the atomic gas appears to varyacross the systems.
But why, then, do some filaments form GMCs and notothers? We argue in Section 5, that it is the result of thepressure to which filaments are subjected.
3. MOLECULAR CLOUD PROPERTIES
Our main goal in this section is to compare the proper-ties of GMCs made with different telescopes, resolutions,and sensitivities. We use GMC catalogs from the studiesof the four galaxies listed above, and we supplement ourwork with a sample of GMCs in M31 (Rosolowsky, 2006)as well as a compilation of molecular clouds in the outerMilky Way as observed by Dame et al. (2001) and cata-loged in Rosolowsky and Leroy (2006).
To aid in the systematic comparison of cloud properties,Rosolowsky and Leroy (2006, hereafter RL06) have recentlypublished a method for minimizing the biases that plaguesuch comparisons. For example, measurement of the cloudradius depends on the sensitivity of the measurements, andRL06 suggest a robust method to extrapolate to the expectedradius in the limit of infinite sensitivity. They also suggest amethod to correct cloud sizes for beam convolution, which
has been ignored in many previous studies of extragalacticclouds. We use the RL06 extrapolated moment method onall of the data used in this paper since it is least affected byrelatively poor signal-to-noise and resolution effects. Wehave also applied the RL06 methodology to the outer MilkyWay data of Dame et al. (2001) rather than relying on pub-lished properties (e.g., Heyer et al., 2001). It is for thisreason that we have not included the cloud properties ofSolomon et al. (1987) in our plots, but we do make compar-isons to their work at the end of this section. Except wherenoted, we consider only clouds that are well-resolved by thetelescope beam; the GMCs must have angular diameters atleast twice that of the beam used to observe them.
Are we seeing single or multiple objects in the beam?The issue of velocity blending of multiple clouds in thebeam is much less of an issue in extragalactic observationsthan in the Galactic case, where the overwhelming major-ity of GMCs are observed only in the Galactic plane. Ex-tragalactic observations of all but the most highly inclinedgalaxies do not suffer from this problem and as can be seenin Figs. 1 – 4, the clouds are, in general, spatially well sep-arated, ensuring that we are almost always seeing only asingle GMC along the line of sight.
One of the long debated questions related to GMCs is:how does metallicity affect the value of XCO, the conver-sion factor from CO line strength to H2 column density?Fig. 6 is a plot of the virial mass of the GMCs as a func-tion of CO luminosity. Diagonal lines are lines of constantXCO. A compilation of XCO values is given in Table 2.We note first that most of the points lie above the dashedline that indicates the value determined from gamma-raysin the Milky Way (Strong and Mattox, 1996). A value ofXCO = 4 × 1020 cm−2(K km s−1)−1 would allow virialmasses to be derived to within about a factor of two for allof the GMCs in our sample, with the clouds in the SMC andthe outer Galaxy requiring a somewhat higher value.
Note, however, that the SMC clouds are systemati-cally higher in this plot than the GMCs for any othergalaxy, and that the GMCs in IC 10 are systematically abit lower. Solving for XCO in the SMC, gives a value of13.5 ×1020 cm−2(K km s−1)−1, more than a factor of 3above the mean. In contrast, IC 10 yields XCO = 2 × 10²⁰
cm−2(K km s−1)−1. Surprisingly, the galaxies differ inmetallicity from one another only by a factor of two, andboth are much less than solar. In M33, the metallicity de-creases by almost an order of magnitude from the center out(Henry and Howard, 1995), but Rosolowsky et al. (2003)find no change in XCO with radius. Although metallicitymay be a factor in determining XCO in different galaxies,there is no clear trend with metallicity alone – other factorsappear to be as important as the metallicity in determiningXCO.
The discrepancy between the Galactic gamma-ray valueof 2 ×1020 cm−2(K km s−1)−1 and the virial value we de-rive here is not necessarily a problem. Taken at face value,it may be telling us is that the GMCs are not in virial equi-librium, but are nearly gravitationally neutral: the overall
5
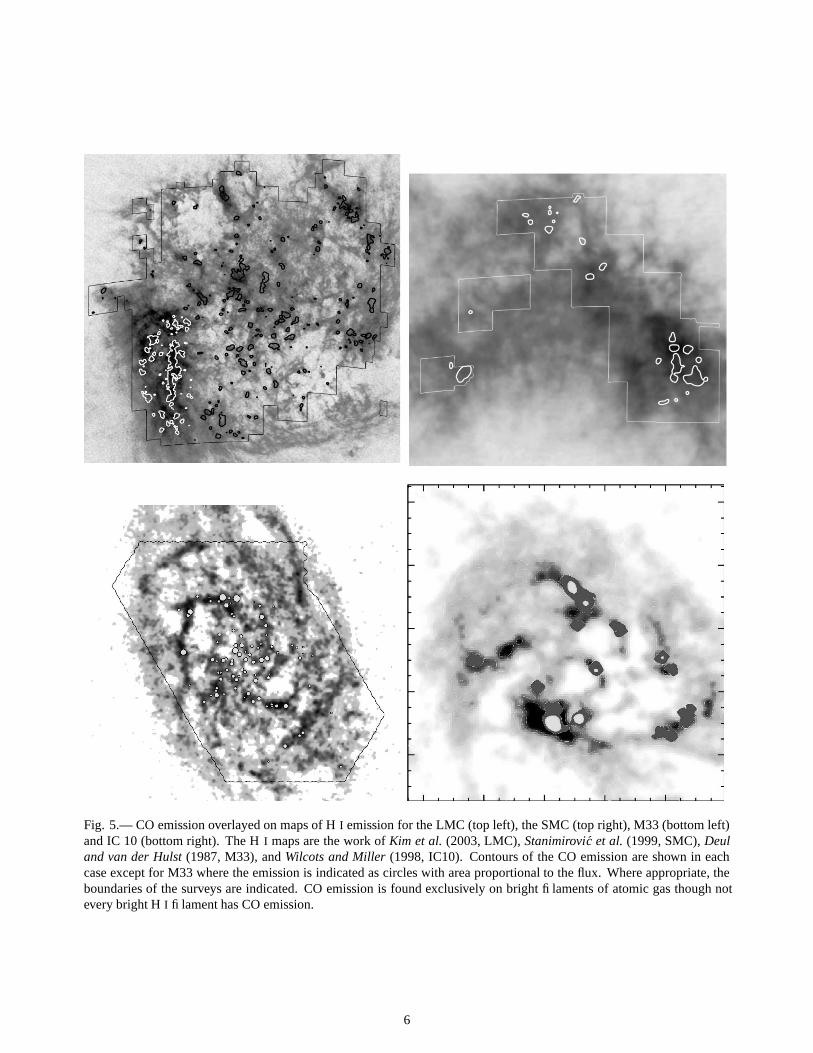
Fig. 5.— CO emission overlayed on maps of H I emission for the LMC (top left), the SMC (top right), M33 (bottom left)and IC 10 (bottom right). The H I maps are the work of Kim et al. (2003, LMC), Stanimirovic et al. (1999, SMC), Deuland van der Hulst (1987, M33), and Wilcots and Miller (1998, IC10). Contours of the CO emission are shown in eachcase except for M33 where the emission is indicated as circles with area proportional to the flux. Where appropriate, theboundaries of the surveys are indicated. CO emission is found exclusively on bright filaments of atomic gas though notevery bright H I filament has CO emission.
6

Fig. 6.— Plot of the virial mass of the GMCs in our sample as a function of luminosity. The value of XCO from gamma-rayinvestigations in the Milky Way (Strong and Mattox, 1996) is shown by the dashed line. The plot shows that while there are somedifferences in XCO from galaxy to galaxy, except for the SMC, a value of XCO = 4 × 1020 cm−2(K km s−1)−1 can be used for all ofthe other galaxies to a reasonable degree of approximation.
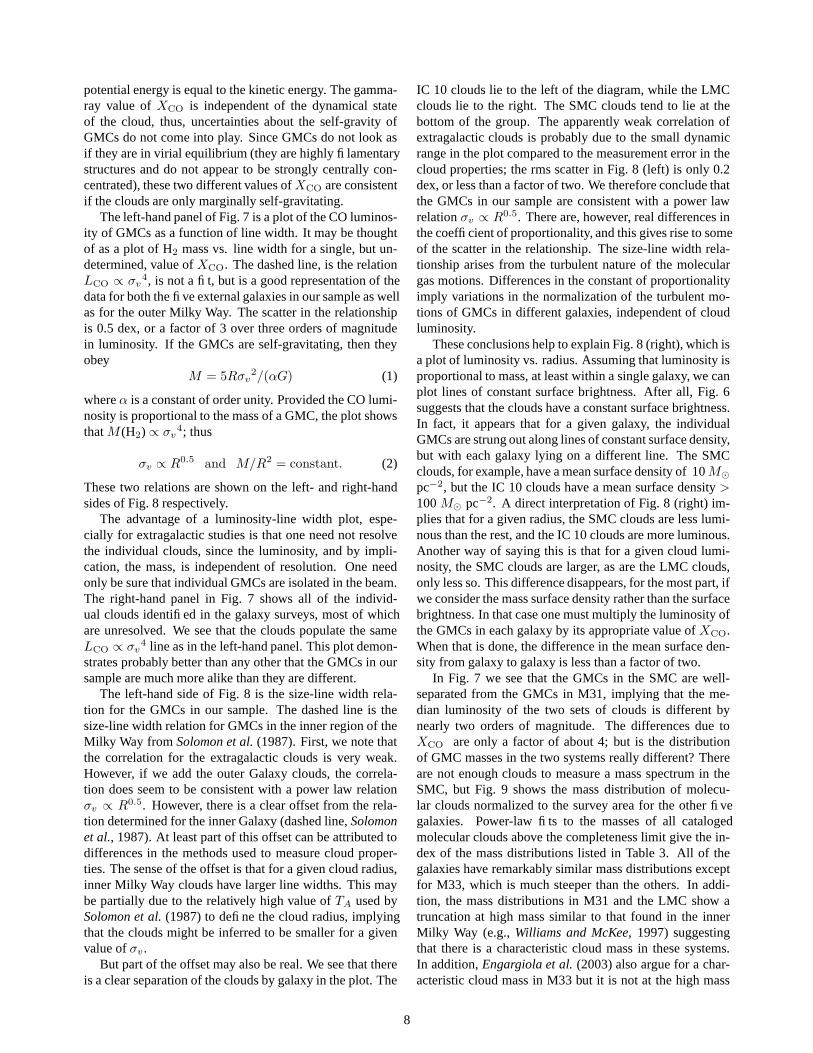
Fig. 7.— (Left) Luminosity vs. Line width plot for all of the resolved clouds in our survey. The dashed line, LCO ∝ σv
4, with a singleconstant of proportionality is a good representation of the data. (Right) The same as the left-hand panel but including the unresolvedclouds in our sample. The dashed line remains a good representation of the data even with much more data included.
7
potential energy is equal to the kinetic energy. The gamma-ray value of XCO is independent of the dynamical stateof the cloud, thus, uncertainties about the self-gravity ofGMCs do not come into play. Since GMCs do not look asif they are in virial equilibrium (they are highly filamentarystructures and do not appear to be strongly centrally con-centrated), these two different values of XCO are consistentif the clouds are only marginally self-gravitating.
The left-hand panel of Fig. 7 is a plot of the CO luminos-ity of GMCs as a function of line width. It may be thoughtof as a plot of H2 mass vs. line width for a single, but un-determined, value of XCO. The dashed line, is the relationLCO ∝ σv
4, is not a fit, but is a good representation of thedata for both the five external galaxies in our sample as wellas for the outer Milky Way. The scatter in the relationshipis 0.5 dex, or a factor of 3 over three orders of magnitudein luminosity. If the GMCs are self-gravitating, then theyobey
M = 5Rσv2/(αG) (1)
where α is a constant of order unity. Provided the CO lumi-nosity is proportional to the mass of a GMC, the plot showsthat M (H2) ∝ σv
4; thus
σv ∝ R0.5 and M/R2 = constant. (2)
These two relations are shown on the left- and right-handsides of Fig. 8 respectively.
The advantage of a luminosity-line width plot, espe-cially for extragalactic studies is that one need not resolvethe individual clouds, since the luminosity, and by impli-cation, the mass, is independent of resolution. One needonly be sure that individual GMCs are isolated in the beam.The right-hand panel in Fig. 7 shows all of the individ-ual clouds identified in the galaxy surveys, most of whichare unresolved. We see that the clouds populate the sameLCO ∝ σv
4 line as in the left-hand panel. This plot demon-strates probably better than any other that the GMCs in oursample are much more alike than they are different.
The left-hand side of Fig. 8 is the size-line width rela-tion for the GMCs in our sample. The dashed line is thesize-line width relation for GMCs in the inner region of theMilky Way from Solomon et al. (1987). First, we note thatthe correlation for the extragalactic clouds is very weak.However, if we add the outer Galaxy clouds, the correla-tion does seem to be consistent with a power law relationσv ∝ R0.5. However, there is a clear offset from the rela-tion determined for the inner Galaxy (dashed line, Solomonet al., 1987). At least part of this offset can be attributed todifferences in the methods used to measure cloud proper-ties. The sense of the offset is that for a given cloud radius,inner Milky Way clouds have larger line widths. This maybe partially due to the relatively high value of TA used bySolomon et al. (1987) to define the cloud radius, implyingthat the clouds might be inferred to be smaller for a givenvalue of σv .
But part of the offset may also be real. We see that thereis a clear separation of the clouds by galaxy in the plot. The
IC 10 clouds lie to the left of the diagram, while the LMCclouds lie to the right. The SMC clouds tend to lie at thebottom of the group. The apparently weak correlation ofextragalactic clouds is probably due to the small dynamicrange in the plot compared to the measurement error in thecloud properties; the rms scatter in Fig. 8 (left) is only 0.2dex, or less than a factor of two. We therefore conclude thatthe GMCs in our sample are consistent with a power lawrelation σv ∝ R0.5. There are, however, real differences inthe coefficient of proportionality, and this gives rise to someof the scatter in the relationship. The size-line width rela-tionship arises from the turbulent nature of the moleculargas motions. Differences in the constant of proportionalityimply variations in the normalization of the turbulent mo-tions of GMCs in different galaxies, independent of cloudluminosity.
These conclusions help to explain Fig. 8 (right), which isa plot of luminosity vs. radius. Assuming that luminosity isproportional to mass, at least within a single galaxy, we canplot lines of constant surface brightness. After all, Fig. 6suggests that the clouds have a constant surface brightness.In fact, it appears that for a given galaxy, the individualGMCs are strung out along lines of constant surface density,but with each galaxy lying on a different line. The SMCclouds, for example, have a mean surface density of 10 M�
pc−2, but the IC 10 clouds have a mean surface density >100 M� pc−2. A direct interpretation of Fig. 8 (right) im-plies that for a given radius, the SMC clouds are less lumi-nous than the rest, and the IC 10 clouds are more luminous.Another way of saying this is that for a given cloud lumi-nosity, the SMC clouds are larger, as are the LMC clouds,only less so. This difference disappears, for the most part, ifwe consider the mass surface density rather than the surfacebrightness. In that case one must multiply the luminosity ofthe GMCs in each galaxy by its appropriate value of XCO.When that is done, the difference in the mean surface den-sity from galaxy to galaxy is less than a factor of two.
In Fig. 7 we see that the GMCs in the SMC are well-separated from the GMCs in M31, implying that the me-dian luminosity of the two sets of clouds is different bynearly two orders of magnitude. The differences due toXCO are only a factor of about 4; but is the distributionof GMC masses in the two systems really different? Thereare not enough clouds to measure a mass spectrum in theSMC, but Fig. 9 shows the mass distribution of molecu-lar clouds normalized to the survey area for the other fivegalaxies. Power-law fits to the masses of all catalogedmolecular clouds above the completeness limit give the in-dex of the mass distributions listed in Table 3. All of thegalaxies have remarkably similar mass distributions exceptfor M33, which is much steeper than the others. In addi-tion, the mass distributions in M31 and the LMC show atruncation at high mass similar to that found in the innerMilky Way (e.g., Williams and McKee, 1997) suggestingthat there is a characteristic cloud mass in these systems.In addition, Engargiola et al. (2003) also argue for a char-acteristic cloud mass in M33 but it is not at the high mass
8

Fig. 8.— (left) Line width-size relation for the GMCs in our sample. The dashed line is the relation found for the GMCs in the innerMilky Way, showing a clear offset from the extragalactic GMCs. (Right) Luminosity vs. Radius relation for the GMCs in our sample.Solid lines are lines of constant surface density assuming XCO = 4 × 1020 cm−2(K km s−1)−1. The galaxies show clear differencesin CO luminosity for a given cloud radius.
Fig. 9.— Cumulative mass distribution for the Galaxies in our sample. The mass distributions have been normalized by the areasurveyed in each galaxy. In this figure, we use all clouds above the completeness limits in each survey, whether or not the clouds areresolved. All of the galaxies look similar except for M33 which has a steeper mass spectrum than the others.
9
end, as it is for the LMC and M31; rather it has a valueof 4 – 6 ×10⁴ M�. The variation in the mass distributionsis unexplained and may offer an avenue to understandingdifferences in star formation rates between galaxies.
4. THE ROLE OF HYDROSTATIC PRESSURE
A number of authors have speculated on the role thathydrostatic pressure plays in the formation of molecularclouds in the centers of galaxies (Helfer and Blitz, 1993;Spergel and Blitz, 1992), and galactic disks (Elmegreen,1993; Wong and Blitz, 2002; among others). Blitz andRosolowsky (2004) showed that if hydrostatic pressure isthe only parameter governing the molecular gas fraction ingalaxies, then one predicts that the location where the ratioof molecular to atomic gas is unity occurs at constant stellarsurface density. They probed this prediction and found thatthe constancy holds to within 40% for 30 nearby galaxies.
The functional form of the relationship between hydro-static pressure and molecular gas fraction has recently beeninvestigated by Blitz and Rosolowsky (2006) for 14 galax-ies covering 3 orders of magnitude in pressure. Hydrostaticpressure is determined by
Phydro = 0.84(GΣ∗)0.5Σg
vg
(h∗)0.5. (3)
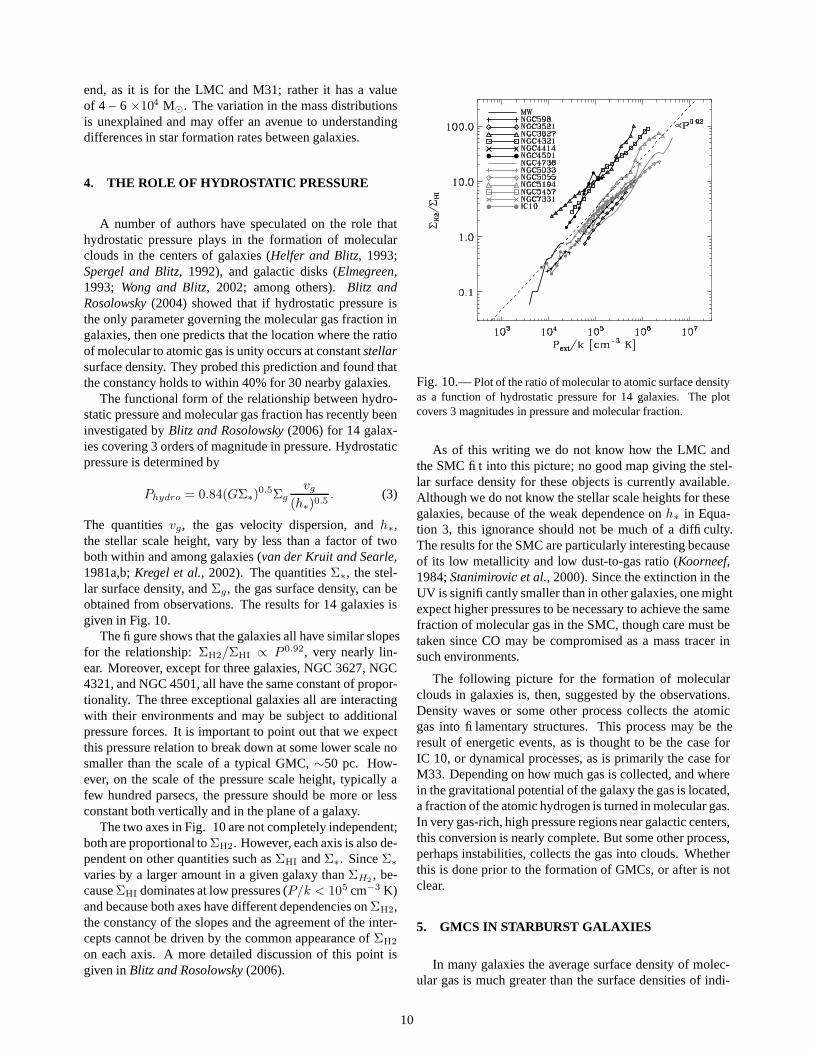
The quantities vg , the gas velocity dispersion, and h∗,the stellar scale height, vary by less than a factor of twoboth within and among galaxies (van der Kruit and Searle,1981a,b; Kregel et al., 2002). The quantities Σ∗, the stel-lar surface density, and Σg , the gas surface density, can beobtained from observations. The results for 14 galaxies isgiven in Fig. 10.
The figure shows that the galaxies all have similar slopesfor the relationship: ΣH2/ΣHI ∝ P 0.92, very nearly lin-ear. Moreover, except for three galaxies, NGC 3627, NGC4321, and NGC 4501, all have the same constant of propor-tionality. The three exceptional galaxies all are interactingwith their environments and may be subject to additionalpressure forces. It is important to point out that we expectthis pressure relation to break down at some lower scale nosmaller than the scale of a typical GMC, ∼50 pc. How-ever, on the scale of the pressure scale height, typically afew hundred parsecs, the pressure should be more or lessconstant both vertically and in the plane of a galaxy.
The two axes in Fig. 10 are not completely independent;both are proportional to ΣH2. However, each axis is also de-pendent on other quantities such as ΣHI and Σ∗. Since Σ∗
varies by a larger amount in a given galaxy than ΣH2, be-
cause ΣHI dominates at low pressures (P/k < 105 cm−3 K)and because both axes have different dependencies on ΣH2,the constancy of the slopes and the agreement of the inter-cepts cannot be driven by the common appearance of ΣH2
on each axis. A more detailed discussion of this point isgiven in Blitz and Rosolowsky (2006).
Fig. 10.— Plot of the ratio of molecular to atomic surface densityas a function of hydrostatic pressure for 14 galaxies. The plotcovers 3 magnitudes in pressure and molecular fraction.
As of this writing we do not know how the LMC andthe SMC fit into this picture; no good map giving the stel-lar surface density for these objects is currently available.Although we do not know the stellar scale heights for thesegalaxies, because of the weak dependence on h∗ in Equa-tion 3, this ignorance should not be much of a difficulty.The results for the SMC are particularly interesting becauseof its low metallicity and low dust-to-gas ratio (Koorneef,1984; Stanimirovic et al., 2000). Since the extinction in theUV is significantly smaller than in other galaxies, one mightexpect higher pressures to be necessary to achieve the samefraction of molecular gas in the SMC, though care must betaken since CO may be compromised as a mass tracer insuch environments.
The following picture for the formation of molecularclouds in galaxies is, then, suggested by the observations.Density waves or some other process collects the atomicgas into filamentary structures. This process may be theresult of energetic events, as is thought to be the case forIC 10, or dynamical processes, as is primarily the case forM33. Depending on how much gas is collected, and wherein the gravitational potential of the galaxy the gas is located,a fraction of the atomic hydrogen is turned in molecular gas.In very gas-rich, high pressure regions near galactic centers,this conversion is nearly complete. But some other process,perhaps instabilities, collects the gas into clouds. Whetherthis is done prior to the formation of GMCs, or after is notclear.
5. GMCS IN STARBURST GALAXIES
In many galaxies the average surface density of molec-ular gas is much greater than the surface densities of indi-
10
vidual GMCs shown in Fig. 8 (right; Helfer et al., 2003).These regions of high surface density can be as much as akiloparsec in extent. Indeed, about half of the galaxies in theBIMA SONG survey (Helfer et al., 2003) have central sur-face densities in excess of 100 M� pc−2. Moreover, regionswith high surface densities of molecular gas are invariablyassociated with dramatically enhanced star formation rates(Kennicutt, 1998). In regions of such high surface density,are there even individual, identifiable GMCs? If so, do theyobey the same relations shown in Figs. 6 – 8?
Several recent studies have begun to attack these ques-tions. The only such molecule-rich region in the LocalGroup is in the vicinity of the Galactic Center where cloudproperties were analyzed by Oka et al. (2001). They foundthat clouds in the Galactic center were smaller, denser andhad larger line widths than the GMCs in the Galactic disk.For targets beyond the Local Group, achieving the requisitespatial resolution to study individual GMCs requires signif-icant effort. To date, only a few extragalactic, molecule-richregions have been studied. Keto et al. (2005) show cloudsin M82 to be roughly in virial equilibrium. At the high sur-face densities of molecular gas observed in M82, this re-quires clouds to be smaller and denser than those found inthe Galactic disk. Similarly, Rosolowsky and Blitz (2005)observed the inner region of the Galaxy M64, which has asurface density of ∼ 100 M� pc−2 over the inner 300 pc ofthe galaxy. They found 25 GMCs with densities 2.5 timeshigher, and are 10 times more massive, on average, thantypical disk GMCs. This conclusion is quite robust againstdifferences in cloud decomposition because if some of theclouds they identify are in fact blends of smaller clouds,then the derived densities are lower limits, reinforcing theirconclusions. In M64, Rosolowsky and Blitz (2005) examinemany of the relationships shown in Figs. 7 and 8 and findthat all are significantly different.
5.1. GMC Formation in Galactic Centers
The peak H2 surface density in the central 1 kpc of M64is about 20 times the H I surface density (Braun et al., 1994;Rosolowsky and Blitz, 2005), which is typical of manygalaxies (Helfer et al., 2003). In such regions, the formationof GMCs cannot take place by first collecting atomic hydro-gen into filaments and then turning the gas molecular. If thegas is cycled between the atomic and molecular phases, asis required by the presence of H II regions in the centralregions of M64, then continuity requires that the amount oftime that the gas remains in each phase is roughly equal tothe ratio of surface densities at each particular radius. Thus,gas ionized by the O stars must quickly return to the molec-ular phase, which is catalyzed by the very large pressures inthe central region (Section 4). More than likely, the GMCsare formed and destroyed without substantially leaving themolecular phase, unlike what happens in the disks. Indeed,Rosolowsky and Blitz (2005) present evidence for a diffusemolecular component that is not bound into GMCs. Thusit seems likely that, as in galactic disks, the formation of
structure (filaments?) in galactic nuclei occurs before theformation of the GMCs. The gas, though, is largely molec-ular prior to the formation of the clouds.
Measuring the properties of individual GMCs in moredistant molecule-rich galaxies will rely upon future im-provements in angular resolution and sensitivity. Atpresent, some information can be gleaned from single-dish spectra of the regions in multiple tracers of molecu-lar gas. The observations of Gao and Solomon (2004) andNarayanan et al. (2005) show that the star formation rate islinearly proportional to the mass of molecular gas found athigh densities (≥ 105 cm−3), and that the fraction of densegas increases with the amount of molecular mass in the sys-tem. Since the fraction of molecular mass found at highdensities is relatively small in Galactic GMCs, this impliesthere are substantial differences in GMC properties in thesestarburst systems.
6. STAR FORMATION IN EXTRAGALACTIC GMCs
The evolution of GMCs substantially influences the evo-lution of galaxies. In particular, star formation in GMCsis a central event that affects galactic structure, energetics,and chemistry. A detailed understanding of star formationis therefore an important step for a better understanding ofgalaxy evolution.
6.1. Identification of Star Formation
In Galactic molecular clouds, we are able to study theformation of stars from high mass to low mass includingeven brown dwarfs. In all external galaxies, even those inthe Local Group, such studies are limited to only the high-est mass stars as a result of limited sensitivity. It is nonethe-less worthwhile to learn how high-mass stars form in GMCsbecause high-mass stars impart the highest energies to theISM via UV photons, stellar winds, and supernova explo-sions.
Young, high-mass stars are apparent at optical/radiowavelengths as the brightest members of stellar clustersor associations or by the Hα and radio continuum emis-sion from H II regions. The positional coincidence betweenthese signposts of star formation and GMCs is the mostcommon method of identifying the star formation asso-ciated with individual clouds. Such associations can bemade with reasonable confidence when the source densityis small enough that confusion is not important. When con-fusion becomes significant, however, conclusions can onlybe drawn by either making more careful comparisons athigher angular resolution should or by adopting a statisticalapproach.
11
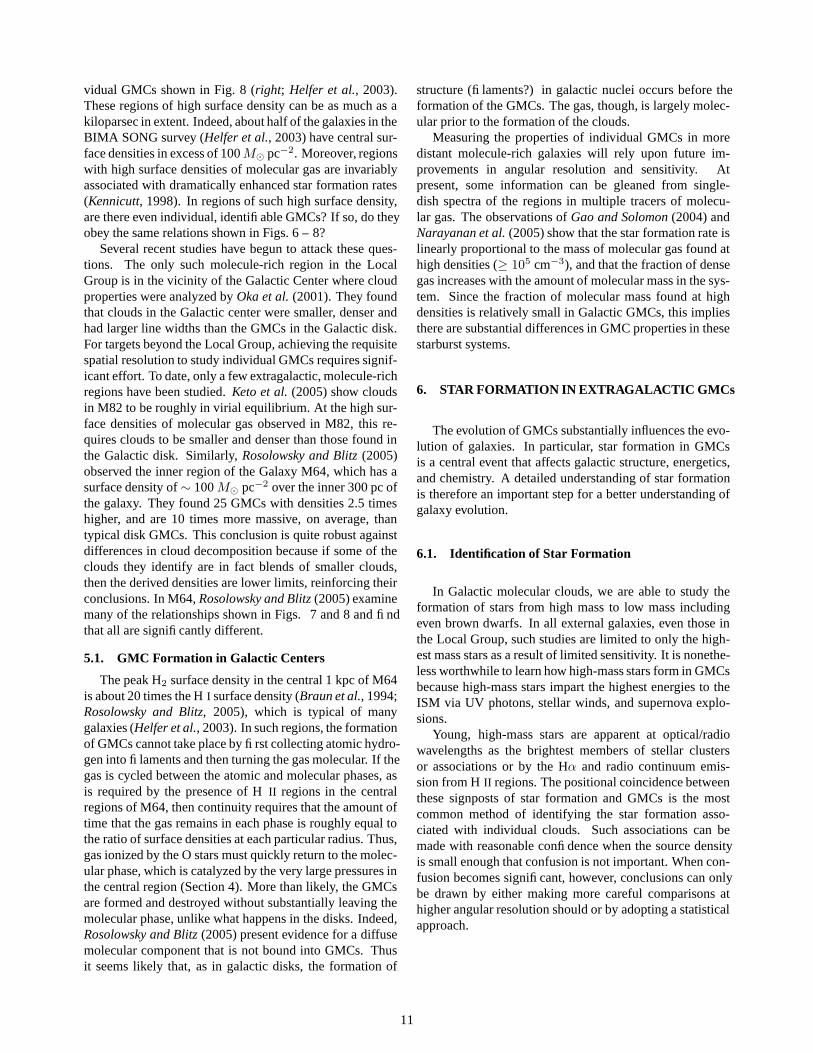
Fig. 11.— Histograms of the projected separation from the H II regions (Top left Davies et al. 1976) and clusters cataloged by Bica etal. (1996) to the neareset CO emission; (Top right) clusters with τ < 10 Myr (SWB 0), (Bottom left) clusters with 10 Myr < τ < 30Myr (SWB I), and (Bottom right) clusters with 30 Myr < τ (SWB II - VII), respectively. The lines represent the frequency distributionexpected if the same number of the clusters are distributed at random in the observed area.
6.2. The Large Magellanic Cloud
The most complete datasets for young stars are availablefor the LMC, which has a distance of 50 kpc. They includecatalogs of clusters and associations (e.g., Bica et al., 1996)and of optical and radio H II regions (Henize, 1956, Davieset al., 1976, Kennicutt and Hodge, 1986, Filipovic et al.,1998). The colors of the stellar clusters are studied in de-tail at four optical wavelengths and are classified into anage sequence from SWB0 to SWB VII, where SWB0 is theyoungest with an age of less than 10 Myr, SWB I in a range10–30 Myr, and so on (Bica et al., 1996). The sensitivitylimit of the published catalogs of star clusters is 14.5 mag(V ); it is not straightforward to convert this into the num-ber of stars since a stellar mass function must be assumed.The datasets of H II regions have a detection limit in Hαflux of 10−12 ergs cm−2 s−1, and the radio sensitivity limitat 5 GHz thermal emission corresponds to 20 mJy. Thefaintest detectable H II regions correspond to the ionizationby an O5 star if a single ionizing source is assumed. Wenote that the detection limit of H II regions is quite good,L(Hα) = 2 × 1036 ergs s−1, corresponding to one-fourth
the luminosity of the Orion Nebula.Using the first NANTEN CO survey (Fukui et al., 1999;
Mizuno et al., 2001b), the GMCs in the LMC were clas-sified into the three categories according to their associatedyoung objects (Fukui et al., 1999; Yamaguchi et al., 2001c):
I Starless GMCs (no early O stars); “starless” here in-dicates no associated early O star capable of ionizingan H II regions, which does not exclude the possibil-ity of associated young stars later than B-type
II GMCs with H II regions only; those with small H IIregions whose Hα luminosity is less than 1037 ergs−1
III GMCs with H II regions and stellar clusters; thosewith stellar clusters and large H II regions of Hα lu-minosity greater than 1037 erg s−1.
The new NANTEN GMC catalog (Fukui et al., 2006)is used to improve and confirm the statistics of these threeclasses (Kawamura et al., 2006). For the updated sample of181 GMCs in Fig. 1, Fig. 11 shows the frequency distribu-tion of the apparent separation of young objects, i.e., optical
12

Fig. 12.— Histograms of the mass of class I (Top), class II (Mid-dle), and class III (Bottom), respectively. Mass is derived by usingXCO= 5.4 ×1020 cm−2(K km s−1)−1 (Table 2).
H II regions and stellar clusters, measured from the low-est contour of the nearest GMC. Obviously, the youngeststellar clusters, SWB0 and H II regions, exhibit markedpeaks within 50-100 pc, indicating their strong concentra-tions towards GMCs. Comparisons of these distributionswith a purely random distribution is shown by lines. Thedifferences between these peaks are significant. The cor-relation with young clusters establishes the physical asso-ciation of the young objects with the GMCs. On the otherhand, clusters older than SWB I show almost no correlationwith GMCs.
In order to look for any optically obscured H II regionswe have also used the Parkes/ATNF radio continuum surveycarried out at five frequencies 1.4, 2.45, 4.75, 4.8, and 8.55GHz (Filipovic et al., 1995, 1998). The typical sensitivitylimits of these new datasets are quite good, allowing us toreach flux limits equivalent to those in Hα. The radio con-tinuum results are summarized in a catalog of 483 sources,and the spectral information makes it possible to select H IIregions and eliminate background sources not related theLMC. By comparing these data with the GMCs, we foundthat all of the starless GMCs have no embedded H II re-
Fig. 13.— Evolutionary sequence of the GMCs in the LMC.An example of the GMCs and illustration at each class are shownin the left panels and the middle column, respectively. The im-ages and contours in the left panels are Hα (Kim et al., 1999) andCO integrated intensity by NANTEN (Fukui et al., 2001; Fukuiet al., in preparation); contour levels are from K km s−1with 1.2K km s−1intervals. Crosses and filled circles indicate the positionof the H II regions and young clusters, SWB 0 (Bica et al., 1996),respectively. The number of the objects and the time scale at eachclass are also presented on the right.
gions that are detectable at radio wavelengths (Kawamuraet al., 2006).
Table 4 summarizes the results of the present comparisonbetween GMCs and young objects, SWB0 clusters and theH II regions including radio sources. It shows that ∼ 25%of the GMCs are starless in the sense that they are not as-sociated with H II regions or young clusters. Fig. 12 showsmass histograms of the three classes, I, II and III. These in-dicate that the mass range of the three is from 104.5M� to afew times 106M�. It is also noteworthy that class I GMCstend to be less massive than the other two in the sense thatthe number of GMCs more massive than 105M� is abouthalf of those of class II and class III GMCs, respectively.
6.3. The Evolution of GMCs in the LMC
The completeness of the present GMC sample cover-ing the whole LMC enables us to infer the evolutionarytimescales of the GMCs. We assume a steady state evolu-tion and therefore time spent in each phase is proportional
13

TABLE 4
ASSOCIATION OF THE YOUNG OBJECTS WITH GMCS
Class of GMC Number of GMCsa Time scaleb Association(Myr)
Class I 44 (25.7 %) 7 StarlessClass II 88 (51.5 %) 14 H II regionsClass III 39 (22.8 %) 6 H II regions and clustersc
aGMCs with M > 104.5M�; mass is derived by using XCO= 5.4 ×10²⁰
cm−2(K km s−1)−1 (Table 2).
bA steady state evolution is assumed. The absolute time scale is based on the ageof stellar clusters; the age of SWB0 clusters, a half of which are associated with theGMCs, is taken to be 10 Myr.
cYoung clusters or associations, SWB 0, by Bica et al. (1996).
to the number of objects in Table 4. Fig. 13 is a schemerepresenting the evolution suggested from Table 4. The ab-solute time scale is based on the age of stellar clusters: theage of SWB 0 clusters is taken to be 10 Myr. The first stagecorresponds to starless GMCs, having a long time scale of7 Myr. This is followed by a phase with small H II regions,implying the formation of a few to several O stars. The sub-sequent phase indicates the most active formation of richclusters including many early O stars (one of such an ex-ample is N 159N). In the final phase, the GMC has beenmore or less dissipated under the strong ionization and stel-lar winds from O stars. The lifetime of a typical GMC inthe LMC is then estimated as the total of the timescales inTable 4: ∼ 27 Myr, assuming that the GMC is completelydisrupted by the star formation. As noted earlier (Section6), the mass of class I GMCs tends to be smaller than therest. We may speculate that class I GMCs, and possiblypart of class II GMCs, are still growing in mass via massaccretion from their surrounding lower density atomic gas.In addition, the lifetime of GMCs likely varies with cloudmass, so 27 Myr is only a characteristic value and is proba-bly uncertain by about 50%.
6.4. Star Formation in M 33
None of the other galaxies in our sample has as com-plete a record of interstellar gas and star formation as doesthe LMC, which is due, in part, to its proximity. Never-theless, it is possible to draw some conclusions about thestar formation in M33. Engargiola et al. (2003) corre-lated the H II regions cataloged by Hodge et al. (1999)with the 149 GMCs in the M33 catalog. For reference, thecompleteness limit of the Hodge et al. (1999) cataloge isL(Hα) = 3 × 1035 erg s−1; a similar range of H II regionsis cataloged in the LMC and M33. Engargiola et al. (2003)assumed that an H II region is associated with a GMC ifits boundary lies either within or tangent to a GMC; 36%
of the flux from H II regions can be associated with thecataloged GMCs. Correcting for the incompleteness of theGMCs cataloged below their sensitivity limit suggests that> 90% of the total flux of ionized gas from M33 originatesfrom GMCs. Within the uncertainties, essentially all of theflux from H II regions is consistent with an origin in GMCs.Apparently, about half of the star formation in M33 origi-nates in GMCs below the the sensitivity limit of our survey.
A related question is to ask, what fraction of GMCs inM33 is actively forming stars? Engargiola et al. (2003)counted the fraction of GMCs with at least one H II re-gion having a separation ∆r. They defined the correlationlength, such that half the GMCs have at least one H II regionwithin this distance. The correlation length for the GMCsand H II regions is 35 pc; a random distribution of GMCsand H II regions would return a correlation length of 80 pc.They assumed that a GMC is actively forming stars if thereis an H II region within 50 pc of the centroid of a GMC.With this assumption, as many as 100 GMCs (67 %) areforming massive stars. Of the 75 GMCs with masses abovethe median cataloged mass, the fraction of clouds activelyforming stars rises to 85%. They estimate that the numberof totally obscured H II regions affect these results by atmost 5%.
Thus the fraction of GMCs without star formation is esti-mated to be about 1/3, a fraction similar to that in the LMC.The M33 study estimated the lifetime of GMCs to be ∼ 20Myr, also similar to that found for the LMC. The fractionof clouds without active star formation is much higher thanthat found in the vicinity of the Sun where only one of allof the GMCs within 2 kpc is found to be devoid of star for-mation. It is unclear whether this difference is significant.Neither the LMC analysis, nor the M33 analysis would de-tect the low-mass star formation which it is proceeding inthe Taurus molecular clouds. In any event, both the LMCand M33 studies suggest that the fraction of clouds withoutstar formation is small. Thus the onset of star formation inGMCs is rather rapid not only in the Milky Way, but in at
14

least some lower mass spiral and irregular galaxies.
7. FUTURE PROSPECTS
Studying GMCs in galaxies using CO emission requiresspatial resolutions higher than 30–40 pc. It will be pos-sible to extend studies such as ours to a few tens of Mpcsoon, with the advent of ALMA and CARMA arrays in thesouthern and northern hemispheres respectively. These in-struments will provide angular resolutions of 0.1–1 arcsecin millimeter and sub-millimeter CO emission, correspond-ing 5–50 pc at 10 Mpc and will provide unprecedented de-tails of physical conditions in GMCs in galaxies. The workdescribed in this chapter should be just the beginning of ex-tragalactic GMC studies.
8. SUMMARY AND CONCLUSIONS
We have compared the properties of GMCs in 5 galax-ies, four of which have been surveyed in their entirety: theLMC, the SMC, M33, IC 10. M31 was observed over a verylimited area. The interstellar medium of all five galaxies isdominated by the atomic phase.
1. The GMCs do not, in general, show any relationshipto the stellar content of the galaxies except for the Ostars born in the GMCs.
2. There is a very good correlation between the loca-tions of the GMCs and filaments of H I. Many fila-ments contain little of no molecular gas even thoughthey have similar surface densities compared to thosethat are rich in GMCs. This suggests that clouds formfrom the H I rather than vice-versa.
3. There appears to be a clear evolutionary trend go-ing from filament formation → molecule formation→ GMC formation. It is not clear however, whetherthe condensations that form GMCs are first formed inthe atomic filaments, or only after the molecules haveformed.
4. We derive XCO for all of the galaxies assuming thatthe GMCs are virialized. Although there is somevariation, a value of XCO = 4 × 1020 cm−2 (Kkm s−1)−1 is a representative value to within about50% except for the SMC, which has a value morethan 3 times higher. There is no clear trend ofXCO with metallicity.
5. The discrepancy between the virial value and thevalue determined from γ-ray observations in theMilky Way suggests that the GMCs are not virialized,if the γ-ray value is applicable to other galaxies in theLocal Group. In that case, a value of XCO = 2×10²⁰
cm−2 (K km s−1)−1 may be more appropriate.
6. The GMCs in our sample appear to satisfy the linewidth-size relation for the Milky Way, but with anoffset in the constant of proportionality. This offsetmay be due, at least in part, to the different data anal-ysis techniques for the MW and extragalactic datasets. For a given line width, the extragalactic cloudsappear to be about 50 % larger. Despite the system-atic offset, there are small but significant differencesin the line width-size relationship among GMCs indifferent galaxies.
7. The GMCs within a particular galaxy have a roughlyconstant surface density. If the value of XCO we de-rive for each galaxy is applied, the surface densitiesof the sample as a whole, have a scatter of less than afactor of two.
8. The mass spectra for the GMCs in all of the galaxiescan be characterized as a power law with a slope of ∼−1.7, with the exception of M33, which has a slopeof −2.5.
9. The ratio of H2 to H I on a pixel-by-pixel basis ingalaxies appears to be determined by the hydrostaticpressure in the disk.
10. About 1/4 – 1/3 of the GMCs in the LMC and M33appear to be devoid of high-mass star formation.
11. The association of stars and H II regions in the LMCsuggests a lifetime for the GMCs of about 27 Myr,with a quiescent phase that is about 25% of the ageof the GMCs. In M33, a lifetime of ∼ 20 Myr ismeasured. For GMCs in these galaxies we estimatethat typical lifetimes are roughly 20–30 Myr. Bothlifetimes are uncertain by about 50%.
Acknowledgments.This work is partially supportedby US National Science Foundation under grants AST-0228963 and AST-0502605, a Grant-in-Aid for ScientificResearch from the Ministry of Education, Culture, Sports,Science and Technology of Japan (No. 15071203), andfrom JSPS (No. 14102003). The NANTEN project is basedon a mutual agreement between Nagoya University and theCarnegie Institution of Washington (CIW). We greatly ap-preciate the hospitality of all the staff members of the LasCampanas Observatory of CIW. We are thankful to manyJapanese public donors and companies who contributed tothe realization of the project. We would like to acknowl-edge Drs. L. Stavely-Smith and M. Filipovic for the kinduse of their radio continuum data prior to publication.
REFERENCES
Allen R. J. (2001) In ASP Conf. Ser. 240: Gas and Galaxy Evolu-tion 240, (J. Hibbard and J. van Gorkom, eds.), pp. 331-337.ASP Conf. Series, San Francisco.
15

Bica E., Claria J. J., Dottori H., Santos J. F. C. Jr., and Piatti A. E.,(1996) Astrophys. J. Suppl., 102, 57-73.
Blitz L. and Rosolowsky E. (2004), Astrophys. J., 612, L29-L32.Blitz L. and Rosolowsky E. (2006), submitted.Bolatto A. et al. (2006), in preparation.Braun R., Walterbos R. A. M., Kennicutt R. C., and Tacconi L. J.
1994, Astrophys. J., 420, 558-569.Cohen R. S., Dame T. M., Garay G., Montani J., Rubio M., and
Thaddeus P. 1988, Astrophys. J., 331, L95-L99.Dame T., M., Hartmann D., and Thaddeus P. (2001) Astrophys.
J.547, 792-813.Davies R. D., Elliott K. H., and Meaburn J. (1976) Mem. R. As-
tron. Soc., 81, 89-128.de Boer K. S., Braun J. M., Vallenari A., and Mebold U. (1998),
Astron. Astrophys., 329, L49-L52.Deul E. R. and van der Hulst J. M. (1987) Astron. Astrophys.
Suppl.67, 509-539.Elmegreen B. G. (1993), Astrophys. J., 411, 170-177.Engargiola G., Plambeck R. L, Rosolowsky E., and Blitz L. (2003)
Astrophys. J. Suppl., 149, 343-363.Filipovic M. D., Haynes R. F., White G. L., Jones P. A., Klein
U., and Wielebinski R. (1995), Astron. Astrophys. Suppl., 111,311-332.
Filipovic M. D., Haynes R. F., White G. L., and Jones P. A. (1998),Astron. Astrophys. Suppl., 130, 421-440.
Fujimoto M. and Noguchi M. (1990) Publ. Astron. Soc. Japan,42, 505-516.
Fukui Y., Mizuno N., Yamaguchi R., Mizuno A., Onishi T., etal. (1999) Publ. Astron. Soc. Japan, 51, 745-749.
Fukui Y., Mizuno N., Yamaguchi R., Mizuno A., and Onishi T.(2001) Publ. Astron. Soc. Japan Letters, 53, L41-L44.
Fukui Y. et al. (2006), in preparation.Gao Y. and Solomon P. M. (2004), Astrophys. J., 606, 271-290.Gerola H. and Seiden P. E. (1978) Astrophys. J., 223 129-135.Helfer T. T. and Blitz L. (1993), Astrophys. J., 419, 86-93.Helfer T. T., Thornley M. D., Regan M. W., Wong T., Sheth K.,
Vogel S. N., Blitz L., and Bock D. C.-J. (2003), Astrophys. J.Suppl., 145, 259-327.
Henize K. G. (1956), Astrophys. J. Suppl., 2, 315-344.Henry R. B. C. and Howard J. W. (1995), Astrophys. J., 438, 170-
180.Heyer M. H., Carpenter J. M., and Snell R. L. (2001), Astrophys.
J., 551, 852-866.Hodge P. W., Balsley J., Wyder T. K., and Skelton B. P. (1999),
Publ. Astron. Soc. Pac., 111, 685-690.Jarrett T. H., Chester T., Cutri R., Schneider S. E., and Huchra J. P.
(2003), Astron. J., 125, 525-554.Kawamura A. et al. (2006) in preparation.Kennicutt R. C. (1998), Astrophys. J., 498, 541-552.Kennicutt R. C. Jr. and Hodge P. W. (1986) Astrophys. J., 306,
130-141.Keto E., Ho L., and Lo K.Y. (2005), astro-ph/0508519.Kim S., Staveley-Smith L., Dopita M. A., Freeman K. C., Sault
R. J., Kesteven M. J., and McConnell D. (1998), Astrophys. J.,503, 674-688.
Kim S., Staveley-Smith L., Dopita M. A., Sault R. J., FreemanK. C., Lee Y., and Chu Y.-H. (2003), Astrophys. J. Suppl., 148,473-486.
Kregel M., van der Kruit P. C., and de Grijs R. 2002, Mon. Not. R.Astron. Soc., 334, 646-668.
Koornneef J. (1984) In IAU Symp. 108, Structure and Evolution ofthe Magellanic Clouds, (S. van den Bergh and K. S. de Boer,
eds.), pop. 333-339, D. Reidel, Dordrecht.Lada C. J., Margulis M., Sofue Y., Nakai N., and Handa T. (1988),
Astrophys. J., 328, 143-160.Leroy A., Bolatto, A., Walter, F., and Blitz, L. (2006), Astrophys.
J., in press.Massey P., Hodge P. W., Holmes S., Jacoby G., King N. L., Olsen
K., Saha A., and Smith C. (2001), Bull. Am. Astron. Soc., 33,1496.
Mizuno N., Rubio M., Mizuno A., Yamaguchi R., Onishi T., andFukui Y. (2001a), Pub. of Astron. Soc. Japan, 53, L45-L49.
Mizuno N., Yamaguchi R., Mizuno A., Rubio M., Abe R., SaitoH., Onishi T., Yonekura Y., Yamaguchi N., Ogawa H., andFukui Y. (2001b), Pub. of Astron. Soc. Japan, 53, 971-984.
Mizuno N. et al. (2006) in preparation.Narayanan D., Groppi C. E., Kulesa C. A., and Walker C. K.
(2005), Astrophys. J., 630, 269-279.Oka T., Hasegawa T., Sato F., Tsuboi M., Miyazaki A., and Sugi-
moto M. (2001), Astrophys. J., 562, 348-362.Regan M. and Vogel S. (1994) Astrophys. J., 434, 536-545.Rosolowsky E. (2006), Astrophys. J., submitted.Rosolowsky E. and Leroy A. (2006), Publ. Astron. Soc. Pac., in
press.Rosolowsky E. and Blitz L. (2005) Astrophys. J.623 826-845.Rosolowsky E., Plambeck R., Engargiola G., and Blitz L. (2003)
Astrophys. J.599 258-274.Rubio M., Garay G., Montani J., and Thaddeus P. (1991), Astro-
phys. J., 368, 173-177.Solomon P. M., Rivolo A. R., Barrett J. and Yahil A. (1987) Astro-
phys. J.319, 730-741.Spergel D. N. and Blitz L. (1992), Nature, 357, 665-667.Stanimirovic S., Staveley-Smith L., Dickey J. M., Sault R. J., and
Snowden S. L. (1999), Mon. Not. R. Astron. Soc., 302, 417-436.
Stanimirovic S., Staveley-Smith L., van der Hulst J. M., BontekoeT. R., Kester D. J. M., and Jones P. A. (2000), Mon. Not. R.Astron. Soc., 315, 791-807.
Strong A. W. and Mattox J. R. (1996) Astron. Astrophys., 308,L21-L24.
van der Kruit P. C. and Searle L. (1981a), Astron. Astrophys., 95,105-115.
van der Kruit P. C. and Searle L. (1981b), Astron. Astrophys., 95,116-126.
Vogel S. N., Boulanger F., and Ball R. (1987), Astrophys. J., 321,L145-L149.
Wilcots E. M. and Miller B. W. (1998) Astron. J.116, 2363-2394.Williams J. P. and McKee C. F. (1997), Astrophys. J., 476, 166-
183.Wilson C. D. (1994), Astrophys. J., 434, L11-L14.Wilson C. D. and Reid I. N. (1991), Astrophys. J., 366, L11-L14.Wilson C. D. and Rudolph A. L. (1993), Astrophys. J., 406, 477-
481.Wilson C. D. and Scoville N. (1990) Astrophys. J., 363, 435-450.Wong T. and Blitz L. (2002), Astrophys. J., 569, 157-183.Yamaguchi R., Mizuno N., Onishi T., Mizuno A., and Fukui Y.
(2001a), Astrophys. J., 553, L185-L188.Yamaguchi R., Mizuno N., Onishi T., Mizuno A., and Fukui Y.
(2001b), Pub. of Astron. Soc. Japan, 53, 959-969.Yamaguchi R., Mizuno N., Mizuno A., Rubio M., Abe R.,Saito
H., Moriguchi Y., Matsunaga L., Onishi T., Yonekura Y., andFukui Y. (2001c), Pub. of Astron. Soc. Japan, 53, 985-1001.
16