the likely return of el niño implications for the 2014 arizona monsoon season & beyond daniel...
TRANSCRIPT

The Likely Return of El Niño
Implications for the 2014 ArizonaMonsoon Season & Beyond
Daniel Henz Meteorologist, Flood Warning Branch
Flood Control District of Maricopa County
2014 Monsoon Outlook and Beyond • June 18, 2014 • Phoenix, Arizona

2014 Monsoon Outlook and Beyond • June 18, 2014 • Phoenix, Arizona
Topics For Today
• El Niño is forecast to make its triumphant return!
• Current conditions in the Equatorial Pacific Ocean
• Rainfall from a historical perspective
• 2014 AZ Monsoon and Cold Season rainfall outlooks

El Niño is Spanish for…“The Niño!”
• National Geographic Clip: http://youtu.be/5gVe06xi9r4
• NASA Clip: http://youtu.be/VgYo1OGW0mE
2014 Monsoon Outlook and Beyond • June 18, 2014 • Phoenix, Arizona
Image Courtesy of SNL

• An El Niño Watch is issued when conditions are favorable for the development of El Niño conditions within then next 6-months.
???
?
Expectation that the 3-month Oceanic Niño Index (ONI) threshold will be met
-0.2
An atmospheric response typically associated with El Niño is observed over the equatorial Pacific region
El Niño WATCH Issued This Spring
2014 Monsoon Outlook and Beyond • June 18, 2014 • Phoenix, Arizona
A 1-month positive SST anomaly of >0.5°C is observed in the Niño 3.4 region of the equatorial Pacific Ocean.
Niño 4Niño 1+2
Niño 3.4
Niño 3

Current Observations
2014 Monsoon Outlook and Beyond • June 18, 2014 • Phoenix, Arizona

CPC ENSO Forecast
Neutral
La Niña
El Niño
2014 Monsoon Outlook and Beyond • June 18, 2014 • Phoenix, Arizona
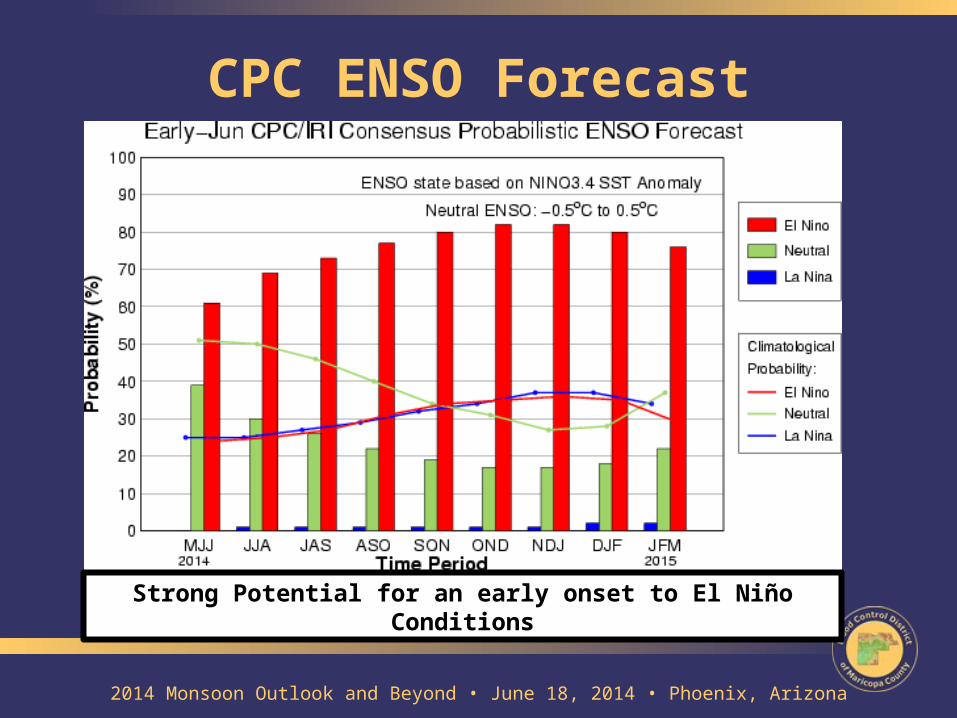
CPC ENSO Forecast
Strong Potential for an early onset to El Niño Conditions
2014 Monsoon Outlook and Beyond • June 18, 2014 • Phoenix, Arizona

• Current SST Anomalies in all Niño regions are greater than 0°C. Niño 3.4 Zone is currently ≈ 0.6°C
• Several periods during Jan-April with westerly wind bursts. More recently, developing low level westerly winds across eastern Pacific.
• Model Guidance suggesting more than five consecutive 3-month periods of SST Anomalies > 0.5°C
• Increasing chances of El Niño development through the remainder of the year, exceeding 70% by early summer and 80% during the fall and winter.
Summary
2014 Monsoon Outlook and Beyond • June 18, 2014 • Phoenix, Arizona

• El Niño climate signal is less noticeable during the summer months across the Desert Southwest, especially during the onset due to lag in atmospheric response.
• Increase in SSTs anomalies across Eastern Pacific and Gulf of California
• Monsoon Ridge (high pressure center), irregularities in general positioning and strength.
• Link with Active Eastern Pacific Hurricane Season:– El Niño decreases the vertical wind shear over the eastern
tropical pacific making the atmosphere more conducive for hurricane development.
What to Expect this Summer
2014 Monsoon Outlook and Beyond • June 18, 2014 • Phoenix, Arizona

The Monsoon Ridge(July-August)
2014 Monsoon Outlook and Beyond • June 18, 2014 • Phoenix, Arizona
Climatology (1981-2010)
El Niño (1982, 1997)

Time Period: 1950-Present
16 episodes of El Niño were found in this study. Years where El Niño signal persisted through the following year were considered one event.
Historical El Niño Episodes
2014 Monsoon Outlook and Beyond • June 18, 2014 • Phoenix, Arizona
ONI Anamoly Strength (Lader,
2012)Weak: 0.5°C – 0.9°CModerate: 1.0°C – 1.8°CStrong: >1.8°C
El Niño Episodes since 1950Year Strength Start Onset Timing
1951 Weak JJA Summer
1957 Moderate MAM Spring
1963 Weak MJJ Late Spring/Summer
1965 Moderate AMJ Mid Spring
1968 Weak JAS Mid Summer
1972 Moderate AMJ Mid Spring
1976 Weak ASO Late Summer/Fall
1982 Strong AMJ Mid Spring
1986 Moderate JAS Mid Summer
1991 Moderate AMJ Mid Spring
1994 Moderate ASO Late Summer/Fall
1997 Strong AMJ Mid Spring
2002 Moderate AMJ Mid Spring
2004 Weak JJA Summer
2006 Weak ASO Late Summer/Fall
2009 Moderate JJA Summer

June 15th - Sept 30th Rainfall, Onset Year El Niño Episode Phoenix Tucson Yuma Flagstaff *** El Paso Albuquerque
Onset Year 2.71" 6.08" 1.29" 7.93" 5.14" 4.12"1951 6.96" 4.49" 1.68" 10.57" 3.24" 3.12"1957 1.57" 5.26" 1.03" 4.81" 6.87" 3.80"1963 2.71" 5.97" 2.58" 6.07" 2.19" 5.06"1965 1.85" 4.07" 0.05" 8.50" 2.97" 3.95"1968 2.29" 3.09" 1.01" 4.94" 7.80" 5.12"1972 3.84" 8.01" 0.27" 7.46" 5.11" 5.25"1976 3.38" 3.19" 0.56" 5.56" 5.13" 3.10"1982 2.52" 7.46" 1.32" 7.38" 6.94" 3.84"1986 2.94" 5.70" 0.89" 20.64" 7.23" 6.84"1991 1.07" 4.15" 0.60" 3.53" 6.58" 5.34"1994 2.01" 2.58" 1.50" 0.23" 4.80"1997 2.01" 4.26" 5.14" 6.90" 4.14" 6.58"2002 1.68" 5.79" Trace 7.61" 2.75" 4.11"2004 1.10" 2.42" Trace 7.96" 6.56" 4.06"2006 3.33" 10.20" 0.24" 8.79" 15.28" 9.42"2009 0.87" 2.86" 1.76" 2.87" 5.82" 3.96"
Historical Monsoon Rainfall
POR Average Below Normal Above Normal
Normal Well Below Normal Well Above Normal
Missing AZ Tropical System June 1-Sept 30 Total ***
2014 Monsoon Outlook and Beyond • June 18, 2014 • Phoenix, Arizona
90-110%
75-90%
< 75% > 125%
110-125%
DRIER THAN
AVERAGE
WETTER THAN
AVERAGE

30 year average, 2.84”

Onset year Moderate/Strong El Niño

• Normal to below normal rainfall for each AZ location during the Monsoon season when averaged across all El Niño episodes.
• Tropical systems/remnants moving through AZ late season dirty the climate signal i.e. 1951, 1997, 2006.
• Below average rainfall does not mean a reduced flooding threat. El Niño has no effect on the strength of Monsoon t-storms. All the hazards associated with Monsoon Season still present.
Summary
2014 Monsoon Outlook and Beyond • June 18, 2014 • Phoenix, Arizona
Monsoon Rainfall, Percent of Normal During Onset of El NiñoEl Niño Episodes Maricopa County * Phoenix Tucson Yuma Flagstaff
Strength # of Events 2.84 2.71 6.08 1.29 7.93Weak 6 111.1% 121.6% 80.5% 78.4% 92.2%Moderate 8 73.9% 73.0% 79.0% 59.1% 99.8%Strong 2 105.7% 83.6% 96.4% 250.4% 90.0%All Episodes 16 87.2% 92.6% 81.7% 90.3% 95.5%* Maricopa Count Rainfall: 8 total El Niño Episodes (2 Weak, 5 Moderate, 1 Strong)

CPC 3-month Outlook(July-August-September)
2014 Monsoon Outlook and Beyond • June 18, 2014 • Phoenix, Arizona

Fall/Winter Seasons
• Large Scale Impacts:– Persistent and extended Pacific
Jet Stream.
– Southward shift of storm track.
– Cyclone genesis area amplified west of CA as opposed to Pac-NW.
– Wet/Cool across Southern US & Dry/mild across northern US.
2014 Monsoon Outlook and Beyond • June 18, 2014 • Phoenix, Arizona
Typically, the El Niño Climate signal is more evident during the winter months across U.S.

Historical “Cold Season” Rainfall
POR Average Below Normal Above Normal
Normal Well Below Normal Well Above Normal
November - April Rainfall, Following El Niño Onset Phoenix Tucson Yuma Flagstaff El Paso Albuquerque
Following Onset 4.15" 4.19" 1.76" 10.66" 2.35" 2.65"1951-1952 6.30" 6.35" 1.77" 15.67" 3.78" 2.14"1957-1958 4.30" 4.90" 2.22" 12.30" 4.92" 4.37"1963-1964 1.43" 3.09" 1.11" 8.21" 1.83" 2.22"1965-1966 5.75" 10.09" 2.89" 14.98" 2.52" 2.51"1968-1969 4.34" 4.36" 0.87" 15.23" 1.88" 4.00"1972-1973 5.82" 5.79" 1.73" 19.44" 4.27" 5.32"1976-1977 2.02" 3.99" 1.11" 5.98" 2.35" 3.15"1982-1983 9.36" 6.95" 3.88" 20.22" 5.72" 3.82"1986-1987 4.51" 5.56" 0.74" 10.06" 4.24" 4.07"1991-1992 8.38" 7.56" 3.49" 18.10" 5.89" 5.07"1994-1995 6.79 9.09" 1.80 14.98 3.75" 3.79"1997-1998 5.91" 8.77" 4.35" 11.36" 2.62" 5.51"2002-2003 4.98" 2.52" 1.21" 6.63" 3.22" 3.32"2004-2005 7.42 4.07" 3.96" 23.12 5.17" 7.12"2006-2007 2.27" 2.11" 0.06" 3.57" 2.44" 4.10"2009-2010 5.40" 5.17" 3.80" 13.02" 4.04" 1.98"
2014 Monsoon Outlook and Beyond • June 18, 2014 • Phoenix, Arizona
90-110%
75-90%
< 75% > 125%
110-125%

2013
2012
2011
2010
2009
2008
2007
2006
2005
2004
2003
2002
2001
2000
1999
1998
1997
1996
1995
1994
1993
1992
1991
1990
1989
1988
1987
1986
1985
1984
1983
0.00
1.00
2.00
3.00
4.00
5.00
6.00
7.00
8.00
9.00
10.00
11.00
12.00
13.00
14.00
Average Cold Season RainfallFlood Control District of Maricopa County ALERT Rain Gages
Water Year
Rain
fall
(inch
es)
Rainfall Period: November 15th through April
15th of each Water Year
Number of gages usedin the analy-
sis35
Rainfall Period: November 15th through April
15th of each Water Year
Number of gages usedin the analy-
sis
38
Rainfall Period: November 15th through April
15th of each Water Year
Number of gages usedin the analy-
sis
5244
50
4161 76
93
100113
126
156171
186191
205 212
223238
252263
265267
264267
264262
262260
267
”year average, 4.40 30

2013
2012
2011
2010
2009
2008
2007
2006
2005
2004
2003
2002
2001
2000
1999
1998
1997
1996
1995
1994
1993
1992
1991
1990
1989
1988
1987
1986
1985
1984
1983
0.00
1.00
2.00
3.00
4.00
5.00
6.00
7.00
8.00
9.00
10.00
11.00
12.00
13.00
14.00
Average Cold Season RainfallFlood Control District of Maricopa County ALERT Rain Gages
Water Year
Rain
fall
(inch
es)
Rainfall Period: November 15th through April
15th of each Water Year
Number of gages usedin the analy-
sis35
Rainfall Period: November 15th through April
15th of each Water Year
Number of gages usedin the analy-
sis
38
Rainfall Period: November 15th through April
15th of each Water Year
Number of gages usedin the analy-
sis
5244
50
4161 76
93
100113
126
156171
186191
205 212
223238
252263
265267
264267
264262
262260
267
Winter following El Niño Onset

• Well Above Normal rainfall for all locations following the onset of Moderate/Strong El Niño with few exceptions.
• Weak El Niño + late Onset (1963, 1976, 2006): Well below normal rainfall County/Phoenix. Below normal for AZ. Less of an impact on areas east.
• El Niño helps create a favorable large scale pattern with increased frequency of passing disturbances.
SUMMARY
2014 Monsoon Outlook and Beyond • June 18, 2014 • Phoenix, Arizona
Cold Season Rainfall, Percent of Normal After Onset of El NiñoEl Niño Episodes Maricopa County * Phoenix Tucson Yuma Flagstaff
Strength # of Events 2.84 2.71 6.08 1.29 7.93Weak 6 137.9% 95.5% 96.9% 84.1% 112.2%Moderate 8 146.1% 138.3% 151.2% 127.0% 128.4%Strong 2 182.5% 184.0% 187.6% 233.8% 148.1%All Episodes 16 152.4% 128.0% 135.4% 124.3% 124.8%* Maricopa County Rainfall: 9 total El Niño Episodes (2 Weak, 5 Moderate, 2 Strong)

CPC 3-month Outlooks(Fall/Winter 2014-2015)
Oct-Nov-Dec
Nov-Dec-Jan
Dec-Jan-Feb
Jan-Feb-Mar
Forecast Calling For:
• Increased chances for above average rainfall predicted throughout the Cold Season (Nov-April).
• Highest probabilities of above avg. rainfall shift east as we transition into 2015. This mimics continuation/progression of El Niño pattern.
2014 Monsoon Outlook and Beyond • June 18, 2014 • Phoenix, Arizona

• All observational and model data is pointing towards the return of El Niño, but it is still a wait and see scenario…
• ENSO is one of many large scale features that come into play when making long term predictions. Many more complex smaller scale features/interactions that figure into making exact predictions.
• El Nino climate signal much weaker in summer than winter, meaning more variability in predictions due to other drivers
Final Thoughts
2014 Monsoon Outlook and Beyond • June 18, 2014 • Phoenix, Arizona
Fearless Forecast: Moderate El Niño lasting into 2015
2014 AZ Monsoon Season: 90% of avg. rainfall, ≈ 2.50” *
2014-2015 AZ Cold Season: 150% of avg. rainfall, ≈ 6.50” *
* Rainfall forecasts above are averaged totals across all Maricopa County ALERT gages *

• El Niño observational and forecast images, Climate Prediction Center:
http://www.cpc.ncep.noaa.gov/
• Historic Monsoon rainfall data, NWS Tucson WFO: http://www.wrh.noaa.gov/twc/monsoon/monsoon_tracker.php
• Historic monthly rainfall data, NOAA/NWS, NOWData: http://www.sercc.com/nowdata
• Historic ALERT rainfall data, Flood Control District of Maricopa County: http://www.fcd.maricopa.gov/Rainfall/rainfall.aspx
• El Niño and La Niña Episodes and Their Impact on the Weather in the Tucson Metropolitan Area: Glenn Lader, WFO Tucson, AZ, 2012: http://www.wrh.noaa.gov/wrh/talite1201.pdf
Data Sources/References
2014 Monsoon Outlook and Beyond • June 18, 2014 • Phoenix, Arizona

Questions…?
www.fcd.maricopa.gov@FCDMaricopa
www.facebook.com/FCDMaricopa
2014 Monsoon Outlook and Beyond • June 18, 2014 • Phoenix, Arizona