extreme precipitaton events in arizona john henz, c.c.m. william badini, robert rahrs and daniel...
Post on 22-Dec-2015
216 views
TRANSCRIPT

Extreme Precipitaton Events in Arizona
John Henz, C.C.M. William Badini, Robert Rahrs and Daniel Henz
Hydro-Meteorology Group HDR Inc, – Denver, CO
4th Symposium on Hydrometorology – Tucson,
AZSeptember 21, 2004

Brief Intro – HDR
• Over 6,000 employees in over 160 locations (most in US but, also in the UK, Canada and Mexico.
• HQ in Omaha, Nebraska.• Providing a range of services predominantly in Engineering
Environmental Science and Architecture

John HenzCertified Consulting Meteorologist
• Senior Project Manager, HDR Hydro-Meteorological Services
• Certified Consulting Meteorologist (1980-current)• Colorado Flood Task and Water Availability Forces since 1993• Arizona Flood Warning Co-ordination Committee: 1996-2000• Colorado Extreme Precipitation Committee since 1993• BS Meteorology, Uni. Of Wis.; MS Atmospheric Science, Colo.St.
Univ.• [email protected]

Other Team Members
Bill Badini• BS, MS - U of Wisconsin (Atmos & Oceanic Sci.)• 10 yrs experience in Quant. Precip. Forecast. In CO, TX and AZ• Worked with Colorado Flood & Water Avail. Task Force
Rob Rahrs• BS – Univ of Nebraska (Meteorology) & 80% complete with MS in
Engineering: (GIS) at Univ. of Colo.-Denver• 5 years exp. QPF in CO and key project member for GIS integration
of weather and climate data.Dan Henz
• BS - Univ. of Arizona currently in MS program at Univ. of Wisconsin• 3 years QPF ex. in CO.

Motivation of Project
•Data utilized in Probable Maximum Precipitation (PMP)
study.•PMP studies used for dam safety analysis – regulated
primarily by state governments
•PMP used to drive the PMF (Prob. Maximum Flood) which
is used to design spillway capacity
•Overtopping (not enough spillway capacity) is a major
risk to dam safety

What is PMP? Probable Maximum Precipitation

Definition of Probable Maximum Precipitation
• “theoretically the greatest depth of precipitation for a given duration that is physically possible over a given storm area at a particular geographic location at a certain time of year” ……. Definition from HMR-55A.

Arizona historical extreme precipitation event climatology: 1850-early 2005

Sources of historical events
• HMR-49 and HMR-50: 28 general storms and 35 local storms in Arizona, Colorado, Utah and southeastern California.
• NOAA-NCDC Storm Data: 1959-2005• NWS-Tucson listing of SE Arizona flooding events• FCDMC and PCFCD• Arizona State Climatologist• University of Arizona Atmospheric Science Dept.

August 23, 2005 AM Tucson AZ Heavy rains and flooding

August 23, 2005 AM Tucson AZ Heavy rains and flooding

August 23, 2005Tucsonfloods
most frommonsoont-storm
4th greatest flow

When do Arizona extreme precipitation events like to occur during the year?
Number of Extreme Storms by Day of Yearin Arizona (1860 - 2003)
0
1
2
3
4
5
6
7
8
9
10
123456789101112131415161718192021222324252627282930311234567891011121314151617181920212223242526272829123456789101112131415161718192021222324252627282930311234567891011121314151617181920212223242526272829301234567891011121314151617181920212223242526272829303112345678910111213141516171819202122232425262728293012345678910111213141516171819202122232425262728293031123456789101112131415161718192021222324252627282930311234567891011121314151617181920212223242526272829301234567891011121314151617181920212223242526272829303112345678910111213141516171819202122232425262728293012345678910111213141516171819202122232425262728293031
Jan Feb Mar Apr May Jun Jul Aug Sep Oct Nov Dec
Month
Nu
mb
er o
f O
ccu
rren
ces
August 28August 28
July 21
January 8

Causes of Arizona extreme precipitation events during the year
(190 events).Number of Extreme Storms by Day of Year
in Arizona (1860 - 2003)
0
1
2
3
4
5
6
7
8
9
10
123456789101112131415161718192021222324252627282930311234567891011121314151617181920212223242526272829123456789101112131415161718192021222324252627282930311234567891011121314151617181920212223242526272829301234567891011121314151617181920212223242526272829303112345678910111213141516171819202122232425262728293012345678910111213141516171819202122232425262728293031123456789101112131415161718192021222324252627282930311234567891011121314151617181920212223242526272829301234567891011121314151617181920212223242526272829303112345678910111213141516171819202122232425262728293012345678910111213141516171819202122232425262728293031
Jan Feb Mar Apr May Jun Jul Aug Sep Oct Nov Dec
Month
Nu
mb
er o
f O
ccu
rren
ces
August 28Tropical storms
Monsoon t-storms
Pacific storms
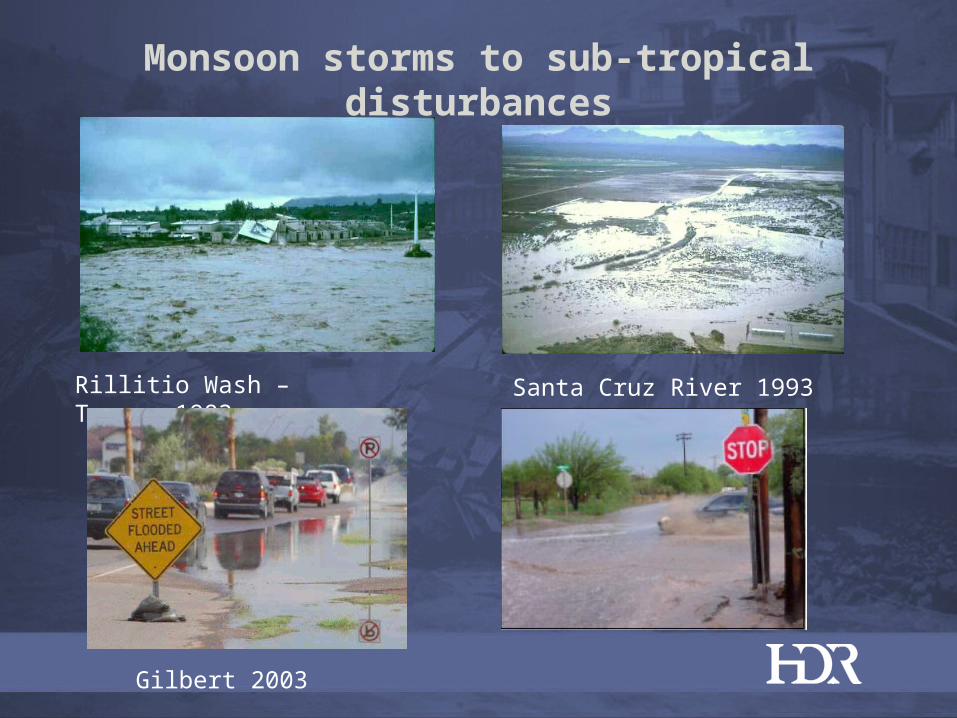
Monsoon storms to sub-tropical disturbances
Rillitio Wash – Tucson 1983 Santa Cruz River 1993
Gilbert 2003

Arizona’s annual
precipitation
shows the impacts of mountain
ranges and deserts clearly.

Arizona’s annual
precipitation
shows the impacts of mountain
ranges and deserts clearly.
In short, all storms are not created
equal.

Two primary sources of Arizona floods:
• General storms moving across the state during winter producing prolonged upslope rain/snow or sub-tropical storms/decaying hurricanes during August to October.
• Intense thunderstorms occurring during the summer monsoon season: mid-July to mid-September.

During PMP Project - select the critical local and general storms
217 possible storm events
• List storms by precipitation amount, duration and elevation.
• Determine meteorological cause.
• Review physical location and topography of the event.
• Determine the 5-10 most extreme local and general storm events for further evaluation (for PMP study).

Local Storm
Discussion
Local Storms defined as events under 6 hours for
duration of primary rainfall

Let’s get the rainfall pattern’s areal coverage: length and width

Let’s use WSR-88D Doppler radar to define size using STP and duration from
reflectivity.

Example: September 9, 2003
• Report of 10” of rain overnight at Roosevelt Dam. Persistent heavy rains flooded nearby creeks and 200 homes damaged.
• What happened, where and how much?• Check newspapers, eyewitness reports and stream flow
records.• Questions remain: when did it start? How much rain fell in
what period of time? What was the areal distribution?

Flagstaff NWS WSR-88D Doppler radar Storm Total Precipitation Map

Phoenix NWS WSR-88D Doppler radar Storm Total Precipitation Map

Storm Total Precipitation Field –WSR-88D
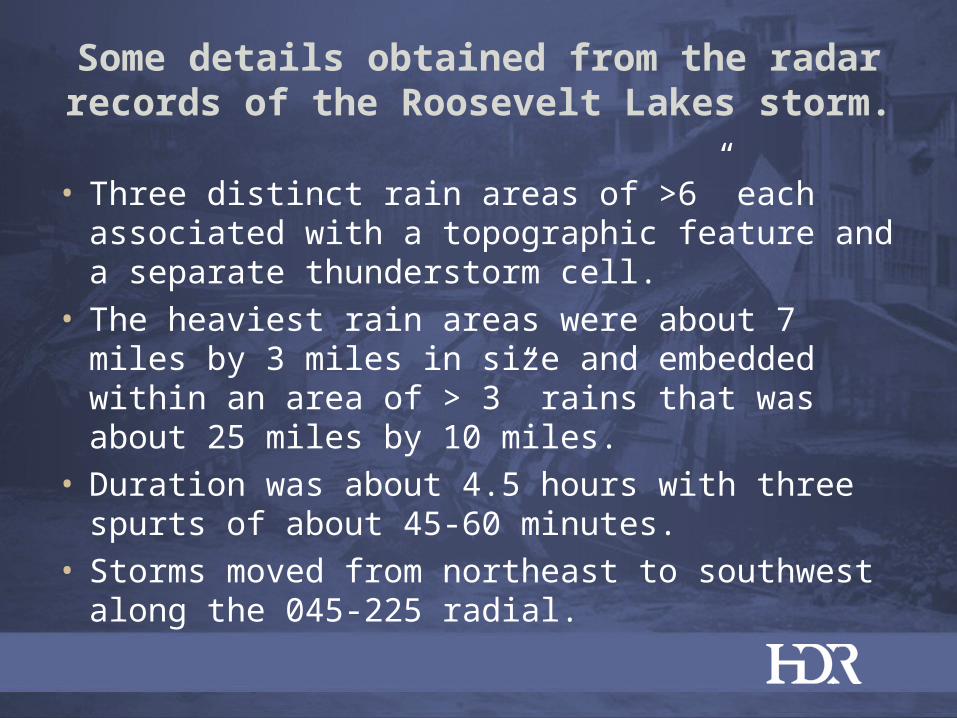
Some details obtained from the radar records of the Roosevelt Lakes storm.
• Three distinct rain areas of >6” each associated with a topographic feature and a separate thunderstorm cell.
• The heaviest rain areas were about 7 miles by 3 miles in size and embedded within an area of > 3” rains that was about 25 miles by 10 miles.
• Duration was about 4.5 hours with three spurts of about 45-60 minutes.
• Storms moved from northeast to southwest along the 045-225 radial.

Sabino Canyon Flood of July 24, 2003

STP – WSR-88D Tucson
July 24, 2003

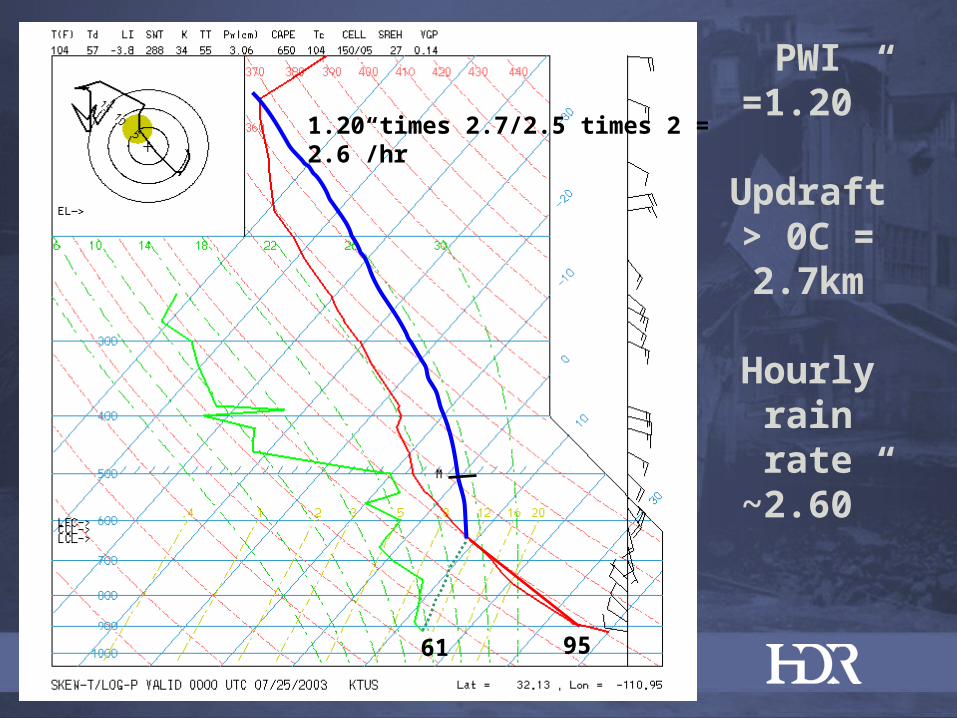
July 24, 2003Upper
air soundin
gfor
Tucson
PWI =1.20”
PWI =1.20”
Updraft > 0C =2.7km
Hourly rain rate~2.60”
9561
1.20 times 2.7/2.5 times 2 = 2.6”/hr

PWI =1.20”
Updraft > 0C =2.7km
Hourly rain rate
~2.603hrs
= 7.80”
9561

Radar plot of Sabino Canyon - 7/15/1999
5-6” heavy rains

Sabino Canyon storm – July 15, 1999
• 6-7 inches of rain fell at elevations of 6,000ft to 7,400ft.• Occurred over a 5.5hr to 6.5 hr period.• Winds were from the southwest to northeast.• Not one storm but repeated storm development over the
same terrain feature.• Happened on the windward side of the mountains.
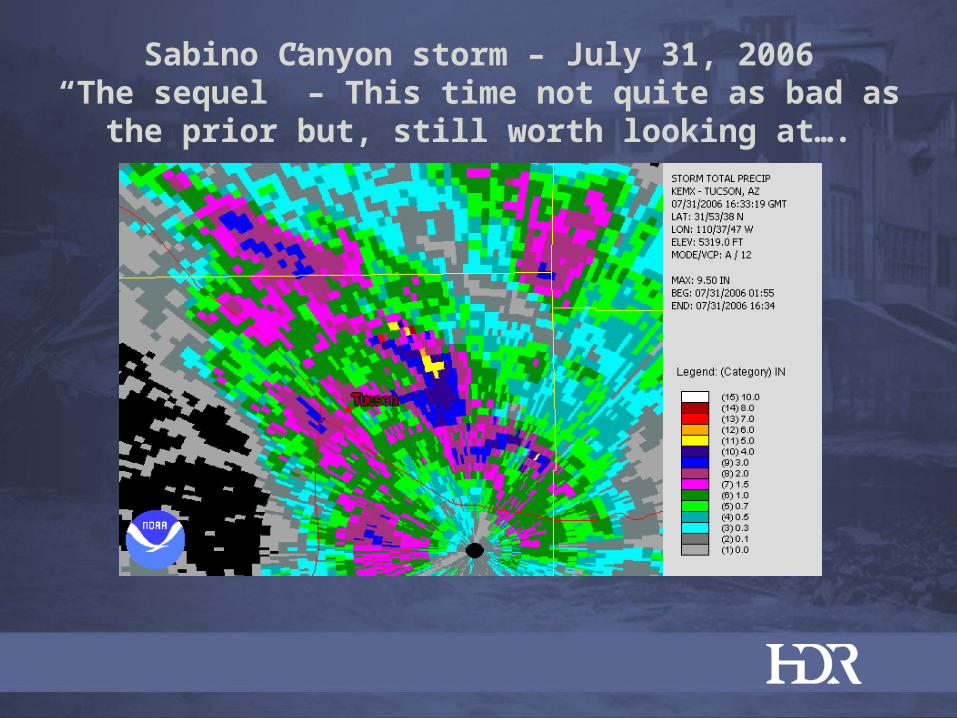
Sabino Canyon storm – July 31, 2006“The sequel” – This time not quite as bad as
the prior but, still worth looking at….
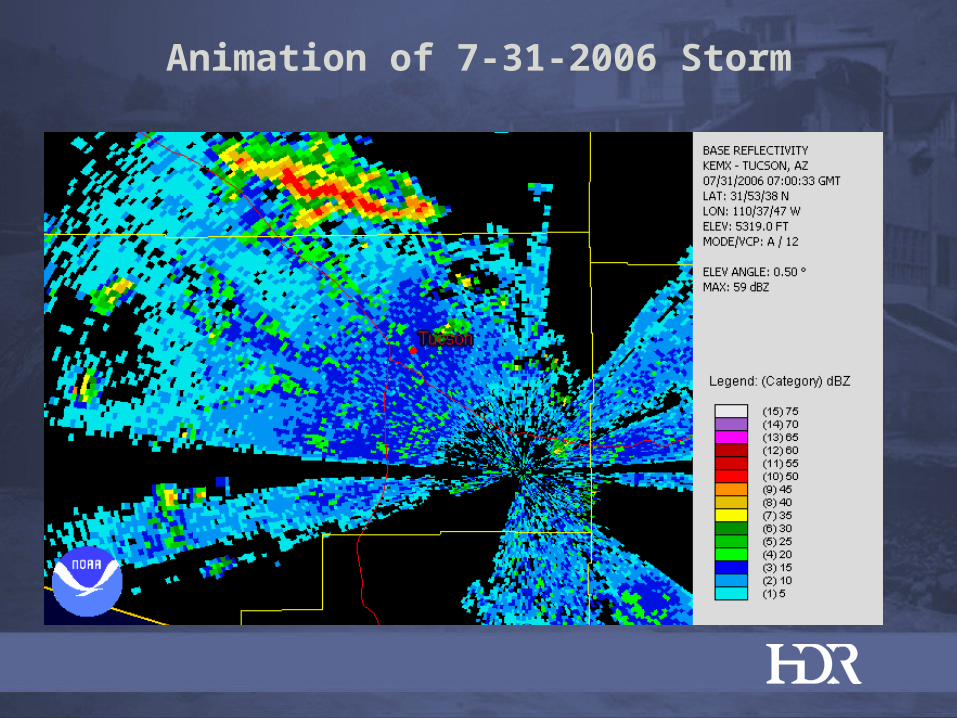
Animation of 7-31-2006 Storm

Snapshot at 1258 UTC – (558 AM TUS time) on July 31, 2006

Critical Local-Storm List for the SW Arizona Basin PMP Study
Storm Name Date Amount of rainfall
1.Fort Mohave, AZAugust 28, 1898 ~8.00”/45min
2. Wellton 15WSW, AZAugust 23, 1955 6”/3hrs
3. Phoenix, AZ June 22, 1972 5.25”/2hrs
4. Tucson, AZ July 11, 1898 5.1”/1hr, 45 min
5. Bisbee, AZ July 22, 1910 4.25”/70 min
6. Globe, Az July 29, 1954 3.5”/40 min
7. Sierra Ancha July 10,1933 4.28”/1hr, 45 min
8. Crown King, AZ August 11, 1927 4.9”/2hr, 50 min
9. Sabino Canyon, AZ July 15, 1999 7.5”/6hrs
10. Roosevelt Lakes, AZSeptember 9, 2003 9.5”/4.5hrs

General storms:
Definition per PMP nomenclature – events where the rainfall was greater than
6 hours in duration.

General storms:
Two biggest events:Hurricanes Norma in 1970
and Hurricane Nora in 1997

Schematic of rain-producing winds in a decaying sub-tropical disturbance forced to gradually raise upslope without thunderstorm activity. (AGL= above ground
level)

Hurricane Nora’s track

Satellite photo of Tropical Storm Nora entering Arizona on September 25, 1997.
H = Harquahala Peak and W = Workman Gulch
HW
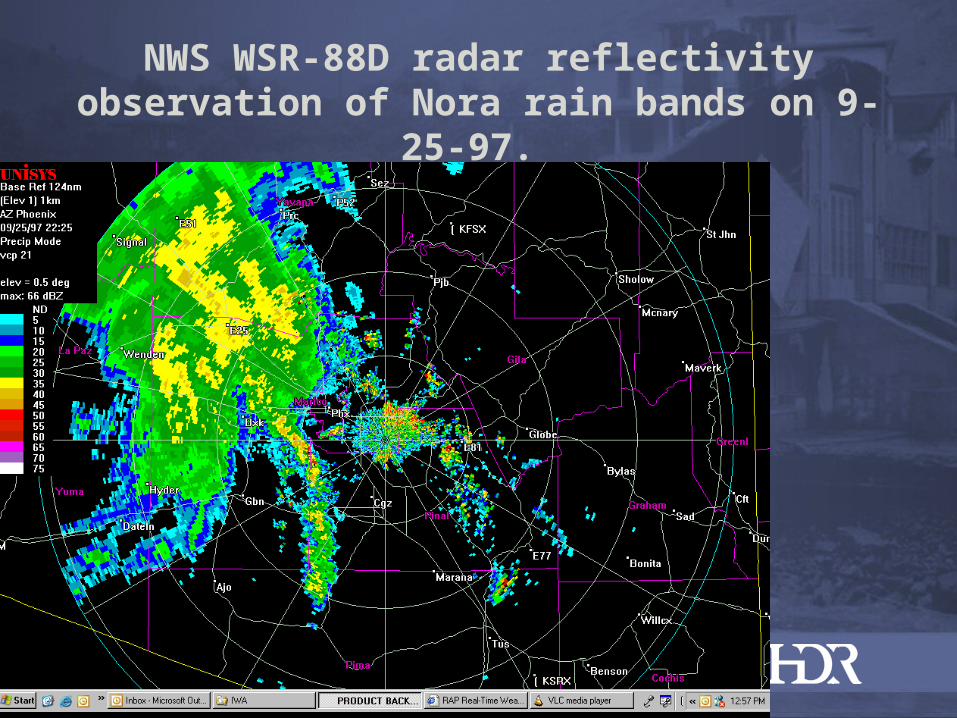
NWS WSR-88D radar reflectivity observation of Nora rain bands on 9-25-
97.

Precipitation caused by passage of Hurricane Nora on September 25, 1997.

Precipitation caused by passage of Hurricane Nora on September 25, 1997.
State record 24 hr precipitation

Critical General-Storm List SE Arizona Basin Example
Storm Name Date Amount of rain
Harquahala Peak, AZ Hurricane Nora
August 24-25, 1997 11.97”/24hrs
Workman Creek, AZ Hurricane Norma
September 4-5, 1970 11.4”/24hrs
Casa Grande Ruins, AZ August 1-2, 1906 9.10”/24hrs
Upper Parker Creek, AZ August 26-29, 1951 8.47”/3 days (90% in 24hrs)
Sunflower, AZ Hurricane Norma
September 4-5, 1970 8.40”/24 hours
Kitt Peak, AZ Hurricane Norma
September 4-5, 1970 8.00”/24hrs
Crown King, AZ August 26-29, 1951 13.56/4 days

Temporal Distribution of Rainfall…very important to know when dealing with events.
Workman 9-4/5-1970 vs Harlaquera Pk 9-25/26-1997
0.00
0.20
0.40
0.60
0.80
1.00
1.20
1.40
1.60
1.80
2.00
8:00
9:00
10:0
011
:00
12:0
013
:00
14:0
015
:00
16:0
017
:00
18:0
019
:00
20:0
021
:00
22:0
023
:00
0:00
1:00
2:00
3:00
4:00
5:00
6:00
7:00
8:00
9:00
10:0
011
:00
Time
Rai
nfa
ll
1997 1970

Recommendation: State of Arizona consider using observed temporal and areal coverage observations of Arizona extreme storms for
• Calculation of basin coverage. • Temporal distribution of extreme events measured by either
rain gages or WSR-88D Doppler radars of NWS.

Recommendation: State of Arizona consider undertaking two studies of extreme precipitation related events:
• An Arizona Extreme Precipitation Data Study similar to the one recently completed in Colorado (CCC, 1997). This study would form the basis for future site-specific and regional PMP studies.
• A radar evaluation of the areal coverage and temporal duration of extreme precipitation events using NWS WSR-99D Doppler radar observations of storm total precipitation (STP) fields.

Extreme is not limited to this study of storms shown today…..
It does depend on basin and/or climatic zones of a state.

A USE OF AN ENHANCED EXTREME PRECIPIPTATION DATABASE: GIS-BASED EXTREME PRECIPITATION ANALYSIS
TOOL – (EPAT)
• The Extreme Precipitation Analysis Tool software takes into account the 6 steps of PMP analysis. The software is user friendly, simple steps are used to operate it.
• The user only needs two GIS shapefiles to run the EPAT: an outline of the basin, and a digitized line representing the stream in the basin, which is termed the Basin Track.
• Uses GIS formatted data to run through the PMP process for a given basin…run through steps and arrive at critical storm(s) list for hydrological analysis.
• Output includes temporal information which assists in the hydrological analysis

Questions?“Climate is what we expect, weather is what we get.”

Elevation adjustment (HMR-57)
• First use the P-Max value determined in prior step.• Compare the elevation of the maximized event to the elevation of the
basin it will be “transposed to”.
• The local storm elevation adjustment factor is 9% change in precipitation per 1,000ft change in elevation. If a 3,000ft change occurs (3,000ft times 9%/1,000ft = 27% change):If elevation increases the adjustment factor is 1.00 – 0.27 =0.73.If elevation decreased it would be 1.00 + 0.27 =1.27.
• If 5.00” event occurs at 3,000ft and it is moved to a basin at 6,000ft, the change in elevation is 3,000ft times 9%/1000ft equals a 27% change. Thus 100%-27% = 0.73Elevation change = 5.00” times 0.73 = 3.65”

Table 6
Maximized and elevation-adjusted local-storm event precipitation
LOCAL-STORM
9% 9%
Date Observed RainfallInches
Max Factor
P-maxInches
Stockton W., Frye Crk and
Graveyard W Elevation
Event Elevatio
nFeet
Elevation
adjustment
factor
Elevation
Adjusted P-max
Inches
DurationHours
Fort Mohave
8.00/45min 1.28 10.24/45 min
S 6300F 6750G 5500
540 S 0.48F 0.44G 0.55
S 4.92F 4.51G 5.63
45min
Wellton 6.00/3hrs 1.15 6.93/3hrs S 6300F 6750G 5500
2800 S 0.68F 0.64G 0.76
S 4.71F 4.44G 5.27
3
Phoenix
5.25/2hrs 1.28 6.99/2hrs S 6300F 6750G 5500
1120 S 0.53F 0.49G 0.61
S 3.56F 3.29G 4.09
2
Tucson 5.1/ 1hr, 45min
1.05 5.34/2hrs S 6300F 6750G 5500
2360 S 0.65F 0.60G 0.72
S 3.47F 3.20G 3.84
1hr, 45 min
Bisbee 4.25/70min 1.15 4.89/70min S 6300F 6750G 5500
5500 S 0.93F 0.89G 1.00
S 4.55F 4.35G 4.89
70 min
Globe 3.5/40miin 1.48 5.12/40min S 6300F 6750G 5500
3540 S 0.75F 0.71G 0.82
S 3.84F 3.63G 4.20
40 min
Crown King
4.9”/2hr, 50min
1.15 5.65/2hr,50min
S 6300F 6750G 5500
6000 S 0.97F 0.93G 1.05
S 5.48F 5.25G 5.93
2hr, 50min
Sierra Ancha
4.28/1hr, 45min
1.09 4.69/1hr,45min
S 6300F 6750G 5500
5100 S 0.89F 0.85G 0.96
S 4.17F 3.99G 4.50
1hr,45 min
Sabino 7.5”/6hrs 1.36 10.2/6hrs S 6300F 6750G 5500
6500 S 1.02F 0.97G 1.09
S 10.40F 9.89
G 11.12
6 hours
Roosevelt
Lakes
9.5”/4.5hrs 1.30 12.33/4.5hrs
S 6300F 6750G 5500
4500 S 0.84F 0.80G 0.91
S 10.35F 9.86
G 11.22
4.5 hours

First primary task: develop storm climatology
1. a. Historical extreme precipitation event evaluationb. Develop “short list” of primary transposition events
2. a. Perform explicit in-place event maximizationb. Candidate storm transposition: perform elevation adjustments for key storms.
3. Orographic adjustments for barrier depletion of moisture4. Orientation of candidate storms in basins5. Calculate the Regional PMP for Stockton, Frye and
Graveyard basins.
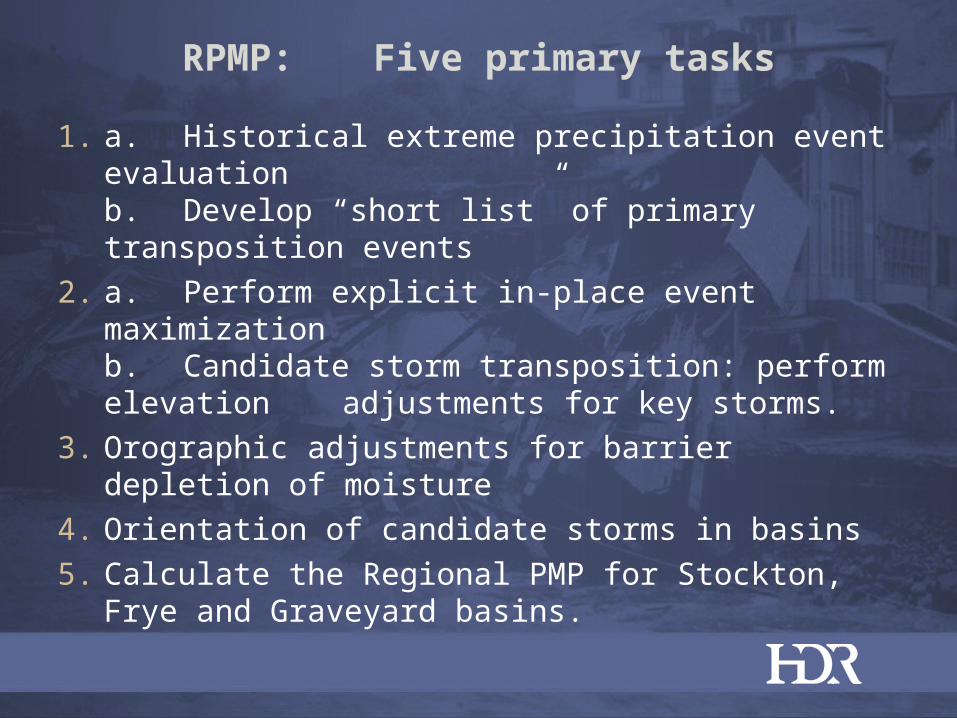
RPMP: Five primary tasks
1. a. Historical extreme precipitation event evaluationb. Develop “short list” of primary transposition events
2. a. Perform explicit in-place event maximizationb. Candidate storm transposition: perform elevation adjustments for key storms.
3. Orographic adjustments for barrier depletion of moisture4. Orientation of candidate storms in basins5. Calculate the Regional PMP for Stockton, Frye and
Graveyard basins.

Opportunities to refine HMR PMP
• Theoretically and physically possible: opens the door for new science on precipitation and storms.
• Duration: temporal distribution of rainfall as observed in extreme storms.
• Given storm area: new observations of extreme precipitation events will help define depth-area relationships.
• Location: transposition of events (elevation, topography)• Time of year: seasonal adjustments (maximization)
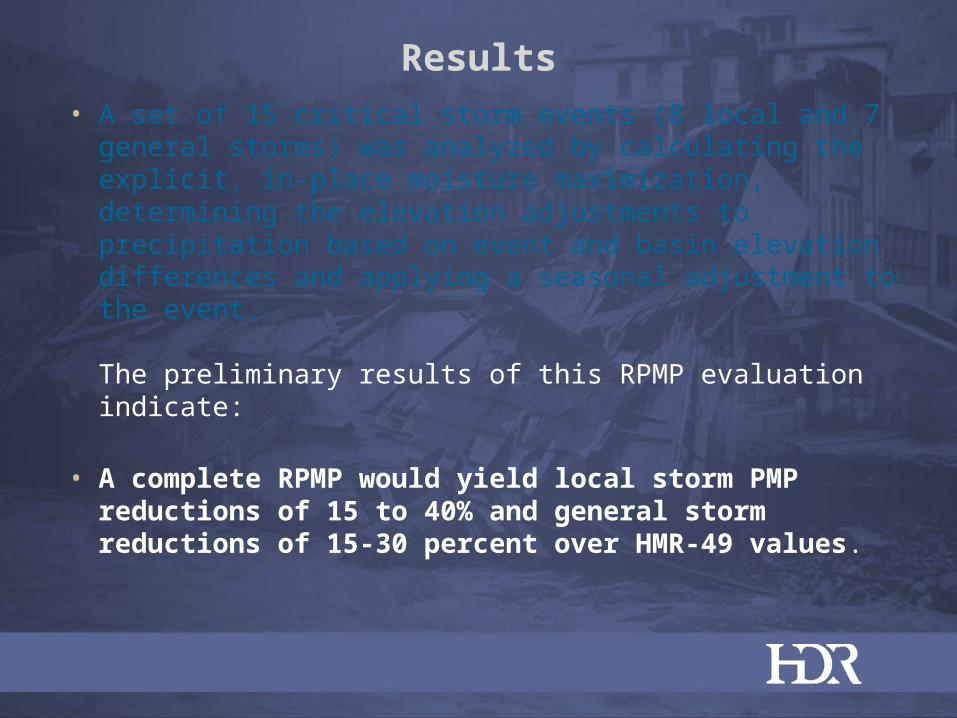
Results• A set of 15 critical storm events (8 local and 7 general storms) was
analyzed by calculating the explicit, in-place moisture maximization, determining the elevation adjustments to precipitation based on event and basin elevation differences and applying a seasonal adjustment to the event.
The preliminary results of this RPMP evaluation indicate:
• A complete RPMP would yield local storm PMP reductions of 15 to 40% and general storm reductions of 15-30 percent over HMR-49 values.

Three primary tasks
1. Develop a historical extreme precipitation for Arizona in areas that would impact the RPMP.
2. Perform event maximization and elevation adjustments for key storms.
3. Provide an estimate of the Regional PMP for Stockton, Frye and Graveyard basins.

Probable Maximum Precipitation“the biblical flood-maker”
• Hydro-Meteorological Report (HMR)-49 was written in 1977 and re-printed in 1984.It is the controlling HMR for Arizona.
• HMR-50 (1981): Western US extreme precipitation events.• HMR-55A (1988): provides most used definition of PMP.• HMR-57 (1994): Provides update of elevation adjustments
to extreme precipitation from local/general storms.• HMR-59 (1999): For California but re-affirms HMR-57
updates and supports differences in intensity, frequency and areal coverage of local storms for climate regions.