the influence of types of homework on opportunity to learn
TRANSCRIPT

University of South FloridaScholar Commons
Graduate Theses and Dissertations Graduate School
September 2015
The Influence of Types of Homework onOpportunity to Learn and Students' MathematicsAchievement: Examples from the University ofChicago School Mathematics ProjectYiting YuUniversity of South Florida, [email protected]
Follow this and additional works at: http://scholarcommons.usf.edu/etd
Part of the Science and Mathematics Education Commons
This Dissertation is brought to you for free and open access by the Graduate School at Scholar Commons. It has been accepted for inclusion inGraduate Theses and Dissertations by an authorized administrator of Scholar Commons. For more information, please [email protected].
Scholar Commons CitationYu, Yiting, "The Influence of Types of Homework on Opportunity to Learn and Students' Mathematics Achievement: Examples fromthe University of Chicago School Mathematics Project" (2015). Graduate Theses and Dissertations.http://scholarcommons.usf.edu/etd/5808

The Influence of Types of Homework on Opportunity to Learn and Students’ Mathematics
Achievement: Examples from the University of Chicago School Mathematics Project
by
Yiting Yu
A dissertation submitted in partial fulfillment
of the requirements for the degree of Doctor of Philosophy
Department of Teaching and Learning College of Education
University of South Florida
Co-Major Professor: Denisse R. Thompson, Ph.D.
Co-Major Professor: Gladis Kersaint, Ph.D. Yi-Hsin Chen, Ph.D. Sharon L. Senk, Ph.D.
Date of Approval:
April 2015
Keywords: Mathematics Education, Mediation, Pre-Transition Mathematics, Transition Mathematics, Algebra, Secondary Education
Copyright © 2015, Yiting Yu

DEDICATION
I dedicate this dissertation to my dear parents who have given me full support throughout
the years. They have provided me everything I have ever needed and taught me values I cannot
possibly live without. Without them, I would not have had the opportunity to choose to become
the person I am today. I cannot express my love enough for them both.

ACKNOWLEGMENT
I wish to express my gratitude especially to Dr. Denisse Thompson who has been by my
side throughout my Ph. D program, not only as a member of the committee giving me the
opportunity to be part of the writing of the evaluation report for Transition Mathematics by
UCSMP through which I had the inspiration to use the database by UCSMP for this dissertation
and for many other conference presentations, but also as a mentor that have helped me through
my toughest times working to finish the dissertation overseas. There are no words to describe my
appreciation for a dedicated professor like Dr. Thompson who will always be my role model as a
true educator. I would like to thank Dr. Gladis Kersaint, who provided me the initial opportunity
to be part of the mathematics education program at University of South Florida, and who
provided me teaching and research opportunities throughout the program. I’d also like to thank
Dr. Yi-Hsin Chen who helped me tremendously with the data analysis for this dissertation, and
Dr. Sharon L. Senk from Michigan University for taking time from her busy schedule to
supervise my dissertation progress. I give my sincere appreciation to the Mathematics Education
department at University of South Florida for providing me valuable experiences throughout my
time spent there and for giving me support to finish my degree and allowing me to take
advantage of their resources.

i
TABLE OF CONTENTS LIST OF TABLES ...........................................................................................................................v LIST OF FIGURES ....................................................................................................................... ix ABSTRACT ................................................................................................................................ xi CHAPTER 1: INTRODUCTION ....................................................................................................1 Conceptual Framework ........................................................................................................2 Rationale ..............................................................................................................................4 Research Questions ..............................................................................................................8 Significance of the Study .....................................................................................................9 Definitions..........................................................................................................................10
CHAPTER 2: LITERATURE REVIEW .......................................................................................11 Historical Perspectives on Homework ...............................................................................11 Homework and Achievement ............................................................................................14 Homework and Opportunity to Learn ................................................................................17 Statistical Mediation Methods ...........................................................................................20 Summary ............................................................................................................................23 CHAPTER 3: METHODS .............................................................................................................24 Research Questions ............................................................................................................24 Background of Study .........................................................................................................25 Data Collection ..................................................................................................................27 Participants .........................................................................................................................28 Instrumentation ..................................................................................................................29 Tests to Assess Achievement .................................................................................29 Pre-Transition Mathematics ......................................................................29
Transition Mathematics .............................................................................29 Algebra .......................................................................................................30
Teacher Chapter Evaluation Form .........................................................................31 Teacher Opportunity-to-Learn (OTL) Form ..........................................................31 Data Analysis .....................................................................................................................32
CHAPTER 4: RESULTS ...............................................................................................................35
Opportunity to Learn Measured by Lesson Coverage, Questions Assigned, and Opportunity to Learn Content on Posttest Items ..........................................................35
Impact of Two Types of OTL and Achievement (Research Question 1) ..........................39 The Impact of Lesson Coverage as OTL (Part A) .................................................40

ii
Pre-Transition Mathematics ......................................................................40 Transition Mathematics .............................................................................42 Algebra .......................................................................................................43 Conclusion .................................................................................................44 The Impact of Posttest OTL (Part B) .....................................................................45 Pre-Transition Mathematics ......................................................................45 Transition Mathematics .............................................................................46 Algebra .......................................................................................................47 Conclusion .................................................................................................49 The Extent to Which Three Types of Homework Impact OTL Measured by
Lesson Coverage and Achievement (Research Question 2) ........................................49 Pre-Transition Mathematics ..................................................................................51 Using PTM posttest 1 achievement as dependent variable ........................51 Conclusion .....................................................................................54 Using PTM posttest 2 achievement as dependent variable ........................54 Conclusion .....................................................................................57 Using PTM posttest 3 achievement as dependent variable ........................58 Conclusion .....................................................................................61 Transition Mathematics .........................................................................................61 Using TM posttest 1 achievement as dependent variable ..........................61 Conclusion .....................................................................................64 Using TM posttest 2 achievement as dependent variable ..........................65 Conclusion .....................................................................................68 Using TM posttest 3 achievement as dependent variable ..........................68 Conclusion .....................................................................................71 Algebra ...................................................................................................................72 Using Algebra posttest 1 achievement as dependent variable ...................72 Conclusion .....................................................................................75 Using Algebra posttest 2 achievement as dependent variable ...................75 Conclusion .....................................................................................78 Using Algebra posttest 3 achievement as dependent variable ...................79 Conclusion .....................................................................................82 Summary of the Results .........................................................................................82 Extent of Homework Influence on Posttest OTL and Achievement (Research Question 3) ..................................................................................................83 Pre-Transition Mathematics ..................................................................................84 Using PTM posttest 1 achievement as dependent variable ........................84 Conclusion .....................................................................................87 Using PTM posttest 2 achievement as dependent variable ........................87 Conclusion .....................................................................................90 Using PTM posttest 3 achievement as dependent variable ........................91 Conclusion .....................................................................................94 Transition Mathematics .........................................................................................95 Using TM posttest 1 achievement as dependent variable ..........................95 Conclusion .....................................................................................98 Using TM posttest 2 achievement as dependent variable ..........................98

iii
Conclusion ...................................................................................101 Using TM posttest 3 achievement as dependent variable ........................101 Conclusion ...................................................................................105 Algebra .................................................................................................................105 Using Algebra posttest 1 achievement as dependent variable .................105 Conclusion ...................................................................................108 Using Algebra posttest 2 achievement as dependent variable .................109 Conclusion ...................................................................................111 Using Algebra posttest 3 achievement as dependent variable .................112 Conclusion ...................................................................................115 General Conclusion ..............................................................................................115 Conclusion from Mediation Effects of Types of Homework (Research
Question 4) .................................................................................................................116 CHAPTER 5: DISCUSSION .......................................................................................................120 Findings ...........................................................................................................................120 Findings from Opportunity to Learn Measured by Lesson Coverage, Questions Assigned, and Opportunity to Learn Content on Posttest Items ...............................................................................................................120 Pre-Transition Mathematics ....................................................................120 Transition Mathematics ...........................................................................121 Algebra .....................................................................................................122 Summary ..................................................................................................122 Findings from Impact of OTL Measured by Lesson Coverage on Achievement ........................................................................................................123 Findings from Impact of Teachers’ Reported Posttest OTL on Achievement ........................................................................................................123 Findings from Investigating the Extent to Which Types of Homework Impact OTL Measured by Lesson Coverage on Achievement ............................124
Findings from Investigating the Extent to Which Types of Homework Impact Teachers’ Reported Posttest OTL on Achievement ..........................125
Conclusion .......................................................................................................................126 Limitations .......................................................................................................................128 Implications ......................................................................................................................130 Future Research ...............................................................................................................131
REFERENCES ............................................................................................................................134 APPENDIX A: PRE-TRANSITION MATHEMATICS INSTRUMENTS....................................142 APPENDIX B: TRANSITION MATHEMATICS INSTRUMENTS ............................................169 APPENDIX C: ALGEBRA INSTRUMENTS ..............................................................................204 APPENDIX D: TEACHER INSTRUMENTS ............................................................................238

iv
APPENDIX E: RESULTS OUTPUT ..........................................................................................250 APPENDIX F: PERMISSION TO USE INSTRUMENTATIONS AND IRB APPROVAL .......................................................................................................293

v
LIST OF TABLES
Table 1. Teacher Provided Opportunity to Learn Measured by Lesson Coverage and by Teachers’ Reported Posttest OTL for Pre-Transition Mathematics ............................36
Table 2. Number and Percent of Question Types Assigned by UCSMP Pre-Transition Mathematics Teachers Based on Lessons Taught .......................................................37 Table 3. Teacher Provided Opportunity to Learn Measured by Lesson Coverage and by Posttest OTL for Transition Mathematics ...................................................................38 Table 4. Number and Percent of Question Types Assigned by UCSMP Transition Mathematics Teachers Based on Lessons Taught .......................................................38 Table 5. Teacher Provided Opportunity to Learn Measured by Lesson Coverage and Teachers’ Reported Posttest OTL for Algebra ............................................................39 Table 6. Number and Percent of Question Types Assigned by UCSMP Algebra Teachers
Based on Lessons Taught .............................................................................................39 Table 7. Total and Individual Indirect Effects for Homework Types as Mediators for Pre-Transition Mathematics Posttest 1 ........................................................................52 Table 8. Total and Individual Indirect Effects for Homework Types as Mediators for Pre-Transition Mathematics Posttest 2 ........................................................................56 Table 9. Total and Individual Indirect Effects for Homework Types as Mediators for Pre-Transition Mathematics Posttest 3 ........................................................................59 Table 10. Total and Individual Indirect Effects for Homework Types as Mediators for
Transition Mathematics Posttest 1 ...............................................................................63 Table 11. Total and Individual Indirect Effects for Homework Types as Mediators for
Transition Mathematics Posttest 2 ...............................................................................67 Table 12. Total and Individual Indirect Effects for Homework Types as Mediators for
Transition Mathematics Posttest 3 ...............................................................................70 Table 13. Total and Individual Indirect Effects for Homework Types as Mediators for Algebra Posttest 1 ........................................................................................................73

vi
Table 14. Total and Individual Indirect Effects for Homework Types as Mediators for Algebra Posttest 2 ........................................................................................................77 Table 15. Total and Individual Indirect Effects for Homework Types as Mediators for Algebra Posttest 3 ........................................................................................................80 Table 16. True Indirect Effect for OTL Measured by Lesson Coverage .....................................83 Table 17. Estimated Indirect Effect for OTL Measured by Lesson Coverage ............................84 Table 18. Indirect Effects of Independent Variable on Dependent Variable through Three
Homework Types as Mediators for Pre-Transition Mathematics Posttest 1 ...............85 Table 19. Indirect Effects of Independent Variable on Dependent Variable through Three
Homework Types as Mediators for Pre-Transition Mathematics Posttest 2 ...............89 Table 20. Indirect Effects of Independent Variable on Dependent Variable through Three
Homework Types as Mediators for Pre-Transition Mathematics Posttest 3 ...............93 Table 21. Indirect Effects of Independent Variable on Dependent Variable through Three
Homework Types as Mediators for Transition Mathematics Posttest 1 ......................96 Table 22. Indirect Effects of Independent Variable on Dependent Variable through Three
Homework Types as Mediators for Transition Mathematics Posttest 2 ....................100 Table 23. Indirect Effects of Independent Variable on Dependent Variable through Three
Homework Types as Mediators for Transition Mathematics Posttest 3 ....................103 Table 24. Indirect Effects of Independent Variable on Dependent Variable through Three
Homework Types as Mediators for Algebra Mathematics Posttest 1 ........................107 Table 25. Indirect Effects of Independent Variable on Dependent Variable through Three
Homework Types as Mediators for Algebra Posttest 2 .............................................110 Table 26. Indirect Effects of Independent Variable on Dependent Variable through Three
Homework Types as Mediators for Algebra Posttest 3 .............................................114 Table 27. True Indirect Effect for Posttest OTL ........................................................................116 Table 28. Estimated Indirect Effect for Posttest OTL ...............................................................116 Table 29. Covering the Ideas Homework Type Indirect Effect Results ....................................117 Table 30. Applying the Mathematics Homework Type Indirect Effect Results .........................118 Table 31. Review Homework Type Indirect Effect Results .......................................................119

vii
Table 32. ANOVA Table Using Pre-Transition Mathematics with Posttest 1 (CAT 17 Survey) Percent Correct as DV and OTL Measured by Lesson Coverage as IV ......251 Table 33. ANOVA Table Using Pre-Transition Mathematics with Posttest 2 (UC) Percent Correct as DV and OTL Measured by Lesson Coverage as IV ....................251 Table 34. ANOVA Table Using Pre-Transition Mathematics with Posttest 3 (PSU) Percent Correct as DV and OTL Measured by Lesson Coverage as IV ....................251 Table 35. ANOVA Table Using Transition Mathematics Posttest 1 (IAAT) Percent Correct as DV and OTL Measured by Lesson Coverage as IV .................................252 Table 36. ANOVA Table Using Transition Mathematics Posttest 2 (Algebra/Geometry
Readiness) as DV and OTL Measured by Lesson Coverage as IV ...........................252 Table 37. ANOVA Table Using Transition Mathematics Posttest 3 (PSU) as DV and OTL Measured by Lesson Coverage as IV ................................................................252 Table 38. ANOVA Table Using Algebra Posttest 1 (Terra Nova) Percent Correct as DV and OTL Measured by Lesson Coverage as IV .........................................................253 Table 39. ANOVA Table Using Algebra Posttest 2 (UC) Percent Correct as DV and OTL Measured by Lesson Coverage as IV ................................................................253 Table 40. ANOVA Table Using Algebra Posttest 3 (PSU) Percent Correct as DV and OTL Measured by Lesson Coverage as IV ................................................................253 Table 41. ANOVA Table Using Pre-Transition Mathematics Posttest 1 (CAT 17 Survey)
Percent Correct as DV and OTL Measured by Teacher Reported Covered Items on Posttest 1 as IV ............................................................................................254 Table 42. ANOVA Table Using Pre-Transition Mathematics Posttest 2 (UC) Percent Correct as DV and OTL Measured by Teacher Reported Covered Items on Posttest 2 as IV...........................................................................................................254 Table 43. ANOVA Table Using Pre-Transition Mathematics Posttest 3 (PSU) Percent Correct as DV and OTL Measured by Teacher Reported Covered Items on Posttest 3 as IV...........................................................................................................254 Table 44. ANOVA Table Using Transition Mathematics Posttest 1 (IAAT) Percent Correct as DV and OTL Measured by Teacher Reported Covered Items on Posttest 1 as IV...........................................................................................................255 Table 45. ANOVA Table Using Transition Mathematics Posttest 2 (Algebra/Geometry
Readiness) Percent Correct as DV and OTL Measured by Teacher Reported

viii
Covered Items on Posttest 2 as IV .............................................................................255 Table 46. ANOVA Table Using Transition Mathematics Posttest 3 (PSU) Percent Correct as DV and OTL Measured by Teacher Reported Covered Items on Posttest 3 as IV ...........................................................................................................................255 Table 47. ANOVA Table Using Algebra Posttest 1 (Terra Nova) Percent Correct as DV and OTL Measured by Teacher Reported Covered Items on Posttest 1 as IV ..........256 Table 48. ANOVA Table Using Algebra Posttest 2 (UC) Percent Correct as DV and OTL Measured by Teacher Reported Covered Items on Posttest 2 as IV .................256 Table 49. ANOVA Table Using Algebra Posttest 3 (PSU) Percent Correct as DV and OTL Measured by Teacher Reported Covered Items on Posttest 3 as IV .................256
ix
LIST OF FIGURES Figure 1. The Mathematical Tasks Framework .............................................................................3 Figure 2. The Mathematical Tasks Framework as It Relates to Homework. ................................3 Figure 3. Schematic Illustrating Mediation Model .....................................................................22 Figure 4. Schematic Illustrating Mediation Model as It Relates to Present Study ......................34 Figure 5. Coefficients and significance test for path a and path b using OTL measured by lesson coverage as the independent variable and PTM posttest 1 as the dependent variable .......................................................................................................52 Figure 6. Coefficients and significance test for path a and path b using OTL measured by lesson coverage as the independent variable and PTM posttest 2 as the dependent variable .......................................................................................................56 Figure 7. Coefficients and significance test for path a and path b using OTL measured by lesson coverage as the independent variable and PTM posttest 3 as the dependent variable .......................................................................................................59 Figure 8. Coefficients and significance test for path a and path b using OTL measured by lesson coverage as the independent variable and TM posttest 1 as the dependent variable .......................................................................................................63 Figure 9. Coefficients and significance test for path a and path b using OTL measured by lesson coverage as the independent variable and TM posttest 2 as the dependent variable .......................................................................................................66 Figure 10. Coefficients and significance test for path a and path b using OTL measured by lesson coverage as the independent variable and TM posttest 3 as the dependent variable .......................................................................................................70 Figure 11. Coefficients and significance test for path a and path b using OTL measured by lesson coverage as the independent variable and Algebra posttest 1 as the dependent variable .......................................................................................................73 Figure 12. Coefficients and significance test for path a and path b using OTL measured
by lesson coverage as the independent variable and Algebra posttest 2 as the dependent variable .......................................................................................................76

x
Figure 13. Coefficients and significance test for path a and path b using OTL measured by lesson coverage as the independent variable and Algebra posttest 3 as the dependent variable .......................................................................................................80 Figure 14. Coefficients and significance for path a and path b using teachers’ reported OTL on PTM posttest 1 as the independent variable and PTM posttest 1 achievement as the dependent variable ........................................................................85 Figure 15. Coefficients and significance for path a and path b using teachers’ reported OTL on PTM posttest 2 as the independent variable and PTM posttest 2 achievement as the dependent variable ........................................................................89 Figure 16. Coefficients and significance for path a and path b using teachers’ reported OTL on PTM posttest 3 as the independent variable and PTM posttest 2 achievement as the dependent variable ........................................................................92 Figure 17. Coefficients and significance for path a and path b using teachers’ reported OTL on TM posttest 1 as the independent variable and TM posttest achievement as the dependent variable ........................................................................96 Figure 18. Coefficients and significance for path a and path b using teachers’ reported OTL on TM posttest 2 as the independent variable and TM posttest 2 achievement as the dependent variable. .......................................................................99 Figure 19. Coefficients and significance for path a and path b using teachers’ reported OTL on TM posttest 3 as the independent variable and TM posttest 3 achievement as the dependent variable ......................................................................103 Figure 20. Coefficients and significance for path a and path b using teachers’ reported OTL on Algebra posttest 1 as the independent variable and Algebra posttest 1 achievement as the dependent variable ......................................................................106 Figure 21. Coefficients and significance for path a and path b using teachers’ reported OTL on Algebra posttest 2 as the independent variable and Algebra posttest 2 achievement as dependent variable ............................................................................110 Figure 22. Coefficients and significance for path a and path b using teachers’ reported OTL on Algebra posttest 3 as the independent variable and Algebra posttest 3 achievement as the dependent variable ......................................................................113

xi
ABSTRACT
Public views on assigning students mathematics homework have been controversial.
Although homework is designed for students to complete during non-school hours (Cooper,
1989), many see homework as excessive pressure on students. Most research placed their focus
on the influence of the time spent on homework or the amount of homework on student
achievement. Few studies have addressed the impact of types of mathematics homework. The
purpose of this study is to examine the role of homework types in influencing opportunity to
learn (OTL) on student achievement.
This quantitative study used subsets of a large existing dataset collected by University of
Chicago School Mathematics Project (UCSMP) in Pre-Transition Mathematics, Transition
Mathematics, and Algebra. The findings showed that OTL measured by lesson coverage and by
teachers’ reported posttest OTL have significant impact. Each type of homework as a mediator
might have significant, positive or negative mediating effects or no mediating effects at all. The
findings from having OTL measured by lesson coverage as the independent variable were more
consistent with each mathematics course. The differences of the mediating effects of types of
homework on the impact of OTL measured by lesson coverage on student mathematics
achievement and on the impact of teachers’ reported posttest OTL on students’ mathematics
achievement may be explained through the nature of the types of homework as well as through
limitations of the study. Recommendations for future research and implications of the study were
presented in the discussion part of the study.

1
CHAPTER 1: INTRODUCTION
Homework is an issue that affects not only students and teachers, but also parents.
Homework, defined as any tasks teachers assign to students to be done during non-school hours
(Cooper, 1989), is a ubiquitous part of most schooling. The most common type of homework is
instructional. At least three instructional purposes can be embedded in homework assignments: 1)
To provide students with an opportunity to practice or review material presented in class (Becker
& Epstein, 1982); 2) To introduce preparation materials to help students get ready for new
materials teachers are going to cover in class (Muhlenbruck et al., 1999); 3) To extend students’
previously learned knowledge and skills to new situations or to integrate separately learned skills
and concepts (Lee & Pruitt, 1979).
Public views on assigning mathematics homework have been controversial at times.
Parents tend to complain that there might be too much or too little homework. Students tend to
complain that homework takes away too much of their leisure time. Even teachers often
misunderstand the purpose for assigning homework (Cooper, Robinson, & Patall, 2006).
Although research has supported homework as being an important supplement to in-school
academic activities (Henderson, 1996), the popular press often documents conflicts between
parents and schools relative to homework (Kralovec & Buell, 2000; Loveless, 2003). Regardless,
mathematics teachers typically believe homework plays a major part in instructional practices
and secondary school student learning. Research suggests that instructional practice can

2
influence students’ learning, and homework is a way teachers provide for students to engage
with mathematics concepts (Cooper, Robinson, & Patall, 2006).
Given the different purposes for homework, it is natural to wonder if different types of
homework assigned to students might impact student achievement in different ways. However,
there are limited studies on the relationship of homework to achievement and even fewer studies
that investigate different types of homework. Thus, I conducted the present study to investigate
how the types of homework as a part of opportunity to learn impact student math achievement.
Conceptual Framework
The Mathematical Task Framework (MTF) developed by Stein and her colleagues in the
Qualitative Understanding Amplifying Student Achievement and Reasoning (QUASAR) project
(Henningsen & Stein, 1997; Stein, Grover, & Henningsen, 1996; Stein, Smith, Henningsen, &
Silver, 2000; Silver & Stein, 1996) (See Figure 1) “underscores the important role that
mathematical tasks play in influencing students’ learning opportunities” (Silver & Herbst, 2007,
p. 55). The framework reflects the important role that a mathematical task plays in influencing
students’ opportunity to learn as well as emphasizing the central role of teachers in setting up and
implementing mathematics tasks. What teachers do with the mathematics tasks influences
students’ engagement with the tasks, and ultimately influences students’ opportunity to learn
mathematics through such tasks (Silver & Herbst, 2007). The framework highlights a difference
between the influence of intended curriculum (the textbook or the tasks) and implemented
curriculum (how the textbook or the tasks are used in the class) on student learning. Porter (2004)
distinguished between the content of the two curricula: the intended curriculum is prewritten
content intended to set standards for a particular subject and grade level, and the implemented
curriculum is the content of instruction delivered by classroom teachers. Generally, researchers

3
use the MTF as the basis for analyses of empirical data on the extent of opportunity to learn
mathematics provided by teachers using mathematics tasks to achieve better student learning
(Stein et al., 1996).
In this study, I used the MTF as the conceptual framework. The different types of
homework assignments available in textbook lessons that comprise the curriculum refer to the
tasks in curricular materials in the MTF figure. Lesson coverage refers to the lesson as set up by
teachers. Homework assigned refers to tasks implemented by teachers and potentially by
students. Student learning is reflected by achievement scores (See Figures 1 and 2).
Figure 1. The Mathematical Tasks Framework (Stein, Smith, Henningsen, & Silver, 2000)
Figure 2. The Mathematical Tasks Framework as It Relates to Homework
Note. The Mathematical Tasks Framework as it relates to homework is adapted in a way so that the third phase is not one-to-one corresponding to the third phase in the original Mathematical Tasks Framework. For this study, the actual homework assignment completed by students is not known.
In this study, three different types of homework problems appeared in the curriculum and
were examined, namely problems that cover basic understanding of the concepts, problems that

4
apply the concepts, and review problems. Opportunity to learn (OTL) based on lesson coverage
relates to teachers’ decisions to assign different types of homework from chapters throughout the
textbook; this is phase two (i.e., lesson coverage by teachers) of the MTF. Teachers may assign
none, some, or all of the problems from the lessons taught. The percent of each type of
homework problems assigned to students from the available problems refers to phase three (i.e.,
homework assignment based on lesson coverage) of the MTF. Phase four (i.e., student
mathematics achievement) in the MTF refers to student mathematics learning.
Rationale
Since An Agenda for Action (National Council of Teachers of Mathematics, 1980) called
for changes in student mathematics, the design of curriculum has focused on developing
students’ mathematics problem-solving skills. The Curriculum and Evaluation Standards for
School Mathematics (NCTM, 1989) provided a set of recommendations for including specific
content in school mathematics, mathematics skills expected of students, and learning goals for
each grade band. The publication of Principles and Standards for School Mathematics (PSSM)
(NCTM, 2000) refined and clarified the previous standards. In 2001, the passing of the No Child
Left Behind (NCLB) legislation emphasized the importance of closing the achievement gap and
enhancing achievement for all students. Since the release of PSSM and the passing of NCLB,
many school mathematics curricula have been developed and implemented based on the
recommendations of these standards to enhance student achievement.
To achieve the goal of enhancing student achievement, teachers must use their
curriculum materials effectively. The assignment of homework is closely related to the
implementation of the curriculum materials and yet is an area that is highly debated and

5
understudied. This is true not only for how much homework is assigned but also for the nature
of the homework assigned.
Homework is an important part of secondary school students’ lives. However, many see
homework as excessive pressure on students (Cooper, Robinson, & Patall, 2006); some even
question the value of homework assignments and raise concerns that homework might affect
students’ mental health and discourage students from being motivated to learn. Taking such
views into consideration, studies that have related student mathematics achievement and
homework have shown a generally positive relationship between the two (Cooper, Robinson, &
Patall, 2006). However, further investigations on factors related to homework assignments that
can enhance student learning are needed.
Opportunity to learn (OTL) is widely considered “the single most important predictor of
student achievement” (National Research Council, 2001, p. 334). Research has also shown that
homework provides an opportunity for learning mathematics beyond classroom instruction
(Cooper, Robinson, & Patell, 2006). Because of the complex nature of homework, positive and
negative effects can occur simultaneously. The negative concerns about homework suggest the
need to investigate the role of and types of homework in forming homework policies and
practices, yet, to date, such research has been minimal. Among the available research, most
researchers use amount of homework assigned or completed as measures of homework related to
student achievement and rarely consider the possible impact of different types of homework on
achievement.
Numerous definitions of homework have been used in the few available studies. Some
included in-school guided studies, some included homework study courses, and some referred to
non-instructional activities. In this study, I restrict the definition of homework to be only tasks

6
assigned by teachers intended for students to carry out during non-school hours (Cooper, 1989).
Most research interests have examined the relationship between amount of time spent on
completed or assigned homework and achievement through the lens of the broad definitions of
homework (Omlin-Ruback, 2009). Fewer studies have considered the influence of OTL on
student achievement in terms of the implementation of the curriculum through lesson coverage
and homework assigned by teachers. Therefore, there is a need to better understand the
relationship between types of homework assigned and mathematics achievement as an aspect of
OTL. Comparing the strengths of any effects can help teachers and schools make better
instructional decisions relative to curriculum and homework.
I conducted a pilot study in 2012 to investigate the role of homework in achievement, in
particular, the influence of homework types on opportunity to learn (OTL) and student
mathematics achievement. The research question in this pilot study was: To what extent do
different types of homework influence the correlation between teachers’ reported opportunity to
learn and students’ achievement? In this study, I used OTL to refer to instructional practices,
including teacher lesson coverage and amount of each of the types of homework assigned based
on the lesson taught in one curriculum, specifically the Transition Mathematics (Third Edition,
Field Trial Version) curriculum from the University of Chicago School Mathematics Project
(UCSMP).
The sample for the pilot study consisted of 5 teachers and their 165 7th grade students
from ages 12 to 13 using the Transition Mathematics curriculum. I performed several multiple
regression models and tested correlations between OTL and student mathematics achievement as
well as the influence of the three different types of homework in this curriculum (covering the

7
ideas, applying the mathematics, and review) on this correlation. The extent of such influence on
OTL and achievement was represented using percentages calculated by Sobel’s (1982) test.
The findings of the pilot study showed, overall, that all three homework types had
positive influence on the correlation between OTL and student mathematics achievement. In
particular, homework with the purpose of applying mathematics or review significantly increased
the impact of OTL on student achievement.
Results from the pilot study were presented at the International Congress on Mathematics
Education (ICME) in Seoul, South Korea, 2012. The presentation raised questions and interest
from researchers and participants of the conference. Hence, this study examined some of these
questions and determined the robustness of the findings from the pilot study.
Data analysis in the pilot study used homework as a mediating factor between lesson
coverage and student achievement. Although the findings from the pilot study were positive,
further examination about mediation analysis raised some concerns about the data analysis. The
original sample was small and limited to one mathematics course. So there is a need to test the
mediation using a larger sample size and more courses. Also the pilot study considered lesson
coverage as the only measure of OTL, so it is important to consider other aspects of OTL. In this
study, a multiple mediation model will replace the mediation approach used in the pilot study to
allow investigations of the mediation effects of all three types of homework in the curriculum
simultaneously and increase the accuracy of the original results.
Hence, the purpose of this study is to examine the role of homework types in influencing
OTL on student achievement. The study used a larger dataset and more courses to investigate the
robustness of the results from the pilot study. The results of the study suggested
recommendations for teachers on how to assign mathematics homework with the goal of

8
improving achievement. This study also served as a reference for future investigations of
influence of types of mathematics homework and achievement.
Research Questions
The purpose of this study is to examine whether there is a correlation between
opportunity to learn (OTL) and student mathematics achievement, and if so, to determine the
extent to which different types of homework influence such correlation. Opportunity to learn
here is measured by the actual lesson coverage provided by teachers and from teachers’ reports
of the opportunity they provided students to learn the mathematics on the posttests, also referred
to in this study as teachers’ reported posttest OTL in the research questions.
The research questions are the following:
1. How does opportunity to learn influence mathematics achievement in different
mathematics courses? In particular,
a. How does OTL as measured by lesson coverage influence mathematics
achievement in Pre-Transition Mathematics, Transition Mathematics, and
Algebra?
b. How does OTL as measured by posttest OTL influence mathematics achievement
in Pre-Transition Mathematics, Transition Mathematics, and Algebra?
2. To what extent do different types of homework influence the impact of OTL measured by
lesson coverage on student mathematics achievement measured by 3 posttests in each of
Pre-Transition Mathematics, Transition Mathematics, and Algebra?
3. To what extent do different types of homework influence the impact of opportunity to
learn mathematics measured by posttest OTL (i.e., teacher perceived opportunity to learn
the content on each posttest) on student mathematics achievement measured by each

9
corresponding posttest in Pre-Transition Mathematics, Transition Mathematics, and
Algebra?
4. What can we conclude from the difference of mediation effects of types of homework on
the correlation of opportunity to learn measured by lesson coverage and mathematics
achievement and on the correlation of opportunity to learn measured by posttest OTL and
mathematics achievement?
With these research questions in mind, the next chapter synthesizes studies that examine
the relationships between homework and achievement, opportunity to learn and achievement,
and statistical methodologies that have been used for research related to homework and
achievement.
Significance of the Study
Few studies have examined the relationship between types of homework problems and
OTL or achievement. Research has shown that OTL is a significant predictor of student
achievement. The lessons that teachers cover in their classroom instruction and the homework
they assign also provide their students an opportunity to learn mathematics. The goal of the
study was to determine whether different types of homework problems mediate the relationship
between OTL and achievement as well as to explain the differences among their effects through
several multiple mediation models for different mathematics courses.
The findings have the potential to provide insights that can guide classroom and policy
related to homework. Instead of debating whether students should be assigned more or less
homework problems, or no homework at all, educators can approach the issue from the angle of
assigning homework strategically when they understand positive and negative effects of
assigning different types of homework.

10
Definitions
Homework: defined as any tasks teachers assign to students to be completed during non-school
hours (Cooper, 1989).
Intended curriculum: is prewritten content intended to set standards for a particular subject and
grade level.
Implemented curriculum: is the content of instruction delivered by classroom teachers.
Lesson Coverage: refers to the lessons as taught by teachers.
Opportunity to Learn: refers to instructional practices, including teacher lesson coverage and
amount of each of the types of homework assigned based on the lessons taught in the curriculum.
Posttest opportunity to learn: refers to teachers’ reports of whether they taught or reviewed the
content needed for their students to answer each posttest item.

11
CHAPTER 2: LITERATURE REVIEW
Homework has always been an essential part of teachers’ instructional practice, yet it also
has been the most debatable topic especially among parents and schools. To better understand
homework and its influences in order to help determine which types of homework to assign to
students, it is necessary to understand the historical research perspectives about the role of
homework in the school curriculum. From synthesizing studies that examine the relationship
between homework and achievement, homework types as a factor of opportunity to learn and
how it affects achievement, I determine the definitions of the variables used in this study and
how the relationships are investigated. The definition and history of mediation and statistical
methods and modern mediation approach are also introduced in this chapter.
Historical Perspectives on Homework
Homework is not only the most common instructional practice in school mathematics,
but is also a subject of constant debate among parents, educators, and policy makers regarding its
necessity, frequency, and the quantity assigned to students. Not only do these concerns need to
be addressed in present and future studies, it is also important to understand reasons that led to
such concerns in the first place and what educators have studied in the past about the impact of
mathematics homework regarding these concerns. Hence, this literature review provides a
historical perspective related to research on homework.
In the early 1900s, research on homework assignments argued that homework increased
time on academic tasks, which resulted in the sculpting of good study habits such as self-

12
discipline (Bryan & Nelson, 1994; Gill & Schlossman, 2000). Such discipline developed
through memorization and was believed to help students’ knowledge acquisition. Homework
was encouraged as a strong learning strategy because it was believed that memorization could be
easily accomplished through doing homework without teachers’ instructions outside of the
classroom (Cooper, Lindsay, Nye, & Greathouse, 1998; Gill & Schlossman, 2000). This
perspective was soon challenged by researchers who emphasized the development of problem
solving skills and opposed learning through memorization. These views on homework led to
two new perspectives on homework in the 1920s: the homework abolitionists and the homework
reformers. The homework abolitionists suggested homework be abolished completely from
school. The reformers focused on seeking ways to reform homework to focus on developing
students’ conceptual understanding and interest in learning (Cooper, Lindsay, Nye, &
Greathouse, 1998; Gill & Scholssman, 2000).
In the 1930s and 1940s, many school districts abolished homework in grades K-6 because
it was considered to be ineffective and took time from students’ other activities. After World
War II, homework reformers raised issues related to students’ academic achievement compared
to students in other countries. They asserted that U.S. students were academically behind
students in other countries, especially in the subject of mathematics, and the abolishment of
homework played a role in this decline. Because of this, homework reformers focused their
research on shaping educational discourse on homework by defining its new pedagogical
purposes (Gill & Schlossman, 2000). Gill and Schlossman (2000) recommended teachers and
educators go beyond simple memorization of textbook materials in designing homework
problems and make the nature of the problems more activity based. Instead of suggesting that
homework is either all good or all bad, the reformers also worked on redefining the rationale and

13
content for a new look of homework instead of using repetitious drill on lessons already
presented in the classrooms. In addition, reforms on the impact of such changes in homework on
policy and scheduling were also taking place, designed to “control the organization, quantity, and
pacing of homework assignments and the burdens they placed on students and their family” (Gill
& Schlossman, 2000, p. 33). The central mission of such reform called for “learning by doing”,
“educating the whole child”, and “child-centered learner driven education” (Gill & Schlossman,
2000). This perspective directly resulted in an increase in the amount of homework assigned
(Cooper & Valentine, 2001).
In the 1960s and 1970s, psychologists began to view homework as putting pressure on
students, potentially affecting their mental health because homework took time away from
students’ other social, recreational and creative activities (Wildman, 1968). The result was a
decrease in homework assignments in schools. In 1983, A Nation at Risk identified lack of
homework as one of the major causes for poor mathematics performance in the US (National
Commission on Excellence in Education, 1983), which led to a new educational focus on
achievement by setting higher standards for educational practices. Many schools started to
require more homework at early grades, even in kindergarten (Gill & Schlossman, 2000; Kohn,
2006). In 2001, No Child Left Behind called for mandatory annual testing to close the
achievement gap in schools which also resulted in increased homework assignments (Kohn,
2006), especially mathematics homework. Nevertheless, public concerns from parents and social
media about homework being a stress factor for students still remain a challenge for schools and
educators (Cooper et al., 2006).
Historical views of homework indicate that the place of homework has changed through
influences from the public and perspectives related to reform. It is clear that homework is still a

14
topic for heated debate among educators and parents. Thus, it is important for researchers to
have a full understanding of the nature of the homework assignment and its direct and indirect
effect on student achievement. Such understanding is essential for proper structuring of school
policies and instructional practices because ultimately homework assignment should be designed
to enhance student mathematics achievement.
Homework and Achievement
As one aspect of opportunity to learn, research on homework has generally shown a
correlation between homework and student achievement (Cooper, 1989; Cooper, Robinson, &
Patall, 2006). Although measures of homework vary, some using amount and others using
frequency or types of homework, such correlation between homework and achievement is
generally found to be positive.
Cooper (1989) conducted a meta-analysis of 120 empirical studies on the effects of
homework using studies conducted between 1960 and 1987. He concluded that there were three
different types of studies on homework and achievement. The first type investigated the
achievement level of students who were given homework with those who were not given
homework to determine if the existence of homework is a factor in achievement. Such studies
were normally conducted in a controlled environment with predetermined students of similar
background and similar levels of prior knowledge being randomly assigned to two groups. Most
studies of this type showed that homework being assigned generally had a positive influence on
student achievement (Foyle, 1984, 1990; McGrath, 1992; Finstad, 1987, Meloy, 1987; Townsend,
1995). In addition, there were also significant grade level differences on the relationship
between homework and achievement outcomes as measured by standardized tests. High school
students with homework assigned scored significantly higher than those of the same grade with

15
no homework. Middle grade students with homework performed moderately higher than those
with no homework.
Cooper, Robinson and Patall (2006) also analyzed studies on homework and achievement
conducted between 1987 and 2003. By grouping experimental studies using random assignment
of students and controlling whether homework was assigned, they discovered that most studies
found a positive effect of homework assignment on mathematics or language arts achievement
(Finstad, 1987; Foyle, 1990; McGrath, 1992; Townsend, 1995). These studies, however, have
limitations. Cooper, Robinson and Patall (2006) revealed that studies conducted in controlled
environments with homework being assigned mostly used similar questions to those on the tests
used to measure achievement; hence students who were not assigned any homework did not have
a chance to practice these questions. Consequently, the results are somewhat compromised. The
studies using standardized assessments as posttest scores can only measure the immediate effect
of homework, but cannot measure the long-term effect without considering other factors that
might compromise the controlled environment. The second type of studies identified by Cooper,
Robinson and Patall (2006) compared homework completed outside of schools with homework
completed in class. These studies found that supervised homework had a stronger influence on
achievement than homework completed alone, especially when homework and in-class work
were compared in elementary schools. Students who completed more supervised homework had
better achievement scores on posttests than those who only completed homework outside of
schools with no supervision. However, this correlation was not significant with students in
middle and high schools. Once again this type of research showed a strong grade-level influence.
The last type of studies examined the amount of time students spent on homework with their
achievement outcomes and showed a significant correlation between the two. These studies

16
often focused on either attempting to establish a causal relationship between homework and
mathematics achievement or used homework as one of the factors that correlated with student
achievement. Cooper’s (1989) analysis of these studies indicated a correlation between
homework and achievement but none of these studies investigated the role of types of homework
on student achievement.
More recent studies (Davis & Jordan, 1994; Hill, 2003; Peng & Wright, 1994; Thomas,
2001; Thomas, 2002) have investigated homework’s role in achievement along with
consideration of other factors using multivariate analyses models. Using data from the National
Education Longitudinal Study of 1988 (NELS) or NELS follow-up studies on the same group of
middle school and high school students in later years, these studies provide more insights on
various factors that might affect achievement, homework being one of these factors. The most
frequently used measure of homework assignment in these studies is the amount of homework
assigned, either frequency or length of homework completed by students or assigned by teachers.
Most of these studies revealed a positive effect of the amount of homework on achievement.
These studies did not include exogenous factors such as socio-economic status or gender in their
analysis because the data were not collected in a controlled environment.
Other studies that controlled for variables such as prerequisite knowledge also used
multivariate analysis to examine the relationship between the amount of homework and
achievement (Brookhart, 1997; Cool & Keith, 1991; Fehrmann, Keith & Reimers, 1987; Foyle,
1990; Cooper, Lindsay, Nye & Greathouse, 1998; Hendrix, Sederberg & Miller, 1990; Olson,
1988; Smith, 1990; Smith, 1992; Wynn, 1996; Portes & MacLeod, 1996). Results from these
studies generally revealed a positive correlation between the amount of homework assigned and
student achievement, but indicated such relationships are not causal (Cooper et al., 2006). These

17
studies normally calculated a simple bivariate correlation between the amount of homework and
scores from an achievement assessment and did not consider other variables that might affect
such correlations. These studies revealed a significant correlation between the time spent on
homework and achievement, although such correlations were not significant for elementary
students.
In summary, although many studies have examined the relationship between homework
and achievement, researchers have not reached an agreement on how teachers assign homework
and its effectiveness on improving student achievement. There is a lack of literature on
homework types and their effect on student achievement. However, homework is often seen as
an aspect of opportunity teachers provide for students to learn mathematics. It is also important
to look at related literature on opportunity to learn considering homework assignment.
Homework and Opportunity to Learn
Opportunity to learn (OTL), as an explanation for differences in achievement among
students (Floden, 2002), was first introduced by Carroll (1963) as one of the five critical
constructs in his model of school learning. Carroll (1996) defined OTL as the amount of time
that is available to a student to learn a specific task. In contrast to Carroll’s model, Husén (1967)
considered OTL as the overlap of mathematics taught and mathematics content actually tested.
The combination of Carroll’s and Husén’s models was adapted by other researchers into various
OTL frameworks for purposes of their studies (Robitaille & Travers, 1992; Winfield, 1987,
1993).
Stevens (1993) identified variables related to teacher instructional practices and student
learning which form an OTL framework that was widely recognized by educators. These
variables include content exposure and coverage variables, content emphasis variables, and

18
quality of instructional delivery variables. Content exposure and coverage variables measure
not only the amount of time students spend on learning but also the depth of the instructions they
are provided. Content emphasis variables connect the content coverage provided by teachers
within the implemented curriculum and the selection of assessment for purpose of basic skills
instruction or beyond, hence, the types of homework assigned. Quality of instructional delivery
variables are basically variables that describe how instructional practices affect students’
academic achievement.
The construct of OTL has also appeared in studies organized by the International
Association for the Evaluation of Education Achievement. OTL was initially defined to be
opportunity that students have to learn the content of the test items. This definition was later
broadened to “…criteria for, and the basis of, assessing the sufficiency or quality of the resources,
practices, and conditions necessary at each level of the education system (schools, local
educational agencies, and States) to provide all students with an opportunity to learn the
material…” (Goal 2000: Educate America Act, 1994, Section 3a(7)). The OTL addressed but
was not limited to dimensions such as curricula, instructional material, teacher capability,
alignment of curriculum, instructional practices, and assessment with content standards. Schmidt
and Maier (2009) measured opportunity to learn using content coverage, content exposure
variables considering time and depth of teaching, and content emphasis variables such as lower
versus higher order skills.
NRC (2001) clarified that OTL is not solely provided by teachers. The curriculum the
teacher uses influences students’ opportunity to learn (Stein et al., 1996). The way the teacher
teaches and the expectations that teachers have also play a major role in shaping students’

19
learning opportunities. In particular, research has shown that homework provides an OTL for
mathematics beyond classroom instruction (Cooper, Robinson, & Patall, 2006).
Similarly, in the National Education Longitudinal Study of 1988 (NELS), researchers
collected achievement test scores in mathematics, reading, science, and social studies from
24,500 eighth grade students; students and their teachers also completed questionnaires. The
questionnaires included items on homework, such as the total minutes of homework completed
or assigned in different subject areas. Using data collected from NELS reports, Lam (1996) used
regression equations to examine the effect of mathematics homework on achievement. Students
who reported doing homework always performed better than those who did not do homework.
Among students who did homework, students who did 7 to 12 hours of homework per week had
higher achievement scores than those who did 1-6 hours, 13-19 hours, or 20 hours and more per
week. This result suggested a curvilinear relationship between homework and achievement.
However, Lam (1996) restricted the sample of students to only Asian Americans and Caucasian
Americans. Thus, this result cannot be generalized to all student populations.
Research has suggested many positive as well as negative consequences of homework in
learning various subjects and more recent studies on the effect of homework and achievement
use the amount or the frequency of homework assignment as a component of OTL (Cooper, 1989;
Epstein, 1989; Warton, 2001). Such studies only consider the significance of the homework
effect as an additive effect with other factors on achievement. Few studies have emphasized the
effects of different types of homework assignments and further examined the extent of such
effects specifically within the context of mathematics learning. Potential positive effects of
homework for improving immediate achievement and learning include better retention of factual

20
knowledge, increased understanding, and better critical thinking, concept formation, information
processing and curriculum enrichment (Warton, 2001).
Omlin-Ruback (2009) was among the few researchers who examined the types of
homework assignments that related to student performance. She investigated the types of
homework assigned to fifth-grade students, their interaction with the assigned homework, and
the relationship between homework and achievement using a convenience sample of fifth-grade
students from a school district in the Pacific Northwest. Her findings show that homework with
the purpose of developing conceptual understanding, and not just memorization or practicing
procedural skills, is the main type of homework associated with higher student mathematics
achievement scores. Because of her small sample, she mentioned that findings should not be
generalized and recommended similar studies with larger samples. Her study was limited to
elementary school students, hence also not generalizable to other grade level students.
Given the ongoing studies on the importance of homework related to student
mathematics achievement and lack of literature on types of homework relating to student
achievement, there is a need for studies on types of homework. It is also necessary to look the
pros and cons of statistical methods that have been used to study homework and determine the
most appropriate statistical method that should be used to examine mediating effects of types of
homework in mathematics education.
Statistical Mediation Methods
The importance of mediation in statistical methods has been long recognized and
statistical mediation analysis has been a part of educational studies in recent years. Mediation
enables researchers to explain how and how much factors influence one another.

21
Baron and Kenny (1986) proposed a four-step mediation analysis approach involving
regression analyses for each of the steps and testing the significance of the coefficients. This
approach first requires that zero-order relationship among the variables exists in the first three
steps; a zero-order relationship would be a relationship between two variables while ignoring
influences of other variables that might have effect on this relation. If one of the three
relationships in the first three steps is not significant, then a mediation effect is not possible or
likely. Assuming there are significant relationships for the first three steps, a multiple regression
analysis is conducted with the independent variable and proposed mediating variable predicting
the dependent variable. Some level of mediation is then concluded if the effect of the mediating
variable remains significant after controlling for the independent variable. If the relationship
between the independent variable and the dependent variable is no longer significant when the
mediator is controlled, then one can proceed to the conclusion that the mediator supports full
mediation. If the independent variable is still significant when the mediator is controlled, then
the mediator partially mediates the relationship between the independent variable and the
dependent variable.
Baron’s four-step approach has dominated mediational studies for many years. However,
there are many limitations of this approach. First, because the independent variable is assumed to
cause the mediator, a correlation is required between the two variables. Recent studies
(MacKinnon, Fairchild, & Fritz, 2007) have found that this is not always true. Hence, the first
step of Baron’s approach is not necessary. Second, the four step approach does not support
multiple mediators. In educational studies, it is essential to consider many factors when trying to
explain the differences of the indirect effects of these factors as well as explaining how the
indirect effect differs when considered individually or as part of the total effect. Third, the

22
mediator variable tested here is required to be continuous while many factors that could
potentially mediate a relationship are categorical, such as gender. Finally, Baron’s four-step
approach to mediation requires a sample size larger than 200 to achieve a reliable estimate.
Baron’s approach remains popular among researchers because it is easy to understand
and follow. However, modern methodological studies (Cerin & MacKinnon, 2009; Hayes, 2009;
Rucker et al., 2011) suggest that researchers should not focus on testing the significance of paths
in a mediation model by a hypothesis test, but “explicitly estimating the indirect effect and
making an inference about its size in the population irrespective of the size of significance of the
total effect” (Hayes & Preacher, 2012, p. 10).
Figure 3. Schematic Illustrating Mediation Model Figure 3 illustrates the model with the indirect effects that are to be tested. In particular,
the significance of path cʹ′ (a direct effect) is determined when it is mediated by the variables
indicated within the mediation process. The indirect effect represents how the changes in the
dependent variable for every unit change in the independent variable are mediated by the
indicated variables.
Sobel (1982) proposed a hypothesis testing procedure for indirect effects that has been
widely used by researchers to estimate the standard errors of the indirect effect and to calculate
the estimated indirect effect. Although this testing procedure was acknowledged by Baron and
Path cʹ′

23
Kenny (1986), it is not recommended in samples with sizes less than 200. Modern approaches to
mediation analysis focus on estimation and inference about the indirect effect of the independent
variable on the dependent variable through proposed mediating variables. The concept of
mediation is for researchers who are interested in understanding how things work. In order to
accomplish such understanding, Hayes and Preacher (2012) point out that the key is to be able to
explain the indirect effect of the mediator and its strength convincingly after establishing some
causal relationship between the independent variable and dependent variable through a mediator.
The mediating effects can be tested more accurately using testing methods such as bootstrapping
(MacKinnon, Lockwood, & Williams, 2004; Preacher & Hayes, 2004, 2008; Shout & Bolger,
2002), the distribution of the product methods (MacKinnon, Fritz, Williams, & Lockwood, 2007),
and the Monte Carlo confidence intervals (Preacher & Selig, 2012; MacKinnon et al., 2004) that
do not have a strict requirement of sample size to ensure a close estimation of the indirect effect.
Application of these approaches is easy by statistical software such as SPSS or SAS.
Summary
In summary, historical perspectives on the place of homework in the school curriculum
have shown different opinions on the effect of homework. Studies conducted on homework and
achievement have mostly shown positive correlations but often using the amount of homework
as a measurement. Few studies have considered homework type as a factor of opportunity to
learn and how it affects achievement.

24
CHAPTER 3: METHODS
In this chapter, I describe the research design, sample, and measures used to analyze the
mediation effects of types of homework on the influence of opportunity to learn measured by
lesson coverage on students’ mathematics achievement and on the influence of teacher perceived
opportunity to learn (OTL) measured by posttest opportunity to learn on students’ mathematics
achievement. This research examines the extent to which types of homework mediate the
influence of OTL on student mathematics achievement. For the purpose of the present study, I
consider OTL as “circumstances that allow students to engage in and spend time on academic
tasks…” (National Research Council, 2001, p. 333). Opportunity to learn here is examined
through teachers’ actual lesson coverage and teachers’ reported item coverage on the posttests.
Research Questions
The purpose of the study was to examine the extent to which types of homework mediate
the impact of OTL on student mathematics achievement. The term OTL is approached from two
perspectives: the actual lesson coverage and teachers’ perceived opportunity provided to learn
the mathematics assessed on the posttest. The research questions examined in this study were:
1. How does OTL influence mathematics achievement in different mathematics courses? In
particular,
a. How does OTL as measured by lesson coverage influence mathematics
achievement in Pre-Transition Mathematics, Transition Mathematics, and
Algebra?

25
b. How does OTL as measured by posttest OTL influence mathematics achievement
in Pre-Transition Mathematics, Transition Mathematics, and Algebra?
2. To what extent do different types of homework influence the impact of OTL measured by
lesson coverage on student mathematics achievement measured by 3 posttests in each of
Pre-Transition Mathematics, Transition Mathematics, and Algebra?
3. To what extent do different types of homework influence the impact of OTL measured by
posttest OTL (i.e., teacher perceived OTL measured by each posttest) on student
mathematics achievement measured by each corresponding posttest in Pre-Transition
Mathematics, Transition Mathematics, and Algebra?
4. What can we conclude from the difference of mediation effects of types of homework on
the correlation of OTL measured by lesson coverage and mathematics achievement and
on the correlation of OTL measured by posttest OTL and mathematics achievement?
Background of Study
The research reported in this study is based on a secondary analysis of data collected as
part of the evaluations of the University of Chicago School Mathematics Project (UCSMP)
secondary mathematics curricula, specifically Pre-Transition Mathematics (PTM) during the
2006-2007 school year (1rd Edition, Field Trial Version), Transition Mathematics during the
2005-2006 school year (3rd Edition, Field Trial Version), and Algebra (3rd Edition, Field Trial
Version) during the 2005-2006 school year. Pre-Transition Mathematics (Year 1) “integrates
arithmetic with work in statistics, geometry, and algebraic thinking” and “explores algebra to
describe generalizations, solve simple equations, and write formulas” (Thompson, Senk, & Yu,
2012, p. 6). Transition Mathematics (Year 2) “serves as a pre-algebra text, but with significant
geometric work integrated with algebra” (p. 6). Algebra (Year 3) “explores a wide range of

26
functions, including exponential functions, while also weaving statistics and geometry with
algebra” (p. 7). These courses are designed for students who are at grade levels 6 to 8, with PTM
students generally in grade 6; although Algebra is designed for grade 8 students, some students
use this text in high school. The Third Edition of the secondary materials, developed from 2005
to 2008, maintained effective features from previous versions but also incorporated elements
such as active learning, cooperative group work, and technology (Thompson, Senk & Yu, 2012).
All UCSMP curriculum materials contain the same basic lesson elements with a range of
mathematics topics in terms of content, and with assumptions that students are required to learn
mathematics through reading, and hence, to answer questions related to the reading. Problem-
solving and applications are embedded throughout the material so that students are provided
opportunity to relate mathematics and explore real-world problems, with technology as
assistance to understanding and exploration. The materials use a modified mastery approach to
instruction supported by problem sets designed to balance the practice of skills, properties, uses,
and representations of concepts after each lesson (Thompson, Senk & Yu, 2012).
Each lesson of these three textbooks contains four types of homework problems for
students to complete:
• Covering the Ideas questions focus on basic concepts within the lesson, with
many problems being similar to those actually found within the lesson’s examples.
• Applying the Mathematics questions extend the concepts or integrate them with
previously learned concepts so students can apply ideas in new contexts.
• Review questions provide opportunities for students to continue working on
important concepts in subsequent lessons and chapters, based on a modified
mastery approach within the UCSMP curriculum.

27
• Exploration questions provide extensions and investigations beyond the essential
concepts. (Thompson, Senk, & Yu, 2012, p. 6)
UCSMP recommends that teachers assign most, if not all, of the problems in these types of
homework questions with the exception of the exploration questions (Thompson, Senk & Yu,
2012). For the purpose of this study, only covering the ideas, applying the mathematics, and
review questions are investigated because these are the types of homework problems expected to
be assigned by teachers on a regular basis.
Data Collection
The datasets used in this study are subsets of a large existing dataset collected as part of
the evaluations of the secondary materials developed by UCSMP. Although the UCSMP
evaluation studies included students using both UCSMP materials and comparison textbook
materials, only the teachers and students using UCSMP textbooks were included in this study.
By restricting the sample to teachers and students using the UCSMP curriculum, I controlled for
the types of homework problems aligned with the most common instructional purposes for
homework problems reviewed in the literature review section. Non-UCSMP materials were
excluded because teachers and students who used these materials did not necessarily have access
to homework problems with the same purposes as those in the UCSMP curriculum.
The samples for the three courses were distinct, meaning that students participated in
only one evaluation study. The results from three studies were compared after data were
analyzed in each sample to determine if the findings are consistent across studies. Standardized
pretest scores were used to control for prerequisite mathematics knowledge before students
started studying the curriculum. Posttest scores were used to measure achievement from
standardized tests and tests made by UCSMP staff. The final sample size in each course was

28
determined by including only UCSMP students in PTM, TM, or Algebra who took all pretests
and posttests in these three courses and stayed with the same teacher along with the teachers of
these students.
Teacher data were collected from teacher questionnaires, teacher posttest opportunity to
learn forms, and teachers’ chapter evaluation forms. Opportunity to learn is based on two
perspectives separately: teacher reported lesson coverage and teacher reported opportunity to
learn the content of the posttest items. I expected there to be differences in the final results of
the mediating effects of homework types using opportunity to learn based on the independent
variables of lesson coverage or posttest opportunity to learn analyzed individually.
The mediating variables were homework types: covering the ideas, applying the
mathematics and review. These mediators were measured by the percent of available problems of
each type teachers assigned to their students, with the calculated percentage of problems
assigned based only on problems in lessons taught. Unfortunately information about students’
completion of these homework problems was not available which was one limitation of the study.
Participants
Ten schools participated in the Pre-Transition Mathematics study. At eight of these
schools, students were in sixth grade; at two schools, students were in seventh grade. Six
schools participated in the Transition Mathematics evaluation study, with students at two schools
in sixth grade and students at four schools in seventh grade. Six schools participated in the
Algebra evaluation study, four of which were middle schools and two of which were high
schools. The only students included were those who took all assessments including the two
pretests and three posttests for each mathematics course and who had the same teacher and
stayed in the same class for the duration of the study. For Pre-Transition Mathematics, there

29
were 287 students in the final sample for Transition Mathematics, there were 237 students and
for Algebra, there were 232 students.
Instrumentation
Tests to Access Achievement
Pre-Transition Mathematics. The two pretests used to assess students’ prerequisite
knowledge for Pre-Transition Mathematics (see Appendix A) at the beginning of the year were:
the TerraNova CAT Survey 16, which was a standardized 31-item multiple-choice test (CTB
McGraw-Hill, 2001) assessing prerequisite knowledge of arithmetic, algebra readiness, and
geometry; and the Entering Mathematics Test which contained 29 questions developed by
UCSMP that also focused on prerequisite knowledge on arithmetic, algebra readiness, and
geometry. Calculators were not permitted on either of the pretests. The three posttests (see
Appendix A) used to assess students’ mathematics achievement at the end of the school year
were: the Terra Nova CAT Survey 17, which was a standardized 32-item test focusing on
decimal and fraction arithmetic, algebraic items or patterns, geometric concepts, measurement
and data; the Mathematics Test One, a 36-item multiple-choice test constructed by UCSMP to
provide additional insight on the content of the Terra Nova CAT Survey 17 and to provide
measures of growth from the pretest; and a Problem-Solving and Understanding Test which was
a 16-item test that required short answers in which students were expected to share their thinking
about arithmetic, algebraic, or geometric concepts and for which calculators were permitted.
Transition Mathematics. The two pretests (see Appendix B) for the purpose of assessing
students’ prerequisite knowledge at the beginning of the year were: the TerraNova CAT Survey
17C, which was a standardized 32-item multiple-choice test (CTB McGraw-Hill, 2001) that
assesses prerequisite knowledge for Transition Mathematics, including number concepts,

30
algebraic ideas or patterns, geometric concepts, measurement, and data analysis; and Middle
School Mathematics Test which was a 28-item multiple-choice test developed by UCSMP
assessing knowledge of equations or inequalities, measurement formulas, and transformations,
with a number of items expected to be repeated on the posttest for purposes of assessing growth
over the year. Calculators were not permitted on either of the pretests. The three posttests (see
Appendix B) used at the end of the year were: the Iowa Algebra Aptitude Test: Form 1 Fourth
Edition which is a 63-item multiple choice standardized test (Schoen & Ansley, 1993a) that
assessed readiness for algebra; Algebra/Geometry Readiness Test: Part One developed by
UCSMP which contained 40 multiple-choice questions focusing on variables and their uses,
equations and inequalities, measurement, transformations, and geometric figures and their
properties; and Algebra/Geometry Readiness Test: Part Two which contained 12 constructed
response items developed by UCSMP project staff (Thompson, Senk, & Yu, 2012) for which
students needed to explain their thinking when solving the arithmetic or algebraic problems.
Calculators were not permitted on the Iowa Algebra Aptitude Test (IAAT) or the
Algebra/Geometry Readiness Test: Part One but were allowed on Part Two.
Algebra. There were two pretests (see Appendix C) for the purposes of assessing
students’ prerequisite knowledge at the beginning of the year. One pretest was the Iowa Algebra
Aptitude Test: Form 1 (Fourth edition) which was a standardized test containing 63 items that
assess students’ algebra readiness (Schoen & Ansley, 1993); and the Entering Algebra Test: Part
One which was a 30-item multiple-choice test developed by UCSMP assessing solving equations
and inequalities, functional relationships, equivalent expressions and equations, and real number
arithmetic, with a number of these items expected to be repeated on the posttest to assess growth
over the year. (Thompson & Senk, in preparation).

31
Three posttests (see Appendix C) were used at the end of the school year. The first
posttest was the TerraNova Algebra I (CTB-McGraw Hill, 2005), which was a standardized test
containing 32 multiple-choice items assessing knowledge of first-year algebra and for which the
use of calculators was not permitted. The second posttest, the Algebra Test: Part One, was a 38-
item multiple-choice test developed by UCSMP staff assessing equations and inequalities,
functional relationships, equivalent expressions and equations, and real number arithmetic and
for which calculators were not permitted. The third posttest was the Algebra Test: Part Two
which contains 11 constructed-response items developed by UCSMP project staff to assess the
ability of students to explain their thinking when solving more complex algebraic problems and
for which calculators were permitted.
Teacher Chapter Evaluation Form
For each chapter of the textbook, teachers completed a chapter evaluation form (see
Appendix D) in which they rated the lesson text and problems, indicated the length of time spent
on each lesson, and recorded the homework problems assigned. In addition, they provided
constructed-response comments to specific questions about each chapter. The homework
problems assigned were classified as covering the ideas, applying the mathematics, or review to
determine a percentage of available problems of each type that students had an opportunity to
complete from only the lessons taught by their teachers.
Teacher Opportunity-to-Learn (OTL) Form
The Posttest Opportunity-to-Learn Form completed by teachers at the end of the year
provided an opportunity for teachers to indicate whether they taught or reviewed the content for
every item on all posttests, whether teachers taught or reviewed the content needed for their
students to answer each of the items on the posttests (Thompson, Senk, & Yu, 2012).

32
For each item on all three posttests, the following questions were asked:
1. During this school year, did you teach or review the mathematics needed for your
students to answer this item correctly?
a. Yes, it is part of the text I used.
b. Yes, although it is not part of the text I used.
c. No, because it is not part of the text I used.
d. No, although it is part of the text I used.
2. If your students take a state assessment at the grade level in which this course is being
taught, is the content addressed by this item tested on the state assessment?
a. Yes
b. No
Responses to this form provided information on the extent to which students had an
opportunity to learn the mathematics assessed on posttest items, at least from the teacher
perspective (Thompson, Senk, & Yu, 2012). The percent of items for which teachers reported yes
was used to obtain the teachers’ perceived OTL percent on the posttest in the mediation models.
Data Analysis
Multiple mediation models, developed by Preacher and Hayes (2008) using bootstrapping
in SPSS, were used to test the indirect effect of different homework types as mediators on the
effect that opportunity to learn mathematics has on students’ achievement for each of the three
courses, controlling for prerequisite knowledge. In this present study, I examined multiple
mediators using a macro indirect written by Preacher and Hayes (2008) in SPSS with
bootstrapping tests because of the moderate size of the sample.

33
The results were then compared to the indirect effect of these homework types as
mediators on the effect that teachers’ reported opportunity to learn had on students’ achievement
for all three courses as well.
Bootstrapped tests were used to calculate the differences between the indirect effects of
the mediators by calculating the total and indirect effects as well as bias-corrected confidence
intervals for the indirect effects. The benefit of using bootstrapping is that it is based on random
sampling processes, so by resampling the original dataset, I can generate comparable data to see
if the results are similar by comparing the contrasts between the mediators that are created during
the process.
The variables for each of the courses were as follows:
Dependent Variables:
Achievement scores on all three posttests for each course.
Independent Variables:
Teachers’ lesson coverage reported as the percentage of the lessons in the book
that the teacher taught.
Teachers’ reported opportunity to learn based on posttest items.
Mediators:
Percent of Covering the Ideas exercises assigned based on lessons taught.
Percent of Applying the Mathematics exercises assigned based on lessons taught.
Percent of Review exercises assigned based on lessons taught.
Covariates:
Achievement on adjusted pretest percentage for all three courses.

34
Figure 4. Schematic illustrating mediation model as used in this study Figure 4 illustrates the model that was tested with the relationships among variables,
especially significance of path cʹ′ (a direct effect) when it was mediated by the variables indicated
within the mediation process. True indirect effects and estimated indirect effects representing the
changes in the dependent variable for every unit change in the independent variable were the
emphasis of this study and verified by bootstrapping to see if the influence of OTL on student
mathematics achievement was indeed mediated by the indicated variables, and if so, by how
much.
Path cʹ′

35
CHAPTER 4: RESULTS
Providing students the opportunity to learn mathematics has been a main emphasis in
improving student achievement in school mathematics. The purpose of this research study was to
investigate the extent to which types of homework influence the impact of opportunity to learn
mathematics on student achievement. Subsets of data taken from the University of Chicago
School Mathematics Project (UCSMP) were used in this study with students who studied from
Pre-Transition Mathematics, Transition Mathematics, and Algebra taken as the sample.
Homework types that cover the ideas, apply the mathematics, or review were examined as the
mediators of the influence of opportunity to learn measured by either teachers’ lesson coverage
or teachers’ perceived opportunity to learn the content on posttest items from the three
mathematics courses.
The study was a quantitative study using path analysis to investigate mediation effects of
three types of homework problems proposed as mediators. Bootstrapping was performed to
validate the true indirect effect by creating 10,000 samples to obtain an estimated indirect effect
and significance was determined by bias corrected confidence intervals.
Opportunity to Learn Measured by Lesson Coverage, Questions Assigned, and
Opportunity to Learn Content on Posttest Items
For Pre-Transition Mathematics, 13 teachers participated in the study. The opportunity
to learn measured by lesson coverage and measured by teachers’ reported posttest OTL is
reported in Table 1. The data show that OTL measured by lesson coverage in Pre-Transition
Mathematics had more variability, ranging from 41% to 90%; OTL percentages measured by

36
posttest OTL were consistent among teachers, ranging from about 80% to 100% for all three
posttests.
Table 1 Teacher Provided OTL Measured by Lesson Coverage and by Teachers’ Reported Posttest OTL for Pre-‐Transition Mathematics Teacher OTL
Measured by Lesson
Coverage (%)
OTL Measured by Posttest 1
(%)
OTL Measured by Posttest 2
(%)
OTL Measured by Posttest 3
(%) T4114U2 41 75 75 81 T4114U1 51 75 75 81 T4115U1 70 88 94 100 T4116U1 80 75 92 94 T4118U1 89 84 100 100 T4119U1 90 100 100 100 T4120U1 79 97 100 100 T4121U1 80 100 100 94 T4123U1 53 94 92 81 T4124U2 69 81 75 88 T4124U1 70 81 86 88 T4101U1 78 97 97 94 The homework coverage of each teacher is reported in Table 2. The data show noticeable
variability in the nature of the types of homework problems assigned by PTM teachers with
review homework considerably lower than covering the ideas homework or applying the
mathematics homework.
For Transition Mathematics, 7 teachers participated in the study. The OTL measured by
lesson coverage and teachers’ reported posttest OTL is reported in Table 3. The data showed that
OTL measured by lesson coverage for TM ranged from 56% to 92%, and OTL percentages
measured by TM posttest OTL had more variability with reported coverage of the content on the
two multiple choice posttests ranging from 70% to 92% for posttest 1 (IAAT) and 55% to 100%

37
for posttest 2 (Algebra/Geometry Readiness Test) but only 41% to 76% for the problem solving
test.
Table 2 Number and Percent of Question Types Assigned by UCSMP Pre-Transition Mathematics Teachers Based on Lessons Taught Teacher Covering (#/%) Applying (#/%) Review (#/%)
T4114U2 406/84 184/63 86/51 T4114U1 588/88 297/74 156/42 T4115U1 776/97 456/93 224/49 T4116U1 699/79 309/57 210/40 T4118U1 940/99 557/96 241/43 T4119U1 886/93 537/91 516/91 T4120U1 845/97 518/98 492/96 T4121U1 787/100 489/100 440/97 T4123U1 639/88 293/67 131/32 T4124U2 481/60 353/72 283/62 T4124U1 800/100 490/100 439/95 T4101U1 761/98 367/77 259/59 Note: The percent was calculated by dividing the actual number of homework problems assigned of each type by the total number of possible problems of each type of homework in the lessons taught.
The homework coverage of each teacher is reported in Table 4. The data show noticeable
variability in the nature of the types of homework problems assigned by TM teachers with review
homework considerably lower than covering the ideas homework or applying the mathematics
homework, with one teacher only assigning 27% of the review homework and another assigning
91% of the review homework.
There were 6 teachers who participated in the Algebra study. The variability of OTL
measured by lesson coverage and teachers’ reported posttest OTL are reported in Table 5. OTL
measured by lesson coverage for Algebra is ranged from 47% to 100%. With the exception of
two teachers, teachers generally reported posttest OTL for at least 90% of posttest 1 items. And

38
teachers’ reported posttest 2 OTL ranged from 67% to 100% and from 7% to 100% for the
problem-solving test.
Table 3 Teacher Provided OTL Measured by Lesson Coverage and by Posttest OTL for Transition Mathematics Teacher OTL
Measured by Lesson
Coverage (%)
OTL Measured by Posttest 1
(%)
OTL Measured by Posttest 2
(%)
OTL Measured by Posttest 3(%)
T2102U1 84 83 100 71 T2103U1 80 79 95 65 T2104U1 92 79 93 65 T2105U1 69 70 55 47 T2106U1 70 92 95 76 T2106U2 56 92 95 76 T2107U1 80 90 100 41 Table 4 Number and Percent of Question Types Assigned by UCSMP Transition Mathematics Teachers Based on Lesson Taught Teacher Covering (#/%) Applying (#/%) Review (#/%) T2102U1 966/94 470/73 160/27 T2103U1 905/91 491/83 271/48 T2104U1 1107/98 625/91 500/78 T2105U1 802/92 344/61 237/50 T2106U1 812/93 553/97 233/48 T2106U2 703/96 462/96 314/82 T2107U1 960/99 615/99 518/91 Note: The percent was calculated by dividing the actual number of homework problems assigned of each type by the total number of possible problems of each type of homework in the lessons taught.
The homework coverage of each teacher is reported in Table 6. The data showed again
that teachers assigned the least amount of review homework. One teacher assigned 83% of
review problems but another only assigned 2% of such problems. The assignment of covering
the ideas problems ranged from 48% to 100% and applying the mathematics problems ranged
from 25% to 99%.

39
Table 5 Teacher Provided Opportunity to Learn Measured by Lesson Coverage and Teachers’ Reported Posttest OTL for Algebra
Teacher OTL Measured by
Lesson Coverage (%)
OTL Measured by Posttest 1
(%)
OTL Measured by Posttest 2
(%)
OTL Measured by Posttest 3
(%) T3107U1 84 97 89 100 T3108U1 47 72 84 67 T3110U1 75 94 97 100 T3112U1 100 91 100 100 T3111U1 80 97 100 100 T3109U1 58 59 74 67
Table 6 Number and Percent of Question Types Assigned by UCSMP Algebra Teachers Based on Lesson Taught Teacher Covering (#/%) Applying (#/%) Review (#/%) T3107U1 963/100 552/99 581/83 T3108U1 430/86 232/79 219/54 T3110U1 795/94 432/89 367/58 T3112U1 982/87 450/68 377/45 T3111U1 887/95 511/95 466/71 T3109U1 313/48 379/25 10/2
Note: The percent was calculated by dividing the actual number of homework problems assigned of each type by the total number of possible problems of each type of homework in the lessons taught.
Impact of Two Types of OTL and Achievement (Research Question 1)
The first research question examined how opportunity to learn influences mathematics
achievement within different mathematics courses, respectively,
a. How does opportunity to learn (OTL) as measured by lesson coverage influence
mathematics achievement in Pre-Transition Mathematics, Transition
Mathematics, and Algebra?

40
b. How does teachers’ reported posttest opportunity to learn influence mathematics
achievement in Pre-Transition Mathematics, Transition Mathematics, and
Algebra?
The Impact of Lesson Coverage as OTL (Part A)
Part a of research question 1 examined how OTL as measured by lesson coverage
influenced mathematics achievement in Pre-Transition Mathematics, Transition Mathematics,
and Algebra. This was answered by conducting 9 sets of regressions using OTL as measured by
lesson coverage to predict mathematics achievement measured by 3 posttests in each of three
mathematics courses (Pre-Transition Mathematics, Transition Mathematics, and Algebra). A
standardized pretest score was used in each regression as a covariate.
Pre-Transition Mathematics. There were 287 students who took all the pretests and
posttests, who used the UCSMP Pre-Transition Mathematics curriculum, and who stayed in the
same class with the same teacher throughout the study.
In the first regression model, I used posttest 1 (CAT 17 Survey) percent correct as the
dependent variable, OTL measured by teachers’ reported lesson coverage as the independent
variable, and standardized pretest (CAT Survey 16) percent correct as the covariate. The
coefficient of determination, = .71, and the adjusted coefficient of determination, = .70,
indicated that the OTL measured by teachers’ reported lesson coverage explained 70% of the
variability in the posttest 1 achievement scores as the dependent variable. The regression
coefficient was .31, F (2, 284) = 294.55, t = 4.93, p < .001, showed that the OTL measured by
lesson coverage significantly predicted the posttest 1 achievement. Therefore, Pre-Transition
Mathematics achievement measured by posttest 1 (CAT 17 Survey) from OTL measured by
lesson coverage with pretest scores as the covariate was statistically significant with p < .001.

41
In the second regression model, I used posttest 2 (UCSMP constructed multiple-choice
test) percent correct as the dependent variable, OTL measured by teacher reported lesson
coverage as the independent variable, and standardized pretest (CAT Survey 16) percent correct
as the covariate. The coefficient of determination, = .67, and the adjusted coefficient of
determination, = .66, indicated that the OTL measured by teachers’ reported lesson coverage
explained 66% of the variability in posttest 2 achievement scores as the dependent variable. The
regression coefficient was .18, F (2, 284) = 262.81, t = 3.23, p < .001 showed that the OTL
measured by lesson coverage statistically significantly predicted the posttest 2 achievement.
Therefore, the result for the second regression used to predict Pre-Transition Mathematics
achievement measured by posttest 2 achievement from OTL measured by lesson coverage with
pretest score as the covariate was statistically significant with p < .001.
In the third regression model, I used posttest 3 (PSU) percent correct as the dependent
variable, OTL measured by teacher reported lesson coverage as the independent variable, and the
standardized pretest (CAT Survey 16) percent correct as the covariate. The coefficient of
determination, = .68, and the adjusted coefficient of determination, = .67, indicated that
OTL measured by lesson coverage explained 67% of the variability in posttest 3 achievement as
the dependent variable. The regression coefficient was .34, F (2, 284) = 262.45, t = 4.79,
p < .001, which showed OTL measured by lesson coverage statistically significantly predicted
posttest 3 as the dependent variable. Therefore, Pre-Transition Mathematics achievement
measured by posttest 3 (PSU) from OTL measured by lesson coverage with pretest score as the
covariate was statistically significant with p < .001.

42
Transition Mathematics. There were 237 students in Transition Mathematics (3rd Ed.)
who took all pretests and posttests and who stayed in the same class with the same teacher
throughout the study.
In the first regression model, I used posttest 1 (IAAT) percent correct as the dependent
variable, OTL measured by teacher reported lesson coverage as the independent variable, and
standardized pretest (CAT Survey 17) percent correct as the covariate. The coefficient of
determination, , and the adjusted coefficient of determination, = .42, indicated that
the independent variable explained 42% of the variability in the dependent variable. The
regression coefficient was .47, F (2, 234) = 176.59, t = 5.13, p < .001, which showed that the
OTL measured by lesson coverage statistically significantly predicted posttest 1 achievement as
the dependent variable. Therefore, Transition Mathematics achievement measured by posttest 1
(IAAT) from OTL measured by lesson coverage with pretest score as the covariate is statistically
significant with p < .001.
In the second regression model, I used posttest 2 (Algebra/Geometry Readiness) percent
correct as the dependent variable, OTL measured by teachers’ reported lesson coverage as the
independent variable, and standardized pretest (CAT Survey 17) percent correct as the covariate.
The coefficient of determination, = .39, and the adjusted coefficient of determination,
= .37, indicated that the independent variable explained 37% of the variability of posttest 2
achievement as the dependent variable. The regression coefficient was .36, F (2, 234) = 156.27,
t = 4.00, p < .001 which showed that OTL measured by lesson coverage statistically significantly
predicted posttest 2 achievement. Therefore, Transition Mathematics achievement measured by
posttest 2 (Algebra Geometry Readiness) from OTL measured by lesson coverage with pretest
score as the covariate was statistically significant with p < .001.

43
In the third regression model I used posttest 3 (PSU) percent correct as the dependent
variable, OTL measured by teachers’ reported lesson coverage as the independent variable, and
standardized pretest (CAT Survey 17) percent correct as the covariate. The coefficient of
determination, = .64, and the adjusted coefficient of determination, = .64, indicated that
the OTL measured by lesson coverage explained 64% of the variability in posttest 3 as the
dependent variable. The regression coefficient was .55, F (2, 234) = 90.60, t = 9.23, p < .001, so
the OTL measured by lesson coverage statistically significantly predicted the posttest 3
achievement as the dependent variable. Therefore, Transition Mathematics achievement
measured by posttest 3 (PSU) from OTL measured by lesson coverage with pretest score as the
covariate was statistically significant with p < .001.
Algebra. There were 232 students who used UCSMP Algebra (3rd Ed.) who took all
pretests and posttests and who stayed in the same class with the same teacher throughout the
study.
For the first regression model, I used posttest 1 (Terra Nova Algebra) percent correct as
the dependent variable, OTL measured by teachers’ reported lesson coverage as the independent
variable, and standardized pretest (IAAT) percent correct as the covariate. The coefficient of
determination, = .61, and the adjusted coefficient of determination, = .61, indicated that
OTL measured by lesson coverage explained 61% of the variability in the posttest 1
achievement. The regression coefficient was .55, F (2, 229) = 133.97, t = 9.23, p < .001, which
showed that it statistically significantly predicted the Algebra posttest 1 achievement. Therefore,
Algebra achievement measured by posttest 1 (Terra Nova Algebra) from OTL measured by
lesson coverage with pretest score as the covariate was statistically significant with p < .001.

44
In the second regression model, I used posttest 2 (UC) percent correct as the dependent
variable, OTL measured by teachers’ reported lesson coverage as the independent variable, and
standardized pretest (IAAT) percent correct as the covariate. The coefficient of determination,
= .58, and the adjusted coefficient of determination, = .57, indicated that OTL measured by
lesson coverage explained 57% of the variability in the posttest 2 achievement. The regression
coefficient was .56, F (2, 229) = 268.36, t = 9.18, p < .001, which showed that it statistically
significantly predicted the posttest 2 achievement. Therefore, Algebra achievement measured by
posttest 2 (UC) from OTL measured by lesson coverage with pretest score as the covariate was
statistically significant with p < .001.
In the third regression model, I used posttest 3 (PSU) percent correct as the dependent
variable, OTL measured by teachers’ reported lesson coverage as the independent variable, and
standardized pretest (IAAT) percent correct as the covariate. The coefficient of determination,
= .65, and the adjusted coefficient of determination, = .64, indicated that OTL measured by
lesson coverage explained 64% of the variability in the posttest 3 achievement. The regression
coefficient was .56, F (2, 229) = 138.00, t = 9.26, p < .001, which showed that it statistically
significantly predicted the posttest 3 achievement. Therefore, Algebra achievement measured by
posttest 3 (PSU) from OTL measured by lesson coverage with pretest score as the covariate was
statistically significant with p < .001.
Conclusion. In all 9 regression models, the dependent variable of mathematics
achievement including different posttests was statistically significantly predicted by OTL
measured by lesson coverage, controlling for prior knowledge measured by pretests. Therefore,
OTL measured by lesson coverage significantly impacted student mathematics achievement

45
measured by different posttests in Pre-Transition Mathematics, Transition Mathematics, and
Algebra.
The Impact of Posttest OTL (Part B)
This part of the question was answered by conducting 9 regressions using OTL as
measured by teachers’ reported posttest OTL to predict mathematics achievement measured by 3
posttests in each of the three mathematics courses (Pre-Transition Mathematics, Transition
Mathematics, and Algebra). Standardized pretest scores were again used in each regression as
covariates.
Pre-Transition Mathematics. As previously reported, the final sample size was 287.
In the first regression model, the posttest 1 (CAT 17 Survey) result was used as the
dependent variable, with teachers’ reported posttest OTL as the independent variable and
standardized pretest (CAT Survey 16) percent correct as the covariate. The coefficient of
determination, = .47, and the adjusted coefficient of determination, = .46, indicated that
OTL measured by PTM posttest 1 explained 46% of the variability in the PTM posttest 1
achievement. The regression coefficient was 1.06, F (2, 284) = 290.77, t = 9.74, p < .001, which
showed that the posttest 1 OTL statistically significantly predicted the posttest 1 achievement.
Therefore, Pre-Transition Mathematics achievement measured by posttest 1 (CAT 17 Survey)
from posttest 1 OTL with pretest score as the covariate was statistically significant with p < .001.
In the second regression model, the posttest 2 (UC) percent correct was used as the
dependent variable, with posttest 2 OTL as the independent variable and standardized pretest
(CAT Survey 16) percent correct as the covariate. The coefficient of determination, = .40, and
the adjusted coefficient of determination, = .39, indicated that the PTM posttest 2 OTL
explained 39% of the variability in posttest 2 achievement. The regression coefficient was .92,

46
F (2, 284) = 273.18, t = 7.85, p < .001, which showed that the PTM posttest 2 OTL statistically
significantly predicted the posttest 2 achievement. Therefore, Pre-Transition Mathematics
achievement measured by posttest 2 (UC) from teachers’ reported posttest 2 OTL with pretest
scores as the covariate was statistically significant with p < .001.
In the third regression model, posttest 3 (PSU) percent correct was used as the dependent
variable, and posttest 3 OTL as the independent variable and standardized pretest (CAT Survey
16) percent correct as the covariate. The coefficient of determination, = .52, and the adjusted
coefficient of determination, = .51, indicated that PTM posttest 3 OTL explained 51% of the
variability of the dependent variable. The regression coefficient was 1.52, F (2, 284) = 296.67,
t = 9.64, p < .001, which showed that PTM posttest 3 OTL statistically significantly predicted the
posttest 3 achievement. Therefore, Pre-Transition Mathematics achievement measured by
posttest 3 (PSU) from posttest 3 OTL with pretest score as the covariate was statistically
significant with p < .001.
Transition Mathematics. As previously reported, the final sample size was 237.
In the first regression model, I used posttest 1 (IAAT) percent correct as the dependent
variable, posttest 1 OTL as the independent variable and standardized pretest (CAT Survey 17)
percent correct as the covariate. The coefficient of determination, = .43, and the adjusted
coefficient of determination, = .42, indicated that the TM posttest 1 OTL explained 43% of
the variability in the posttest 1 achievement. The regression coefficient was .17, F (2, 234) =
154.08, t = .99, p < .001, which showed that posttest 1 OTL statistically significantly predicted
the posttest 1 achievement. Therefore, Transition Mathematics achievement measured by
posttest 1 (IAAT) from teachers’ reported posttest 1 OTL with pretest score as the covariate was
statistically significant with p < .001.

47
In the second regression model, I used posttest 2 (Algebra/Geometry Readiness) percent
correct as the independent variable, with teachers’ reported posttest 2 OTL as the independent
variable and standardized pretest (CAT Survey 17) percent correct as the covariate. The
coefficient of determination, = .43, and the adjusted coefficient of determination, = .42,
indicated that TM posttest 2 OTL explained 42% of the variability of posttest 2 achievement. The
regression coefficient was .78, F (2, 234) = 154.19, t = 6.06, p < .001, which showed that posttest
2 OTL statistically significantly predicted the posttest 2 achievement. Therefore, Transition
Mathematics achievement measured by posttest 2 (Algebra/Geometry Readiness) from teachers’
reported posttest 2 OTL measured with pretest score as the covariate was statistically significant
with p < .001.
In the third regression model, I used posttest 3 (PSU) percent correct as the independent
variable, with teachers’ reported posttest 3 OTL as the independent variable and standardized
pretest (CAT Survey 17) percent correct as the covariate. The coefficient of determination,
= .65, and the adjusted coefficient of determination, = .64, indicated that the TM posttest 3
OTL explained 64% of the variability in the posttest 3 achievement. The regression coefficient
was .13, F (2, 234) = 83.54, t = 1.33, p < .001, which showed that TM posttest 3 OTL statistically
significantly predicted posttest 3 achievement. Therefore, Transition Mathematics achievement
measured by posttest 3 (PSU) from teachers’ reported posttest 3 OTL with pretest score as the
covariate was statistically significant with p < .001.
Algebra. As previously reported, the final sample size was 232.
In the first regression model, I used posttest 1 (Terra Nova Algebra) percent correct as the
independent variable, with posttest 1 OTL as the independent variable and standardized pretest
(IAAT) percent as the covariate. The coefficient of determination, = .62, and the adjusted

48
coefficient of determination, = .62, indicated that Algebra posttest 1 OTL explained 62% of
the variability in the posttest 1 achievement. The regression coefficient was .83,
F (2, 229) = 139.38, t = 11.33, p < .001, which showed that posttest 1 OTL statistically
significantly predicted the posttest 1 achievement. Therefore, Algebra achievement measured by
posttest 1 (Terra Nova Algebra) from teacher reported posttest 1 OTL with pretest score as the
covariate was statistically significant with p < .001.
In the second regression model, I used posttest 2 (UC) percent correct as the independent
variable, with posttest 2 OTL as the independent variable and standardized pretest (IAAT)
percent correct as the covariate. The coefficient of determination, = .50, and the adjusted
coefficient of determination, = .49, indicated that the Algebra posttest 2 OTL explained 49%
of the variability in posttest 2 OTL. The regression coefficient was .76, F (2, 229) = 272.32,
t = 5.39, p < .001, which showed that Algebra posttest 2 OTL statistically significantly predicted
the posttest 2 achievement. Therefore, Algebra achievement measured by posttest 2 (UC) from
teacher reported posttest 2 OTL with pretest scores as the covariate was statistically significant
with p < .001.
In the third regression model, I used posttest 3 (PSU) percent correct as the independent
variable, with posttest 3 OTL as the independent variable, and with standardized pretest (IAAT)
percent as the covariate. The coefficient of determination, = .67, and the adjusted coefficient
of determination, = .66, indicated that Algebra posttest 3 OTL explained 66% of the
variability in posttest 3 achievement. The regression coefficient was .74, F (2, 229) = 154.38,
t = 11.96, p < .001, which showed that posttest 3 OTL statistically significantly predicted posttest
3 achievement. Therefore, Algebra achievement measured by posttest 3 (PSU) from teachers’
reported posttest 3 OTL with pretest score as the covariate was statistically significant (p < .001).

49
Conclusion. In all 9 regression models, the dependent variable of mathematics
achievement including different posttests was statistically significantly predicted by teachers’
reported OTL (the percent of the posttest items for which they reported teaching or reviewing the
content needed to answer the item) with all p < .001, and with consideration of prior knowledge
measured by pretests. Therefore, teachers’ reported posttest OTL also significantly impacted
student mathematics achievement in Pre-Transition Mathematics, Transition Mathematics, and
Algebra.
The Extent to which Three Types of Homework Impact OTL Measured by Lesson Coverage and Achievement (Research Question 2)
The second research question focused on the relationship between homework and
opportunity to learn mathematics measured by lesson coverage: To what extent do different
types of homework influence the impact of OTL measured by lesson coverage on student
mathematics achievement measured by 3 posttests in each of Pre-Transition Mathematics,
Transition Mathematics, and Algebra?
To calculate the extent to which different types of homework influence the impact of
opportunity to learn mathematics on student mathematics achievement, the custom dialog
indirect.spd created by Preacher and Hayes (2008) was used. This dialog measured the total,
direct, and single-step indirect effects of opportunity to learn (measured by lesson coverage and
teachers’ reported posttest OTL) on student achievement (measured by 3 posttests in each of 3
mathematics courses) mediated through homework types (covering the ideas, applying the
mathematics, and review). In this analysis, a gain score (the difference between each posttest and
pretest) was used in the regression analysis as a covariate. Bias-corrected bootstrap confidence
intervals were calculated for the indirect effects as well as bootstrap tests of the difference
between the indirect effects that homework types have on the influence of opportunity to learn

50
on student mathematics achievement (Preacher & Hayes, 2008). Because gain scores are used as
covariates, the total effect of the student achievement is corrected for the effect of the pretest as
well.
As discussed in the literature review, bootstrap confidence intervals were used in this
study because the Sobel tests generally make unrealistic assumptions about the shape of the
sampling distribution of the indirect effect. In the output provided to answer research question 2,
“Data” represents the indirect effect calculated in the original sample, and the mean of the
indirect effect estimates calculated through bootstrap samples are represented by “Boot”. Here I
used Bootstrap sample 10,000 for each model and 95% for the level of confidence for the
confidence intervals. (See the statistics for each model in Appendix E)
Each output (see Appendix E) provided the indirect effect of each mediator (covering the
ideas, applying the mathematics, and review) as well as the indirect effect for all three of the
mediators combined. C1, C2, and C3 are the contrasts of the three indirect effects against each
other to determine if any of the mediators have stronger indirect effects than the others. Hence,
C1 represents the contrast between homework that covers the ideas and homework that applies
the mathematics; C2 represents the contrast between homework that covers the ideas and review
homework. C3 represents the contrast between homework that applies the mathematics and
review homework. The output also provided a 95% bias corrected bootstrap confidence interval;
if zero does not lie between the upper and lower boundaries of the interval, then mediation exists.
The three different variables investigated as mediators here are homework covering the
ideas, applying the mathematics, and review based on lessons taught. I used OTL measured by
lesson coverage and teachers’ reported posttest OTL as the independent variables.
Pre-Transition Mathematics

51
Using PTM posttest 1 achievement as dependent variable. Overall, the whole model
showed that OTL measured by lesson coverage as a predictor via three mediators (i.e., Covering,
Applying, and Review) in path analysis had significant impact on PTM posttest 1,
(F (5, 281) = 135.91, p < .001). The was .71 and adjusted was .70, indicating that 70% of
variance in the PTM posttest 1 was accounted for by OTL measured by lesson coverage through
the three mediators.
The total effect (i.e., direct and indirect effects) of the OTL measured by lesson coverage
on the impact of the posttest 1 achievement (c path) was significant, t = 4.93, p < .001. The direct
effect of OTL measured by lesson coverage (cʹ′ path) to PTM posttest 1 achievement was
significant t = 3.04, p < .05. The partial effect of OTL measured by lesson coverage on PTM
posttest 1 achievement after controlling for pretest score was significant, t = 17.52, p < .001. The
direct effects of OTL measured by lesson coverage on the mediators (Covering, Applying, and
Review) and of the three mediators on posttest 1 achievement were significant at the level of at
least .005. All the coefficients and significant levels of the direct effects are presented in Figure 5.
Table 7 reports indirect effects of the homework types on student achievement measured
by Pre-Transition Mathematics posttest 1.
Total indirect effect refers to combining indirect effects of all three mediators. Total
indirect effect was .10 (.01 for covering + .19 for applying + (-.10) for review). The 95%
confidence interval of the total effect ranged from .03 to .18. Because 0 did not occur between
the lower limit and upper limit of the bias corrected confidence interval, the total indirect effect
of the OTL measured by lesson coverage through the three mediators had significant impact on
posttest 1 achievement.

52
path a path b
Figure 5. Coefficients and significance test for path a and path b using OTL measured by lesson coverage as the independent variable and PTM posttest 1 achievement as the dependent variable. Note: * indicated p < .01, ** indicated p < .05, *** indicated p < .001. Table 7 Total and Individual Indirect Effects for Homework Types as Mediators for Pre-Transition Mathematics Posttest 1 Est.
from Data
Est. from Bootstrap
Bias SE Bias Corrected Confidence Interval
Total .0979 .0966 -.0013 .0370 (.0294, .1750) Covering .0147 .0146 .0000 .0140 (-.0109, .0454) Applying .1868 .1865 -.0003 .0507 (.0955, .2941) Review -.1036 -.1045 -.0009 .0461 (-.2026, -.0185)
C1 -.1721 -.1718 .0003 .0591 (-.3005, .2175) C2 .1182 .1191 .0009 .0459 (.0333, .2175) C3 .2904 .2910 .0006 .0878 (.1297, .4778)
Notes: C1 = Covering the ideas – Applying the mathematics; C2 = Covering the ideas – Review; C3 = Applying the mathematics – Review.
The true indirect effect of the OTL measured by lesson coverage only through covering
the ideas was .01 (.15 from IV to covering * .10 from covering to DV) and confidence interval
ranged from -.01 to .05. Because 0 was between the lower and the upper limits of the bias
OTL by Lesson Coverage
.1470**
Covering
Applying
Review
.5359***
.9817***
PTM Posttest 1
.0999
.3486**
-.1055**

53
corrected confidence interval, homework covering the ideas as a mediator had no significant
impact on the relationship between OTL measured by lesson coverage and posttest 1
achievement.
The true indirect effect of the OTL measured by lesson coverage only through applying
the mathematics was .19 (.54 from IV to applying * .35 from applying to DV) and confidence
interval ranged from .10 to .29. Because 0 was not between the lower and upper limits of the bias
corrected confidence interval, homework applying the mathematics as a mediator had a
positively significant impact on the relationship between OTL measured by lesson coverage and
posttest 1 achievement.
The true indirect effect of the OTL measured by lesson coverage only through review
homework was -.10 (.98 from IV to review * -.11 from review to DV) and confidence interval
ranged from -.20 to -.02. Because 0 was not between the lower and upper limits of the bias
corrected confidence interval, the homework that reviews had a significant, but negative impact
on the relationship between OTL measured by lesson coverage and posttest 1 achievement.
Table 7 also showed the comparisons of the three indirect effects for the mediators
denoted by C1, C2, and C3. C1, C2, C3 represent the effect differences between covering the
ideas and applying the mathematics, between covering the ideas and review, and between
applying the mathematics and review, respectively. From the estimates of the 95% confidence
interval, C2 and C3 all showed significant differences because 0 was not in the 95% confidence
interval, but not C1. This finding occurred because the mediator of applying the mathematics had
the largest positive impact than the indirect effect of review. The mediator of review had large
impact but in a negative way, the indirect effect of covering the idea was not significant.

54
Conclusion. In this path analysis I used a sample of 287 students. Overall, OTL
measured by lesson coverage as predictor and the three mediators used in the path analysis were
valid. Approximately 70% of the variance in the PTM posttest 1 was accounted for by the
predictor through these three mediators. The total indirect effect of the OTL measured by lesson
coverage on student mathematics achievement measured by Pre-Transition Mathematics posttest
1 achievement was significant (.10). The specific effects for covering the ideas, applying the
mathematics, and review were .01, .19, and -.10, respectively. Homework applying the
mathematics had significant, positive impact on the relationship between OTL measured by
lesson coverage and posttest 1 achievement and the effect of review was significant, but
negative. However, covering the ideas had no significant effect. This led to the significantly
different effect between covering the ideas and review, between covering the ideas and applying
the mathematics, and applying the mathematics and review.
Using PTM posttest 2 achievement as dependent variable. Overall, the whole model
showed that OTL measured by lesson coverage as a predictor via three mediators (i.e., Covering,
Applying, and Review) in path analysis had significant impact on PTM posttest 2, (F (5, 281) =
111.60, p < .001). The was .67 and adjusted was .66, indicating that 66% of variance in
the PTM posttest 2 was accounted for by OTL measured by lesson coverage through the three
mediators.
The total effect (i.e., direct and indirect effects) of the OTL measured by lesson coverage
on the impact of the posttest 2 achievement (c path) was significant, t = 3.23, p < .001. The direct
effect of OTL measured by lesson coverage (cʹ′ path) to PTM posttest 2 achievement was not
significant, t = 1.76, p = .08. The partial effect of OTL measured by lesson coverage on PTM
posttest 2 achievement after controlling for pretest score was significant, t = 17.18,

55
p < .001. The direct effects of OTL measured by lesson coverage on all three mediators
(Covering, Applying and Review) were all significant (p < .05). The direct effects of homework
applying the mathematics on posttest 2 achievement were significant (p < .001), however
homework covering the ideas or review were not significant (p = .33 and p = .39, respectively).
All the coefficients and significant levels of the direct effects are presented in Figure 6.
Table 8 reports indirect effect of the homework types on student achievement measured
by Pre-Transition Mathematics posttest 2.
Total indirect effect refers to combining indirect effects when the effects of all three
mediators are considered. Total indirect effect was .07 (.01 for covering + .09 for applying +
(-.03) for review). The 95% confidence interval of the total effect ranged from -.01 to .14.
Because 0 does occur between the lower limit and upper limit of the bias corrected confidence
interval, the total indirect effect of the OTL measured by lesson coverage through the three
mediators had no significant impact on the posttest 2 achievement.
The true indirect effect of the OTL measured by lesson coverage only through covering
the ideas was .01 (.15 from IV to covering * .09 from covering to DV) and confidence interval
ranged from -.01 to .04. Because 0 lies between the lower and upper limits of the bias corrected
confidence interval, homework covering the ideas had no significant impact on the relationship
between OTL measured by lesson coverage and posttest 2 achievement.
The true indirect effect of the OTL measured by lesson coverage only through applying
the mathematics was .09 (.54 from IV to applying * .16 from applying to DV) and confidence
interval ranged from .01 to .18. Because 0 was not between the lower and upper limits of the bias
corrected confidence interval, homework applying the mathematics was a mediator that had a
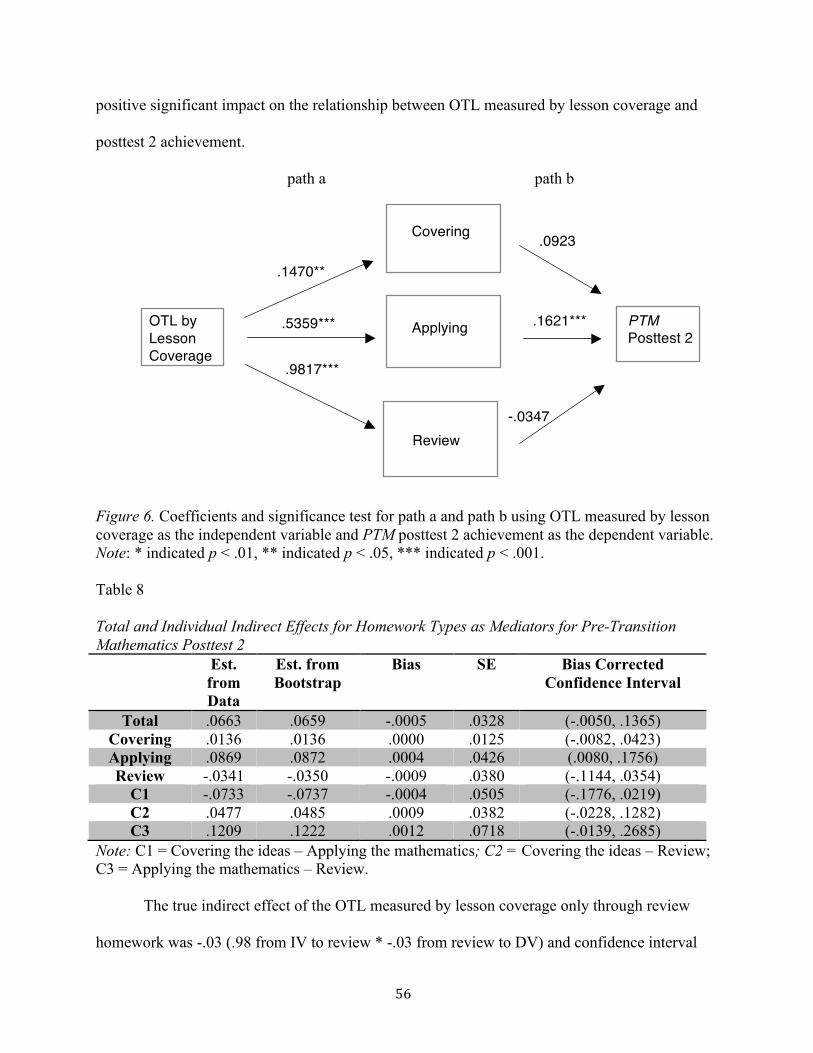
56
positive significant impact on the relationship between OTL measured by lesson coverage and
posttest 2 achievement.
path a path b
Figure 6. Coefficients and significance test for path a and path b using OTL measured by lesson coverage as the independent variable and PTM posttest 2 achievement as the dependent variable. Note: * indicated p < .01, ** indicated p < .05, *** indicated p < .001. Table 8 Total and Individual Indirect Effects for Homework Types as Mediators for Pre-Transition Mathematics Posttest 2 Est.
from Data
Est. from Bootstrap
Bias SE Bias Corrected Confidence Interval
Total .0663 .0659 -.0005 .0328 (-.0050, .1365) Covering .0136 .0136 .0000 .0125 (-.0082, .0423) Applying .0869 .0872 .0004 .0426 (.0080, .1756) Review -.0341 -.0350 -.0009 .0380 (-.1144, .0354)
C1 -.0733 -.0737 -.0004 .0505 (-.1776, .0219) C2 .0477 .0485 .0009 .0382 (-.0228, .1282) C3 .1209 .1222 .0012 .0718 (-.0139, .2685)
Note: C1 = Covering the ideas – Applying the mathematics; C2 = Covering the ideas – Review; C3 = Applying the mathematics – Review.
The true indirect effect of the OTL measured by lesson coverage only through review
homework was -.03 (.98 from IV to review * -.03 from review to DV) and confidence interval
OTL by Lesson Coverage
.1470**
Covering
Applying
Review
.5359***
.9817***
PTM Posttest 2
.0923
.1621***
-.0347

57
ranged from -.11 to .04. Because 0 was between the lower and upper limits of the bias corrected
confidence interval, review homework did not have a significant impact on the relationship
between OTL measured by lesson coverage and posttest 2 achievement.
Table 8 also shows the comparisons of the three indirect effects for the mediators denoted
by C1, C2, and C3. C1, C2, C3 represent the effect differences between covering the ideas and
applying the mathematics, between covering the ideas and review, and between applying the
mathematics and review, respectively. Based on the estimates of the 95% confidence interval,
none of C1, C2, and C3 showed significant effect differences because 0 was in the ranges of the
95% confidence interval. This finding occurred because covering the ideas and review had no
significant indirect effects whereas only applying the mathematics had a significant, positive
mediating effect and the effect was very small.
Conclusion. In this model I used a sample of 287 students. Overall, OTL measured by
lesson coverage as predictor and the three mediators used in the path analysis were valid.
Approximately 25% of the variance in the PTM posttest 2 was accounted for by the predictor
through these three mediators. The total indirect effect of the OTL measured by lesson coverage
on student mathematics achievement measured by Pre-Transition Mathematics posttest 1
achievement was significant (.07). The specific effects for covering the ideas, applying the
mathematics, and review were .01, .09, and -.03, respectively. Homework covering the ideas and
review had no significant impact on the relationship between OTL measured by lesson coverage
and posttest 2 achievement. However, applying the mathematics had statistically significant,
positive indirect effect as a mediator but the size of the indirect effect was small. This led to no
different effect between covering the ideas and review, between applying the mathematics and
review, and covering the ideas and applying the mathematics.

58
Using PTM posttest 3 achievement as dependent variable. Overall, the whole model
showed that OTL measured by lesson coverage as a predictor via three mediators (i.e., Covering,
Applying, and Review) in path analysis had significant impact on PTM posttest 3, (F (5, 281) =
118.00, p < .001). The was .68 and adjusted was .67, indicating that 67% of variance in
the PTM posttest 3 was accounted for by OTL measured by lesson coverage through the three
mediators.
The total effect (i.e., direct and indirect effects) of the OTL measured by lesson coverage
on the impact of the posttest 1 achievement (c path) was significant, t = .4.79, p < .001. The
direct effect of OTL measured by lesson coverage (cʹ′ path) to PTM posttest 3 achievement was
significant, t = -2.54, p < .05. The partial effect of OTL measured by lesson coverage on PTM
posttest 3 achievement after controlling for pretest score was significant, t = 16.48, p < .001. The
direct effect of OTL measured by lesson coverage on all three homework types as mediators
were significant at the level of at least .05. The direct effects of homework covering the ideas
and review on PTM posttest 3 achievement were not significant (p = .22 and p = .78,
respectively), but the direct effect of homework applying the mathematics on PTM posttest 3 was
significant (p < .05). All the coefficients and significant levels of the direct effects are presented
in Figure 7.
Table 9 reports the indirect effect of the homework types on student achievement
measured by Pre-Transition Mathematics posttest 3.
Total indirect effect refers to combining indirect effects when the effects of all three
mediators are considered. Total indirect effect was .14 (.02 for covering + .13 for applying +
(-.02) for review). The 95% confidence interval of the total effect ranged from .06 to .22.
Because 0 did not occur between the lower limit and upper limit of the bias corrected confidence

59
interval, the total indirect effect of the OTL measured by lesson coverage through the three
mediators had significant impact on the posttest 3 achievement.
path a path b
Figure 7. Coefficients and significance test for path a and path b using OTL measured by lesson coverage as the independent variable and PTM posttest 3 as the dependent variable. Note: * indicated p < .01, ** indicated p < .05, *** indicated p < .001. Table 9 Total and Individual Indirect Effects for Homework Types as Mediators for Pre-Transition Mathematics Posttest 3 Est.
from Data
Est. from Bootstrap
Bias SE Bias Corrected Confidence Interval
Total .1374 .1366 -.0008 .0406 (.0628, .2225) Covering .0218 .0214 -.0004 .0140 (-.0026, .0532) Applying .1346 .1352 .0006 .0529 (.0348, .2444) Review -.0190 -.0200 -.0010 .0505 (-.1211, .0789)
C1 -.1128 -.1138 -.0009 .0608 (-.2384, .0046) C2 .0408 .0415 .0006 .0501 (-.0560, .1413) C3 .1537 .1552 .0015 .0937 (-.0233, .3423)
Note: C1 = Covering the ideas – Applying the mathematics; C2 = Covering the ideas – Review; C3 = Applying the mathematics – Review.
The true indirect effect of the OTL measured by lesson coverage only through covering
the ideas was .02 (.15 from IV to covering * .15 from covering to DV) and confidence interval
OTL by Lesson Coverage
.1470**
Covering
Applying
Review
.5359***
.9817***
PTM Posttest 3
.1484
.2512**
-.0194

60
ranged from -.00 to .05. Because 0 was between the lower and upper limits of the bias corrected
confidence interval, homework covering the ideas had no significant impact on the relationship
between OTL measured by lesson coverage and posttest 3 achievement.
The true indirect effect of the OTL measured by lesson coverage only through applying
the mathematics was .13 (.54 from IV to applying * .25 from applying to DV) and confidence
interval ranged from .03 to .24. Because 0 was not between the lower and upper limits of the bias
corrected confidence interval, homework applying the mathematics was a mediator and had
significant, positive impact on the relationship between OTL measured by lesson coverage and
posttest 3 achievement.
The true indirect effect of the OTL measured by lesson coverage only through review
homework was -.02 (.98 from IV to review * -.02 from review to DV) and confidence interval
ranged from -.12 to .08. Because 0 was between the lower and upper limits of the bias corrected
confidence interval, review homework did not have a significant impact on the relationship
between OTL measured by lesson coverage and posttest 3 achievement.
Table 9 also shows the comparisons of the three indirect effects for the mediators denoted
by C1, C2, and C3. C1, C2, C3 represent the effect differences between covering the ideas and
applying the mathematics, between covering the ideas and review, and between applying the
mathematics and review, respectively. Based on the estimates of the 95% confidence interval,
none of C1, C2, and C3 showed significant effect differences because 0 was in the ranges of the
95% confidence intervals. This finding occurred because covering the ideas and review had no
significant indirect effects whereas only applying the mathematics had a significant, positive
mediating effect and the effect was very small.

61
Conclusion. In this path analysis I used a sample of 287 students. Overall, OTL
measured by lesson coverage as predictor and the three mediators used in the path analysis were
valid. Approximately 67% of the variance in the PTM posttest 3 was accounted for by the
predictor through these three mediators. The total indirect effect of the OTL measured by lesson
coverage on student mathematics achievement measured by Pre-Transition Mathematics posttest
3 achievement was significant (.14). The specific effects for covering the ideas, applying the
mathematics, and review were .02, .13, and -.02, respectively. Homework covering the ideas and
review did not have significant impacts on the relationship between OTL measured by lesson
coverage and posttest 3 achievement. However, applying the mathematics had a significant,
positive indirect effect but the effect was very small. This led to no significantly different effects
between covering the ideas and applying, between applying the mathematics and review, and
between covering the ideas and review.
Transition Mathematics
Using TM posttest 1 achievement as dependent variable. Overall, the whole model
showed that OTL measured by lesson coverage as a predictor via three mediators (i.e., Covering,
Applying, and Review) in path analysis had significant impact on TM posttest 1, (F (5, 231) =
35.23, p < .001). The was .43 and adjusted was .42, indicating that 42% of variance in
the TM posttest 1 was accounted for by OTL measured by lesson coverage through the three
mediators.
The total effect (i.e., direct and indirect effects) of the OTL measured by lesson coverage
on the impact of the posttest 1 achievement (c path) was significant, t = 5.13, p < .001. The direct
effect of OTL measured by lesson coverage (cʹ′ path) to TM posttest 1 achievement was not
significant, t = 1.49, p = .14. The partial effect of OTL measured by lesson coverage on TM

62
posttest 1 achievement after controlling for pretest score was significant, t = 6.77, p < .001. The
direct effects of OTL measured by lesson coverage on homework covering the ideas and
applying the mathematics were significant (p < .05), however review homework was not
significant (p = .71). The direct effects of the three mediators (Covering, Applying, and Review)
on the posttest 1 achievement were all significant at the level of at least .05. All the coefficients
and significant levels of the direct effects are presented in Figure 8.
Table 10 reports the indirect effect of the homework types on student achievement
measured by Transition Mathematics posttest 1.
Total indirect effect refers to combining indirect effects when the effects of all three
mediators are considered. Total indirect effect was .33 (.42 for covering + (-.06) for applying +
(-.03) for review). The 95% confidence interval of the total effect ranged from .21 to .46.
Because 0 did not occur between the lower limit and upper limit of the bias corrected confidence
interval, the total indirect effect of the OTL measured by lesson coverage through the three
mediators had significant impact on the posttest 1 achievement.
The true indirect effect of the OTL measured by lesson coverage only through covering
the ideas was .42 (.09 from IV to covering * 4.50 from covering to DV) and confidence interval
ranged from .26 to .64. Because 0 was not between the lower and upper limits of the bias
corrected confidence interval, homework covering the ideas was a mediator that had a positive
significant impact on the relationship between OTL measured by lesson coverage and posttest 1
achievement.
The true indirect effect of the OTL measured by lesson coverage only through applying
the mathematics was -.06 (-.14 from IV to applying * .41 from applying to DV) and confidence
interval ranged from -.12 to -.01. Because 0 was not between the lower and upper limits of the

63
bias corrected confidence interval, homework applying the mathematics was a mediator that had
a negative significant impact on the relationship between OTL measured by lesson coverage and
posttest 1 achievement.
path a path b
Figure 8. Coefficients and significance test for path a and path b using OTL measured by lesson coverage as the independent variable and TM posttest 1 as the dependent variable. Note: * indicated p < .01, ** indicated p < .05, *** indicated p < .001. Table 10 Total and Individual Indirect Effects for Homework Types as Mediators for Transition Mathematics Posttest 1 Est.
from Data
Est. from Bootstrap
Bias SE Bias Corrected Confidence Interval
Total .3300 .3357 .0057 .0640 (.2113, .4616) Covering .4166 .4164 -.0002 .0958 (.2596, .6406) Applying -.0565 -.0484 .0081 .0300 (-.1215, -.0080) Review -.0301 -.0322 -.0022 .0715 (-.1904, .0959)
C1 .4731 .4648 -.0083 .0961 (.3108, .6968) C2 .4466 .4486 .0020 .1579 (.1892, .8181) C3 -.0265 -.0162 .0103 .0857 (-.2114, .1284)
Note: C1 = Covering the ideas – Applying the mathematics; C2 = Covering the ideas – Review; C3 = Applying the mathematics – Review.
OTL by Lesson Coverage
.0925***
Covering
Applying
Review
-.1392*
.0482 TM Posttest 1
4.5044***
.4061**
-.6242***

64
The true indirect effect of the OTL measured by lesson coverage only through review
homework was -.03 (.05 from IV to review * -.62 from review to DV) and confidence interval
ranged from -.19 to .10. Because 0 was between the lower and upper limits of the bias corrected
confidence interval, review homework did not have a significant impact on the relationship
between OTL measured by lesson coverage and posttest 1 achievement.
Table 10 also shows the comparisons of the three indirect effects for the mediators
denoted by C1, C2, and C3. C1, C2, C3 represent the effect differences between covering the
ideas and applying the mathematics, between covering the ideas and review, and between
applying the mathematics and review, respectively. Based on the estimates of the 95%
confidence interval, C1 and C2, but not C3, showed significant effect differences because the
value of 0 was not in the ranges of the 95% confidence interval. In other words, covering the
ideas had a significantly positive effect and applying the mathematics had a significantly
negative effect. This finding occurred because covering the ideas and applying the mathematics
both were significant even though they weren’t similar effects whereas review did not have any
mediating effect.
Conclusion. In this path analysis I used a sample of 237 students. Overall, OTL
measured by lesson coverage as predictor and the three mediators used in the path analysis were
valid. Approximately 42% of the variance in the TM posttest 1 was accounted for by the
predictors through these three mediators. The total indirect effect of the OTL measured by lesson
coverage on student mathematics achievement measured by Transition Mathematics posttest 1
achievement was significant (.33). The specific effects for covering the ideas, applying the
mathematics, and review were .42, -.06, and -.03, respectively. Homework covering the ideas
had significant, positive impact on the relationship between OTL measured by lesson coverage

65
and posttest 1 achievement and homework applying the mathematics had a significant, negative
effect. However, review had no significant impact. This led to the significantly different effect
between applying the mathematics and review.
Using TM posttest 2 achievement as dependent variable. Overall, the whole model
showed that OTL measured by lesson coverage as a predictor via three mediators (i.e., Covering,
Applying, and Review) in path analysis had significant impact on TM posttest 2, (F (5, 231) =
28.92, p < .001). The was .39 and adjusted was .37, indicating that 37% of variance in
the TM posttest 2 was accounted for by OTL measured by lesson coverage through the three
mediators.
The total effect (i.e., direct and indirect effects) of the OTL measured by lesson coverage
on the impact of posttest 2 achievement (c path) was significant, t = 4.00, p < .0001. The direct
effect of OTL measured by lesson coverage (cʹ′ path) to TM posttest 2 achievement was not
significant, t = .50, p = .62. The partial effect of OTL measured by lesson coverage on TM
posttest 2 achievement after controlling for pretest score was significant, t = 7.84, p < .001. The
direct effects of OTL measured by lesson coverage on homework covering the ideas and
applying the mathematics were significant (p < .01), however review homework was not
significant (p = .78). The direct effects of the three mediators (Covering, Applying, and Review)
on posttest 2 achievement were all significant at the level of at least .01. All the coefficients and
significant levels of the direct effects are presented in Figure 9.
Table 11 reports the indirect effect of the homework types on student achievement
measured by Transition Mathematics posttest 2.
Total indirect effect refers to combining indirect effects when the effects of all three
mediators are considered. Total indirect effect was .32 (.40 for covering + (-.06) for applying +

66
(-.02) for review). The 95% confidence interval of the total effect ranged from .1868 to .4466.
Because 0 did not occur between the lower limit and upper limit of the bias corrected confidence
interval, the total indirect effect of the OTL measured by lesson coverage through the three
mediators had significant impact on the posttest 2 achievement.
path a path b
Figure 9. Coefficients and significance test for path a and path b using OTL measured by lesson coverage as the independent variable and TM posttest 2 as the dependent variable. Note: * indicated p < .01, ** indicated p < .05, *** indicated p < .001.
The true indirect effect of the OTL measured by lesson coverage only through covering
the ideas was .40 (.09 from IV to covering * 4.39 from covering to DV) and confidence interval
ranged from .25 to .62. Because 0 was not between the lower and upper limits of the bias
corrected confidence interval, homework covering the ideas was a mediator that had a positive
significant impact on the relationship between OTL measured by lesson coverage and posttest 2
achievement.
The true indirect effect of the OTL measured by lesson coverage only through applying
the mathematics was -.06 (-.15 from IV to applying * .41 from applying to DV) and confidence
interval ranged from -.13 to -.01. Because 0 was not between the lower and upper limits of the
OTL by Lesson Coverage
.0907***
Covering
Applying
Review
-.1475***
.0343
TM Posttest 2
4.3906***
.4131**
-.6204***

67
bias corrected confidence interval, homework applying the mathematics was a mediator that had
a negative significant impact on the relationship between OTL measured by lesson coverage and
posttest 2 achievement.
Table 11 Total and Individual Indirect Effects for Homework Types as Mediators for Transition Mathematics Posttest 2 Est.
from Data
Est. from Bootstrap
Bias SE Bias Corrected Confidence Interval
Total .3160 .3237 .0077 .0669 (.1868, .4466) Covering .3982 .4011 .0029 .0943 (.2451, .6198) Applying -.0609 -.0526 .0084 .0331 (-.1301, -.0058) Review -.0213 -.0249 -.0036 .0694 (-.1730, .1022)
C1 .4591 .4536 -.0055 .0965 (.2929, .6805) C2 .4195 .4260 .0065 .1531 (.1689, .7754) C3 -.0397 -.0277 .0120 .0849 (-.2305, .1067)
Note: C1 = Covering the ideas – Applying the mathematics; C2 = Covering the ideas – Review; C3 = Applying the mathematics – Review.
The true indirect effect of the OTL measured by lesson coverage only through review
homework was -.02 (.03 from IV to review * -.62 from review to DV) and confidence interval
ranged from -.17 to .10. Because 0 was between the lower and upper limits of the bias corrected
confidence interval, review homework did not have a significant impact on the relationship
between OTL measured by lesson coverage and posttest 2 achievement.
Table 11 also shows the comparisons of the three indirect effects for the mediators
denoted by C1, C2, and C3. C1, C2, C3 represent the effect difference between covering the
ideas and applying the mathematics, between covering the ideas and review, and between
applying the mathematics and review, respectively. Based on the estimates of the 95%
confidence interval, C1 and C2, but not C3, showed the significant effect differences because 0
was not in the ranges of the 95% confidence interval. In other words, covering the ideas had a
significantly positive effect and applying the mathematics had a significantly negative effect.

68
This finding occurred because covering the ideas and applying the mathematics both were
significant even though they weren’t similar effects whereas review did not have any mediating
effect.
Conclusion. In this path analysis I used a sample of 237 students. Overall, OTL
measured by lesson coverage as predictor and the three mediators used in the path analysis were
valid. Approximately 37% of the variance in the TM posttest 2 was accounted for by the
predictors through these three mediators. The total indirect effect of the OTL measured by lesson
coverage on student mathematics achievement measured by Transition Mathematics posttest 2
achievement was significant (.32). The specific effects for covering the ideas, applying the
mathematics, and review were .40, -.06, and -.02, respectively. Homework covering the ideas
had significant, positive impact on the relationship between OTL measured by lesson coverage
and posttest 2 achievement and review homework had a significant, negative effect. However,
review had no significant effect. This led to the significantly different effect between applying
the mathematics and review.
Using TM posttest 3 achievement as dependent variable. Overall, the whole model
showed that OTL measured by lesson coverage as a predictor via three mediators (i.e., Covering,
Applying, and Review) in path analysis had significant impact on TM posttest 3, (F (5, 231) =
83.35, p < .001). The was .64 and adjusted was .64, indicating that 64% of variance in
the TM posttest 3 was accounted for by OTL measured by lesson coverage through the three
mediators.
The total effect (i.e., direct and indirect effects) of the OTL measured by lesson coverage
on the impact of the posttest 3 achievement (c path) was significant, t = 3.61, p < .001. The direct
effect of OTL measured by lesson coverage (cʹ′ path) to TM posttest 3 achievement was not

69
significant, t = .27, p = .79. The partial effect of OTL measured by lesson coverage on TM
posttest 3 achievement after controlling for pretest score was significant, t = 16.48, p < .001. The
direct effects of OTL measured by lesson coverage on homework covering the ideas and
applying the mathematics were significant (p < .01), however review homework was not
significant (p = .62). The direct effects of the three mediators (Covering, Applying, and Review)
on the posttest 3 achievement were all significant at the level of at least .01. All the coefficients
and significant levels of the direct effects are presented in Figure 10.
Table 12 reports indirect effect of the homework types on student achievement measured
by Transition Mathematics posttest 3.
Total indirect effect refers to combining indirect effects when the effects of all three
mediators are considered. Total indirect effect was .32 (.36 for covering + (-.07) for applying +
.04 for review). The 95% confidence interval of the total effect ranged from .19 to .46. Because 0
was not between the lower limit and upper limit of the bias corrected confidence interval, the
total indirect effect of the OTL measured by lesson coverage through the three mediators had
significant impact on the posttest 3 achievement.
The true indirect effect of the OTL measured by lesson coverage only through covering
the ideas was .36 (.08 from IV to covering * 4.58 from covering to DV) and confidence interval
ranged from .22 to .58. Because 0 was not between the lower and upper limits of the bias
corrected confidence interval, homework covering the ideas was a mediator that had a positive
significant impact on the relationship between OTL measured by lesson coverage and posttest 3
achievement.
The true indirect effect of the OTL measured by lesson coverage only through applying
the mathematics was -.07 (-.17 from IV to applying * .42 from applying to DV) and confidence

70
interval ranged from -.15 to -.01. Because 0 was not between the lower and upper limits of the
bias corrected confidence interval, homework applying the mathematics was a mediator that had
a negative significant impact on the relationship between OTL measured by lesson coverage and
posttest 3 achievement.
path a path b
Figure 10. Coefficients and significance test for path a and path b using OTL measured by lesson coverage as the independent variable and TM posttest 3 as the dependent variable. Note: * indicated p < .01, ** indicated p < .05, *** indicated p < .001. Table 12 Total and Individual Indirect Effects for Homework Types as Mediators for Transition Mathematics Posttest 3 Est.
from Data
Est. from Bootstrap
Bias SE Bias Corrected Confidence Interval
Total .3240 .3303 .0063 .0691 (.1899, .4604) Covering .3600 .3605 .0005 .0899 (.2181, .5770) Applying -.0731 -.0644 .0087 .0376 (-.1495, -.0072) Review .0371 .0342 -.0029 .0618 (-.0850, .1591)
C1 .4331 .4248 -.0083 .0955 (.2623, .6445) C2 .3229 .3263 .0034 .1392 (.0979, .6496) C3 -.1102 -.0986 .0117 .0817 (-.2997, .0247)
Note: C1 = Covering the ideas – Applying the mathematics; C2 = Covering the ideas – Review; C3 = Applying the mathematics – Review.
OTL by Lesson Coverage
.0785***
Covering
Applying
Review
-.1741**
-.0622
TM Posttest 3
4.5831**
.4199**
-.5971***

71
The true indirect effect of the OTL measured by lesson coverage only through review
homework was .04 (-.06 from IV to review * -.60 from review to DV) and confidence interval
ranged from -.09 to .16. Because 0 was between the lower and upper limits of the bias corrected
confidence interval, review homework did not have a significant impact on the relationship
between OTL measured by lesson coverage and posttest 3 achievement.
Table 12 also shows the comparisons of the three indirect effects for the mediators
denoted by C1, C2, and C3. C1, C2, C3 represent the effect differences between covering the
ideas and applying the mathematics, between covering the ideas and review, and between
applying the mathematics and review, respectively. Based on the estimates of the 95%
confidence interval, C1 and C2 showed the significant effect differences because the value of 0
was not in the ranges of the 95% confidence interval, but not C3. In other words, covering the
ideas had a significantly positive effect and applying the mathematics had a significantly
negative effect. This finding occurred because covering the ideas and applying the mathematics
both were significant even though they weren’t similar effects whereas review did not have any
mediating effect.
Conclusion. In this path analysis I used a sample of 237 students. Overall, OTL
measured by lesson coverage as predictor and the three mediators used in the path analysis were
valid. Approximately 64% of the variance in the TM posttest 3 was accounted for by the
predictor through these three mediators. The total indirect effect of the OTL measured by lesson
coverage on student mathematics achievement measured by Transition Mathematics posttest 3
achievement was significant (.32). The specific effects for covering the ideas, applying the
mathematics, and review were .36, -.07, and .04, respectively. Homework covering the ideas had
significant, positive impact on the relationship between OTL measured by lesson coverage and

72
posttest 3 achievement and applying the mathematics homework had a significant, negative
effect. However, review was not statistically significant. This led to the significantly different
effect between applying the mathematics and review.
Algebra
Using Algebra posttest 1 achievement as dependent variable. Overall, the whole
model showed that OTL measured by lesson coverage as a predictor via three mediators (i.e.,
Covering, Applying, and Review) in path analysis had significant impact on Algebra posttest 1,
(F (5, 226) = 71.90, p < .001). The was .61 and adjusted was .61, indicating that 61% of
variance in the Algebra posttest 1 was accounted for by OTL measured by lesson coverage
through the three mediators.
The total effect (i.e., direct and indirect effects) of the OTL measured by lesson coverage
on the impact of the posttest 1 achievement (c path) was significant, t = 9.23, p < .001. The direct
effect of OTL measured by lesson coverage (cʹ′ path) to Algebra posttest 1 achievement was also
significant, t = 7.62, p < .001. The partial effect of OTL measured by lesson coverage on Algebra
posttest 1 achievement after controlling for pretest score was significant, t = 9.37, p < .001. The
direct effects of OTL measured by lesson coverage on the mediators (Covering, Applying, and
Review) were significant at the level of at least .001. The direct effects of covering the ideas and
review on posttest 1 achievement were significant at the level of at least .001. However, the
direct effect of applying the mathematics was not significant (p = .06). All the coefficients and
significant levels of the direct effects are presented in Figure 11.
Table 13 reported the indirect effect of the homework types on student achievement
measured by Algebra posttest 1.

73
path a path b
Figure 11. Coefficients and significance test for path a and path b using OTL measured by lesson coverage as the independent variable and Algebra posttest 1 as the dependent variable. Note: * indicated p < .01, ** indicated p < .05, *** indicated p < .001. Table 13 Total and Individual Indirect Effects for Homework Types as Mediators for Algebra Posttest 1 Est.
from Data
Est. from Bootstrap
Bias SE Bias Corrected Confidence Interval
Total -.0378 -.0360 .0018 .0725 (-.1836, .1014) Covering -.6771 -.6742 .0029 .1914 (-1.1023, -.3395) Applying .2752 .2719 -.0032 .1742 (-.0299, .6590) Review .3642 .3662 .0021 .1185 (.1698, .6513)
C1 -.9523 -.9461 .0062 .3541 (-1.7512, -.3424) C2 -1.0413 -1.0404 .0009 .2199 (-1.5390, -.6671) C3 -.0890 -.0943 -.0053 .2531 (-.6123, .3855)
Note: C1 = Covering the ideas – Applying the mathematics; C2 = Covering the ideas – Review; C3 = Applying the mathematics – Review.
Total indirect effect refers to combining indirect effects when the effects of all three
mediators are considered. Total indirect effect was -.04 ((-.68) for covering + .28 for applying +
.36 for review). The 95% confidence interval of the total effect ranged from -.18 to .10. Because
0 was between the lower limit and upper limit of the bias corrected confidence interval, the total
OTL by Lesson Coverage
.3583***
Covering
Applying
Review
.3862***
.4821***
Algebra Posttest 1
-1.8900***
.7125
.7555**

74
indirect effect of the OTL measured by lesson coverage through the three mediators had no
significant impact on the posttest 1 achievement.
The true indirect effect of the OTL measured by lesson coverage only through covering
the ideas was -.68 (.36 from IV to covering * -1.89 from covering to DV) and confidence interval
ranged from -1.10 to -.34. Because 0 was not between the lower and the upper limits of the bias
corrected confidence interval, homework covering the ideas was a mediator that had a negative
significant impact on the relationship between OTL measured by lesson coverage and posttest 1
achievement.
The true indirect effect of the OTL measured by lesson coverage only through applying
the mathematics was .28 (.39 from IV to applying * .71 from applying to DV) and confidence
interval ranged from -.03 to .66. Because 0 was between the lower and upper limits of the bias
corrected confidence interval, homework applying the mathematics had no significant impact on
the relationship between OTL measured by lesson coverage and posttest 1 achievement.
The true indirect effect of the OTL measured by lesson coverage only through review
homework was .36 (.48 from IV to review * .76 from review to DV) and confidence interval
ranged from .17 to .65. Because 0 was not between the lower and upper limits of the bias
corrected confidence interval, review homework was significant and had a positive impact on the
relationship between OTL measured by lesson coverage and posttest 1 achievement.
Table 13 also shows the comparisons of the three indirect effects for the mediators
denoted by C1, C2, and C3. C1, C2, C3 represent the effect differences between covering the
ideas and applying the mathematics, between covering the ideas and review, and between
applying the mathematics and review, respectively. Based on the estimates of the 95%
confidence interval (95% CIs in Table 13), C1 and C2, but not C3, showed significant effect

75
differences because the value of 0 was not in the ranges of the 95% confidence interval. In other
words, covering the ideas had a significantly negative effect and review had a significantly
positive effect. This finding occurred because covering the ideas and review both were
significant even though they weren’t similar effects whereas applying the mathematics did not
have any mediating effect.
Conclusion. In this path analysis I used a sample of 232 students. Overall, OTL
measured by lesson coverage as predictor and the three mediators used in the path analysis were
valid. Approximately 61% of the variance in the Algebra posttest 1 was accounted for by the
predictor through these three mediators. The total indirect effect of the OTL measured by lesson
coverage on student mathematics achievement measured by Algebra posttest 1 achievement was
not significant (-.04). The specific effects for covering the ideas, applying the mathematics, and
review were -.68, .28, and .36, respectively. Homework covering the ideas had significant,
negative impact on the relationship between OTL measured by lesson coverage and posttest 1
achievement and review homework had a significant, positive effect. However, applying the
mathematics was statistically insignificant as a mediator. This led to the significantly different
effect between applying the mathematics and review.
Using Algebra posttest 2 achievement as dependent variable. Overall, the whole
model showed that OTL measured by lesson coverage as a predictor via three mediators (i.e.,
Covering, Applying, and Review) in path analysis had significant impact on Algebra posttest 1,
(F (5, 226) = 62.03, p < .001). The was .58 and adjusted was .57, indicating that 57% of
variance in the Algebra posttest 2 was accounted for by OTL measured by lesson coverage
through the three mediators.

76
The total effect (i.e., direct and indirect effects) of the OTL measured by lesson coverage
on the impact of posttest 2 achievement (c path) was significant, t = 9.18, p < .001. The direct
effect of OTL measured by lesson coverage (cʹ′ path) to Algebra posttest 2 achievement was also
significant, t = 8.35, p < .001. The partial effect of OTL measured by lesson coverage on Algebra
posttest 2 achievement after controlling for pretest score was significant, t = 9.90, p < .001. The
direct effects of OTL measured by lesson coverage on the mediators (Covering, Applying, and
Review) were significant at the level of at least .001. The direct effects of covering the ideas and
applying the mathematics on posttest 2 achievement were significant at the level of at least .001.
However, the direct effect of review was not significant (p = .09). All the coefficients and
significance levels of the direct effects are presented in Figure 12.
path a path b
Figure 12. Coefficients and significance test for path a and path b using OTL measured by lesson coverage as the independent variable and Algebra posttest 2 as the dependent variable. Note: * indicated p < .01, ** indicated p < .05, *** indicated p < .001.
Table 14 reports indirect effect of the homework types on student achievement measured
by Algebra posttest 2.
OTL by Lesson Coverage
.3542***
Covering
Applying
Review
.3790***
.4699***
Algebra Posttest 2
-2.1121***
1.2284***
.3578

77
Table 14
Total and Individual Indirect Effects for Homework Types as Mediators for Algebra Posttest 2 Est.
from Data
Est. from Bootstrap
Bias SE Bias Corrected Confidence Interval
Total -.1145 -.1118 .0027 .0732 (-.2633, .0211) Covering -.7482 -.7464 .0018 .1993 (-1.2122, -.4063) Applying .4656 .4642 -.0013 .1830 (.1685, .9134) Review .1681 .1704 .0022 .0945 (.0082, .3799)
C1 -1.2138 -1.2107 .0031 .3734 (-2.1078, -.5910) C2 -.9163 -.9168 -.0004 .2101 (-1.3997, -.5541) C3 .2974 .2939 -.0036 .2398 (-.1189, .8435)
Note: C1 = Covering the ideas – Applying the mathematics; C2 = Covering the ideas – Review; C3 = Applying the mathematics – Review.
Total indirect effect refers to combining indirect effects when the effects of all three
mediators are considered. Total indirect effect was -.11 ((-.75) for covering + .47 for applying +
.17 for review). The 95% confidence interval of the total effect ranged from -.26 to .02. Because
0 occurred between the lower limit and upper limit of the bias corrected confidence interval, the
total indirect effect of the OTL measured by lesson coverage through the three mediators did not
have a significant impact on the posttest 2 achievement.
The true indirect effect of the OTL measured by lesson coverage only through covering
the ideas was -.75 (.35 from IV to covering * -.2.11 from covering to DV) and confidence
interval ranged from -1.21 to -.41. Because 0 was not between the lower and the upper limits of
the bias corrected confidence interval, homework covering the ideas was a mediator that had a
negative significant impact on the relationship between OTL measured by lesson coverage and
posttest 2 achievement.
The true indirect effect of the OTL measured by lesson coverage only through applying
the mathematics was .47 (.38 from IV to applying * 1.23 from applying to DV) and confidence
interval ranged from .17 to .91. Because 0 was not between the lower and upper limits of the bias

78
corrected confidence interval, homework applying the mathematics had a significant, positive
impact on the relationship between OTL measured by lesson coverage and posttest 2
achievement.
The true indirect effect of the OTL measured by lesson coverage only through review
homework was .17 (.47 from IV to review * .36 from review to DV) and confidence interval
ranged from .01 to .38. Because 0 was not between the lower and upper limits of the bias
corrected confidence interval, review homework was significant and had a positive impact on the
relationship between OTL measured by lesson coverage and posttest 2 achievement.
Table 14 also shows the comparisons of the three indirect effects for the mediators
denoted by C1, C2, and C3. C1, C2, C3 represent the effect differences between covering the
ideas and applying the mathematics, between covering the ideas and review, and between
applying the mathematics and review, respectively. Based on the estimates of the 95%
confidence interval (95% CIs in Table 14), C1 and C2, but not C3, showed significant effect
differences because the value of 0 was not in the ranges of the 95% confidence interval. In other
words, covering the ideas had a significantly negative effect, applying the mathematics and
review had significantly positive effects. This finding occurred because applying the
mathematics and review both had significant, positive effects, whereas covering the ideas had a
significant, negative effect. The effects of applying the mathematics and review were both
stronger than the effect of covering the ideas.
Conclusion. In this path analysis I used a sample of 232 students. Overall, OTL
measured by lesson coverage as predictor and the three mediators used in the path analysis were
valid. Approximately 57% of the variance in the Algebra posttest 2 was accounted for by the
predictor through these three mediators. The total indirect effect of the OTL measured by lesson

79
coverage on student mathematics achievement measured by Algebra posttest 2 achievement was
not significant (-.11). The specific effects for covering the ideas, applying the mathematics, and
review were -.75, .47, and .17, respectively. Homework covering the ideas had significant,
negative impact on the relationship between OTL measured by lesson coverage and posttest 2
achievement. However, applying the mathematics and review were both significant and positive
as mediators. This led to the significantly different effect between covering the ideas and review
and between applying the mathematics and review.
Using Algebra posttest 3 achievement as dependent variable. Overall, the whole
model showed that OTL measured by lesson coverage as a predictor via three mediators (i.e.,
Covering, Applying, and Review) in path analysis had significant impact on Algebra posttest 3,
(F (5, 226) = 83.40, p < .001). The was .65 and adjusted was .64, indicating that 64% of
variance in the Algebra posttest 3 was accounted for by OTL measured by lesson coverage
through the three mediators.
The total effect (i.e., direct and indirect effects) of the OTL measured by lesson coverage
on the impact of the posttest 3 achievement (c path) was significant, t = 9.26, p < .001. The direct
effect of OTL measured by lesson coverage (cʹ′ path) to Algebra posttest 3 achievement was also
significant, t = 8.68, p < .001. The partial effect of OTL measured by lesson coverage on Algebra
posttest 3 achievement after controlling for pretest score was significant, t = 11.59, p < .001. The
direct effects of OTL measured by lesson coverage on the mediators (Covering, Applying, and
Review) were significant at the level of at least .001. The direct effects of covering the ideas and
applying the mathematics on posttest 3 achievement were significant at the level of at least .001.
However, the direct effect of review was not significant (p = .16). All the coefficients and
significant levels of the direct effects are presented in Figure 13.

80
path a path b
Figure 13. Coefficients and significance test for path a and path b using OTL measured by lesson coverage as the independent variable and Algebra posttest 3 as the dependent variable. Note: * indicated p < .01, ** indicated p < .05, *** indicated p < .001.
Table 15 reports indirect effect of the homework types on student achievement measured
by Algebra posttest 3.
Table 15 Total and Individual Indirect Effects for Homework Types as Mediators for Algebra Posttest 3 Est.
from Data
Est. from Bootstrap
Bias SE Bias Corrected Confidence Interval
Total -.1157 -.1155 .0002 .0708 (-.2572, .0179) Covering -.7919 -.7938 -.0020 .1945 (-1.2163, -.4445) Applying .5458 .5474 .0016 .1798 (.2478, .9658) Review .1304 .1309 .0006 .0874 (-.0212, .3230)
C1 -1.3377 -1.3413 -.0036 .3661 (-2.1824, -.7149) C2 -.9222 -.9248 -.0025 .2023 (-1.3527, -.5625) C3 .4155 .4165 .0011 .2311 (.0069, .9200)
Note: C1 = Covering the ideas – Applying the mathematics; C2 = Covering the ideas – Review; C3 = Applying the mathematics – Review.
Total indirect effect refers to combining indirect effects when the effects of all three
mediators are considered. Total indirect effect was -.12 ((-.79) for covering + .55 for applying +
.13 for review). The 95% confidence interval of the total effect ranged from -.26 to .02. Because
OTL by Lesson Coverage
.3522***
Covering
Applying
Review
.3757***
.4670***
Algebra Posttest 3
-2.2485***
1.4527***
.2792

81
0 occurred between the lower limit and upper limit of the bias corrected confidence interval, the
total indirect effect of the OTL measured by lesson coverage through the three mediators did not
have a significant impact on the posttest 3 achievement.
The true indirect effect of the OTL measured by lesson coverage only through covering
the ideas was -.79 (.35 from IV to covering * -2.25 from covering to DV) and confidence interval
ranged from -1.22 to -.44. Because 0 was not between the lower and upper limits of the bias
corrected confidence interval, the homework type of covering the ideas was a mediator that had
negative significant impact on the relationship between OTL measured by lesson coverage and
posttest 3 achievement.
The true indirect effect of the OTL measured by lesson coverage only through applying
the mathematics was .55 (.38 from IV to applying * 1.45 from applying to DV) and confidence
interval ranged from .25 to .97. Because 0 was not between the lower and upper limits of the bias
corrected confidence interval, homework applying the mathematics had a statistically significant,
positive impact on the relationship between OTL measured by lesson coverage and posttest 3
achievement.
The true indirect effect of the OTL measured by lesson coverage only through review
homework was .13 (.47 from IV to review * .28 from review to DV) and confidence interval
ranged from -.02 to .32. Because 0 was between the lower and upper limits of the bias corrected
confidence interval, review homework had no significant impact on the relationship between
OTL measured by lesson coverage and posttest 3 achievement.
Table 15 also shows the comparisons of the three indirect effects for the mediators
denoted by C1, C2, and C3. C1, C2, C3 represent the effect differences between covering the
ideas and applying the mathematics, between covering the ideas and review, and between

82
applying the mathematics and review, respectively. Based on the estimates of the 95%
confidence interval, C1, C2 and C3 all showed the significant effect differences because the
value of 0 was not in the ranges of the 95% confidence interval. In other words, covering the
ideas had a significant, negative effect on the relationship between OTL measured by lesson
coverage and posttest 3 achievement. Applying the mathematics and review both had significant,
positive impact.
Conclusion. In this path analysis I used a sample of 232 students. Overall, OTL
measured by lesson coverage as predictor and the three mediators used in the path analysis were
valid. Approximately 64% of the variance in the Algebra posttest 3 was accounted for by the
predictor through these three mediators. The total indirect effect of the OTL measured by lesson
coverage on student mathematics achievement measured by Algebra posttest 3 achievement was
not significant (-.12). The specific effects for covering the ideas, applying the mathematics, and
review were -.79, .55, and .13, respectively. Homework covering the ideas had significant,
negative impact on the relationship between OTL measured by lesson coverage and posttest 3
achievement and applying the mathematics and review homework had significant, positive
effects. This led to significantly different effect between covering the ideas and applying the
mathematics and between covering the ideas and review. C3 showed that the effect of review is
stronger than the effect of applying the mathematics.
Summary of the Results
I can summarize the true and estimated effects using lesson coverage to measure OTL in
Tables 16 and 17. In the tables PTM means Pre-Transition Mathematics, TM stands for
Transition Mathematics, A stands for Algebra, OTL means opportunity to learn, LC means
lesson coverage, PT stands for posttest. So for example, PTMOTLLC measure OTL measured by

83
lesson coverage in Pre-Transition Mathematics, and PTMPT1 means Pre-Transition
Mathematics posttest 1.
Extent of Homework Influence on Posttest OTL and Achievement (Research Question 3)
The third research question focuses on the relationship between homework and teachers’
reported posttest OTL: To what extent do different types of homework influence the impact of
posttest opportunity to learn (i.e., teachers’ perceived opportunity to learn the content on each
posttest) on student mathematics achievement measured by each corresponding posttest in Pre-
Transition Mathematics, Transition Mathematics, and Algebra?
Regression models are again constructed using each posttest percent correct as the
dependent variable, with teachers’ reported OTL on each posttest as the independent variable
while controlling for the standardized pretest in each mathematics course. The three mediators
are the percent of each of the three homework types (covering the ideas, applying the
mathematics, and review) assigned for students to complete. The same analysis process used to
answer research question 2 is also used to answer research question 3.
Table 16 True Indirect Effect for OTL measured by Lesson Coverage
Covering the ideas
Applying the mathematics
Review Total
PTMOTLLCàPTMPT1 .0147 .1868* -.1036* .0979* PTMOTLLCàPTMPT2 .0136 .0869* -.0341 .0663* PTMOTLLCàPTMPT3 .0218 .1346* -.0190 .1374*
TMOTLLCàTMPT1 .4166* -.0565* -.0301 .3300* TMOTLLCàTMPT2 .3982* -.0609* -.0213 .3160* TMOTLLCàTMPT3 .3600* -.0731* .0371 .3240*
AOTLLCàAPT1 -.6771* .2752 .3642* -.0378 AOTLLCàAPT2 -.7482* .4656* .1681* -.1145 AOTLLCàAPT3 -.7919* .5458* .1304 -.1157
Note: *indicates the bias corrected confidence interval does not contain zero, hence the effect is statistically significant.

84
Table 17 Estimated Indirect Effect for OTL measured by Lesson Coverage
Covering the ideas
Applying the mathematics
Review Total
PTMOTLLCàPTMPT1 .0146 .1865* -.1045 .0966* PTMOTLLCàPTMPT2 .0136 .0872* -.0350 .0659* PTMOTLLCàPTMPT3 .0214 .1352* -.0200 .1366*
TMOTLLCàTMPT1 .4164* -.0484* -.0322 .3357* TMOTLLCàTMPT2 .4011* -.0526* -.0249 .3237* TMOTLLCàTMPT3 .3605* -.0644* .0342 .3303*
AOTLLCàAPT1 -.6742* .2719 .3662* -.0360 AOTLLCàAPT2 -.7464* .4642* .1704* -.1118 AOTLLCàAPT3 -.7938* .5474* .1309 -.1155
Note: *indicates the bias corrected confidence interval does not contain zero, hence the effect statistically significant. Pre-Transition Mathematics
Using PTM posttest 1 achievement as dependent variable. Overall, the whole model
shows that OTL on posttest 1 as a predictor via three mediators (i.e., Covering, Applying, and
Review) in path analysis had significant impact on PTM posttest 1, (F (5, 281) = 49.30,
p < .001.). The was .47 and adjusted was .46, indicating that 46% of variance in the PTM
posttest 1 was accounted for by OTL on posttest 1 achievement through the three mediators.
The total effect (i.e., direct and indirect effects) of the teachers’ reported OTL on PTM
posttest 1 on the impact of the posttest 1 achievement (c path) was significant, t = 9.74,
p < .001. The direct effect of teachers’ reported PTM posttest 1 OTL (cʹ′ path) to PTM posttest 1
achievement was significant as well, t = 6.53, p < .001. The partial effect of teachers’ reported
PTM posttest 1 OTL on PTM posttest 1 after controlling for pretest score was significant too,
t = 6.81, p < .001. All the direct effects of OTL on posttest 1 achievement on the three mediators
(Covering, Applying, and Review) and of the three mediators on the posttest 1 achievement were
significant at the level of at least .01. All the coefficients and significant levels of the direct
effects are presented in Figure 14.

85
path a path b
Figure 14. Coefficients and significance for path a and path b using teachers’ reported OTL on PTM posttest 1 as the independent variable and PTM posttest 1 achievement as the dependent variable. Note: * indicated p < .01, ** indicated p < .05, *** indicated p < .001.
Table 18 reports the indirect effect of the homework types on student achievement
measured by Pre-Transition Mathematics posttest 1.
Table 18 Indirect Effects of Independent Variable on Dependent Variable through Three Homework Types as Mediators for Pre-Transition Mathematics Posttest 1 Est.
from Data
Est. from Bootstrap
Bias SE Bias Corrected Confidence Interval
Total .1919 .1905 -.0014 .0708 (.0169, .3689) Covering .2562 .2565 .0004 .1945 (.0964, .4048) Applying .3056 .3031 -.0025 .1798 (.0992, .5123) Review -.3699 -.3691 .0008 .0874 (-.5575, -.1952)
C1 -.0494 -.0465 .0029 .3661 (-.3753, .2726) C2 -.6260 .6256 -.0004 .2023 (.4251, .8351) C3 .6754 .6721 -.0033 .1779 (.3262, 1.0225)
Note: C1 = Covering the ideas – Applying the mathematics; C2 = Covering the ideas – Review; C3 = Applying the mathematics – Review.
PTM Posttest 1 OTL
.5908***
Covering
Applying
Review
.8587***
1.4699***
PTM Posttest 1
.4336**
.3559**
-.2516**

86
Total indirect effect refers to combining indirect effects when the effects of all three
mediators are considered. Total indirect effect was .19 (.26 for covering + .31 for applying +
(-.37) for review). The 95% confidence interval of the total effect ranged from .02 to .37.
Because 0 was not between the lower limit and upper limit of the bias corrected confidence
interval, the total indirect effect of the OTL measured by lesson coverage through the three
mediators had significant impact on posttest 1 achievement.
The true indirect effect of the OTL on posttest 1 only through covering the ideas was .26
(.59 from IV to covering *. 43 from covering to DV) and confidence interval ranged from .10 to
.40. Because 0 was not between the lower and upper limits of the bias corrected confidence
interval, homework covering the ideas was a mediator that had a positive significant impact on
the relationship between teachers’ reported OTL on posttest 1 and posttest 1 achievement.
The true indirect effect of the OTL on posttest 1 only through applying the mathematics
was .31 (.86 from IV to applying * .36 from applying to DV) and confidence interval ranged
from .10 to .51. Because 0 was not between the lower and upper limits of the bias corrected
confidence interval, homework applying the mathematics was a mediator that had a positive
significant impact on the relationship between teachers’ reported OTL on posttest 1 and posttest
1 achievement.
The true indirect effect of the OTL on posttest 1 only through review homework was -.37
(1.47 from IV to review * -.25 from review to DV) and confidence interval ranged from -.56 to
-.20. Because 0 was not between the lower and upper limits of the bias corrected confidence
interval, review homework was a mediator that had a negative significant impact on the
relationship between teachers’ reported OTL on posttest 1 and posttest 1 achievement.

87
Table 18 also shows the comparisons of the three indirect effects for the mediators
denoted by C1, C2, and C3. C1, C2, C3 represent the effect differences between covering the
ideas and applying the mathematics, between covering the ideas and review, and between
applying the mathematics and review, respectively. Based on the estimates of the 95%
confidence interval, C2 and C3, but not C1, showed the significant effect differences because 0
was not in the ranges of the 95% confidence interval. In other words, the effects of covering the
ideas and applying the mathematics were similar. This finding occurred because covering the
ideas and applying the mathematics had similar positive indirect effects whereas review had a
negative indirect effect.
Conclusion. In this path analysis, I used a sample of 287 students. Overall, OTL on
posttest 1 as the predictor and the three mediators used in the path analysis are valid.
Approximately 46% of the variance in the PTM posttest 1 was accounted for by the predictor
through these three mediators. The total indirect effect of teachers’ reported OTL on Pre-
Transition Mathematics posttest 1 on achievement measured by the same test was positive and
statistically significant (.19). The specific effects for covering the ideas, applying the
mathematics, and review were .26, .31, and -.37, respectively. All these three mediators have
significant impact on the relationship between teachers’ reported OTL on posttest 1 and posttest
1 achievement. However, covering the ideas and applying the mathematics have similar, positive
effects, while review has a negative effect. This led to the significantly different effect between
covering the ideas and review and between applying the mathematics and review.
Using PTM posttest 2 achievement as dependent variable. Overall, the whole model
shows that OTL on posttest 2 as a predictor via three mediators (i.e., Covering, Applying, and
Review) in path analysis had significant impact on PTM posttest 2 achievement, (F (5, 281) =
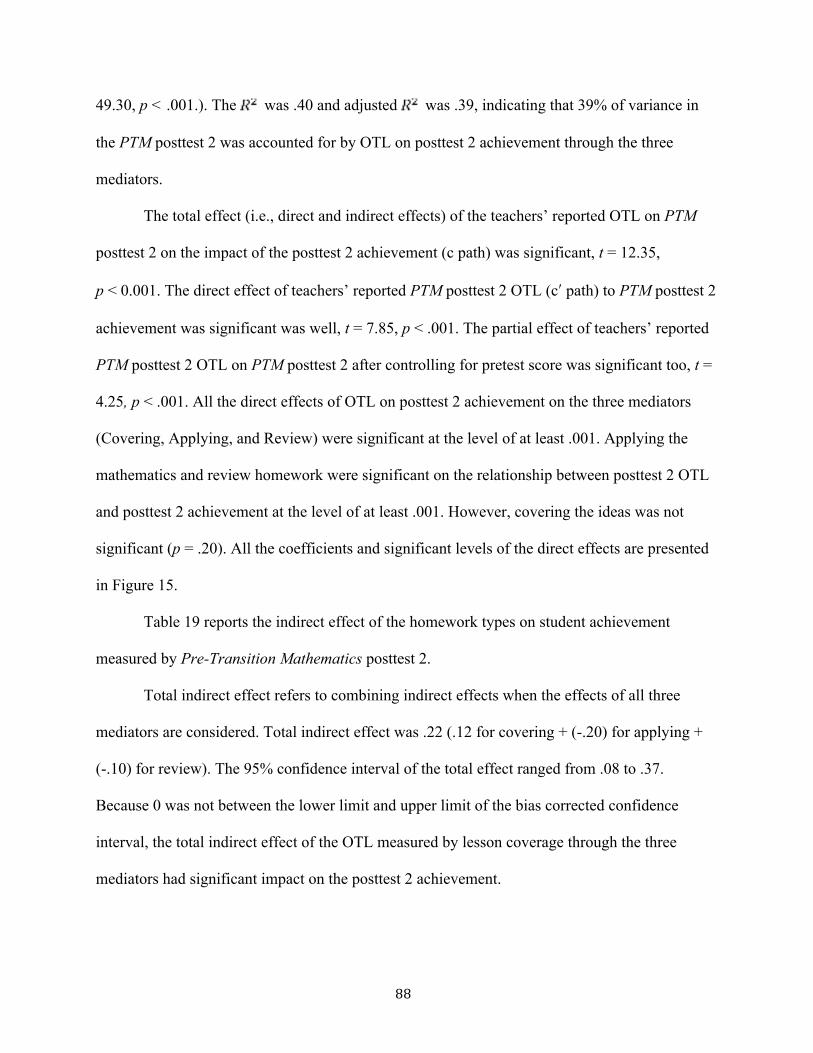
88
49.30, p < .001.). The was .40 and adjusted was .39, indicating that 39% of variance in
the PTM posttest 2 was accounted for by OTL on posttest 2 achievement through the three
mediators.
The total effect (i.e., direct and indirect effects) of the teachers’ reported OTL on PTM
posttest 2 on the impact of the posttest 2 achievement (c path) was significant, t = 12.35,
p < 0.001. The direct effect of teachers’ reported PTM posttest 2 OTL (cʹ′ path) to PTM posttest 2
achievement was significant was well, t = 7.85, p < .001. The partial effect of teachers’ reported
PTM posttest 2 OTL on PTM posttest 2 after controlling for pretest score was significant too, t =
4.25, p < .001. All the direct effects of OTL on posttest 2 achievement on the three mediators
(Covering, Applying, and Review) were significant at the level of at least .001. Applying the
mathematics and review homework were significant on the relationship between posttest 2 OTL
and posttest 2 achievement at the level of at least .001. However, covering the ideas was not
significant (p = .20). All the coefficients and significant levels of the direct effects are presented
in Figure 15.
Table 19 reports the indirect effect of the homework types on student achievement
measured by Pre-Transition Mathematics posttest 2.
Total indirect effect refers to combining indirect effects when the effects of all three
mediators are considered. Total indirect effect was .22 (.12 for covering + (-.20) for applying +
(-.10) for review). The 95% confidence interval of the total effect ranged from .08 to .37.
Because 0 was not between the lower limit and upper limit of the bias corrected confidence
interval, the total indirect effect of the OTL measured by lesson coverage through the three
mediators had significant impact on the posttest 2 achievement.

89
path a path b
Figure 15. Coefficients and significance for path a and path b using teachers’ reported OTL on PTM posttest 2 as the independent variable and PTM posttest 2 achievement as the dependent variable. Note: * indicated p < .01, ** indicated p < .05, *** indicated p < .001. Table 19 Indirect Effects of Independent Variable on Dependent Variable through Three Homework Types as Mediators for Pre-Transition Mathematics Posttest 2 Est.
from Data
Est. from Bootstrap
Bias SE Bias Corrected Confidence Interval
Total .2220 .2223 .0003 .0720 (.0830, .3653) Covering .1235 .1247 .0012 .0819 (-.0441, .2806) Applying .2019 .2013 -.0006 .0864 (.0378, .3804) Review -.1034 -.1036 -.0003 .0480 (-.2052, -.0162)
C1 -.0784 -.0766 .0018 .1486 (-.3859, .1996) C2 .2268 .2283 .0015 .0859 (.0558, .3926) C3 .3053 .3049 -.0004 .1217 (.0788, .5552)
Note: C1 = Covering the ideas – Applying the mathematics; C2 = Covering the ideas – Review; C3 = Applying the mathematics – Review.
The true indirect effect of the OTL on posttest 2 only through covering the ideas was .12
(.70 from IV to covering *. 18 from covering to DV) and confidence interval ranged from -.04 to
.28. Because 0 was between the lower and upper limits of the bias corrected confidence interval,
PTM Posttest 2 OTL
.7031***
Covering
Applying
Review
.8151***
.9618***
PTM Posttest 2
.1756
.2477*
-.1075*

90
homework covering the ideas had no significant effect on the relationship between teachers’
reported OTL on posttest 2 and posttest 2 achievement.
The true indirect effect of the OTL on posttest 2 only through applying the mathematics
was .20 (.82 from IV to applying * .25 from applying to DV) and confidence interval ranged
from .04 to .38. Because 0 was not between the lower and upper limits of the bias corrected
confidence interval, homework applying the mathematics was a mediator that had a positive
significant impact on the relationship between teachers’ reported OTL on posttest 2 and posttest
2 achievement.
The true indirect effect of the OTL on posttest 2 only through review homework was -.10
(.96 from IV to review * -.11 from review to DV) and confidence interval ranged from -.21 to
-.02. Because 0 was not between the lower and upper limits of the bias corrected confidence
interval, the homework type of review was a mediator that had a negative significant impact on
the relationship between teachers’ reported OTL on posttest 2 and posttest 2 achievement.
Table 19 also shows the comparisons of the three indirect effects for the mediators
denoted by C1, C2, and C3. C1, C2, C3 represent the effect differences between covering the
ideas and applying the mathematics, between covering the ideas and review, and between
applying the mathematics and review, respectively. Based on the estimates of the 95%
confidence interval, C2 and C3, but not C1, showed significant effect differences because 0 was
not in the ranges of the 95% confidence interval. In other words, the effects of applying the
mathematics and review were both significant, with applying the mathematics positive and
review negative. However, covering the ideas did not have a significant effect.
Conclusion. In this path analysis, I used a sample of 287 students. Overall, OTL on
posttest 2 as the predictor and the three mediators used in the path analysis are valid.

91
Approximately 39% of the variance in the PTM posttest 2 was accounted for by the predictor
through these three mediators. The total indirect effect of teachers’ reported OTL on Pre-
Transition Mathematics posttest 2 on achievement measured by the same test was positive and
statistically significant (.22). The specific effects for covering the ideas, applying the
mathematics, and review were .12, .20, and -.10, respectively. Applying the mathematics and
review had significant impacts on the relationship between teachers’ reported OTL on posttest 2
and posttest 2 achievement, with applying the mathematics having a positive effect and review
having a negative effect. Covering the ideas had no significant effect. This led to the
significantly different effect between covering the ideas and applying the mathematics.
Using PTM posttest 3 achievement as dependent variable. Overall, the whole model
shows that OTL on posttest 3 as a predictor via three mediators (i.e., Covering, Applying, and
Review) in path analysis had significant impact on PTM posttest 1, (F (5, 281) = 49.30,
p < .001.). The was .52 and adjusted was .51, indicating that 51% of variance in the PTM
posttest 3 was accounted for by OTL on posttest 3 through the three mediators.
The total effect (i.e., direct and indirect effects) of the teachers’ reported OTL on PTM
posttest 3 on the impact of the posttest 3 achievement (c path) was significant, t = 9.64,
p < .001. The direct effect of teachers’ reported PTM posttest 3 OTL (cʹ′ path) to PTM posttest 3
achievement was significant as well, t = 6.82, p < .001. The partial effect of teachers’ reported
PTM posttest 3 OTL on PTM posttest 3 after controlling for pretest score was significant too, t =
8.49, p < .001. All the direct effects of OTL on posttest 3 achievement on the three mediators
(Covering, Applying, and Review) were significant at the level of at least .001. The direct effect
of homework covering the ideas on the posttest 3 achievement was significant at the level of at
least .0001, however, homework applying the mathematics and review were not significant

92
(p = .42 and p = .76). All the coefficients and significant levels of the direct effects are presented
in Figure 16.
Table 20 reports the indirect effect of the homework types on student achievement
measured by Pre-Transition Mathematics posttest 3.
Total indirect effect refers to combining indirect effects when the effects of all three
mediators are considered. Total indirect effect was .33 (.48 for covering + (-.14) for applying +
(-.02) for review). The 95% confidence interval of the total effect ranged from .12 to .54.
Because 0 was not between the lower limit and upper limit of the bias corrected confidence
interval, the total indirect effect of the teachers’ reported PTM posttest 3 OTL through the three
mediators had significant impact on posttest 3 achievement.
path a path b
Figure 16. Coefficients and significance for path a and path b using teachers’ reported OTL on PTM posttest 3 as the independent variable and PTM posttest 3 achievement as the dependent variable. Note: * indicated p < .01, ** indicated p < .05, *** indicated p < .001.
PTM Posttest 3 OTL
.6117***
Covering
Applying
Review
1.1460***
1.1478***
PTM Posttest 3
.7919***
-.1179
-.0186

93
Table 20 Indirect Effects of Independent Variable on Dependent Variable through Three Homework Types as Mediators for Pre-Transition Mathematics Posttest 3 Est.
from Data
Est. from Bootstrap
Bias SE Bias Corrected Confidence Interval
Total .3279 .3260 -.0019 .1065 (.1197, .5400) Covering .4844 .4875 .0032 .0831 (.3229, .6459) Applying -.1352 -.1409 -.0058 .1584 (-.4516, .1689) Review -.0213 -.0205 .0008 .0661 (-.1566, .1047)
C1 .6195 .6285 .0090 .2141 (.1971, 1.0411) C2 .5057 .5081 .0024 .0957 (.3190, .6921) C3 -.1139 -.1204 -.0065 .2069 (-.5198, .2977)
Note: C1 = Covering the ideas – Applying the mathematics; C2 = Covering the ideas – Review; C3 = Applying the mathematics – Review.
The true indirect effect of the OTL on posttest 3 only through covering the ideas was .48
(.61 from IV to covering *. 79 from covering to DV) and confidence interval ranged from .32 to
.65. Because 0 was not between the lower and upper limits of the bias corrected confidence
interval, homework covering the ideas was a mediator that had a positive significant impact on
the relationship between teachers’ reported OTL on posttest 3 and posttest 3 achievement.
The true indirect effect of the OTL on posttest 3 only through applying the mathematics
was -.14 (1.15 from IV to applying * -.12 from applying to DV) and confidence interval ranged
from -.45 to .17. Because 0 was between the lower and upper limits of the bias corrected
confidence interval, homework applying the mathematics was not a mediator that had a
significant impact on the relationship between teachers’ reported OTL on posttest 3 and posttest
3 achievement.
The true indirect effect of the OTL on posttest 3 only through review homework was -.02
(1.15 from IV to review * -.02 from review to DV) and confidence interval ranged from -.16 to
.10. Because 0 was between the lower and upper limits of the bias corrected confidence interval,

94
review homework had no significant impact on the relationship between teachers’ reported OTL
on posttest 3 and posttest 3 achievement.
Table 20 also shows the comparisons of the three indirect effects for the mediators
denoted by C1, C2, and C3. C1, C2, C3 represent the effect differences between covering the
ideas and applying the mathematics, between covering the ideas and review, and between
applying the mathematics and review, respectively. Based on the estimates of the 95%
confidence interval (95% CIs in Table 20), C1 and C2 showed the significant effect differences
because the value of 0 was not in the ranges of the 95% confidence interval, but not C3. This
finding occurred because covering the ideas had a significant, positive effect and applying the
mathematics had a significant, negative effect, whereas review had no significant effect.
Conclusion. In this path analysis, I used a sample of 287 students. Overall, OTL on
posttest 3 as the predictor and the three mediators used in the path analysis are valid.
Approximately 51% of the variance in the PTM posttest 3 was accounted for by the predictor
through these three mediators. The total indirect effect of teachers’ reported OTL on Pre-
Transition Mathematics posttest 3 on achievement measured by the same test was positive and
statistically significant (.33). The specific effects for covering the ideas, applying the
mathematics, and review were .48, -.14, and -.02, respectively. The homework covering the ideas
had a significant, positive impact on the relationship between the teachers’ reported posttest 3
OTL and posttest 3 achievement, and the effect of applying the mathematics was significant but
negative. Review homework had no significant effect. This leads to the significantly different
effect between applying the mathematics and review.

95
Transition Mathematics
Using TM posttest 1 achievement as dependent variable. Overall, the whole
model shows that OTL on posttest 1 as a predictor via three mediators (i.e., Covering, Applying,
and Review) in path analysis had significant impact on TM posttest 1, (F (5, 231) = 34.96,
p < .001.). The was .43 and adjusted was .42, indicating that 42% of variance in the TM
posttest 1 was accounted for by OTL on posttest 1 through the three mediators.
The total effect (i.e., direct and indirect effects) of the teachers’ reported OTL on TM posttest 1
on the impact of the posttest 1 achievement (c path) was not significant, t = .99, p = .32. The
direct effect of teachers’ reported TM posttest 1 OTL (cʹ′ path) to TM posttest 1 achievement was
not significant either, t = -1.20, p = .23. The partial effect of teachers’ reported TM posttest 1
OTL on TM posttest 1 after controlling for pretest score was significant, t = 6.73, p < .001. All
the direct effects of OTL on posttest 1 achievement on the three mediators (Covering, Applying,
and Review) and of the three mediators on the posttest 1 achievement were significant at the
level of at least .01. All the coefficients and significant levels of the direct effects are presented
in Figure 17.
Table 21 reports the indirect effect of the homework types on student achievement
measured by Transition Mathematics posttest 1.
Total indirect effect refers to combining indirect effects when the effects of all three
mediators are considered. Total indirect effect was .45 (.56 for covering + .59 for applying +
(-.71) for review). The 95% confidence interval of the total effect ranged from -.07 to .99.
Because 0 was between the lower limit and upper limit of the bias corrected confidence interval,
the total indirect effect of the teachers’ reported TM posttest 1 OTL through the three mediators
had no significant impact on the posttest 1 achievement.

96
path a path b
Figure 17. Coefficients and significance for path a and path b using teachers’ reported OTL on TM posttest 1 as the independent variable and TM posttest 1 achievement as the dependent variable. Note: * indicated p < .01, ** indicated p < .05, *** indicated p < .001. Table 21 Indirect Effects of Independent Variable on Dependent Variable through Three Homework Types as Mediators for Transition Mathematics Posttest 1
Est. from Data
Est. from Bootstrap
Bias SE Bias Corrected Confidence Interval
Total .4469 .4356 -.0113 .2726 (-.0736, .9890) Covering .5592 .5546 -.0046 .1581 (.2724, .8973) Applying .5942 .5805 -.0138 .3203 (-.0367, 1.2243) Review -.7065 -.6995 .0070 .1840 (-1.1360, -.3945)
C1 -.0350 -.0259 .0092 .2973 (-.6080, .5616) C2 1.2657 1.2541 -.0116 .3287 (.6805, 1.9963) C3 1.3007 1.2799 -.0208 .4621 (.4067, 2.2402)
Note: C1 = Covering the ideas – Applying the mathematics; C2 = Covering the ideas – Review; C3 = Applying the mathematics – Review.
The true indirect effect of the OTL on posttest 1 only through covering the ideas was .56
(.11 from IV to covering * 4.98 from covering to DV) and confidence interval ranged from .27 to
.90. Because 0 was not between the lower and upper limits of the bias corrected confidence
TM Posttest 1 OTL
.1122**
Covering
Applying
Review
1.0829***
1.0000***
TM Posttest 1
4.9822***
.5487***
-.7065***

97
interval, homework covering the ideas was a mediator that had a positive significant impact on
the relationship between teachers’ reported OTL on posttest 1 and posttest 1 achievement.
The true indirect effect of the OTL on posttest 1 only through applying the mathematics
was .59 (1.08 from IV to applying * .55 from applying to DV) and confidence interval ranged
from -.04 to 1.22. Because 0 was between the lower and upper limits of the bias corrected
confidence interval, homework applying the mathematics did not have a significant impact on
the relationship between teachers’ reported OTL on posttest 1 and posttest 1 achievement.
The true indirect effect of the OTL on posttest 1 only through review homework was -.71
(1.00 from IV to review * -.71 from review to DV) and confidence interval ranged from -1.14 to
-.39. Because 0 was not between the lower and upper limits of the bias corrected confidence
interval, review homework was a mediator that had a negative significant impact on the
relationship between teachers’ reported OTL on posttest 1 and posttest 1 achievement.
Table 21 also shows the comparisons of the three indirect effects for the mediators
denoted by C1, C2, and C3. C1, C2, C3 represent the effect differences between covering the
ideas and applying the mathematics, between covering the ideas and review, and between
applying the mathematics and review, respectively. Based on the estimates of the 95%
confidence interval (95% CIs in Table 21), C2 and C3 showed the significant effect differences
because the value of 0 was not in the ranges of the 95% confidence interval, but not C1. In other
words, the effect of covering the ideas was not significant on the relationship between teachers’
reported posttest 1 OTL and posttest 1 achievement. The effect of homework applying the
mathematics was significant and positive and the effect of review homework was significant and
negative.

98
Conclusion. In this path analysis, I used a sample of 237 students. Overall, OTL on
posttest 1 as the predictor and the three mediators used in the path analysis are valid.
Approximately 42% of the variance in the TM posttest 1 was accounted for by the predictor
through these three mediators. The total indirect effect of teachers’ reported OTL on Transition
Mathematics posttest 1 on achievement measured by the same test was not significant. The
specific effects for covering the ideas, applying the mathematics, and review were .56, .59, and
-.71, respectively. Covering the ideas and review had significant impact on the relationship
between teachers’ reported OTL on posttest 1 and posttest 1 achievement. However, the
homework that applies the mathematics did not have any significant effect. This led to the
significantly different effect between covering the ideas and applying the mathematics.
Using TM posttest 2 achievement as dependent variable. Overall, the whole model
shows that OTL on posttest 2 as a predictor via three mediators (i.e., Covering, Applying, and
Review) in path analysis had significant impact on TM posttest 2, (F (5, 231) = 35.03, p < .001).
The was .43 and adjusted was .42, indicating that 42% of variance in the TM posttest 2
was accounted for by OTL on posttest 2 through the three mediators.
The total effect (i.e., direct and indirect effects) of the teachers’ reported OTL on TM
posttest 2 on the impact of the posttest 2 achievement (c path) was significant, t = 6.06,
p < .001. The direct effect of teachers’ reported TM posttest 2 OTL (cʹ′ path) to TM posttest 2
achievement was significant was well, t = 4.37, p < .001. The partial effect of teachers’ reported
TM posttest 2 OTL on TM posttest 2 after controlling for pretest score was significant too,
t = 7.87, p < .001. Posttest 2 OTL had a significant impact on homework applying the
mathematics but no significant impact on homework covering the ideas and review. Homework
covering the ideas and review had significant effect on posttest 2 achievement but homework

99
applying the mathematics did not have a significant effect on posttest 2 achievement. All the
coefficients and significant levels of the direct effects are presented in Figure 18.
path a path b
Figure 18. Coefficients and significance for path a and path b using teachers’ reported OTL on TM posttest 2 as the independent variable and TM posttest 2 achievement as the dependent variable. Note: * indicated p < .01, ** indicated p < .05, *** indicated p < .001.
Table 22 reports the indirect effect of the homework types on student achievement
measured by Transition Mathematics posttest 2.
Total indirect effect refers to combining indirect effects when the effects of all three
mediators are considered. Total indirect effect was .11 (.18 for covering + (-.06) for applying +
(-.01) for review). The 95% confidence interval of the total effect ranged from -.11 to .33.
Because 0 was between the lower limit and upper limit of the bias corrected confidence interval,
the total indirect effect of the teachers’ reported TM posttest 2 OTL through the three mediators
had no significant impact on the posttest 2 achievement.
TM Posttest 2 OTL
.0494
Covering
Applying
Review
.5041***
.0268
TM Posttest 2
3.7123***
-.1173
-.3653**

100
Table 22 Indirect Effects of Independent Variable on Dependent Variable through Three Homework Types as Mediators for Transition Mathematics Posttest 2 Est.
from Data
Est. from Bootstrap
Bias SE Bias Corrected Confidence Interval
Total .1145 .1187 .0042 .1095 (-.1054, .3277) Covering .1834 .1688 -.0146 .0759 (.0466, .3155) Applying -.0591 -.0553 .0038 .0868 (-.2467, .1007) Review -.0098 .0053 .0150 .0775 (-.1201, .1624)
C1 .2425 .2241 -.0184 .1090 (.0551, .4456) C2 .1932 .1635 -.0297 .1474 (-.0864, .4306) C3 -.0493 -.0606 -.0113 .1109 (-.2120, .2358)
Note: C1 = Covering the ideas – Applying the mathematics; C2 = Covering the ideas – Review; C3 = Applying the mathematics – Review.
The true indirect effect of the OTL on posttest 2 only through covering the ideas was .18
(.05 from IV to covering *3.71 from covering to DV) and confidence interval ranged from .05 to
.32. Because 0 was not between the lower and upper limits of the bias corrected confidence
interval, homework covering the ideas was a mediator that had a positive significant impact on
the relationship between teachers’ reported OTL on posttest 2 and posttest 2 achievement.
The true indirect effect of the OTL on posttest 2 only through applying the mathematics
was -.06 (.50 from IV to applying * -.12 from applying to DV) and confidence interval ranged
from -.25 to .10. Because 0 was between the lower and upper limits of the bias corrected
confidence interval, homework applying the mathematics had no significant impact on the
relationship between teachers’ reported OTL on posttest 2 and posttest 2 achievement.
The true indirect effect of the OTL on posttest 2 only through review homework was -.01
(.03 from IV to review * -.37 from review to DV) and confidence interval ranged from -.12 to
.16. Because 0 was between the lower and upper limits of the bias corrected confidence interval,
review homework had no significant impact on the relationship between teachers’ reported OTL
on posttest 2 and posttest 2 achievement.

101
Table 22 also shows the comparisons of the three indirect effects for the mediators
denoted by C1, C2, and C3. C1, C2, C3 represent the effect differences between covering the
ideas and applying the mathematics, between covering the ideas and review, and between
applying the mathematics and review, respectively. Based on the estimates of the 95%
confidence interval, C1 showed the significant effect differences because 0 was not in the range
of the 95% confidence interval, but not C2 and C3. In other words, there were no effects of
homework applying the mathematics and review. This finding occurred because homework
covering the ideas had a significant positive impact on the relationship of posttest 2 OTL and
posttest 2 achievement whereas homework applying the mathematics and review had no
significant indirect effect.
Conclusion. In this path analysis, I used a sample of 237 students. Overall, OTL on
posttest 2 as the predictor and the three mediators used in the path analysis are valid.
Approximately 42% of the variance in the TM posttest 2 was accounted for by the predictor
through these three mediators. The total indirect effect of teachers’ reported OTL on Transition
Mathematics posttest 2 on achievement measured by the same test was not statistically
significant (.11). The specific effects for covering the ideas, applying the mathematics, and
review were .18, -.06, and -.01, respectively. Covering the ideas had a positive, significant
impact on the relationship between teachers’ reported OTL on posttest 2 and posttest 2
achievement. However, applying the mathematics and review did not have any significant
impact. This leads to the significantly different effect between covering the ideas and review and
between applying the mathematics and review.
Using TM posttest 3 achievement as dependent variable. Overall, the whole model
shows that OTL on posttest 3 as a predictor via three mediators (i.e., Covering, Applying, and

102
Review) in path analysis had significant impact on TM posttest 3, (F (5, 231) = 84.74, p < .001.).
The was .65 and adjusted was .64, indicating that 64% of variance in the TM posttest 3
was accounted for by OTL on posttest 3 through the three mediators.
The total effect (i.e., direct and indirect effects) of the teachers’ reported OTL on TM
posttest 3 on the impact of the posttest 3 achievement (c path) was not significant, t = 1.33,
p = .19. The direct effect of teachers’ reported TM posttest 3 OTL (cʹ′ path) to TM posttest 3
achievement was not significant either, t = 1.60, p = .11. The partial effect of teachers’ reported
TM posttest 3 OTL on TM posttest 3 after controlling for pretest score was significant, t = 15.77,
p < .001. The direct effects of OTL on posttest 3 achievement on the homework covering the
ideas and review were significant at the level of at least .001, however applying the mathematics
was not significant. Homework covering the ideas and review also had significant impacts on
posttest 3 achievement, however homework applying the mathematics did not have any
significant impact. All the coefficients and significant levels of the direct effects are presented in
Figure 19.
Table 23 reports the indirect effect of the homework types on student achievement
measured by Transition Mathematics posttest 3.
Total indirect effect refers to combining indirect effects when the effects of all three
mediators are considered. Total indirect effect was -.05 ((-.48) for covering + (-.02) for applying
+ .45 for review). The 95% confidence interval of the total effect ranged from -.20 to .12.
Because 0 was between the lower limit and upper limit of the bias corrected confidence interval,
the total indirect effect of the teachers’ reported TM posttest 3 OTL through the three mediators
had no significant impacts on the posttest 3 achievement.

103
path a path b
Figure 19. Coefficients and significance for path a and path b using teachers’ reported OTL on TM posttest 3 as the independent variable and TM posttest 3 achievement as the dependent variable. Note: * indicated p < .01, ** indicated p < .05, *** indicated p < .001. Table 23 Indirect Effects of Independent Variable on Dependent Variable through Three Homework Types as Mediators for Transition Mathematics Posttest 3 Est.
from Data
Est. from Bootstrap
Bias SE Bias Corrected Confidence Interval
Total -.0452 -.0414 .0038 .0827 (-.2000, .1231) Covering -.4789 -.4739 .0050 .0794 (-.6548, -.3369) Applying -.0155 -.0107 .0048 .0278 (-.1074, .0186) Review .4492 .4432 -.0060 .1084 (.2587, .6888)
C1 -.4634 -.4632 .0002 .0719 (-.6240, -.3378) C2 -.9281 -.9171 .0110 .1679 (-1.3060, -.6360) C3 -.4647 -.4539 .0109 .1275 (-.7729, .2548)
Note: C1 = Covering the ideas – Applying the mathematics; C2 = Covering the ideas – Review; C3 = Applying the mathematics – Review.
The true indirect effect of the OTL on posttest 3 only through covering the ideas was -.02
(-.11 from IV to covering * .4.57 from covering to DV) and confidence interval ranged from
TM Posttest 3 OTL
-.1047***
Covering
Applying
Review
-.0565
-.8918***
TM Posttest 3
4.5732***
.2747
-.5037***

104
-.65 to -.34. Because 0 was not between the lower and upper limits of the bias corrected
confidence interval, homework covering the ideas had a significant, negative impact on the
relationship between teachers’ reported OTL on posttest 3 and posttest 3 achievement.
The true indirect effect of the OTL on posttest 3 only through applying the mathematics
was -.02 (-.06 from IV to applying * .27 from applying to DV) and confidence interval ranged
from -.11 to .02. Because 0 was between the lower and upper limits of the bias corrected
confidence interval, homework applying the mathematics had no significant impact on the
relationship between teachers’ reported OTL on posttest 3 and posttest 3 achievement.
The true indirect effect of the OTL on posttest 3 only through review homework was .45
(-.89 from IV to review * -.50 from review to DV) and confidence interval ranged from .26 to
.69. Because 0 was not between the lower and upper limits of the bias corrected confidence
interval, review homework was a mediator that had a positive, significant impact on the
relationship between teachers’ reported OTL on posttest 3 and posttest 3 achievement.
Table 23 also shows the comparisons of the three indirect effects for the mediators
denoted by C1, C2, and C3. C1, C2, C3 represent the effect differences between covering the
ideas and applying the mathematics, between covering the ideas and review, and between
applying the mathematics and review, respectively. Based on the estimates of the 95%
confidence interval, C1, C2 both showed the significant effect differences because the value of 0
was not in the ranges of the 95% confidence interval, but not C3. This finding occurred because
covering the ideas had a significant negative impact and review had a significant positive impact
on the relationship of teachers’ reported posttest 3 OTL and posttest 3 achievement, but applying
the mathematics had no significant indirect effect.

105
Conclusion. In this path analysis, I used a sample of 237 students. Overall, OTL on
posttest 3 as the predictor and the three mediators used in the path analysis are valid.
Approximately 64% of the variance in the TM posttest 3 was accounted for by the predictor
through these three mediators. The total indirect effect of teachers’ reported OTL on Transition
Mathematics posttest 3 on achievement measured by the same test was not significant (-.05). The
specific effects for covering the ideas, applying the mathematics, and review were -.48, -.02, and
.45, respectively. Homework covering the ideas had a significant, negative impact on the
relationship between teachers’ reported OTL on posttest 3 and posttest 3 achievement, and
review homework had a significant, positive impact. However, applying the mathematics had no
significant indirect effect. This led to the significantly different effects between covering the
ideas and applying the mathematics, covering the ideas and review, and between applying the
mathematics and review.
Algebra
Using Algebra posttest 1 achievement as dependent variable. Overall, the whole
model shows that OTL on posttest 1 as a predictor via three mediators (i.e., Covering, Applying,
and Review) in path analysis had significant impact on Algebra posttest 1, (F (5, 226) = 75.07,
p < .001.). The was .62 and adjusted was .62, indicating that 62% of variance in the
Algebra posttest 1 was accounted for by OTL on posttest 1 through the three mediators.
The total effect (i.e., direct and indirect effects) of the teachers’ reported OTL on Algebra
posttest 1 on the impact of the posttest 1 achievement (c path) was significant, t = 11.33,
p < .001. The direct effect of teachers’ reported Algebra posttest 1 OTL (cʹ′ path) to Algebra
posttest 1 achievement was significant as well, t = 8.11, p < .001. The partial effect of teachers’
reported Algebra posttest 1 OTL on Algebra posttest 1 after controlling for pretest score was

106
significant too, t = 9.42, p < .001. All the direct effects of OTL on posttest 1 achievement on the
three mediators (Covering, Applying, and Review) and of the three mediators on the posttest 1
achievement were significant at the level of at least .05. All the coefficients and significant levels
of the direct effects are presented in Figure 20.
Table 24 reports the indirect effects of the homework types on student achievement
measured by Algebra posttest 1.
Total indirect effect refers to combining indirect effects when the effects of all three
mediators are considered. Total indirect effect was -.25 ((-1.06) for covering + (-.78) for
applying + 1.59 for review). The 95% confidence interval of the total effect ranged from -.51 to
.01. Because 0 was between the lower limit and upper limit of the bias corrected confidence
interval, the total indirect effect of the teachers’ reported Algebra posttest 1 OTL through the
three mediators had no significant impact on the posttest 1 achievement.
path a path b
Figure 20. Coefficients and significance for path a and path b using teachers’ reported OTL on Algebra posttest 1 as the independent variable and Algebra posttest 1 achievement as the dependent variable. Note: * indicated p < .01, ** indicated p < .05, *** indicated p < .001.
Algebra Posttest 1 OTL
.9241***
Covering
Applying
Review
1.2944***
1.3702***
Algebra Posttest 1
-1.1422**
-.6050*
1.1627***

107
Table 24 Indirect Effects of Independent Variable on Dependent Variable through Three Homework Types as Mediators for Algebra Mathematics Posttest 1 Est.
from Data
Est. from Bootstrap
Bias SE Bias Corrected Confidence Interval
Total -.2456 -.2444 .0012 .1324 (-.5118, .0055) Covering -1.0555 -1.0463 .0093 .3851 (-1.8096, -.2975) Applying -.7831 -.7799 .0032 .4228 (-1.5931, 1.5818) Review 1.5931 1.5818 -.0113 .2563 (1.1333, 2.1439)
C1 -.2724 -.2664 .0061 .7626 (-1.7145, 1.2959) C2 -2.6486 -2.6280 .0205 .4558 (-3.5752, -1.7849) C3 -2.3762 -2.3617 .0145 .6096 (-3.6551, -1.2558)
Note: C1 = Covering the ideas – Applying the mathematics; C2 = Covering the ideas – Review; C3 = Applying the mathematics – Review.
The true indirect effect of the OTL on posttest 1 only through covering the ideas was
-1.06 (.92 from IV to covering *-1.14 from covering to DV) and confidence interval ranged from
-1.81 to -.30. Because 0 was not between the lower and upper limits of the bias corrected
confidence interval, homework covering the ideas was a mediator that had a significant negative
impact on the relationship between teachers’ reported OTL on posttest 1 and posttest 1
achievement.
The true indirect effect of the OTL on posttest 1 only through applying the mathematics
was -.78 (1.29 from IV to applying * -.61 from applying to DV) and confidence interval ranged
from -1.67 to .00. Because 0 was between the lower and upper limits of the bias corrected
confidence interval, homework applying the mathematics had no significant impact on the
relationship between teachers’ reported OTL on posttest 1 and posttest 1 achievement.
The true indirect effect of the OTL on posttest 1 only through review homework was 1.59
(1.37 from IV to review * 1.16 from review to DV) and confidence interval ranged from 1.13 to
2.14. Because 0 was not between the lower and upper limits of the bias corrected confidence

108
interval, review homework was a mediator that had a positive significant impact on the
relationship between teachers’ reported OTL on posttest 1 and posttest 1 achievement.
Table 24 also shows the comparisons of the three indirect effects for the mediators
denoted by C1, C2, and C3. C1, C2, C3 represent the effect differences between covering the
ideas and applying the mathematics, between covering the ideas and review, and between
applying the mathematics and review, respectively. Based on the estimates of the 95%
confidence interval (95% CIs in Table 24), C2 and C3, but not C1, showed the significant effect
differences because 0 was not in the ranges of the 95% confidence interval. This finding
occurred because homework covering the ideas had a significant, negative indirect effect on the
relationship between teachers’ reported posttest 1 OTL and posttest 1 achievement, and review
had a positive significant effect. But applying the mathematics did not have any significant
indirect effect.
Conclusion. In this path analysis, I used a sample of 232 students. Overall, OTL on
posttest 1 as the predictor and the three mediators used in the path analysis are valid.
Approximately 62% of the variance in the Algebra posttest 1 was accounted for by the predictor
through these three mediators. The total indirect effect of teachers’ reported OTL on Algebra
posttest 1 on achievement measured by the same test was statistically insignificant (-.25). The
specific effects for covering the ideas, applying the mathematics, and review were -1.06, -.78,
and 1.59, respectively. Homework covering the ideas had a negative, significant impact on the
relationship between teachers’ reported OTL on posttest 1 and posttest 1 achievement, and
review had a positive, significant impact. However, applying the mathematics did not have any
significant impact. This led to the significantly different effect between covering the ideas and
review and between applying the mathematics and review.

109
Using Algebra posttest 2 achievement as dependent variable. Overall, the whole
model shows that OTL on posttest 2 as a predictor via three mediators (i.e., Covering, Applying,
and Review) in path analysis had significant impact on Algebra posttest 2, (F (df1, df2) = 45.79,
p < .001.). The was .50 and adjusted was .49, indicating that 49% of variance in the
Algebra posttest 2 was accounted for by OTL on posttest 2 through the three mediators.
The total effect (i.e., direct and indirect effects) of the teachers’ reported OTL on Algebra
posttest 2 on the impact of the posttest 2 achievement (c path) was significant, t = 5.39,
p < 0.001. The direct effect of teachers’ reported Algebra posttest 2 OTL (cʹ′ path) to Algebra
posttest 2 achievement was significant as well, t = 4.99, p < 0.001. The partial effect of teachers’
reported Algebra posttest 2 OTL on Algebra posttest 2 after controlling for pretest score was
significant too, t = 9.29, p < .001. All the direct effects of OTL on posttest 2 achievement on the
three mediators (Covering, Applying, and Review) and of the three mediators on the posttest 2
achievement were significant at the level of at least .05. All the coefficients and significant levels
of the direct effects are presented in Figure 21.
Table 25 reports the indirect effects of the homework types on student achievement
measured by Algebra posttest 2.
Total indirect effect refers to combining indirect effects when the effects of all three
mediators are considered. Total indirect effect was -.40 ((-1.49) for covering + (-1.27) for
applying + 2.37 for review). The 95% confidence interval of the total effect ranged from -.78 to
-.00. Because 0 was not between the lower limit and upper limit of the bias corrected confidence
interval, the total indirect effect of the teachers’ reported Algebra posttest 2 OTL through the
three mediators had a negative, significant impact on the posttest 2 achievement.

110
path a path b
Figure 21. Coefficients and significance for path a and path b using teachers’ reported OTL on Algebra posttest 2 as the independent variable and Algebra posttest 2 achievement as the dependent variable. Note: * indicated p < .01, ** indicated p < .05, *** indicated p < .001. Table 25 Indirect Effects of Independent Variable on Dependent Variable through Three Homework Types as Mediators for Algebra Posttest 2 Est.
from Data
Est. from Bootstrap
Bias SE Bias Corrected Confidence Interval
Total -.3955 -.4018 -.0062 .1962 (-.7803, -.0046) Covering -1.4862 -1.4673 .0189 .5922 (-2.8239, -.4370) Applying -1.2745 -1.2890 -.0145 .5563 (-2.5145, -.3043) Review 2.3653 2.3546 -.0107 .4981 (1.4910, 3.4394)
C1 -.2117 -.1783 .0334 .9661 (-2.1797, 1.6741) C2 -3.8515 -3.8219 .0296 .9279 (-5.8868, -2.2202) C3 -3.6398 -3.6436 -.0038 .9446 (-5.7251, -2.0274)
Note: C1 = Covering the ideas – Applying the mathematics; C2 = Covering the ideas – Review; C3 = Applying the mathematics – Review.
The true indirect effect of the OTL on posttest 2 only through covering the ideas was
-1.49 (1.19 from IV to covering *-1.24 from covering to DV) and confidence interval ranged
from -2.82 to -.44. Because 0 was not between the lower and upper limits of the bias corrected
confidence interval, homework covering the ideas was a mediator that had a negative, significant
Algebra Posttest 2 OTL
1.1949***
Covering
Applying
Review
1.5414***
1.4066***
Algebra Posttest 2
-1.2438**
-.8269*
1.6815***

111
impact on the relationship between teachers’ reported OTL on posttest 2 and posttest 2
achievement.
The true indirect effect of the OTL on posttest 2 only through applying the mathematics
was -1.27 (1.54 from IV to applying * -.83 from applying to DV) and confidence interval ranged
from -2.52 to -.30. Because 0 was not between the lower and upper limits of the bias corrected
confidence interval, homework applying the mathematics had a negative, significant impact on
the relationship between teachers’ reported OTL on posttest 2 and posttest 2 achievement.
The true indirect effect of the OTL on posttest 2 only through review homework was 2.37
(1.41 from IV to review * 1.68 from review to DV) and confidence interval ranged from 1.49 to
3.44. Because 0 was not between the lower and upper limits of the bias corrected confidence
interval, review homework was a mediator that had a positive significant impact on the
relationship between teachers’ reported OTL on posttest 2 and posttest 2 achievement.
Table 25 also shows the comparisons of the three indirect effects for the mediators
denoted by C1, C2, and C3. C1, C2, C3 represent the effect differences between covering the
ideas and applying the mathematics, between covering the ideas and review, and between
applying the mathematics and review, respectively. Based on the estimates of the 95%
confidence interval, C2 and C3, but not C1, showed significant effect differences because 0 was
not in the ranges of the 95% confidence interval. This finding occurred because the effect of
homework covering the ideas and applying the mathematics were negative and significant on the
impact of teachers’ reported posttest 2 OTL on posttest 2 achievement, however, review had a
positive, significant impact.
Conclusion. In this path analysis, I used a sample of 232 students. Overall, OTL on
posttest 2 as the predictor and the three mediators used in the path analysis are valid.

112
Approximately 49% of the variance in the Algebra posttest 2 was accounted for by the predictor
through these three mediators. The total indirect effect of teachers’ reported OTL on Algebra
posttest 2 on achievement measured by the same test was negative and statistically significant
(-.40). The specific effects for covering the ideas, applying the mathematics, and review were
-1.49, -1.27, and 2.37, respectively. Homework covering the ideas and applying the mathematics
had negative, significant impacts on the relationship between teachers’ reported OTL on posttest
2 and posttest 2 achievement, and review had a positive, significant impact. This led to the
significantly different effects between covering the ideas and review and between applying the
mathematics and review.
Using Algebra posttest 3 achievement as dependent variable. Overall, the whole
model shows that OTL on posttest 3 as a predictor via three mediators (i.e., Covering, Applying,
and Review) in path analysis had significant impact on Algebra posttest 3, (F (5, 226) = 89.82,
p < .001.). The was .67 and adjusted was .66, indicating that 66% of variance in the
Algebra posttest 3 was accounted for by OTL on posttest 3 through the three mediators.
The total effect (i.e., direct and indirect effects) of the teachers’ reported OTL on Algebra
posttest 3 on the impact of the posttest 3 achievement (c path) was significant, t = 11.96,
p < .001. The direct effect of teachers’ reported Algebra posttest 3 OTL (cʹ′ path) to Algebra
posttest 3 achievement was significant as well, t = 9.51, p < .001. The partial effect of teachers’
reported Algebra posttest 3 OTL on Algebra posttest 3 achievement after controlling for pretest
score was significant too, t = 11.56, p < .001. All the direct effects of OTL on posttest 3
achievement on the three mediators (Covering, Applying, and Review) were significant at the
level of at least .001. Homework covering the ideas and review had significant impact on the
Algebra posttest 3 achievement at the level of at least .001, however, homework applying the

113
mathematics did not have any significant effect. All the coefficients and significant levels of the
direct effects are presented in Figure 22.
path a path b
Figure 22. Coefficients and significance for path a and path b using teachers’ reported OTL on Algebra posttest 3 as the independent variable and Algebra posttest 3 achievement as the dependent variable. Note: * indicated p < .01, ** indicated p < .05, *** indicated p < .001.
Table 27 reports the indirect effects of the homework types on student achievement
measured by Algebra posttest 3.
Total indirect effect refers to combining indirect effects when the effects of all three
mediators are considered. Total indirect effect was -.04 ((-.83) for covering + .13 for applying +
.66 for review). The 95% confidence interval of the total effect ranged from -.16 to .08. Because
0 was between the lower limit and upper limit of the bias corrected confidence interval, the total
indirect effect of the teachers’ reported Algebra posttest 3 OTL through the three mediators had
no significant impact on the posttest 3 achievement.
.5967***
Covering
Applying
Review
.7834***
.8331***
-1.3849***
.1668
.7918***
Algebra Posttest 3 OTL
Algebra Posttest 3

114
Table 27 Indirect Effects of Independent Variable on Dependent Variable through Three Homework Types as Mediators for Algebra Posttest 3 Est.
from Data
Est. from Bootstrap
Bias SE Bias Corrected Confidence Interval
Total -.0361 -.0357 .0004 .0617 (-.1573, .0846) Covering -.8264 -.8226 .0038 .2559 (-1.3472, .6220) Applying .1306 .1267 -.0040 .2553 (-.3698, .6220) Review .6596 .6602 .0007 .1501 (.4001, .9998)
C1 -.9570 -.9493 .0077 .4864 (-1.9281, -.0314) C2 -1.4860 -1.4829 .0031 .3060 (-2.1317, -.9266) C3 -.5289 -.5336 -.0046 .3544 (-1.2600, .1267)
Note: C1 = Covering the ideas – Applying the mathematics; C2 = Covering the ideas – Review; C3 = Applying the mathematics – Review.
The true indirect effect of the OTL on posttest 3 only through covering the ideas was -.83
(.60 from IV to covering *-1.38 from covering to DV) and confidence interval ranged from -1.35
to -.62. Because 0 was between the lower and upper limits of the bias corrected confidence
interval, homework covering the ideas was a not mediator that had significant impact on the
relationship between teachers’ reported OTL on posttest 3 and posttest 3 achievement.
The true indirect effect of the OTL on posttest 3 only through applying the mathematics
was .13 (.78 from IV to applying * .17 from applying to DV) and confidence interval ranged
from -.37 to .62. Because 0 was between the lower and upper limits of the bias corrected
confidence interval, homework applying the mathematics had no significant impact on the
relationship between teachers’ reported OTL on posttest 3 and posttest 3 achievement.
The true indirect effect of the OTL on posttest 1 only through review homework was .66
(.83 from IV to review * .79 from review to DV) and confidence interval ranged from .40 to
1.00. Because 0 was not between the lower and upper limits of the bias corrected confidence
interval, review homework was a mediator that had a positive significant impact on the
relationship between teachers’ reported OTL on posttest 3 and posttest 3 achievement.

115
Table 26 also shows the comparisons of the three indirect effects for the mediators
denoted by C1, C2, and C3. C1, C2, C3 represent the effect differences between covering the
ideas and applying the mathematics, between covering the ideas and review, and between
applying the mathematics and review, respectively. Based on the estimates of the 95%
confidence interval, C1 and C2, but not C3, showed the significant effect differences because the
value of 0 was not in the ranges of the 95% confidence interval. This finding occurred because d
review homework had a positive significant effect on the relationship between teachers’ reported
posttest 3 OTL and posttest 3 achievement. But applying the mathematics and review homework
did not have any significant indirect effect.
Conclusion. In this path analysis, I used a sample of 232 students. Overall, OTL on
posttest 3 as the predictor and the three mediators used in the path analysis are valid.
Approximately 66% of the variance in the Algebra posttest 3 was accounted for by the predictor
through these three mediators. The total indirect effect of teachers’ reported OTL on Algebra
Mathematics posttest 3 on achievement measured by the same test was negative and statistically
insignificant (-.04). The specific effects for covering the ideas, applying the mathematics, and
review were -.83, .13, and .66, respectively. Review homework had a positive, significant
impact. However, applying the mathematics and review did not have any significant impact. This
led to the significantly different effect between covering the ideas and review and between
applying the mathematics and review.
General Conclusion
The results for the true and estimated effects using teachers’ reported OTL on posttests to
measure OTL are reported in Table 27 and Table 28.

116
Table 27 True Indirect Effect for Posttest OTL Covering the
ideas Applying the mathematics
Review Total
PTMOTLLCàPTMPT1 .2562* .3056* -.3699* .1919* PTMOTLLCàPTMPT2 .1235 .2019* -.1034* .2220* PTMOTLLCàPTMPT3 .4844* -.1352 -.0213 .3279* TMOTLLCàTMPT1 .5592* .5942 -.7065* .4469 TMOTLLCàTMPT2 .1834* -.0591 -.0098 .1145 TMOTLLCàTMPT3 -.4789* -.0155 .4492* -.0452 AOTLLCàAPT1 -1.0555* -.7831 1.5931* -.2456 AOTLLCàAPT2 -1.4862* -1.2745* 2.3653* -.3955* AOTLLCàAPT3 -.8264* .1306 .6596* -.0361 Note: *indicates the bias corrected confidence interval does not contain zero, hence the effect is statistically significant. Table 28 Estimated Indirect Effect for Posttest OTL Covering the
ideas Applying the mathematics
Review Total
PTMOTLLCàPTMPT1 .2565* .3031* -.3691* .1905* PTMOTLLCàPTMPT2 .1247 .2013* -.1036* .2223* PTMOTLLCàPTMPT3 .4875* -.1409 .0205 .3260* TMOTLLCàTMPT1 .5546* .5805 -.6995* .4356 TMOTLLCàTMPT2 .1688* -.0553 .0053 .1187 TMOTLLCàTMPT3 -.4739* -.0107 .4432* -.0414 AOTLLCàAPT1 -1.0463* -.7799 1.5818* -.2444 AOTLLCàAPT2 -1.4673* -1.2890* 2.3546* -.4018* AOTLLCàAPT3 -.8226* .1267 .6602* -.0357 Note: *indicates the bias corrected confidence interval does not contain zero, hence the effect is statistically significant.
Conclusion from Mediation Effects of Types of Homework (Research Question 4)
The final research question focuses on relationships leading to the mediation effects:
What can I conclude from the difference of mediation effects of types of homework on the
correlation of opportunity to learn measured by lesson coverage and mathematics achievement
and on the correlation of teachers’ reported opportunity to learn on posttests and mathematics
achievement?

117
The results of the true and estimated indirect effects of the three types of homework on
the correlation between OTL measured by lesson coverage and student mathematics achievement
measured by 3 posttests, respectively, are summarized in Table 29, Table 30, and Table 31.
Significant indirect effect indicates mediating effect of the type of homework.
Table 29
Covering the Ideas Homework Type Indirect Effect Results Posttests Est. IE from
Data using OTL LC
Est. IE from Bootstrapping using OTL LC
Est. IE from Data using Posttest OTL
Est. IE from Bootstrapping using Posttest OTL
PTM Posttest 1
.0147 .0146 .2562* .2565*
PTM Posttest 2
.0136 .0136 .1235 .1247
PTM Posttest 3
.0218 .0214 .4844* .4875*
TM Posttest 1
.4166* .4164* .5592* .5546*
TM Posttest 2
.3982* .4011* .1834* .1688*
TM Posttest 3
.3600* .3605* -.4789* -.4739*
Algebra Posttest 1
-.6771* -.6742* -1.0555* -1.0463*
Algebra Posttest 2
-.7482* -.7464* -1.4862* -1.4673*
Algebra Posttest 3
-.7919* -.7938* -.8264* -.8226*
Note: *indicates the bias corrected confidence interval does not contain zero, hence the effect is statistically significant.
The estimated indirect effects (IE) were calculated to validate the true indirect effect
within the bias corrected confidence interval. Therefore, it is not surprising that there is not much
difference between each true IE and estimated IE in each model. For homework covering the
ideas, all indirect effects are significant except when investigating its indirect effects on the
influence of teachers’ reported OTL on PTM posttest 2 on student mathematics achievement
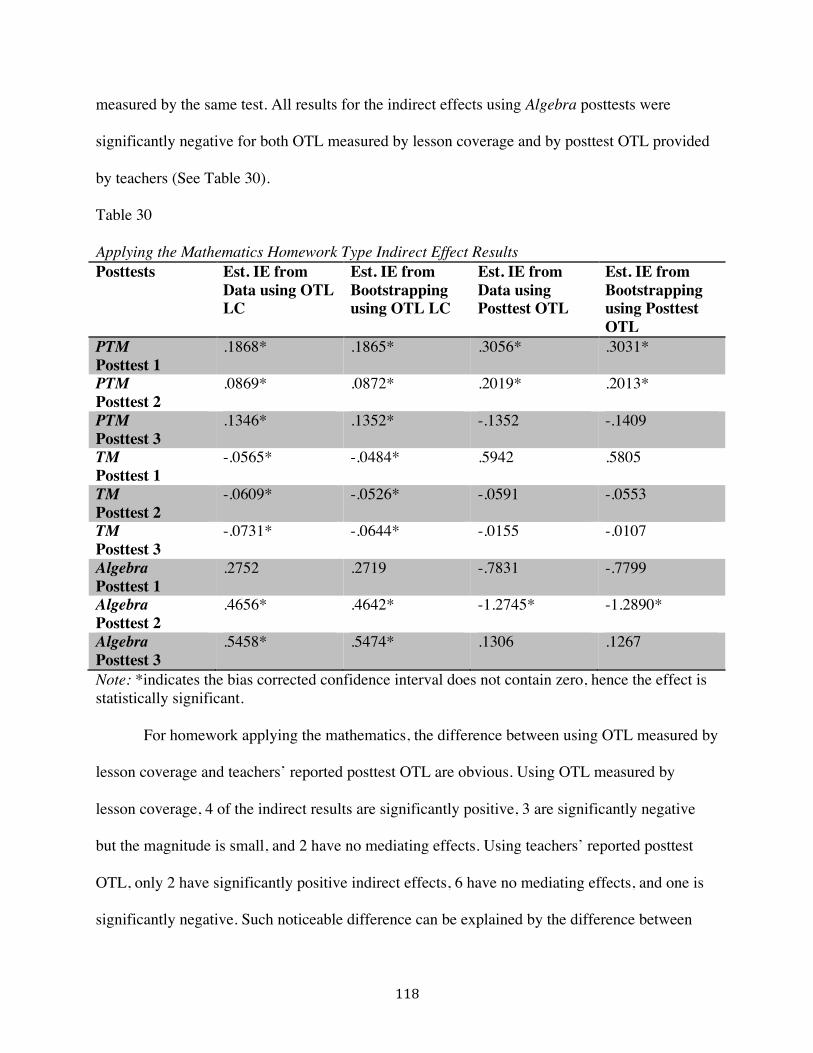
118
measured by the same test. All results for the indirect effects using Algebra posttests were
significantly negative for both OTL measured by lesson coverage and by posttest OTL provided
by teachers (See Table 30).
Table 30
Applying the Mathematics Homework Type Indirect Effect Results Posttests Est. IE from
Data using OTL LC
Est. IE from Bootstrapping using OTL LC
Est. IE from Data using Posttest OTL
Est. IE from Bootstrapping using Posttest OTL
PTM Posttest 1
.1868* .1865* .3056* .3031*
PTM Posttest 2
.0869* .0872* .2019* .2013*
PTM Posttest 3
.1346* .1352* -.1352 -.1409
TM Posttest 1
-.0565* -.0484* .5942 .5805
TM Posttest 2
-.0609* -.0526* -.0591 -.0553
TM Posttest 3
-.0731* -.0644* -.0155 -.0107
Algebra Posttest 1
.2752 .2719 -.7831 -.7799
Algebra Posttest 2
.4656* .4642* -1.2745* -1.2890*
Algebra Posttest 3
.5458* .5474* .1306 .1267
Note: *indicates the bias corrected confidence interval does not contain zero, hence the effect is statistically significant.
For homework applying the mathematics, the difference between using OTL measured by
lesson coverage and teachers’ reported posttest OTL are obvious. Using OTL measured by
lesson coverage, 4 of the indirect results are significantly positive, 3 are significantly negative
but the magnitude is small, and 2 have no mediating effects. Using teachers’ reported posttest
OTL, only 2 have significantly positive indirect effects, 6 have no mediating effects, and one is
significantly negative. Such noticeable difference can be explained by the difference between

119
what was covered in teachers’ lesson coverage and teachers’ perceived posttest opportunity to
learn. Because of the nature of this type of homework, students are required to extend their
knowledge of the mathematics concepts to situations other than what was covered in the lessons
(See Table 31).
Table 31
Review Homework Type Indirect Effect Results Posttests Est. IE from
Data using OTL LC
Est. IE from Bootstrapping using OTL LC
Est. IE from Data using Posttest OTL
Est. IE from Bootstrapping using Posttest OTL
PTM Posttest 1
-.1036* -.1045* -.3699* -.3691*
PTM Posttest 2
-.0341 -.0350 -.1034* -.1036*
PTM Posttest 3
-.0190 -.0200 -.0213 -.0205
TM Posttest 1
-.0301 -.0322 -.7065* -.6995*
TM Posttest 2
-.0213 -.0249 -.0098 -.0053
TM Posttest 3
.0371 .0342 .4492* .4432*
Algebra Posttest 1
.3642* .3662* 1.5931* 1.5818*
Algebra Posttest 2
.1681* .1704* 2.3653* 2.3546*
Algebra Posttest 3
.1304 .1309 .6596* .6602*
Note: *indicates the bias corrected confidence interval does not contain zero, hence the effect is statistically significant.
The review homework type overall does not have any mediating effects except for 2
Algebra posttests using OTL measured by lesson coverage as the independent variable, the
indirect effects in these two models are significantly positive. When using teachers’ reported
posttest OTL as the independent variable, 3 of the indirect effects are significantly negative, 4 of
the indirect effects are significantly positive, and 2 have no mediating effects.

120
CHAPTER 5: DISCUSSION
In this chapter, I discuss the results of the study according to the research questions
investigated: 1) How does opportunity to learn measured by lesson coverage and opportunity to
learn the content of posttest items influence mathematics achievement within different
mathematics courses? 2) To what extent do different types of homework influence the impact of
opportunity to learn mathematics measured by lesson coverage on student mathematics
achievement measured by 3 posttests in each of Pre-Transition Mathematics, Transition
Mathematics, and Algebra? 3) To what extent do different types of homework influence the
impact of opportunity to learn mathematics measured by posttest OTL (i.e., teacher perceived
opportunity to learn the content on each posttest) on student mathematics achievement measured
by each corresponding posttest in Pre-Transition Mathematics, Transition Mathematics, and
Algebra? 4) What can we conclude from the difference of mediation effects of types of
homework on the correlation of opportunity to learn measured by lesson coverage and
mathematics achievement and on the correlation of opportunity to learn measured by posttest
OTL and mathematics achievement? The discussions in this chapter include the limitations to the
study, findings, implications of the findings, and future research directions.
Findings
Findings from Opportunity to Learn Measured by Lesson Coverage, Questions Assigned,
and Opportunity to Learn Content on Posttest Items
Pre-Transition Mathematics. Thirteen teachers participated in the Pre-Transition
Mathematics study. The OTL measured by lesson coverage ranged from 41% to 90%. OTL

121
percentages measured by opportunity to learn the content on the posttest items had less
variability among teachers, with reported coverage of the content on the two multiple-choice
posttests ranging from 75% to 100% for TerraNova CAT 17, 75% to 100% for the UC Posttest,
and from 81% to 100% on the problem-solving posttest.
Pre-Transition Mathematics teachers assigned between 60% and 100% (median = 95%)
of the covering the ideas homework problems and 57% to 100% (median = 84%) of the applying
the mathematics problems, but only 32% to 97% (median = 55%) of the review problems. So,
there was noticeable variability in the nature of the types of homework problems assigned across
the teachers in the PTM study with the percent of review homework assigned considerably lower
than the percent of covering the ideas or applying the mathematics. Teachers seemed to place the
most emphasis on covering the ideas homework as a supplement to classroom instruction, and
not so much on review homework.
Transition Mathematics. For Transition Mathematics, 7 teachers participated in the
study. The OTL measured by lesson coverage ranged between 56% and 92% (median = 80%).
Similar to the findings from Pre-Transition Mathematics, OTL percentages measured by
opportunity to learn the content on the posttests had considerable variability among teachers with
reported coverage of the content on the two multiple choice posttests ranging from 70% to 92%
for IAAT and 55% to 100% for the Algebra/Geometry Readiness Test but only 41% to 76% for
the problem-solving test
For homework assigned by Transition Mathematics teachers, consistent with the findings
from Pre-Transition Mathematics, percent of review homework was typically the lowest for
teachers. Although 1 teacher assigned 91% of the review problems, another teacher assigned
only 27% of these problems. However, the percent of covering the ideas and applying the
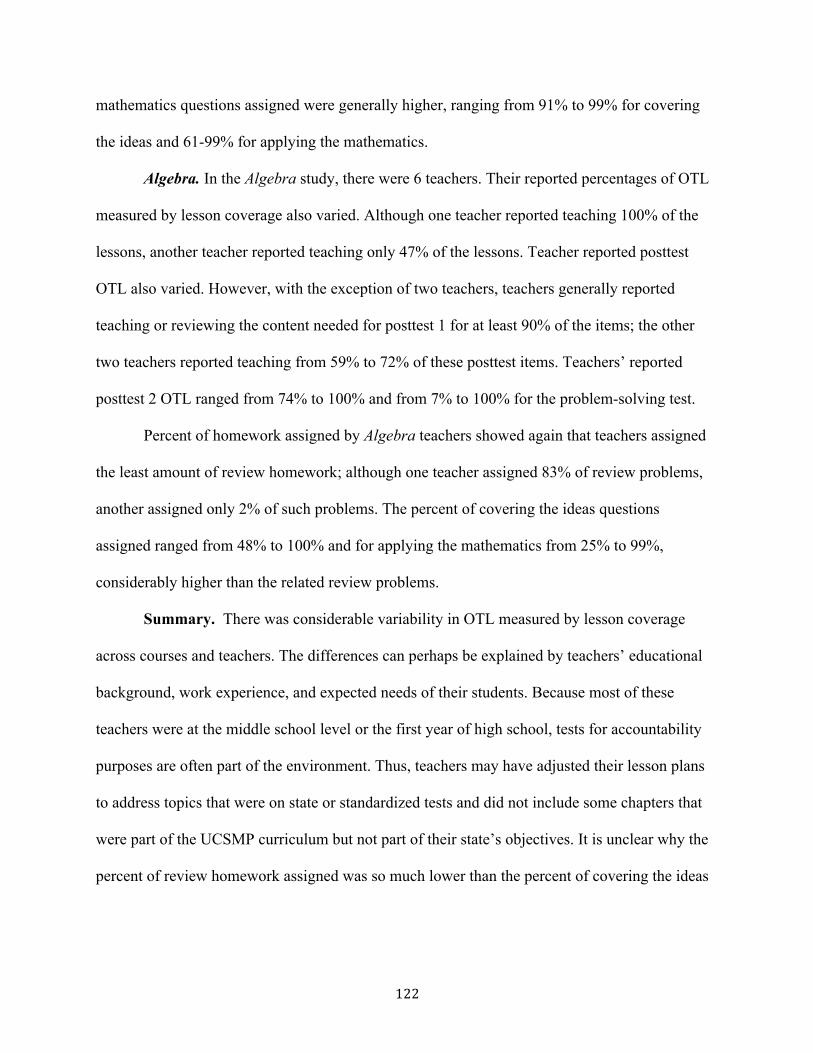
122
mathematics questions assigned were generally higher, ranging from 91% to 99% for covering
the ideas and 61-99% for applying the mathematics.
Algebra. In the Algebra study, there were 6 teachers. Their reported percentages of OTL
measured by lesson coverage also varied. Although one teacher reported teaching 100% of the
lessons, another teacher reported teaching only 47% of the lessons. Teacher reported posttest
OTL also varied. However, with the exception of two teachers, teachers generally reported
teaching or reviewing the content needed for posttest 1 for at least 90% of the items; the other
two teachers reported teaching from 59% to 72% of these posttest items. Teachers’ reported
posttest 2 OTL ranged from 74% to 100% and from 7% to 100% for the problem-solving test.
Percent of homework assigned by Algebra teachers showed again that teachers assigned
the least amount of review homework; although one teacher assigned 83% of review problems,
another assigned only 2% of such problems. The percent of covering the ideas questions
assigned ranged from 48% to 100% and for applying the mathematics from 25% to 99%,
considerably higher than the related review problems.
Summary. There was considerable variability in OTL measured by lesson coverage
across courses and teachers. The differences can perhaps be explained by teachers’ educational
background, work experience, and expected needs of their students. Because most of these
teachers were at the middle school level or the first year of high school, tests for accountability
purposes are often part of the environment. Thus, teachers may have adjusted their lesson plans
to address topics that were on state or standardized tests and did not include some chapters that
were part of the UCSMP curriculum but not part of their state’s objectives. It is unclear why the
percent of review homework assigned was so much lower than the percent of covering the ideas

123
or applying the mathematics homework assigned. It suggests that teachers may not have
understood the importance of review within the UCSMP philosophy.
Findings from Impact of OTL Measured by Lesson Coverage on Achievement
The three regression models using OTL measured by lesson coverage as the independent
variable and achievement on three PTM posttests as dependent variables and standardized pretest
scores as the covariates showed statistical significance (p < .001). Likewise, when using
achievement on three TM posttests as dependent variables, OTL as measured by lesson coverage
as the independent variable, and standardized pretest scores as the covariates, all three regression
models showed statistical significance (p < .001). In addition, when using achievement on three
Algebra posttests as dependent variables, OTL measured by lesson coverage as the independent
variable, and standardized pretest scores as covariates, all three regression models also showed
significant impact on Algebra posttest achievement (p < .001). In summary, the findings from the
9 regression models showed opportunity to learn measured by lesson coverage had significant
impact on students’ mathematics achievement across courses. These findings are consistent with
research findings in the literature that OTL has a significant impact on student mathematics
achievement (Floden, 2002; Stein at al., 1996; Stevens, 1993).
Findings from Impact of Teachers’ Reported Posttest OTL on Achievement
When using teachers’ reported opportunity to learn the content on 3 posttests as the
independent variables and students’ mathematics achievement as the dependent variables with
standardized pretest scores as covariates, all regression models showed statistical significance for
Pre-Transition Mathematics (p < .001). For Transition Mathematics, teachers’ reported OTL on
3 posttests as the independent variables with standardized pretest scores as covariates and
students’ mathematics achievement as dependent variables also showed significant impact on

124
posttest achievement in all three regression models (p < .001). The impact of teachers’ reported
posttest OTL as the independent variable with standardized pretest scores as covariates was also
significant on Algebra posttest achievement in all three regression models (p < .001). Therefore,
teachers’ reported posttest OTL significantly predicted student mathematics achievement for all
three courses. These findings agreed with Husén’s (1967) finding that opportunity to learn the
content assessed ultimately influences achievement.
Findings from Investigating the Extent to Which Types of Homework Impact OTL
Measured by Lesson Coverage on Achievement
When examining the extent to which types of homework impact OTL measured by lesson
coverage on achievement, homework covering the ideas had no significant effect on the
relationship of OTL measured by lesson coverage and all 3 PTM posttests, positive mediating
effects on the relationship of OTL measured by lesson coverage and all 3 TM posttests, and had
significant, negative mediating effects on OTL measured by lesson coverage on all 3 Algebra
posttests.
Homework applying the mathematics showed significant, positive mediating effects on
OTL measured by lesson coverage on achievement for all three PTM posttests and for Algebra
posttests 2 and 3; however, such homework showed significant and negative mediating effect on
the impact of OTL measured by lesson coverage on achievement for all 3 TM posttests, and
showed no significant effect on the impact of OTL by lesson coverage on Algebra posttest 1
achievement.
Review homework, in contrast, showed no significant effects on achievement for 6 of the
posttests, and only showed significant, positive mediating effect on achievement for Algebra
posttests 1 and 2, and negative and significant effect on achievement for PTM posttest 1.

125
The finding for review homework was consistent with the findings from data collection
prior to the analyses where I found review homework was the least assigned homework by the
teachers. This type of homework that was barely assigned had almost no significant mediating
effects when controlling for the other two types of homework. Although homework covering the
ideas was the most assigned homework type, it had no effect on the impact of OTL measured by
lesson coverage on students’ PTM posttest achievement, positive significant effect on TM
posttest achievement, and negative significant effect on Algebra posttest achievement. Applying
the mathematics, although not the most assigned, had the most significant, positive impact on
achievement (for 5 out of 9 posttests). The negative mediating effects of review homework for
Algebra could be explained by the fact that Algebra teachers had the least lesson coverage
compared to teachers using UCSMP PTM and TM curricula. The differences in mediating effects
may be due to the extent to which the items on the posttests are reflective of the types of
questions in the covering and applying exercises, but verifying the similarities and differences
was beyond the scope of this study. Covering the ideas questions focus on basic ideas in the
lesson while applying the ideas extend such ideas; the Director of Evaluation for UCSMP
suspects that the test items are more like applying questions than covering questions, but that
suspicion has not been independently verified.
Findings from Investigating the Extent to Which Types of Homework Impact Teachers’
Reported Posttest OTL on Achievement
When examining the extent to which types of homework impact teachers’ reported
posttest OTL on students’ posttest achievement, the findings for all homework types showed
inconsistencies across the three mathematics courses. Homework covering the ideas showed 4
significant, positive mediating effects in 4 of the regression models, 4 significant, negative

126
mediating effects in 4 of the regression models, and showed no significance in 1 model.
Homework applying the mathematics showed no significance in 5 of the models, showed
significant, positive mediating effects in 3 models, and showed significant, negative mediating
effect in 1 model. Review homework showed significant, positive mediating effects in 4 of the
models, showed significant, negative mediating effects in 3 models, and showed no significant
effect in 1 model.
The inconsistency in the mediating effects investigated using teachers’ reported posttest
OTL might be explained by a few things. First, teachers’ reported posttest OTL as an
independent variable was teachers’ perceived coverage of posttest items. Yet in the UCSMP TM
evaluation report’s discussion, mention was made that teachers might have adjusted the curricula
and supplemented with other materials addressing topics related closely to those on the state or
standardized tests their students were required to take (Thompson, Senk, & Yu, 2012). Second,
there were no available data on the completion of different types of homework by students. So
there was no way of knowing if students benefited from the homework assignments. Third, there
was no examination of how relative the posttest items were to the homework problems of the
three types in the UCSMP curricula.
Conclusion
Overall, the findings showed that OTL measured by lesson coverage and by teachers’
reported posttest OTL have significant impact. However, each type of homework as a mediator
might have significant, positive or negative mediating effects or no mediating effects at all. The
findings from having OTL measured by lesson coverage as the independent variable were more
consistent within each mathematics course.

127
The differences of the mediating effects of types of homework on the impact of OTL
measured by lesson coverage on student mathematics achievement and on the impact of
teachers’ reported posttest OTL on students’ mathematics achievement may also be explained
through the nature of the types of homework. Covering the ideas appeared to be the most
assigned type of homework in each mathematics course by teachers. However, students were
required to extend their knowledge beyond basic ideas covered on homework problems that
apply the mathematics. Teachers in the field study might not think homework applying the
mathematics and review were relevant to standardized testing. Teachers may also not have
understood the perceived importance of the review problems in providing students with
opportunities to master the content in accord with the philosophy of the UCSMP materials, hence
resulting in the lowest percent of assignment of review homework in each course.
The negative effects in the results represent the extent to which the types of the
homework reduce the impact of OTL on student mathematics achievement. This might be
because there were different levels of student participants in the study in each mathematics
course. Although all UCSMP courses were often used at multiple grades, the core audience for
each course was students who were on grade level for the course’s target grade. Advanced
students often completed a course at an earlier grade than the target grade; likewise, students
who were behind grade level often completed the course at a later grade than the target grade.
For example, for PTM the target was 6th graders; so, 7th graders taking PTM were often weaker
than the 6th graders. Teachers might tend to assign more homework for the weaker students.
Similarly, for TM, there were advanced 6th graders taking this course and their mathematics skills
were much stronger than the 7th graders. So teachers tend to assign less homework because they
may perceive their advanced students do not need the extra supplement. These situations might

128
have influenced teachers’ decisions on the amount of different types of homework assigned to
these students and resulted in the negative effects.
Limitations
The variables measuring OTL by lesson coverage and by opportunity to learn the content
of posttest items were both based on teachers’ reported data from chapter evaluation forms.
There is no guarantee that teachers accurately filled out the actual coverage of the lessons and of
the posttest items. As mentioned in the UCSMP evaluation report for Transition Mathematics,
for example, teachers tend to make adjustments to their lesson plans not just according to the
UCSMP curriculum but also because of test preparation pressure; as a result, they may choose to
supplement their lessons with other curriculum that they are more familiar with or more aligned
with test standards (Thompson, Senk, & Yu, 2012). For instance, teachers sometimes used
supplementary materials for class instruction or for homework, but such assignments would not
have been reflected in the percent used in the regression models.
Teacher demographics were not included as one of the independent variables, but
teachers’ characteristics might affect their decision-making in assigning types of homework as
well as providing OTL according to the UCSMP curricula. It could also be that their decisions
were affected by their own backgrounds, their perceptions of their students’ abilities, as well as
overall school expectations on the amount of homework students do, as mentioned in the
conclusions from the findings. It is also not clear how prior experience with a UCSMP
curriculum, particularly with Transition Mathematics or Algebra, might have influenced
decisions on lesson coverage or homework assigned.
The variables used to measure the amount of types of homework assigned by teachers
were developed from homework assignments reported by teachers on chapter evaluation forms.

129
It was, however, unknown if the amount of homework assigned was actually completed by
students or graded by teachers. The original dataset contains additional teacher data on
homework, such as interview responses and questionnaire data on homework expectations, and
additional student data on homework assigned measured by students’ estimates of the hours
spent in a week on homework. However, these data were not available as part of this dissertation
study.
Another issue mentioned in the UCSMP evaluation report was that the pretests and
posttests given to students were not included as part of students’ grades. So it is unclear if
students gave their best effort in completing these tests or prepared for the tests to serve the
purpose of the study. Consequently, students’ mathematics achievement in the courses may be
underestimated by their results on the posttests used in the evaluation study.
The mathematics courses included in the study were Pre-Transition Mathematics,
Transition Mathematics, and Algebra. These courses were only three courses out of seven
courses developed and field-tested by UCSMP from 2005-2008. The nature of these mathematics
courses meant they were to be studied by students of different grades, sometimes with advanced
students taking the course at an earlier grade level than intended, and with below grade level
students taking the course at a later grade than intended. Advanced students normally have
higher achievement and below grade level students have lower achievement than students who
were taking the course at grade level. However, in this study, grade level for each course was not
considered as a variable, and it was not feasible to analyze data for each course by grade level.
Thus, differences in results across courses became inevitable. Consequently, the results were not
consistent across courses, and therefore, care should be taken in making generalizations. It may

130
be that differences in the mathematics courses and the nature of students taking those courses
play a part in the differences in effects of types of homework.
Finally, OTL investigated in this study was measured by lesson coverage and teachers’
reports of whether they taught or reviewed the content of the items on the posttest. However,
there should be more dimensions to OTL, especially from students’ perspectives. Unfortunately,
such data were not available on homework types, such as which types of homework students
found the most useful or easiest to complete.
Implications
Through the findings of the study, I hope to provide teachers insight on factors to
consider when assigning homework in order to maximize students’ mathematics achievement
with opportunities to learn mathematics.
Few studies in the literature have investigated types of homework problems in relation
with OTL. Available studies have focused only on the impact of the amount of homework
problems assigned or time spent on homework on student mathematics achievement. The present
study shows that OTL has significant impact on student achievement. Most models conducted in
this study have shown that homework types have significant mediating effect on the relationship
between opportunity to learn and student mathematics achievement. These effects can be either
positive or negative. Thus, it is essential for teachers to understand the different effects of
different types of homework with respect to the mathematics courses in order to enhance student
mathematics performance. The differences among different effects of types of homework show
that sometimes assigning certain types of homework may hinder student learning.
The findings in this study might provide teachers and educators a new angle for making
homework assignment decisions and also add to the limited existing literature on homework

131
types in mathematics education. Homework types that were examined in this study are the most
common types of homework problems teachers assign in mathematics classrooms. Covering the
ideas homework was the most assigned by teachers in this study; however, such homework did
not show the most significant mediating effect. Applying the mathematics homework was less
assigned by teachers across courses in this study, and yet showed more positive mediating effect
than covering the ideas homework. This could mean that homework problems that go beyond
what students have learned in class might benefit them more in developing conceptual
understanding of the content of the curricula than homework that is too basic. The
inconsistencies of the findings prevented me from drawing definite conclusions. But the results
raise questions for teachers, educators, and policy makers beyond making decisions on what
types of homework questions to assign to students; they might consider whether to assign certain
type of homework at times if such homework type has no mediating effect or might even hinder
student achievement when it’s irrelevant to what might be tested.
The findings of the study have the potential to inform teachers and educators on how to
assign different types of homework in each mathematics course. If the mediating effect of a
particular type of homework is positive on the impact of OTL on achievement, the teacher
should assign more of this type of homework. Variables, such as how students completed the
assigned homework (i.e., independently or in groups), accuracy, and relevance to the posttests
and lessons covered, should also be taken into consideration.
Future Research
The dataset used for this study was a subset of the must larger UCSMP dataset. Therefore,
there are data in the UCSMP dataset that I did not include in the study because of availability.
However, I could have included variables by acquiring data such as students’ reported time spent

132
on homework each week to explain some of the negative mediating effects shown in the findings.
Also, teacher perspectives towards homework in the transcription of interviews with teachers or
teacher questionnaires may explain how teachers play a role in providing OTL and reasons
behind their decisions. So, future research might investigate these additional aspects of
homework and consider their potential to help explain the results of this dissertation study.
From the findings of the pilot study that was conducted on only 7th graders using
Transition Mathematics, the results were more consistent for the mediating effects of different
types of homework. In the present study, TM also included advanced 6th graders who took the
same class as the 7th graders and their achievement and OTL provided by teachers. In addition,
PTM and Algebra were included in this study to examine the indirect effects of the types of
homework across courses. There were also potential grade differences in participants using these
two curricula, because PTM included 6th graders and weaker 7th graders, and Algebra included
middle and high school students. This may suggest that potential grade differences might have
affected the consistency of the results of the analysis. Because the results might be more
consistent within each mathematics course based on from the findings in the pilot study, for
future investigation of types of homework, it would be beneficial to rerun the data after
separating different grade levels in each course.
As mentioned in the literature review, studies on homework have been mostly on the
amount of homework or duration of time students spent on homework assignment in relation
with student mathematics achievement (Cooper, 1989; Cooper et al., 2006). The present study
showed different effects of different types of homework across courses. Hence, it is necessary
that educators and teachers investigate homework types from more aspects.

133
I recommend future studies on the same topic to minimize differences among participants
by having the same group of participants beyond only controlling for their prior knowledge.
More dimensions should be included to define OTL, such as including observed or recorded data
in addition to teachers’ self-reported data. Students’ completion of different types of homework
as well as their accuracy on different types of homework may also be documented as part of the
data collection process.
My findings confirmed OTL as a good predictor of mathematics achievement and
exposed issues related to measurement of variables using self-reported data. Although the results
of mediating effects of the different types of homework were inconsistent, there is little doubt
that homework types mediate the impact of OTL on achievement as a whole. Teachers tended to
assign more covering the ideas and applying the mathematics homework and less review
homework in this study. The results became inconsistent when specific types of homework were
being examined while controlling for the other types. Through careful measurement of the exact
variables that one needs to investigate the types of homework and their effects on other
instructional factors and mathematics achievement, future research will have more detailed
understanding of the effects of homework types than was possible in this study.

134
REFERENCES
Baron, R. M., & Kenny, D. A. (1986). The moderator-mediator variable distinction in social
psychological research: Conceptual, strategic, statistical considerations. Journal of
Personality and Social Psychology, 51, 1173-1182.
Becker, H. J., & Epstein, J. L. (1982). Parent involvement: A survey of teacher practices.
Elementary School Journal, 83, 85-102.
Brookhart, S. M. (1997). Effects of classroom assessment environment on mathematics and
science achievement. Journal of Educational Research, 90, 323-330.
Bryan, T., & Nelson, C. (1994). Doing homework: Perspectives of elementary and junior high
students. Journal of Learning Disabilities, 27, 488-499.
Carroll, J. B. (1963). A model of school learning. Teachers College Record, 64, 723-733.
Cerin, E., & MacKinnon, D. P. (2009). A commentary on current practice in mediating variable
analyses in behavioral nutrition and physical activity. Public Health Nutrition, 12, 1182-
1188.
Cohen, J., Cohen, P., West, S. G., & Aiken, L. S. (2003). Applied multiple regression/correlation
analysis for the behavioral sciences. (3rd ed.). Mahwah, NJ: Erlbaum.
Cool, V. A., & Keith, T. Z. (1991). Testing a model of school learning: Direct and indirect
effects on academic achievement. Contemporary Educational Psychology, 16, 28-44.
Cooper, H. (1989). Homework. White Plains, NY: Longman.

135
Cooper, H., Lindsay, J. J., Nye, B., & Greathouse, S. (1998). Relationships among attitudes
about homework, amount of homework assigned and completed, and student
achievement. Journal of Educational Psychology, 90, 70-83.
Cooper, H., Robinson, H. J., & Patell, E. A. (2006). Does homework improve academic
achievement? A synthesis of research, 1987-2003. Review of Educational Research, 76
(1), 1-62.
Cooper, H., & Valentine, J. C. (2001). Using research to answer practical questions about
homework. Educational Psychologist, 36, 143-153.
Davis, J. E., & Jordan, W. J. (1994). The effects of school context, structure and experiences on
African American males in middle and high school. Journal of Negro Education, 63,
570-587.
Epstein, J. (1988). Sample clinical summaries: Using surveys of teachers and parents to plan
projects to improve parent involvement. (Parent involvement series, report P-83).
Baltimore: Johns Hopkins University, Center for Research on Elementary and Middle
Schools.
Fehrmann, P. G., Keith, T. Z., & Reimers, T. M. (1987). Home influence on school learning:
Direct and indirect effects of parental involvement on high school grades. Journal of
Educational Research, 80, 330-337.
Finstad, E. (1987). Effects of mathematics homework on second grade achievement. Houston,
TX: Sam Houston State University.

136
Floden, R. E. (2002). The measurement of opportunity to learn. In: A.C. Porter and A. Gamoran
(Eds.). Methodological advances in cross-national surveys of education achievement.
(pp. 231-266). Board on International Comparative Studies in Education. Washington,
DC: National Academy Press.
Foyle, H. (1990). Homework and cooperative learning: A classroom field experiment. Emporia,
KS: Emporia State University, Faculty Research and Creativity Committee. (ERIC
Document No. ED350285).
Frazier, P. A., Tix, A. P., & Barron, K. E. (2004). Testing moderator and mediator effects in
counseling psychology research. Journal of Counseling Psychology, 51 (1), 115-134.
Gill, B., & Schlossman, S. (2000). The lost cause of homework reform. American Journal of
Education, 109 (1), 27-62.
Hayes, A. F. (2009). Beyond Baron and Kenny: Statistical mediation analysis in the new
millennium. Communication Monographs, 76, 408-420.
Hayes, A. F., & Preacher, K. J. (2014). Statistical mediation analysis with a multicategorical
independent variable. British Journal of Mathematical and Statistical Psychology, 67,
451-470.
Henderson, L. (1996). Instructional design of interactive multimedia: A cultural critique.
Educational Technology Research and Development, 44 (4), 85-104.
Hendrix, V. L., Sederberg, C. H., & Miller, V. L. (1990). Correlates of commitment/alienation
among high school seniors. Journal of Research and Development in Education, 23,
129-135.

137
Henningsen, M., & Stein, M. K. (1997). Mathematical tasks and student cognition: Classroom-
based factor that support and inhibit high-level mathematical thinking and reasoning.
Journal for Research in Mathematics Education, 28 (5), 524-549.
Hill, A. T. (2003). A panel study of the effects of teacher education, class size, and time-on-task
on student achievement. (Doctoral dissertation, University of Delaware, 2003).
Dissertation Abstracts International, 64, 1017.
Husén, T. (1967) (Ed.). International study of achievement in mathematics: A comparison of
twelve countries (Vols. 1-2) Stockhomn: Almqvist & Wilksell.
Kralovee, E. & Buell, J. (2000). The end of homework: How homework disrupts families,
overburdens children, and limit learning. Boston: Beacon.
Kohn, A. (2006). The homework myth. Cambridge, MA: Da Capo.
Lam, J. W. (1996). The employment activity of Chinese-American high school student and its
relationship to academic achievement (Master’s thesis, University of Texas at Arlington,
1996). Masters Abstracts International, 34, 2148).
Lee, J. F., & Pruitt, K. W. (1979). Homework assignments: Class games or teaching tool?
Clearing House, 53, 31-35.
Loveless, T. (2003). The 2003 Brown Center Report on American education: How well are
American students learning? With sections on homework, charter schools and rural
school achievement. Washington, DC: Brookings Institute.
MacKinnon, D. P., Fairchild, A. J., & Fritz, M. S. (2007). Mediation analysis. Annual Review of
Psychology, 58, 593-614.
McGrath, J. B. (1992). Student and parental homework practices and the effects of English
homework on student test scores. Dissertation Abstracts International, 53, 10A, 3490.
138
MeLoy, L. L. (1987). Effects of homework on language arts achievement in third and fourth
grades. (Doctoral Dissertation, University of Iowa, 1987). Dissertation Abstract
International, 51, 725.
Mulhenbruck, L., Cooper, H., Nye, B., & Lindsay, J. J. (1999). Homework and achievement:
Explaining the different strengths of relation at the elementary and secondary school
levels. Social Psychology of Education, 3, 295-317.
National Council of Teachers of Mathematics. (1980). An agenda foraAction: Recommendations
for School Mathematics of the 1980s. Reston, VA: Author.
National Council of Teachers of Mathematics. (1989). Curriculum and evaluation standards for
school mathematics. Reston, VA: Author.
National Council of Teachers of Mathematics. (2000). Principles and standards for school
mathematics. Reston, VA: Author.
National Research Council. (2001). Adding it up: Helping children learn mathematics. J.
Kilpatrick, J. Swafford, & B. Findell (Eds.). Mathematics Learning Study Committee,
Center for Education, Division of Behavioral and Social Sciences and Education.
Washington, DC: National Academy Press.
O’Day, J. A., & Smith, M. S. (1993). Systemic reform and educational opportunity. In S. H.
Fuhman (Ed.). Designing coherent education policy: Improving the system. (pp. 313-
322). San Francisco: Jossey Bass.
Olson, M. (1988). Homework variables and academic achievement: An integrated study.
Dissertation Abstracts International, 49, 08A.
Omlin-Ruback, H. I. (2009). A study of mathematics homework. (Doctoral dissertation).
Retrieved from ProQuest. (2002.3040783)

139
Peng, S. S., & Wright, D. (1994). Explanation of academic achievement of Asian American
students. Journal of Educational Research, 87, 346-352.
Porter, A. C. (2004). Curriculum assessment (Additional SCALE Research Publications and
Products: Goal 1, 2, and 4). Nashville, TN: Vanderbilt University.
Portes, A., & MacLeod, D. (1996). Educational progress of children of immigrants: The roles of
class, ethnicity and school context. Sociology of Education, 69, 255-275.
Preacher, K. J., & Hayes, A. F. (2008). Asymptotic and resampling strategies for assessing and
comparing indirect effects in multiple mediator models. Behavior Research Methods, 40,
879-891.
Robitaille, D. F. & Travers, K. J. (1992). International studies of achievement in mathematics. In
D. Grouws (Ed.), Handbook of research on mathematics education (pp. 689-709). New
York: Macmillan.
Ruucker, D. D., Galinsky, A. D., & Dubois, D. (2011). Power and consumer behavior: How
power shapes who and what consumers value. Journal of Consumer Psychology, 22,
352-368.
Schmidt, W. H. & Maier, A. (2009). Opportunity to learn. In G, Sykes, B. Schneider, & D. N.
Plank (Eds), Handbook of education policy research (pp. 541-559). New York, NY:
Rutledge for American Educational Research Association.
Silver, E. & Herbst, P. (2007). The role of theory in mathematics education scholarship. In F.
Lester (Ed.), Second handbook of research in mathematics teaching and learning (pp. 39-
67). New York: Information Age.
Smith, T. E. (1990). Time and academic achievement. Journal of Youth and Adolescence, 19,
539-558.

140
Smith, T. E. (1992). Time use and change in academic achievement: A longitudinal follow up.
Journal of Youth and Adolescence, 21, 725-747.
Sobel, M. E. (1982). Asymptotic confidence intervals for indirect effects in structural equation
models. In S. Leinhardt (Ed.), Sociological methodology 1982 (pp. 290-312).
Washington DC: American Sociological Association.
Stein, M. K., & Lane, S. (1996). Instructional tasks and the development of student capacity to
think and reason: An analysis of the relationship between teaching and learning in a
reform mathematics project. Educational Research and Evaluation, 2(1), 50-80.
Silver, E. A., & Stein, M. L. (1996). The QUASAR project: The “revolution of the possible” in
mathematics instructional reform in urban middle schools. Urban Education, 30 (4),
476-521.
Stein, M. K., Grover, B. W., & Henningsen, M. (1996). Building student capacity for
mathematical thinking and reasoning: An analysis of mathematical tasks used in reform
classrooms. American Educational Research Journal, 33 (2), 455-488.
Stein, M. K., Smith, M. S., Henningsen, M., & Silver, E. A. (2000). Implementing standards-
based mathematics instruction: A casebook for professional development. New York:
Teachers College Press.
Stevens, F. I. (1993). Applying an opportunity-to-learn conceptual framework to the
investigation of the effects of teaching practices via secondary analyses of multiple-case-
study summary data. Journal of Negro Education, 62(3), 232-248.
Thomas, J. P. (2001). A model of mathematics achievement using proficiency scores. Grayslake
IL: College of Lake County (ERIC Document Reproduction Service No. ED 459 216).

141
Thomas, J. P. (2002). An examination of the relationship between learning variables and
academic achievement outcomes. Grayslake, Illinois: College of Lake County (ERIC
Document Reproduction Service No. ED 471 988).
Thompson, D. R., Senk, S. L., & Yu, Y. (2012). An evaluation of the Third Edition of the
University of Chicago School Mathematics Project: Transition Mathematics. Chicago,
IL: University of Chicago School Mathematics Project.
Townsend, S. (1995). The effects of vocabulary homework on third grade achievement.
(Master’s thesis, Kean College of New Jersey, 1995). Retrieved from ERIC. (ED379643)
Warton, P. M. (2001). The forgotten voice in homework: Views of students. Educational
Psychologist, 36, 155-165.
Wildman, P. R. (1968). Homework pressure. Peabody Journal of Education, 45, 202-204.
Winfield, L. R. (1993). Investigating test content and curriculum content overlap to assess
opportunity to learn. The Journal of Negro Education, 62(3), 288-310.
Wynn, J. L. (1996). The effects of family involvement, homework and TV time on student grade
point average. (Doctoral dissertation, Auburn University, 1996). Dissertation Abstract
International, 57, 3356.

142
APPENDIX A: PRE-TRANSITION MATHEMATICS INSTUMENTS

143
UCSMP The University of Chicago School Mathematics Project Test Number __________
ENTERING MATHEMATICS TEST
Do not open this booklet until you are told to do so. This test contains 29 questions. You have 40 minutes to take the test. 1. All questions are multiple-choice. Some questions have four choices and some have five.
There is only one correct answer to each question. 2. Using the portion of the answer sheet marked TEST 2, fill in the circle • corresponding
to your answer beginning with question 32. Be sure to use a number 2 pencil. 3. If you want to change an answer, completely erase the first answer on your answer sheet. 4. If you do not know the answer, you may guess. 5. Use the scrap paper provided to do any writing or drawing. DO NOT MAKE ANY
STRAY MARKS IN THE TEST BOOKLET OR ON THE ANSWER SHEET. 6. You may not use a calculator. DO NOT TURN THE PAGE until your teacher says that you may begin. ©2006 University of Chicago School Mathematics Project. This test may not be reproduced without the permission of UCSMP. Some of the items on this test are released items from NAEP, from TIMSS 1999, or from TIMSS 2003 and are used subject to the conditions in the release of these items.

144
32. Suppose that 3 × ( � + 5) = 30. The number in the box should be ______. F. 2 G. 5 H. 10 J. 95 33. The objects on the scale below make it balance exactly.
According to this scale, if balances , then balances which of
the following?
A.
B.
C.
D.
34. What number can be placed in the box to make the statement below true? 15 + � = 22 + 3 F. 7 G. 10 H. 34 J. 40 35. If there are 300 calories in 100 g of a certain food, how many calories are there in a 30 g
portion of this food? A. 90

145
B. 100 C. 900 D. 1000 E. 9000 36. Which of the following equals 25%? F. 0.025 G. 0.25 H. 2.5 J. 25 K. All of (F) – (J) equal 25%. 37. 3 + 15 ÷ 3 – 4 × 2 = A. -9 B. -2 C. 0 D. 4 E. 5
38. =+43
32
F. 21
G. 75
H. 1251
J. 2
K. 412
39. How many yards equals 39 feet?
A. 143

146
B. 13 C. 117 D. 468 E. 1404
40. Which letter represents 35
on the number line?
F. point A G. point B H. point C J. point D K. point E 41. -3 + 7 + -8 = A. -18 B. -12 C. -4 D. 2 E. 4 42. Each square on the grid at the right represents 1 square unit. Find the area of figure PIGS. F. 3 square units G. 6 square units H. 7 square units J. 10 square units K. 12 square units
43. Jim has 43 of a yard of string which he wishes to divide into pieces, each
81 of a yard long.
How many pieces will he have? A. 3 B. 4
P I
G S

147
C. 6 D. 8 44. Which of these is the smallest number? F. 0.625 G. 0.25 H. 0.375 J. 0.5 K. 0.125 45. A rectangle has length of 3.6 cm and width of 5 cm. Which numerical expression
gives the perimeter of the rectangle? A. 3.6 + 5
B. 2(3.6 + 5) C. 3.6 × 5 D. 2(3.6 × 5) E. 3.6 × 5 × 3.6 × 5
46. Of the following, which is the closest approximation to a 15 percent tip on a restaurant
check of $24.99? F. $2.50 G. $3.00 H. $3.75 J. $4.50 K. $5.00 47. The total weight of a pile of 500 salt crystals is 6.5 g. What is the average weight of a salt
crystal?
A. 0.0078 g
B. 0.013 g
C. 0.0325 g
D. 0.078 g
48. If 311 cups of flour are needed for a batch of cookies, how many cups of flour will be
needed for 3 batches?
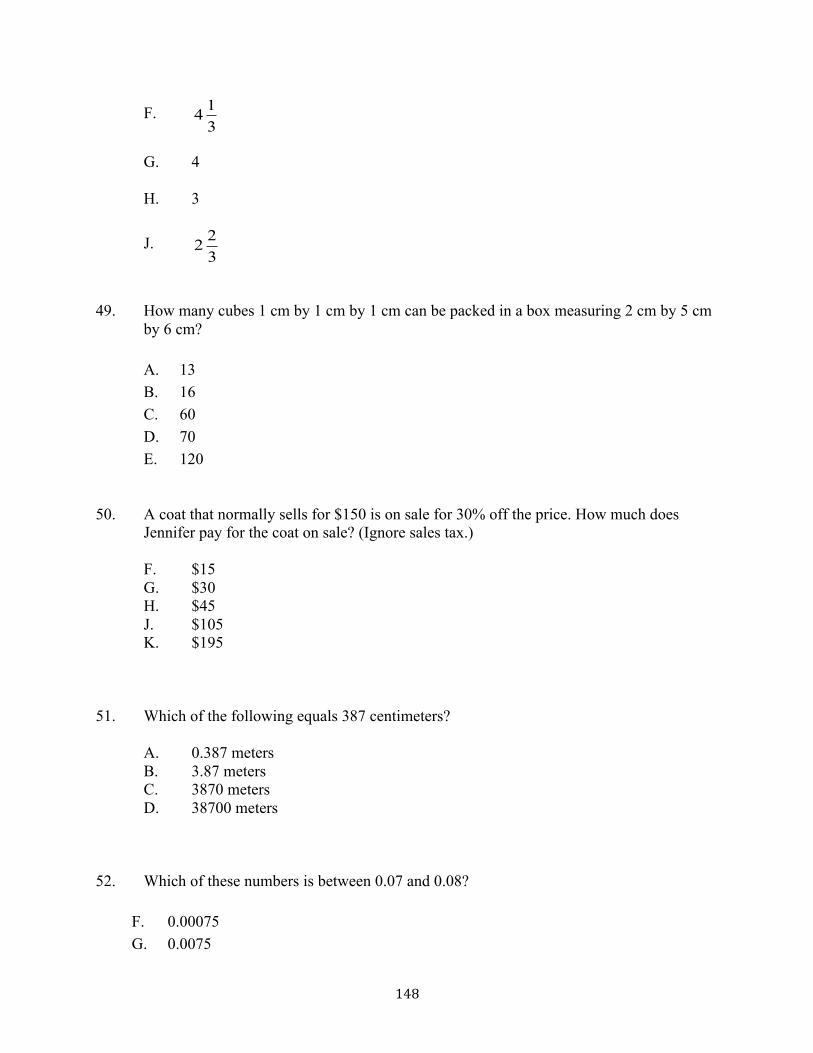
148
F. 314
G. 4 H. 3 J.
322
49. How many cubes 1 cm by 1 cm by 1 cm can be packed in a box measuring 2 cm by 5 cm
by 6 cm?
A. 13 B. 16 C. 60 D. 70 E. 120
50. A coat that normally sells for $150 is on sale for 30% off the price. How much does
Jennifer pay for the coat on sale? (Ignore sales tax.) F. $15 G. $30 H. $45 J. $105 K. $195 51. Which of the following equals 387 centimeters? A. 0.387 meters B. 3.87 meters C. 3870 meters D. 38700 meters 52. Which of these numbers is between 0.07 and 0.08? F. 0.00075 G. 0.0075

149
H. 0.075 J. 0.75 53. If n + n + n = 60, what is the value of n? A. 6 B. 10 C. 15 D. 20 E. 30 54. The perimeter of a square is 36 inches. What is the length of one side of the square? F. 4 inches G. 6 inches H. 9 inches J. 18 inches 55. If you know that 10% of a number is 15, which of the following is 60% of the number? A. 15 × 6 B. 15 ÷ 6 C. 15 + 6 D. 15 – 6 E. There is not enough information to answer the question. 56. Jenny ran 2.3 miles on Monday, 0.75 miles on Tuesday, and 3 miles on Wednesday. Find
the total number of miles she ran on these three days. F. 3.08 G. 6.05 H. 10.05 J. 10.1 K. 12.8 57. Sally bought 12 yards of ribbon at 80 cents per yard. She cut the ribbon into 4 equal parts
and made a bow from each part. What is the cost of the ribbon for making one bow? A. $2.40 B. $3.20

150
C. $3.94 D. $9.60 58. 2.5 ÷ 0.05 = F. 0.2 G. 0.02 H. 5 J. 50 K. 500
59. What fraction of the circle is shaded?
A. Between 0 and 14
B. Between 14
and 12
C. Between 12
and 34
D. Between 34
and 1
60. Which of the following means the same as 2
3?
F. 2 ÷ 3 G. 3 ÷ 2 H. 2 – 3 J. 2.3

151
UCSMP The University of Chicago School Mathematics Project Test Number __________
MATHEMATICS TEST ONE
Do not open this booklet until you are told to do so. This test contains 36 questions. You have 40 minutes to take the test. 1. All questions are multiple-choice. Some questions have four choices and some have five.
There is only one correct answer to each question. 2. Using the portion of the answer sheet marked TEST 2, fill in the circle • corresponding
to your answers to questions 1-36. Be sure to use a number 2 pencil. 3. If you want to change an answer, completely erase the first answer on your answer sheet. 4. If you do not know the answer, you may guess. 5. Use the scrap paper provided to do any writing or drawing. DO NOT MAKE ANY
STRAY MARKS IN THE TEST BOOKLET OR ON THE ANSWER SHEET. 6. You may NOT use a calculator. DO NOT TURN THE PAGE until your teacher says that you may begin. ©2007 University of Chicago School Mathematics Project. This test may not be reproduced without the permission of UCSMP. Some of the items on this test are released items from NAEP, from TIMSS 1999, or from TIMSS 2003 and are used subject to the conditions in the release of these items. Some items have been used in previous studies by UCSMP.

152
1. 3 + 15 ÷ 3 – 4 × 2 = A. -9 B. -2 C. 0 D. 4 E. 5 2. Suppose that 3 × ( � + 5) = 30. The number in the box should be ______. F. 2 G. 5 H. 10 J. 95
3. The objects on the scale below make it balance exactly.
According to this scale, if balances , then balances which of
the following?
A.
B.
C.
D.

153
4. What number can be placed in the box to make the statement below true? 15 + � = 22 + 3 F. 7 G. 10 H. 34 J. 40 5. -3 + 7 + -8 = A. -18 B. -12 C. -4 D. 2 E. 4 6. Which sentence is true? F. 3 0.8
5>
G. 2 0.4
5>
H. 2 0.663<
J. 5 0.5
9>
7. There were x boxes. Each box had s shoes in it. How many shoes are there in all? A. x + s B. x – s C. s – x D. xs
E. sx

154
8. Which of these fractions is smallest?
F. 61
G.
32
H.
31
J. 21
9. What is the value of
151
31
54
−− ?
A.
51
B. 52
C.
157
D.
43
E. 54
10. Bill has b marbles. Rosa has r marbles. How many marbles do Bill and Rosa have
together? F. b + r G. b – r H. r – b J. br
K. rb

155
11. There are x students from a class on school teams. There are 40 students in the class. How many students are not on school teams?
A. x + 40 B. x – 40 C. 40 – x D. 40x
E. 40x
12. Which of the following equals 25%? F. 0.025 G. 0.25 H. 2.5 J. 25 K. All of (F) – (J) equal 25%. 13. The graph below shows the humidity in a room as recorded on a certain morning.
On the morning shown in the graph, how many times between 6 a.m. and 12 noon was
the humidity exactly 20 percent? A. One B. Two C. Three D. Four

156
14. =+
43
32
F. 21
G.
75
H.
1251
J. 2
K. 412
15. If there are 300 calories in 100 g of a certain food, how many calories are there in a 30 g
portion of this food? A. 90 B. 100 C. 900 D. 1000 E. 9000 16. Which point represents 3
5 on the number line?
F. point A G. point B H. point C J. point D K. point E

157
17. The total weight of a pile of 500 salt crystals is 6.5 g. What is the average weight of a salt crystal?
A. 0.0078 g
B. 0.013 g
C. 0.0325 g
D. 0.078 g
18. Each square on the grid at the right represents 1 square unit. Find the area of figure PIGS. F. 3 square units G. 6 square units H. 7 square units J. 10 square units K. 12 square units 19. How many yards equals 39 feet? A. 14
3
B. 13 C. 117 D. 468 E. 1404 20. Which of these is the smallest number? F. 0.625 G. 0.25 H. 0.375 J. 0.5 K. 0.125
P I
G S

158
21. Jim has 43 of a yard of string which he wishes to divide into pieces, each
81 of a yard
long. How many pieces will he have? A. 3 B. 4 C. 6 D. 8 22. Of the following, which is the closest approximation to a 15 percent tip on a restaurant
check of $24.99? F. $2.50 G. $3.00 H. $3.75 J. $4.50 K. $5.00 23. A rectangle has length of 3.6 cm and width of 5 cm. Which numerical expression
gives the perimeter of the rectangle? A. 3.6 + 5
B. 2(3.6 + 5) C. 3.6 × 5 D. 2(3.6 × 5) E. 3.6 × 5 × 3.6 × 5
24. If
311 cups of flour are needed for a batch of cookies, how many cups of flour will be
needed for 3 batches? F.
314
G. 4 H. 3 J.
322

159
25. How many cubes 1 cm by 1 cm by 1 cm can be packed in a box measuring 2 cm by 5 cm by 6 cm?
A. 13 B. 16 C. 60 D. 70 E. 120
26. Which of these numbers is between 0.07 and 0.08? F. 0.00075 G. 0.0075 H. 0.075 J. 0.75 27. Which of the following equals 387 centimeters? A. 0.387 meters B. 3.87 meters C. 3870 meters D. 38700 meters 28. A coat that normally sells for $150 is on sale for 30% off the price. How much does
Jennifer pay for the coat on sale? (Ignore sales tax.) F. $15 G. $30 H. $45 J. $105 K. $195 29. If n + n + n = 60, what is the value of n? A. 6 B. 10 C. 15 D. 20 E. 30

160
30. The perimeter of a square is 36 inches. What is the length of one side of the square? F. 4 inches G. 6 inches H. 9 inches J. 18 inches 31. If you know that 10% of a number is 15, which of the following is 60% of the number? A. 15 × 6 B. 15 ÷ 6 C. 15 + 6 D. 15 – 6 E. There is not enough information to answer the question. 32. Jenny ran 2.3 miles on Monday, 0.75 miles on Tuesday, and 3 miles on Wednesday. Find
the total number of miles she ran on these three days. F. 3.08 G. 6.05 H. 10.05 J. 10.1 K. 12.8 33. Sally bought 12 yards of ribbon at 80 cents per yard. She cut the ribbon into 4 equal parts
and made a bow from each part. What is the cost of the ribbon for making one bow? A. $2.40 B. $3.20 C. $3.94 D. $9.60 34. 2.5 ÷ 0.05 = F. 0.2 G. 0.02 H. 5 J. 50 K. 500

161
35. What fraction of the circle is shaded?
A. Between 0 and 14
B. Between 14
and 12
C. Between 12
and 34
D. Between 34
and 1
36. Which of the following means the same as 2
3?
F. 2 ÷ 3 G. 3 ÷ 2 H. 2 – 3 J. 2.3

162
UCSMP The University of Chicago School Mathematics Project Test Number ________ Problem Solving and Understanding Test
Name (Print) ______________________________________ School ______________________________________ Teacher ______________________________________ Period ______________________________________ Do you have a calculator available for use on this test? _____ Yes _____ No If yes, what model calculator is it? ______________________________ Which is true of your calculator? _____ It does not graph equations. _____ It can graph equations. Do not open this booklet until you are told to do so. 1. This test contains 16 questions. 2. You MAY use a calculator on this test. 3. There may be many ways to answer a question. We are interested in how you solve a
problem. So, be sure to show all your work on the pages in the test booklet. If you use a calculator to solve a problem, be sure to explain what features or keys you used.
4. Try to do your best on each problem. 5. You have 40 minutes to answer the questions. ©2007 University of Chicago School Mathematics Project. This test may not be reproduced without the permission of UCSMP. Some of the items on this test are released items from NAEP or from TIMMS 1999 and are subject to the conditions in the release of these items. Other items have been used on previous studies conducted by UCSMP.

163
1. Write 0.48 as a fraction reduced to its lowest terms. Answer: __________ 2. Write a decimal between 3 and 3.1. Answer: __________ 3. Samuel is 4 feet 3 inches tall. How many inches tall is he? Answer: __________

164
4. Graph the four points on the number line and label them with the given letter. A = -2 B = 1.3 C = 13
10− D = 4
5
5. Carla's class is planning a picnic for the end of the school year. There will be 28 people at
the picnic. She wants each person to have two bottles of water. How many packages should she buy if she buys water in packages that have 10 bottles in a package?
Answer: __________ 6. One of the acute angles in a right triangle has a measure of 28 degrees. What is the
measure, in degrees, of the other acute angle? Answer: __________

165
7. The table at the right gives the weight
of fish caught during a tournament.
14 22 15 28 31 16 23
a. Make a stem-and-leaf plot of the data. b. Find the range of the weights. __________ c. Find the median weight. __________ 8. On the grid below, sketch the graph of y = x + 2.

166
9. In a quadrilateral, each of two angles has a measure of 115°. If the measure of a third
angle is 70°, what is the measure of the remaining angle? 10. Refer to the diagram with triangle TRY.
Give the coordinates of each point. T = _____ R = _____ Y = _____
11. Refer to the graph of shirt
colors worn by students in Ms. Cray's class last Monday. She has 150 students during the day. About how many of her students wore black or green shirts?

167
DB C
A
12. Refer to the figure above. ∠DBA and ∠CBA form a linear pair. If the measure of ∠CBA
is 40°, what is the measure of ∠DBA? 13. Ken bought a used car for $5,375. He had to pay an additional 15 percent of the purchase
price to cover both sales tax and extra fees. What is the total amount Ken paid? Show your work. Answer: ____________________ 14. Solve the equation 2 4
3 5x = .

168
15. The figure at the right consists of a square with a semicircle attached on the top. Each side of the square has a length of 20 cm. Find the area of the figure.
16. The Johnson's car gets 15 miles to the gallon, on average. The Johnson's are planning a
trip of 1200 miles. If gas costs $2.75 per gallon, determine the cost of the gasoline for their trip.

169
APPENDIX B: TRANSITION MATHEMATICS INSTRUMENTS

170
UCSMP The University of Chicago School Mathematics Project Test Number ________
Middle School Mathematics Test
Do not open this booklet until you are told to do so. This test contains 28 questions. You have 40 minutes to take the test. 1. All questions are multiple-choice. Some questions have four choices and some have five.
There is only one correct answer to each question. 2. Using the portion of the answer sheet marked TEST 2, fill in the circle • corresponding
to your answer. The questions on this test start at number 33. 3. If you want to change an answer, completely erase the first answer on your answer sheet. 4. If you do not know the answer, you may guess. 5. Use the scrap paper provided to do any writing or drawing. DO NOT MAKE ANY
STRAY MARKS IN THE TEST BOOKLET OR ON THE ANSWER SHEET. 6. You may not use a calculator. DO NOT TURN THE PAGE until your teacher says that you may begin. ©2005 University of Chicago School Mathematics Project. This test may not be reproduced without the permission of the University of Chicago School Mathematics Project.

171
33. If n + n + n = 60, what is the value of n? A. 6 B. 10 C. 15 D. 20 E. 30 34. Bill has b marbles. Rosa has r marbles. How many marbles do Bill and Rosa have
together? F. b + r G. b – r H. r – b J. br
K. rb
35. There were x boxes. Each box had s shoes in it. How many shoes are there in all? A. x + s B. x – s C. s – x D. xs
E. sx
36. The perimeter of a square is 36 inches. What is the length of one side of the square? F. 4 inches G. 6 inches H. 9 inches J. 18 inches

172
37. What is the least whole number x for which 2x > 11? A. 5 B. 6 C. 9 D. 22 E. 23 38. Which numerical expression gives the area of the rectangle at the right? F. 4 × 6 G. 4 + 6 H. 2(4 × 6) J. 2(4 + 6) K. 4 + 6 + 4 + 6 39. The figure to the right is shaded on the top side and
white on the under side. If the figure were flipped over, its white side could look like which of the following figures?
A. B. C. D.
6
6
4 4

173
40. Tetsu rides his bicycle x miles the first day, y miles the second day, and z miles the third day. Which of the following expressions represents the average number of miles per day that Tetsu travels?
F. x + y + z G. xyz H. 3(x + y + z) J. 3(xyz)
K. 3
zyx ++
41. Which expression describes the pattern in the first four rows of the table? A. n + 18 B. n + 10 C. 6n D. 20n E. 360 42. A rectangle has length of 3.6 cm and width of 5 cm. Which numerical expression gives the perimeter of the rectangle? F. 3.6 + 5
G. 2(3.6 + 5) H. 3.6 × 5 J. 2(3.6 × 5) K. 3.6 × 5 × 3.6 × 5
2 12 5 30 13 78 40 240 n ?

174
43. Suppose that a measurement of a rectangular box is given as 48 cubic inches. What could the measurement represent? A. the distance around the top of the box B. the length of an edge of the box C. the surface area of the box D. the volume of the box 44. Suppose that 3 × ( � + 5) = 30. The number in the box should be ______. F. 2 G. 5 H. 10 J. 95 45. There are x students from a class on school teams. There are y students in the class. How
many students are not on school teams? A. x + y B. x – y C. y – x D. xy
E. yx
46. If m and n are not zero, which of the following is not necessarily true? F. m + n = n + m G. m – n = n – m H. mn = nm J.
€
mn = 2m2n
K. 2(m + n) = 2m + 2n

175
47. Consider the two figures below. All of the angles are right angles. How do the perimeters of the two figures compare?
A. The perimeter of Figure I is larger than the perimeter of Figure II. B. The perimeter of Figure II is larger than the perimeter of Figure I. C. Both figures have the same perimeter. D. There is not enough information given to find the perimeters of Figures I and II. 48. A plumber charges customers $48 for each hour worked plus an additional $9 for travel.
If h represents the number of hours worked, which of the following expressions could be used to calculate the plumber’s total charge in dollars?
F. 48 + 9 + h G. 48 × 9 × h H. 48 + (9 × h) J. (48 × 9) + h K. (48 × h) + 9 49. The dot • stands for multiplication. Suppose you can replace x by any number you wish. Which is not correct? A. x • 1 = x B. x + 0 = x C. x • 0 = 0 D. x + 1 = x E. x – x = 0
10
6
10
I 6
10
8
2
II

176
50. Consider the triangle and line shown at the right. Which of the following shows the result of flipping the triangle over the line l? F. G. H. J. K.
l
l
l
l
l
l

177
51. A rectangular pool has dimensions 10 meters by 30 meters. It is surrounded by a walkway as shown by the shading in the diagram at right. Which of the following gives the area of the walkway in square meters? A. 40 × 18 B. 30 × 10 C. (40 × 18) – (30 × 10) D. (40 × 18) + (30 × 10) E. (40 – 30) × (18 – 10) 52. 53. Solve: n – 3 = 2n + 19. A. -57 B. -22 C. -16 D. 16 E. 22
40
18 30
10
Triangle TRY is translated 3 units to the right and 4 units up. What will be the coordinates of the image of point Y?
F. (3, 4) G. (2, 5) H. (4, 5) J. (-4, -3) K. (4, 3)
T
R
Y

178
54. If the area of the shaded triangle shown at the right is 4 square inches, what is the area of the entire square?
F. 4 square inches G. 8 square inches H. 12 square inches J. 16 square inches K. Not enough information given
55. The objects on the scale below make it balance exactly.
According to this scale, if balances , then balances which of the following?
A.
B.
C.
D.

179
56. A small plastic cube has a volume of 64 cubic inches. It is going to be covered with soft fabric to make a baby toy. How much fabric will be needed to cover the cube if the fabric does not overlap?
F. 4 square inches G. 16 square inches H. 24 square inches J. 96 square inches K. 384 square inches 57. Each square on the grid at the right represents 1 square unit. Find the area of figure PIGS. A. 3 square units B. 6 square units C. 7 square units D. 10 square units E. 12 square units 58. How many cubes 1 cm by 1 cm by 1 cm can be packed in a box measuring 2 cm by 5 cm
by 6 cm?
F. 13 G. 16 H. 60 J. 70 K. 120
59. Which expression fits all instances of the pattern at the right? A. n + 4 B. n + 6 C. 3n + 4 D. 4n E. 4n + 3
1 7 2 11 3 15 4 19 n ?
P I
G S

180
60. The sign at the right is hanging in a store window. One of the hooks breaks. Which of the following shows the sign after a 90° rotation clockwise?
F.
G.
H.
J. K.
OPEN OPEN
NEPO OPEN
NEPO
OPEN

UCSMP The University of Chicago School Mathematics Project Test Number ________
Algebra/Geometry Readiness Test: Part One
Do not open this booklet until you are told to do so. This test contains 40 questions. You have 40 minutes to take the test. 1. All questions are multiple-choice. Some questions have four choices and some have five.
There is only one correct answer to each question. 2. Using the portion of the answer sheet marked TEST 2, fill in the circle • corresponding
to your answer. 3. If you want to change an answer, completely erase the first answer on your answer sheet. 4. If you do not know the answer, you may guess. 5. Use the scrap paper provided to do any writing or drawing. DO NOT MAKE ANY
STRAY MARKS IN THE TEST BOOKLET OR ON THE ANSWER SHEET. 6. You may not use a calculator. DO NOT TURN THE PAGE until your teacher says that you may begin. ©2006 University of Chicago School Mathematics Project. This test may not be reproduced without the permission of the University of Chicago School Mathematics Project. Some of the items on this test are released items from NAEP, from TIMSS 1999, or from TIMSS 2003 and are used subject to the conditions in the release of these items.

182
1. What is the least whole number x for which 2x > 11? A. 5 B. 6 C. 9 D. 22 E. 23 2. Which of these fractions is smallest?
F. 61
G. 32
H. 31
J. 21
3. There were x boxes. Each box had s shoes in it. How many shoes are there in all? A. x + s B. x – s C. s – x D. xs
E. sx
4. The perimeter of a square is 36 inches. What is the length of one side of the square? F. 4 inches G. 6 inches H. 9 inches J. 18 inches

183
5. Sound travels at approximately 330 meters per second. The sound of an explosion took 28 seconds to reach a person. Which of these is the closest estimate of how far away the person was from the explosion?
A. 12 000 m B. 9000 m C. 8000 m D. 6000 m 6. Which numerical expression gives the area of the rectangle at the right? F. 4 × 6 G. 4 + 6 H. 2(4 × 6) J. 2(4 + 6) K. 4 + 6 + 4 + 6 7. If the price of a can of beans is raised from 50 cents to 60 cents, what is the percent
increase in the price? A. 83.3% B. 20% C. 18.2% D. 16.7% E. 10% 8. Tetsu rides his bicycle x miles the first day, y miles the second day, and z miles the third
day. Which of the following expressions represents the average number of miles per day that Tetsu travels?
F. x + y + z G. xyz H. 3(x + y + z) J. 3(xyz)
K. 3
zyx ++
6
6
4 4

184
9. Which expression describes the pattern in the first four rows of the table? A. n + 18 B. n + 10 C. 6n D. 20n E. 360 10. A rectangle has length of 3.6 cm and width of 5 cm. Which numerical expression gives the perimeter of the rectangle? F. 3.6 + 5
G. 2(3.6 + 5) H. 3.6 × 5 J. 2(3.6 × 5) K. 3.6 × 5 × 3.6 × 5
11. Suppose that a measurement of a rectangular box is given as 48 cubic inches. What could the measurement represent? A. the distance around the top of the box B. the length of an edge of the box C. the surface area of the box D. the volume of the box 12. Suppose that 3 × (� + 5) = 30. The number in the box should be ______. F. 2 G. 5 H. 10 J. 95 13. There are x students from a class on school teams. There are y students in the class. How
many students are not on school teams? A. x + y B. x – y C. y – x D. xy
E. yx
2 12 5 30 13 78 40 240 n ?

185
14. Which is the graph of the equation x + y = 10? F. G. H.
J. K.
15. Of the following, which is NOT true for all rectangles? A. The opposite sides are parallel. B. The opposite sides are equal. C. All angles are right angles. D. The diagonals are equal. E. The diagonals are perpendicular. 16. If m and n are not zero, which of the following is not necessarily true? F. m + n = n + m G. m – n = n – m H. mn = nm J.
€
mn = 2m2n
K. 2(m + n) = 2m + 2n

186
17. Consider the two figures below. All of the angles are right angles. How do the perimeters of the two figures compare?
A. The perimeter of Figure I is larger than the perimeter of Figure II. B. The perimeter of Figure II is larger than the perimeter of Figure I. C. Both figures have the same perimeter. D. There is not enough information given to find the perimeters of Figures I and II. 18. A plumber charges customers $48 for each hour worked plus an additional $9 for travel.
If h represents the number of hours worked, which of the following expressions could be used to calculate the plumber’s total charge in dollars?
F. 48 + 9 + h G. 48 × 9 × h H. 48 + (9 × h) J. (48 × 9) + h K. (48 × h) + 9 19. One of the acute angles in a right triangle measures 28 degrees. What is the measure, in
degrees, of the other acute angle? A. 17° B. 28° C. 62° D. 90° E. 152°
10
6
10
I 6
10
8
2
II

187
20. In this figure, triangles ABC and DEF are congruent with BC = EF.
What is the measure of angle EGC? F. 20° G. 40° H. 60° J. 80° K. 100° 21. A rectangular pool has dimensions 10 meters by 30 meters. It is surrounded by a walkway as shown by the shading in the diagram at right. Which of the following gives the area of the walkway in square meters? A. 40 × 18 B. 30 × 10 C. (40 × 18) – (30 × 10) D. (40 × 18) + (30 × 10) E. (40 – 30) × (18 – 10)
40
18 30
10

188
22. Which of the following can be folded to form the prism above? F. G. H.
J. K.

189
23. The dot • stands for multiplication. Suppose you can replace x by any number you wish. Which is not correct? A. x • 1 = x B. x + 0 = x C. x • 0 = 0 D. x + 1 = x E. x – x = 0 24. 25. Solve: n – 3 = 2n + 19. A. -57 B. -22 C. -16 D. 16 E. 22
Triangle TRY is translated 3 units to the right and 4 units up. What will be the coordinates of the image of point Y?
F. (3, 4) G. (2, 5) H. (4, 5) J. (-4, -3) K. (4, 3)
T
R
Y

190
26. Consider the triangle and line shown at the right. Which of the following shows the result of flipping the triangle over the line l? F. G. H. J. K.
l
l
l
l
l
l

191
27. What is the value of 151
31
54
−− ?
A. 51
B. 52
C. 157
D. 43
E. 54
28. In a quadrilateral, each of two angles has a measure of 115°. If the measure of a third
angle is 70°, what is the measure of the remaining angle? F. 60° G. 70° H. 130° J. 140° K. None of the above. 29. Of the following, which is the closest approximation to a 15 percent tip on a restaurant
check of $24.99? A. $2.50 B. $3.00 C. $3.75 D. $4.50 E. $5.00

192
30. If the area of the shaded triangle shown at the right is 4 square inches, what is the area of the entire square?
F. 4 square inches G. 8 square inches H. 12 square inches J. 16 square inches K. Not enough information given
31. The objects on the scale below make it balance exactly.
According to this scale, if balances , then balances which of the following?
A.
B.
C.
D.
32. A small plastic cube has a volume of 64 cubic inches. It is going to be covered with soft
fabric to make a baby toy. How much fabric, in square inches, will be needed to cover the cube if the fabric does not overlap?
F. 4 G. 16 H. 24 J. 96 K. 384

193
33. Each square on the grid at the right represents 1 square unit. Find the area of figure PIGS in square units. A. 3 B. 6 C. 7 D. 10 E. 12 34. How many cubes 1 cm by 1 cm by 1 cm can be packed in a box measuring 2 cm by 5 cm
by 6 cm?
F. 13 G. 16 H. 60 J. 70 K. 120
35. The total weight of a pile of 500 salt crystals is 6.5 g. What is the average weight of a salt crystal?
A. 0.0078 g B. 0.013 g C. 0.0325 g D. 0.078 g
P I
G S

194
36. The line m is a line of symmetry for figure ABCDE.
The measure of angle BCD is F. 30° G. 50° H. 60° J. 70° K. 110° 37. Which expression fits all instances of the pattern below? A. n + 4 B. n + 6 C. 3n + 4 D. 4n E. 4n + 3
1 7 2 11 3 15 4 19 n ?

195
38. Which of these shapes are cylinders?
F. 1 and 2 G. 1 and 3 H. 2 and 4 J. 3 and 4 39. The graph below shows the humidity in a room as recorded on a certain morning.
On the morning shown in the graph, how many times between 6 a.m. and 12 noon was
the humidity exactly 20 percent? A. One B. Two C. Three D. Four

196
40. The figure represents two similar triangles. The triangles are not drawn to scale.
In the actual triangle ABC, what is the length of side BC? F. 3.5 cm G. 4.5 cm H. 5 cm J. 5.5 cm K. 8 cm

197
UCSMP The University of Chicago School Mathematics Project Test Number ________
Algebra/Geometry Readiness Test: Part Two
Name (Print) ______________________________________ School ______________________________________ Teacher ______________________________________ Period ______________________________________ Do you have a calculator available for use on this test? _____ Yes _____ No If yes, what model calculator is it? ______________________________ Which is true of your calculator? _____ It does not graph equations. _____ It can graph equations. Do not open this booklet until you are told to do so. 1. This test contains 12 questions. 2. You may use a calculator on this test. 3. There may be many ways to answer a question. We are interested in how you solve a problem.
So, be sure to show all your work on the pages in the test booklet. If you use a calculator to solve a problem, be sure to explain what features or keys you used.
4. Try to do your best on each problem. 5. You have 35 minutes to answer the questions. ©2006 University of Chicago School Mathematics Project. This test may not be reproduced without the permission of the University of Chicago School Mathematics Project. Some of the items on this test are released items from NAEP, TIMSS 1999, or TIMSS 2003 and are used subject to the conditions in the release of the items.

198
1. Write 0.48 as a fraction reduced to its lowest terms. Answer: __________ 2. Write a decimal between 3 and 3.1. Answer: __________
3. Laura has $240. She spent 85
of it. How much money did she have left?
Answer: __________

199
4. Find the value of x if 12x – 10 = 6x + 32. Answer: __________ 5. Solve x + 1 > -2 and graph your solution on the number line below.

200
6. The figure shows a shaded rectangle inside a parallelogram.
What is the area of the shaded rectangle? Answer: _______________ 7. The points Q, R, and S shown in the graph below are three vertices of rectangle QRST. a. Plot and label point T so that QRST is a rectangle.
b. Give the coordinates of point T. __________

201
8. A book publisher sent 140 copies of a certain book to a bookstore. The publisher packed the books in two types of boxes. One type of box held 8 copies of the book, and the other type held 12 copies of the book. The boxes were all full, and there were equal numbers of both types of boxes.
a. How many boxes holding 12 books were sent to the publisher? Answer: __________ b. What fraction of the books sent to the bookstore were packed in the smaller boxes? Answer: __________ 9. Ken bought a used car for $5,375. He had to pay an additional 15 percent of the purchase price to
cover both sales tax and extra fees. What is the total amount Ken paid? Show your work. Answer: ____________________

202
10. A club has 86 members, and there are 14 more girls than boys. How many boys and how many girls are members of the club?
Show your work. Answer: _______________________________________________________ 11. a. For all real numbers, m, x and y, is it true that m(x + y) = mx + y? _____ Yes _____ No b. Imagine that someone does not know the answer to part a. Explain how you would convince
that person that your answer to part a is correct.

203
12. The figures show four sets consisting of circles.
a. Complete the table below. First, fill in how many circles make up Figure 4. Then, find the
number of circles that would be needed for the 5th figure if the sequence of figures is extended.
Figure Number of circles 1 1 2 3 3 6 4 5
b. The sequence of figures is extended to the 7th figure. How many circles would be needed for
Figure 7? Answer: __________
c. The 50th figure in the sequence contains 1275 circles. Determine the number of circles in the
51st figure. Without drawing the 51st figure, explain or show how you arrived at your
answer.

204
APPENDIX C: ALGEBRA INSTRUMENTS

205
UCSMP The University of Chicago School Mathematics Project Test Number ________
ENTERING ALGEBRA TEST
Do not open this booklet until you are told to do so. This test contains 30 questions. You have 40 minutes to take the test. 1. All questions are multiple-choice. Some questions have four choices and some have five.
There is only one correct answer to each question. 2. Using the portion of the answer sheet marked TEST 2, fill in the circle • corresponding
to your answer. 3. If you want to change an answer, completely erase the first answer on your answer sheet. 4. If you do not know the answer, you may guess. 5. Use the scrap paper provided to do any writing or drawing. DO NOT MAKE ANY
STRAY MARKS IN THE TEST BOOKLET OR ON THE ANSWER SHEET. 6. You may not use a calculator. DO NOT TURN THE PAGE until your teacher says that you may begin. ©2005 University of Chicago School Mathematics Project. This test may not be reproduced without the permission of the University of Chicago School Mathematics Project.

206
1. What are all the whole numbers that make 8 - � > 3 true? A. 0, 1, 2, 3, 4, 5 B. 0, 1, 2, 3, 4 C. 0, 1, 2 D. 5 2. If n + n + n = 60, what is the value of n? F. 6 G. 10 H. 15 J. 20 K. 30 3. In the figure at right, what fraction of
rectangle ABCD is shaded?
A. 61
B. 51
C. 41
D. 31
E. 21
4. Which of the following ordered pairs (x, y) is a solution to the equation
2x – 3y = 6?
F. (6, 3) G. (3, 0) H. (3, 2) J. (2, 3) K. (0, 3)
A
B C
D

207
5. Which of the following numerical expressions gives the area of the rectangle at the right?
A. 4 × 6 B. 4 + 6 C. 2(4 × 6) D. 2(4 + 6) E. 4 + 6 + 4 + 6 6. Tetsu rides his bicycle x miles the first day, y miles the second day, and z miles the third
day. Which of the following expressions represents the average number of miles per day that Tetsu travels?
F. x + y + z G. xyz H. 3(x + y + z) J. 3(xyz)
K. 3
zyx ++
7. (-5)(-7) = A. -35 B. -12 C. -2 D. 12 E. 35 8. If 3 + w = b, then w =
F. 3b
G. b × 3
H. b + 3
J. 3 – b
K. b – 3
6
6
4 4
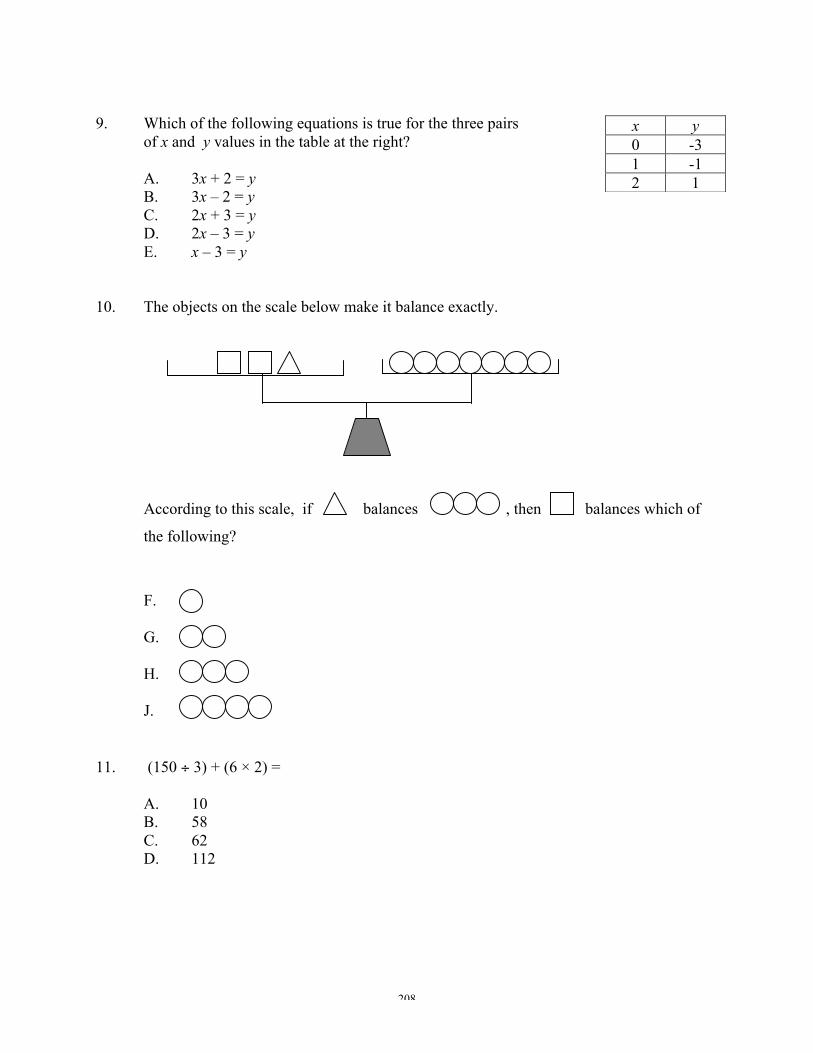
208
9. Which of the following equations is true for the three pairs of x and y values in the table at the right? A. 3x + 2 = y B. 3x – 2 = y C. 2x + 3 = y D. 2x – 3 = y E. x – 3 = y 10. The objects on the scale below make it balance exactly.
According to this scale, if balances , then balances which of
the following?
F.
G.
H.
J.
11. (150 ÷ 3) + (6 × 2) = A. 10 B. 58 C. 62 D. 112
x y 0 -3 1 -1 2 1

209
12. =+43
32
F. 21
G. 75
H. 1251
J. 2
K. 412
13. According to the graph below, how many times did the yearly increase of the price of a
hamburger exceed 10 cents?
A. None B. One C. Two D. Three E. Four 14. Consider the rectangular box at the right.
Which of the following can be used to find the volume of the box?
F. 2a + b G. a2b H. 6a2 J. 2a2 + 4ab K. a2 + ab
1985 1986 1987 1988 1989 1990
$1.55 $1.45 $1.35 $1.25 $1.15 $1.05 $0.95
Year
Price per ham
burger
a
a b

210
15. Consider the table at the right with values for an expression ax + b.
According to the table, the value of x that makes ax + b = 7 is _____.
A. 1 B. 3 C. 7 D. 19 E. There is not enough information to find an answer. 16. If the list of fractions at right continues
in the same pattern, which term will be equal to 0.95? F. The 100th G. The 95th H. The 20th J. The 19th K. The 15th 17. What is the least whole number x for which 2x > 11? A. 5 B. 6 C. 9 D. 22 E. 23
x ax + b 0 5 1 7 3 11 7 19 12 29
Term Fraction 1
21
2
32
3
43
4
54
…
…

211
18. A plumber charges customers $48 for each hour worked plus an additional $9 for travel. If h represents the number of hours worked, which of the following expressions could be used to calculate the plumber’s total charge in dollars?
F. 48 + 9 + h G. 48 × 9 × h H. 48 + (9 × h) J. (48 × 9) + h K. (48 × h) + 9 19. The length of a rectangle is 3 more than its width. If L represents the length, what is an
expression for the width? A. 3 ÷ L B. L ÷ 3 C. L × 3 D. L + 3 E. L − 3 20. 3 + 15 ÷ 3 – 4 × 2 = F. -9 G. -2 H. 0 J. 4 K. 5 21. Which of the following is equivalent to 4(2m + 3)? A. 8m + 3 B. 8m + 12 C. 16m + 12 D. 2m + 2m + 2m + 2m + 3 E. 8m4 + 12

212
22. Jim has 43 of a yard of string which he wishes to divide into pieces, each
81 of a yard
long. How many pieces will he have? F. 3 G. 4 H. 6 J. 8 23. Which of the following figures best illustrates the statement 5 × (6 + 2) = (5 × 6) + (5 × 2) A. B. C. D. E.
5 6 2
5 5 6 2
5
6 2
5
6
2
5 6 2

213
24. Solve: n – 3 = 2n + 19. F. -57
G. -22
H. -16
J. 16
K. 22
25. 33 + 4(8 – 5) ÷ 6 = A. 6.5 B. 11 C. 27.5 D. 29 E. 34.16 26. Which of the following expressions is equivalent to 3p2? F. 3 × 2p G. 3 + p + p H. 3p × 3p J. 3 + p × p K. 3 × p × p 27. Which of the following ratios is equivalent to the ratio of 6 to 4? A. 12 to 18 B. 12 to 8 C. 8 to 6 D. 4 to 6 E. 2 to 3

214
28. The total distances covered by two runners during the first 28 minutes of a race are shown in the graph below. How long after the start of the race did one runner pass the other?
29. If 311 cups of flour are needed for a batch of cookies, how many cups of flour will be
needed for 3 batches?
A. 314
B. 4 C. 3
D. 322
F. 3 minutes
G. 8 minutes
H. 12 minutes
J. 14 minutes
K. 28 minutes
Runner 1
Runner 2
Time in Minutes
Total Distance in Kilometers

215
30. Consider the graph below. Line L1 is the graph of y = ax + b. Line L2 is the graph of y = cx + d. Which point gives the pair of values of x and y that satisfy both equations?
F. Point A G. Point B H. Point C J. Point D K. Point E
y
A
B C D
E
L2
L1
x

216
UCSMP The University of Chicago School Mathematics Project Test Number ________
ALGEBRA TEST: Part One
Do not open this booklet until you are told to do so. This test contains 38 questions. You have 40 minutes to take the test. 1. All questions are multiple-choice. Some questions have four choices and some have five.
There is only one correct answer to each question. 2. Using the portion of the answer sheet marked TEST 2, fill in the circle • corresponding
to your answer. 3. If you want to change an answer, completely erase the first answer on your answer sheet. 4. If you do not know the answer, you may guess. 5. Use the scrap paper provided to do any writing or drawing. DO NOT MAKE ANY
STRAY MARKS IN THE TEST BOOKLET OR ON THE ANSWER SHEET. 6. You may not use a calculator. DO NOT TURN THE PAGE until your teacher says that you may begin. ©2006 University of Chicago School Mathematics Project. This test may not be reproduced without the permission of the University of Chicago School Mathematics Project. Some of the items are released items from NAEP or from TIMSS 1999 and are used subject to the conditions in the release of these items.

217
1. What are all the whole numbers that make 8 – � > 3 true? A. 0, 1, 2, 3, 4, 5 B. 0, 1, 2, 3, 4 C. 0, 1, 2 D. 5 2. If k represents a negative number, which of these is a positive number? F. k2
G. k3
H. 2k
J. 2k
3. In the figure at right, what fraction of
rectangle ABCD is shaded?
A. 61
B. 51
C. 41
D. 31
E. 21
4. Which of the following ordered pairs (x, y) is a solution to the equation
2x – 3y = 6?
F. (6, 3) G. (3, 0) H. (3, 2) J. (2, 3) K. (0, 3)
A
B C
D

218
5. Which of the following numerical expressions gives the area of the rectangle at the right?
A. 4 × 6 B. 4 + 6 C. 2(4 × 6) D. 2(4 + 6) E. 4 + 6 + 4 + 6 6. The cost C of printing greeting cards consists of a fixed charge of 100 cents and a charge
of 6 cents for each card printed. Which of these equations can be used to determine the cost, in cents, of printing n cards?
F. C = 100 + 6n
G. C = 106 + n
H. C = 6 + 100n
J. C = 106n
K. C = 600n 7. What is the slope of the line shown in the graph at the right?
A.
31
B. 32
C. 1
D. 23
E. 3
6
6
4 4

219
8. Tetsu rides his bicycle x miles the first day, y miles the second day, and z miles the third day. Which of the following expressions represents the average number of miles per day that Tetsu travels?
F. x + y + z
G. xyz
H. 3(x + y + z)
J. 3(xyz)
K. 3
zyx ++
9. (-5)(-7) = A. -35 B. -12 C. -2 D. 12 E. 35 10. If 3 + w = b, then w =
F. 3b
G. b × 3
H. b + 3
J. 3 – b
K. b – 3
11. Which of the following equations is true for the three pairs of x and y values in the table at the right? A. 3x + 2 = y B. 3x – 2 = y C. 2x + 3 = y D. 2x – 3 = y E. x – 3 = y
x y 0 -3 1 -1 2 1

220
12. The objects on the scale below make it balance exactly.
According to this scale, if balances , then balances which of
the following?
F.
G.
H.
J.
13. If you invest $100 for 8 years at a 7% annual yield, then how many dollars will you have
at the end of this time? (Assume you make no additional deposits or withdrawals.) A. 100(1.56)
B. 100(8.56)
C. 100(0.07)8
D. 100(1.08)7
E. 100(1.07)8

221
14. =+43
32
F. 21
G. 75
H. 1251
J. 2
K. 412
15. It has been claimed that, in this century, the world record t (in seconds) for the men’s
mile run in the year y can be estimated by the equation t = 914.2 – 0.346y. According to this claim, how is the record changing?
A. It is going down about 31 second per year.
B. It is going down about 41 second per year.
C. It is increasing by about 31 second per year.
D. It is increasing by about 41 second per year.
E. It is neither increasing nor decreasing.
16. If the price of a can of beans is raised from 50 cents to 60 cents, what is the percent
increase in the price? F. 83.3% G. 20% H. 18.2% J. 16.7% K. 10%

222
17. According to the graph below, how many times did the yearly increase of the price of a hamburger exceed 10 cents?
A. None B. One C. Two D. Three E. Four 18. Consider the rectangular box at the right.
Which of the following can be used to find the volume of the box?
F. 2a + b G. a2b H. 6a2 J. 2a2 + 4ab K. a2 + ab 19. Consider the table at the right with
values for an expression ax + b. According to the table, the value of x that makes ax + b = 7 is _____.
A. 1 B. 3 C. 7 D. 19 E. There is not enough information to find an answer.
x ax + b 0 5 1 7 3 11 7 19 12 29
1985 1986 1987 1988 1989 1990
$1.55
$1.45 $1.35 $1.25 $1.15 $1.05 $0.95
Year
Price per ham
burger
a
a b

223
20. If the list of fractions at right continues in the same pattern, which term will be equal to 0.95?
F. The 100th G. The 95th H. The 20th J. The 19th K. The 15th 21. What is the least whole number x for which 2x > 11? A. 5 B. 6 C. 9 D. 22 E. 23 22. A plumber charges customers $48 for each hour worked plus an additional $9 for travel.
If h represents the number of hours worked, which of the following expressions could be used to calculate the plumber’s total charge in dollars?
F. 48 + 9 + h G. 48 × 9 × h H. 48 + (9 × h) J. (48 × 9) + h K. (48 × h) + 9
Term Fraction 1
21
2
32
3
43
4
54
…
…

224
23. The length of a rectangle is 3 more than its width. If L represents the length, what is an expression for the width?
A. 3 ÷ L B. L ÷ 3 C. L × 3 D. L + 3 E. L − 3 24. 3 + 15 ÷ 3 – 4 × 2 = F. -9 G. -2 H. 0 J. 4 K. 5 25. Which of the following is equivalent to 4(2m + 3)? A. 8m + 3 B. 8m + 12 C. 16m + 12 D. 2m + 2m + 2m + 2m + 3 E. 8m4 + 12
26. Jim has 43 of a yard of string which he wishes to divide into pieces, each
81 of a yard
long. How many pieces will he have? F. 3 G. 4 H. 6 J. 8

225
27. Which of the following figures best illustrates the statement 5 × (6 + 2) = (5 × 6) + (5 × 2) ? A. B. C. D. E. 28. Solve: n – 3 = 2n + 19. F. -57
G. -22
H. -16
J. 16
K. 22
5 6 2
5 5 6 2
5
6 2
5
6
2
5 6 2

226
29. 33 + 4(8 – 5) ÷ 6 = A. 6.5 B. 11 C. 27.5 D. 29 E. 34.16
30. Find the area of the shaded region between the rectangles. F. 9r
G. 18r H. 34r2 J. 68r2 K. Not enough information is given. 31. Use the graph below. It shows the height h
of a ball (in feet) t seconds after it is thrown in the air. For how long was the ball over 20 feet high?
A. about 1 second B. about 3 seconds
C. about 1 and about 5 seconds D. from 4 to 5 seconds E. about 6 seconds

227
32. Which of the following expressions is equivalent to 3p2 ? F. 3 × 2p G. 3 + p + p H. 3p × 3p J. 3 + p × p K. 3 × p × p 33. Which of the following ratios is equivalent to the ratio of 6 to 4? A. 12 to 18 B. 12 to 8 C. 8 to 6 D. 4 to 6 E. 2 to 3 34. The total distances covered by two runners during the first 28 minutes of a race are
shown in the graph below. How long after the start of the race did one runner pass the other?
F. 3 minutes
G. 8 minutes
H. 12 minutes
J. 14 minutes
K. 28 minutes
Runner 1
Runner 2
Time in Minutes
Total Distance in Kilometers

228
35. If 311 cups of flour are needed for a batch of cookies, how many cups of flour will be
needed for 3 batches?
A. 314
B. 4 C. 3
D. 322
36. Consider the graph below. Line L1 is the graph of y = ax + b. Line L2 is the graph of y =
cx + d. Which point gives the pair of values of x and y that satisfy both equations?
F. Point A G. Point B H. Point C J. Point D K. Point E
y
A
B C D
E
L2
L1
x

229
37. What are the solutions to 5x2 – 11x – 3 = 0?
A. 518111±
B. 1018111±−
C. 1018111±
D. 106111±
E. 10
6111±−
38. Of the following, which is the closest approximation to a 15 percent tip on a restaurant
check of $24.99? F. $2.50 G. $3.00 H. $3.75 J. $4.50 K. $5.00

230
UCSMP The University of Chicago School Mathematics Project Test Number ________
Algebra Test: Part Two
Name (Print) ______________________________________ School ______________________________________ Teacher ______________________________________ Period ______________________________________ Do you have a calculator available for use on this test? _____ Yes _____ No If yes, what model calculator is it? ______________________________ Which is true of your calculator? _____ It does not graph equations. _____ It can graph equations. _____ It can simplify algebraic expressions. Do not open this booklet until you are told to do so. 1. This test contains 11 questions. 2. You may use a calculator on this test. 3. There may be many ways to answer a question. We are interested in how you solve a
problem. So, be sure to show all your work on the pages in the test booklet. If you use a calculator to solve a problem, be sure to explain what features or keys you used.
4. Try to do your best on each problem. 5. You have 35 minutes to answer the questions. ©2006 University of Chicago School Mathematics Project. This test may not be reproduced without the permission of the University of Chicago School Mathematics Project. Some of the items on this test are released items from NAEP or from TIMSS 1999 and are used subject to the conditions in the release of the items.

231
1. Find the value of 4x2 – 7x + 5 when x = 3. Answer: _______________________________ 2. It takes 30 minutes for a certain bacteria population to double. If there are 5,000,000
bacteria in this population at 1:00 p.m., find the number of bacteria in the population at 2:30 p.m. on the same day.
Answer: ________________________________ 3. Ken bought a used car for $5,375. He had to pay an additional 15 percent of the purchase
price to cover both sales tax and extra fees. What is the total amount Ken paid? Show your work. Answer: _______________________________

232
4. A club has 86 members, and there are 14 more girls than boys. How many boys and how many girls are members of the club?
Show your work. Answer: _______________________________________________________
5. Solve )42(53)54(
32
+=− xx . Show your work.
Answer: ______________________________

233
6. Consider the values in the table at right. Find an equation that relates x and y.
Show your work. Answer: __________
x y -4 -10 -2 -4 0 2 2 8 4 14

234
7. The graph below represents Marissa’s riding speed throughout her 80-minute bicycle trip. Use the information in the graph to describe what could have happened on the trip, including her speed throughout the trip.
a. During the first 20 minutes, describe Marissa’s trip. b. From 20 minutes to 60 minutes, describe Marissa’s trip. c. From 60 minutes to 80 minutes, describe Marissa’s trip.

235
8. a. For all real numbers x and y is it true that (x + y)2 = x2 + y 2? _____ Yes _____ No b. Imagine that someone does not know the answer to part a. Explain how you would
convince that person that your answer to part a is correct. 9. a. Make up a question about a real situation that can be answered by solving the
equation 5x + 100 = 7x + 75. Be sure to tell what x represents. b. Answer the question you asked in part a.

236
10. a. On the axes below, sketch the graph of 3x + 2y < 12.
b. Is the point (100, -145) on the graph?
_____ Yes _____ No Explain how you know.

237
11. The figures show four sets consisting of circles.
a. Complete the table below. First, fill in how many circles make up Figure 4. Then,
find the number of circles that would be needed for the 5th figure if the sequence of figures is extended.
Figure Number of circles 1 1 2 3 3 6 4 5
b. The sequence of figures is extended to the 7th figure. How many circles would be
needed for Figure 7? Answer: __________ c. The 50th figure in the sequence contains 1275 circles. Determine the number of
circles in the 51st figure. Without drawing the 51st figure, explain or show how you arrived at your answer.

238
APPENDIX D: TEACHER INSTRUMENTS

239
University of Chicago School Mathematics Project Pre-‐Transition Mathematics
CHAPTER 1 EVALUATION FORM
Teacher __________________________________ School____________________________________
Date Chapter Began _______ Date Chapter Ended ________ No. Class Days (Including Tests) ____
1. Please complete the table below. In column A, circle the number of days you spent on each lesson. In columns B and C, rate the text and questions of each lesson using the following scale.
1 = Disastrous; scrap entirely. (Reason?) 2 = Poor; needs major rewrite. (Suggestions?) 3 = OK; some big changes needed. (Suggestions?) 4 = Good; minor changes needed. (Suggestions?) 5 = Excellent; leave as is. In columns D and E, respectively, list the specific questions you assigned in the lesson and comment on
any parts of the lesson text or questions you think should be changed. Use the other side or an additional sheet of paper if you need more space.
A B C D E
Circle the number of days you spent on the lesson
Rating Questions Assigned Comments Lesson
Lesson Text Questions
1-‐1 0 0.5 1 1.5 2 2.5
1-‐2 0 0.5 1 1.5 2 2.5
1-‐3 0 0.5 1 1.5 2 2.5
1-‐4 0 0.5 1 1.5 2 2.5
1-‐5 0 0.5 1 1.5 2 2.5
1-‐6 0 0.5 1 1.5 2 2.5
1-‐7 0 0.5 1 1.5 2 2.5
1-‐8 0 0.5 1 1.5 2 2.5
Self-‐Test 0 0.5 1 1.5 2 2.5 SPUR Review 0 0.5 1 1.5 2 2.5
2. Overall rating of this chapter. (Use the same rating scale as at the top of the page.) __________

240
3. What comments do you have on the sequence, level of difficulty, or other specific aspects of the content of
this chapter?
4. As we revise the student materials for this chapter,
a. What should we definitely not change?
b. What should we definitely change? What ideas do you have for changes that should be made?
5. As we revise the Teacher’s Notes for this chapter,
a. What should we definitely not change?
b. What should we definitely change? What ideas do you have for changes that should be made?

241
6. While teaching this chapter, did you supplement the text with any materials other than those in the text?
Yes _____ No _____
If yes, which materials did you use and when? Why did you use these materials? (If possible, please enclose a copy of the materials you used.)
7. a. Did you as the teacher demonstrate or use a calculator with this chapter? Yes _____ No _____
b. If yes, how did you use the calculator?
c. What comments or suggestions do you have about the way calculator technology is incorporated into
this chapter?
8. a. Did your students use a calculator with this chapter? Yes _____ No _____
b. If yes, how did they use the calculator?
242
9. a. Did you as the teacher demonstrate or use a computer with this chapter? Yes _____ No _____
b. If yes, how did you use the computer?
c. What comments or suggestions do you have about the way computer technology is incorporated into
this chapter?
10. a. Did your students use a computer with this chapter? Yes _____ No _____
b. If yes, how did they use the computer?
11. a. Did you check out the loaner calculators to your students? Yes _____ No _____
b. For this chapter, what technology access did students have other than the loaner calculators?
12. Did this chapter help students adjust to the format of the book?

243
13. Lessons 2, 5, 6, and 8 have Activities built into the lessons? How did you use these Activities in your classroom?
14. Did you use the test for this chapter that we provided in the Teacher’s Notes?
Yes ______ No ______ If yes, what suggestions do you have for improvement?
If no, what specific reasons influenced your decision not to use the test?
15. Other comments? Attach additional sheets as needed.
Please return this form, along with a copy of the chapter test you administered to students if different from the provided Chapter Test, to Denisse R. Thompson

244
University of Chicago School Mathematics Project Transition Mathematics: Third Edition
CHAPTER 1 EVALUATION FORM
Teacher____________________________________ School _________________________________________
Date Chapter Began _________ Date Chapter Ended __________ No. Class Days (Including Tests) ____
1. Please complete the table below. In column A circle the number of days you spent on each lesson. In columns B and C, rate the text and questions of each lesson using the following scale.
1 = Disastrous; scrap entirely. (Reason?) 2 = Poor; needs major rewrite. (Suggestions?) 3 = OK; some big changes needed. (Suggestions?) 4 = Good; minor changes needed. (Suggestions?) 5 = Excellent; leave as is. In columns D and E, respectively, list the specific questions you assigned in the lesson and comment on any
parts of the lesson text or questions you think should be changed. Use the other side or an additional sheet of paper if you need more space.
A B C D E Circle the number of
days you spent on the lesson
Rating Questions Assigned Comments Lesson
Lesson Text Questions
1-1 0 0.5 1 1.5 2 2.5
1-1 Activity 0 0.5 1 1.5 2 2.5
1-2 0 0.5 1 1.5 2 2.5
1-3 0 0.5 1 1.5 2 2.5
1-4 0 0.5 1 1.5 2 2.5
1-5 0 0.5 1 1.5 2 2.5
1-6 0 0.5 1 1.5 2 2.5
1-7 0 0.5 1 1.5 2 2.5
1-8 0 0.5 1 1.5 2 2.5
1-9 0 0.5 1 1.5 2 2.5
Self-Test 0 0.5 1 1.5 2 2.5 Chapter Review 0 0.5 1 1.5 2 2.5
2. Overall rating of this chapter. (Use the same rating scale as at the top of the page.) __________
3. What comments do you have on the sequence, level of difficulty, or other specific aspects of the content of this chapter?
245
4. As we revise the student materials for this chapter, a. What should we definitely not change? b. What should we definitely change? What ideas do you have for changes that should be made? 6. As we revise the Teacher’s Notes for this chapter, a. What should we definitely not change? b. What should we definitely change? What ideas do you have for changes that should be made? 6. Did you use any UCSMP Second Edition materials during this chapter (Lesson Masters, Computer Masters,
etc.)? Yes _____ No _____ If yes, how and when? 7. While teaching this chapter, did you supplement the text with any materials other than those mentioned in
Question 6? Yes _____ No _____ If yes, what materials did you use and when? Why did you use these materials? (If possible, please enclose a copy of the materials you used.) 8. a. Did you as the teacher demonstrate or use a calculator with this chapter? Yes _____ No _____ b. If yes, how did you use the calculator? c. What comments or suggestions do you have about the way calculator technology is incorporated into this
chapter? 9. a. Did your students use a calculator with this chapter? Yes _____ No _____ b. If yes, how did they use the calculator? 10. a. Did you as the teacher demonstrate or use a computer with this chapter? Yes _____ No _____ b. If yes, how did you use the computer? c. What comments or suggestions do you have about the way computer technology is incorporated into this
chapter? 11. a. Did your students use a computer with this chapter? Yes _____ No _____ b. If yes, how did they use the computer? 12. Did you check out the loaner calculators to students? Yes ______ No ______ If no, why not? For this chapter, what technology access did students have other than the loaner calculators? 13. Did you use the test for this chapter that we provided in the Teacher’s Notes? Yes ______ No ______ If yes, what suggestions do you have for improvement? If no, what specific reasons influenced your decision not to use the test? 14. Other comments? Attach additional sheets as needed. Please return this form, along with a copy of the chapter test you administered to students, to Denisse R. Thompson UCSMP

246
University of Chicago School Mathematics Project Algebra: Third Edition
CHAPTER 1 EVALUATION FORM
Teacher __________________________________ School____________________________________
Date Chapter Began _______ Date Chapter Ended ________ No. Class Days (Including Tests) ____
1. Please complete the table below. In column A, circle the number of days you spent on each lesson. In columns B and C, rate the text and questions of each lesson using the following scale.
1 = Disastrous; scrap entirely. (Reason?) 2 = Poor; needs major rewrite. (Suggestions?) 3 = OK; some big changes needed. (Suggestions?) 4 = Good; minor changes needed. (Suggestions?) 5 = Excellent; leave as is.
In columns D and E, respectively, list the specific questions you assigned in the lesson and comment on any parts of the lesson text or questions you think should be changed. Use the other side or an additional sheet of paper if you need more space.
A B C D E
Circle the number of days
you spent on the lesson
Rating Questions Assigned Comments Lesson
Lesson Text Questions
1-1 0 0.5 1 1.5 2 2.5
1-2 0 0.5 1 1.5 2 2.5
1-3 Activity 0 0.5 1 1.5 2 2.5
1-3 0 0.5 1 1.5 2 2.5
1-4 0 0.5 1 1.5 2 2.5
1-5 0 0.5 1 1.5 2 2.5
Self-Test 0 0.5 1 1.5 2 2.5 Chapter Review 0 0.5 1 1.5 2 2.5
2. Overall rating of this chapter. (Use the same rating scale as at the top of the page.) __________

247
3. What comments do you have on the sequence, level of difficulty, or other specific aspects of the content of this chapter?
4. As we revise the student materials for this chapter,
a. What should we definitely not change?
b. What should we definitely change? What ideas do you have for changes that should be made?
7. As we revise the Teacher’s Notes for this chapter,
a. What should we definitely not change?
b. What should we definitely change? What ideas do you have for changes that should be made?
6. Did you use any UCSMP Second Edition materials during this chapter (Lesson Masters, Computer Masters, etc.)? Yes _____ No _____ If yes, how and when?

248
7. While teaching this chapter, did you supplement the text with any materials other than those mentioned in Question 6? Yes _____ No _____ If yes, which materials did you use and when? Why did you use these materials? (If possible, please enclose a copy of the materials you used.)
8. a. Did you as the teacher demonstrate or use a calculator with this chapter? Yes _____ No _____
b. If yes, how did you use the calculator?
c. What comments or suggestions do you have about the way calculator technology is incorporated into this
chapter?
9. a. Did your students use a calculator with this chapter? Yes _____ No _____
b. If yes, how did they use the calculator?
10. a. Did you as the teacher demonstrate or use a computer with this chapter? Yes _____ No _____
b. If yes, how did you use the computer?
c. What comments or suggestions do you have about the way computer technology is incorporated into this
chapter?

249
11. a. Did your students use a computer with this chapter? Yes _____ No _____
b. If yes, how did they use the computer?
12. Did you check out the loaner calculators to students? Yes ______ No ______
If no, why not?
For this chapter, what technology access did students have other than the loaner calculators?
13. Did you use the test for this chapter that we provided in the Teacher’s Notes? Yes ______ No ______ If yes,
what suggestions do you have for improvement?
If no, what specific reasons influenced your decision not to use the test?
14. Other comments? Attach additional sheets as needed.
Please return this form, along with a copy of the chapter test you administered to students, to Denisse R. Thompson

250
APPENDIX E: RESULT TABLES

251
Research Question 1a Pre-‐Transition Mathematics
Table 32 ANOVA Table Using Pre-Transition Mathematics with Posttest 1 (CAT 17 Survey) Percent Correct as DV and OTL Measured by Lesson Coverage as IV
Model Sum of Squares df
Mean Square F Sig.
1 Regression 92949.263 2 46474.631 294.548 .000 Residual 44810.292 284 157.783 Total 137759.555 286
Note: The model is statistically significant at p < .001. Table 33 ANOVA Table Using Pre-Transition Mathematics with Posttest 2 (UC) Percent Correct as DV and OTL Measured by Lesson Coverage as IV
Model Sum of Squares df
Mean Square F Sig.
1 Regression 62234.330 2 31117.165 262.808 .000 Residual 33636.326 284 118.403 Total 95860.656 286
Note: The model is statistically significant at p < .001.
Table 34 ANOVA Table Using Pre-Transition Mathematics with Posttest 3 (PSU) Percent Correct as DV and OTL Measured by Lesson Coverage as IV
Model Sum of Squares df
Mean Square F Sig.
1 Regression 104151.178 2 52075.589 262.452 .000 Residual 56351.202 284 198.420 Total 160502.380 286
Note: The model is statistically significant at p < .001.

252
Transition Mathematics
Table 35 ANOVA Table Using Transition Mathematics Posttest 1 (IAAT) Percent Correct as DV and OTL Measured by Lesson Coverage as IV
Model Sum of Squares Df
Mean Square F Sig.
1 Regression 41888.203 2 20944.102 176.592 .000 Residual 27752.801 234 118.602 Total 69641.005 236
Note: The model is statistically significant at p < .001. Table 36 ANOVA Table Using Transition Mathematics Posttest 2 (Algebra/Geometry Readiness) as DV and OTL Measured by Lesson Coverage as IV
Model Sum of Squares Df
Mean Square F Sig.
1 Regression 39356.416 2 19678.208 156.268 .000 Residual 29466.686 234 125.926 Total 68823.101 236
Note: The model is statistically significant at p < .001. Table 37 ANOVA Table Using Transition Mathematics Posttest 3 (PSU) as DV and OTL Measured by Lesson Coverage as IV
Model Sum of Squares Df
Mean Square F Sig.
1 Regression 57533.045 2 28766.522 90.604 .000 Residual 74294.122 234 317.496 Total 131827.167 236
Note: The model is statistically significant at p < .001.

253
Algebra Table 38 ANOVA Table Using Algebra Posttest 1 (Terra Nova) Percent Correct as DV and OTL Measured by Lesson Coverage as IV
Model Sum of Squares Df
Mean Square F Sig.
1 Regression 57365.683 2 28682.841 133.970 .000 Residual 49028.739 229 214.099 Total 106394.422 231
Note: The model is statistically significant at p < .001. Table 39 ANOVA Table Using Algebra Posttest 2 (UC) Percent Correct as DV and OTL Measured by Lesson Coverage as IV
Model Sum of Squares Df
Mean Square F Sig.
1 Regression 76652.272 2 38326.136 268.364 .000 Residual 32704.370 229 142.814 Total 109356.642 231
Note: The model is statistically significant at p < .001. Table 40 ANOVA Table Using Algebra Posttest 3 (PSU) Percent Correct as DV and OTL Measured by Lesson Coverage as IV
Model Sum of Squares Df
Mean Square F Sig.
1 Regression 66737.925 2 33368.963 138.003 .000 Residual 55371.991 229 241.799 Total 122109.916 231
Note: The model is statistically significant at p < .001.

254
Research Question 1b
Pre-‐Transition Mathematics
Table 41 ANOVA Table Using Pre-Transition Mathematics Posttest 1 (CAT 17 Survey) Percent Correct as DV and OTL Measured by Teacher Reported Covered Items on Posttest 1 as IV
Model Sum of Squares df
Mean Square F Sig.
1 Regression 92558.456 2 46279.228 290.774 .000 Residual 45201.099 284 159.159 Total 137759.555 286
Note: The model is statistically significant at p < .001.
Table 42 ANOVA Table Using Pre-Transition Mathematics Posttest 2 (UC) Percent Correct as DV and OTL Measured by Teacher Reported Covered Items on Posttest 2 as IV
Model Sum of Squares Df
Mean Square F Sig.
1 Regression 63074.073 2 31537.036 273.176 .000 Residual 32786.583 284 115.446 Total 95860.656 286
Note: The model is statistically significant at p < .001. Table 43 ANOVA Table Using Pre-Transition Mathematics Posttest 3 (PSU) Percent Correct as DV and OTL Measured by Teacher Reported Covered Items on Posttest 3 as IV
Model Sum of Squares df
Mean Square F Sig.
1 Regression 108546.936 2 54273.468 296.671 .000 Residual 51955.445 284 182.942 Total 160502.380 286
Note: The model is statistically significant at p < .001.

255
Transition Mathematics Table 44 ANOVA Table Using Transition Mathematics Posttest 1 (IAAT) Percent Correct as DV and OTL Measured by Teacher Reported Covered Items on Posttest 1 as IV
Model Sum of Squares df
Mean Square F Sig.
1 Regression 39583.474 2 19791.737 154.080 .000 Residual 30057.530 234 128.451 Total 69641.005 236
Note: The model is statistically significant at p < .001. Table 45 ANOVA Table Using Transition Mathematics Posttest 2 (Algebra/Geometry Readiness) Percent Correct as DV and OTL Measured by Teacher Reported Covered Items on Posttest 2 as IV
Model Sum of Squares df
Mean Square F Sig.
1 Regression 39130.560 2 19565.280 154.189 .000 Residual 29692.541 234 126.891 Total 68823.101 236
Note: The model is statistically significant at p < .001. Table 46 ANOVA Table Using Transition Mathematics Posttest 3 (PSU) Percent Correct as DV and OTL Measured by Teacher Reported Covered Items on Posttest 3 as IV
Model Sum of Squares Df
Mean Square F Sig.
1 Regression 54916.254 2 27458.127 83.541 .000 Residual 76910.913 234 328.679 Total 131827.167 236
Note: The model is statistically significant at p < .001.

256
Algebra Table 47 ANOVA Table Using Algebra Posttest 1 (Terra Nova) Percent Correct as DV and OTL Measured by Teacher Reported Covered Items on Posttest 1 as IV
Model Sum of Squares df
Mean Square F Sig.
1 Regression 58410.058 2 29205.029 139.378 .000 Residual 47984.364 229 209.539 Total 106394.422 231
Note: The model is statistically significant at p < .001. Table 48 ANOVA Table Using Algebra Posttest 2 (UC) Percent Correct as DV and OTL Measured by Teacher Reported Covered Items on Posttest 2 as IV
Model Sum of Squares Df
Mean Square F Sig.
1 Regression 76986.911 2 38493.455 272.322 .000 Residual 32369.732 229 141.353 Total 109356.642 231
Note: The model is statistically significant at p < .001.
Table 49 ANOVA Table Using Algebra Posttest 3 (PSU) Percent Correct as DV and OTL Measured by Teacher Reported Covered Items on Posttest 3 as IV
Model Sum of Squares df
Mean Square F Sig.
1 Regression 70110.944 2 35055.472 154.382 .000 Residual 51998.972 229 227.070 Total 122109.916 231
Note: The model is statistically significant at p < .001.

257
Research Question 2
Pre-‐Transition Mathematics
Output for Direct Effect of the Homework Types on PTM Posttest 1
Dependent, Independent, and Proposed Mediator Variables: DV = Post1CAT IV = OTLbyLC MEDS = Covering Applying Review Statistical Controls: CONTROL= ZPretest Sample size 287 IV to Mediators (a paths) Coeff se t p Covering .1470 .0461 3.1863 .0016 Applying .5359 .0637 8.4143 .0000 Review .9817 .1093 8.9796 .0000 Direct Effects of Mediators on DV (b paths) Coeff se t p Covering .0999 .1067 .9362 .3500 Applying .3486 .0990 3.5210 .0005 Review -.1055 .0455 -2.3197 .0211 Total Effect of IV on DV (c path) Coeff se t p OTLbyLC .3082 .0626 4.9268 .0000 Direct Effect of IV on DV (c' path) Coeff se t p OTLbyLC .2103 .0691 3.0416 .0026 Partial Effect of Control Variables on DV Coeff se t p ZPretest 14.7772 .8434 17.5204 .0000 Model Summary for DV Model R-sq Adj R-sq F df1 df2 p .7075 .7022 135.9059 5.0000 281.0000 .0000

258
Output for Indirect Effect for Homework Types on PTM Posttest 1 BOOTSTRAP RESULTS FOR INDIRECT EFFECTS Indirect Effects of IV on DV through Proposed Mediators (ab paths) Data Boot Bias SE TOTAL .0979 .0966 -.0013 .0370 Covering .0147 .0146 .0000 .0140 Applying .1868 .1865 -.0003 .0507 Review -.1036 -.1045 -.0009 .0461 C1 -.1721 -.1718 .0003 .0591 C2 .1182 .1191 .0009 .0459 C3 .2904 .2910 .0006 .0878 Bias Corrected Confidence Intervals Lower Upper TOTAL .0294 .1750 Covering -.0109 .0454 Applying .0955 .2941 Review -.2026 -.0185 C1 -.3005 -.0638 C2 .0333 .2175 C3 .1297 .4778 ***************************************************************** Level of Confidence for Confidence Intervals: 95 Number of Bootstrap Resamples: 10000 ***************************************************************** INDIRECT EFFECT CONTRAST DEFINITIONS: Ind_Eff1 MINUS Ind_Eff2 Contrast IndEff_1 IndEff_2 C1 Covering Applying C2 Covering Review C3 Applying Review

259
Output for Direct Effect of the Homework Types on PTM Posttest 2 Dependent, Independent, and Proposed Mediator Variables: DV = Post2UCP IV = OTLbyLC MEDS = Covering Applying Review Statistical Controls: CONTROL= ZPretest Sample size 287 IV to Mediators (a paths) Coeff se t p Covering .1470 .0461 3.1863 .0016 Applying .5359 .0637 8.4143 .0000 Review .9817 .1093 8.9796 .0000 Direct Effects of Mediators on DV (b paths) Coeff se t p Covering .0923 .0953 .9686 .3336 Applying .1621 .0884 1.8341 .0677 Review -.0347 .0406 -.8556 .3929 Total Effect of IV on DV (c path) Coeff se t p OTLbyLC .1752 .0542 3.2319 .0014 Direct Effect of IV on DV (c' path) Coeff se t p OTLbyLC .1088 .0617 1.7636 .0789 Partial Effect of Control Variables on DV Coeff se t p ZPretest 12.9348 .7528 17.1824 .0000 Model Summary for DV Model R-sq Adj R-sq F df1 df2 p .6651 .6591 111.6046 5.0000 281.0000 .0000

260
Output for Indirect Effects for Homework Types on PTM Posttest 2 BOOTSTRAP RESULTS FOR INDIRECT EFFECTS Indirect Effects of IV on DV through Proposed Mediators (ab paths) Data Boot Bias SE TOTAL .0663 .0659 -.0005 .0328 Covering .0136 .0136 .0000 .0125 Applying .0869 .0872 .0004 .0426 Review -.0341 -.0350 -.0009 .0380 C1 -.0733 -.0737 -.0004 .0505 C2 .0477 .0485 .0009 .0382 C3 .1209 .1222 .0012 .0718 Bias Corrected Confidence Intervals Lower Upper TOTAL .0050 .1365 Covering -.0082 .0423 Applying .0080 .1756 Review -.1144 .0354 C1 -.1776 .0219 C2 -.0228 .1282 C3 -.0139 .2685 ***************************************************************** Level of Confidence for Confidence Intervals: 95 Number of Bootstrap Resamples: 10000 ***************************************************************** INDIRECT EFFECT CONTRAST DEFINITIONS: Ind_Eff1 MINUS Ind_Eff2 Contrast IndEff_1 IndEff_2 C1 Covering Applying C2 Covering Review C3 Applying Review

261
Output for Direct Effect of Homework Types on PTM Posttest 3 DV = PSUPerc IV = OTLbyLC MEDS = Covering Applying Review Statistical Controls: CONTROL= ZPretest Sample size 287 IV to Mediators (a paths) Coeff se t p Covering .1470 .0461 3.1863 .0016 Applying .5359 .0637 8.4143 .0000 Review .9817 .1093 8.9796 .0000 Direct Effects of Mediators on DV (b paths) Coeff se t p Covering .1484 .1210 1.2265 .2211 Applying .2512 .1122 2.2385 .0260 Review -.0194 .0515 -.3761 .7072 Total Effect of IV on DV (c path) Coeff se t p OTLbyLC .3361 .0702 4.7912 .0000 Direct Effect of IV on DV (c' path) Coeff se t p OTLbyLC .1987 .0784 2.5359 .0118 Partial Effect of Control Variables on DV Coeff se t p ZPretest 15.7524 .9560 16.4766 .0000 Model Summary for DV Model R-sq Adj R-sq F df1 df2 p .6774 .6716 117.9965 5.0000 281.0000 .0000

262
Output for Indirect Effects of Homework Types on PTM Posttest 3 BOOTSTRAP RESULTS FOR INDIRECT EFFECTS Indirect Effects of IV on DV through Proposed Mediators (ab paths) Data Boot Bias SE TOTAL .1374 .1366 -.0008 .0406 Covering .0218 .0214 -.0004 .0140 Applying .1346 .1352 .0006 .0529 Review -.0190 -.0200 -.0010 .0505 C1 -.1128 -.1138 -.0009 .0608 C2 .0408 .0415 .0006 .0501 C3 .1537 .1552 .0015 .0937 Bias Corrected Confidence Intervals Lower Upper TOTAL .0628 .2225 Covering -.0026 .0532 Applying .0348 .2444 Review -.1211 .0789 C1 -.2384 .0046 C2 -.0560 .1413 C3 -.0233 .3423 ***************************************************************** Level of Confidence for Confidence Intervals: 95 Number of Bootstrap Resamples: 10000 ***************************************************************** INDIRECT EFFECT CONTRAST DEFINITIONS: Ind_Eff1 MINUS Ind_Eff2 Contrast IndEff_1 IndEff_2 C1 Covering Applying C2 Covering Review C3 Applying Review

263
Transition Mathematics
Output for Direct Effects of the Homework Types on TM Posttest 1
Dependent, Independent, and Proposed Mediator Variables: DV = IAATPerc IV = OTLbyLC MEDS = Covering Applying Review Statistical Controls: CONTROL= GainScor Sample size 237 IV to Mediators (a paths) Coeff se t p Covering .0925 .0183 5.0421 .0000 Applying -.1392 .0564 -2.4661 .0144 Review .0482 .1293 .3724 .7100 Direct Effects of Mediators on DV (b paths) Coeff se t p Covering 4.5044 .5501 8.1885 .0000 Applying .4061 .1430 2.8392 .0049 Review -.6242 .0924 -6.7571 .0000 Total Effect of IV on DV (c path) Coeff se t p OTLbyLC .4722 .0920 5.1340 .0000 Direct Effect of IV on DV (c' path) Coeff se t p OTLbyLC .1422 .0957 1.4860 .1387 Partial Effect of Control Variables on DV Coeff se t p GainScor .4903 .0725 6.7672 .0000 Model Summary for DV Model R-sq Adj R-sq F df1 df2 p .4326 .4204 35.2288 5.0000 231.0000 .0000

264
Output for Indirect Effects of the Homework Types on Posttest 1
BOOTSTRAP RESULTS FOR INDIRECT EFFECTS Indirect Effects of IV on DV through Proposed Mediators (ab paths) Data Boot Bias SE TOTAL .3300 .3357 .0057 .0640 Covering .4166 .4164 -.0002 .0958 Applying -.0565 -.0484 .0081 .0300 Review -.0301 -.0322 -.0022 .0715 C1 .4731 .4648 -.0083 .0961 C2 .4466 .4486 .0020 .1579 C3 -.0265 -.0162 .0103 .0857 Bias Corrected Confidence Intervals Lower Upper TOTAL .2113 .4616 Covering .2596 .6406 Applying -.1215 -.0080 Review -.1904 .0959 C1 .3108 .6968 C2 .1892 .8181 C3 -.2114 .1284 ***************************************************************** Level of Confidence for Confidence Intervals: 95 Number of Bootstrap Resamples: 10000 ***************************************************************** INDIRECT EFFECT CONTRAST DEFINITIONS: Ind_Eff1 MINUS Ind_Eff2 Contrast IndEff_1 IndEff_2 C1 Covering Applying C2 Covering Review C3 Applying Review

265
Output for Direct Effects of the Homework Types on TM Posttest 2
Dependent, Independent, and Proposed Mediator Variables: DV = AlgGeoPe IV = OTLbyLC MEDS = Covering Applying Review Statistical Controls: CONTROL= GainScor Sample size 237 IV to Mediators (a paths) Coeff se t p Covering .0907 .0177 5.1217 .0000 Applying -.1475 .0546 -2.7000 .0074 Review .0343 .1251 .2741 .7843 Direct Effects of Mediators on DV (b paths) Coeff se t p Covering 4.3906 .5705 7.6964 .0000 Applying .4131 .1481 2.7901 .0057 Review -.6204 .0956 -6.4879 .0000 Total Effect of IV on DV (c path) Coeff se t p OTLbyLC .3648 .0911 4.0029 .0001 Direct Effect of IV on DV (c' path) Coeff se t p OTLbyLC .0488 .0972 .5025 .6158 Partial Effect of Control Variables on DV Coeff se t p GainScor .5853 .0747 7.8363 .0000 Model Summary for DV Model R-sq Adj R-sq F df1 df2 p .3850 .3716 28.9173 5.0000 231.0000 .0000

266
Output for Indirect Effects of the Homework Types on TM Posttest 2 BOOTSTRAP RESULTS FOR INDIRECT EFFECTS Indirect Effects of IV on DV through Proposed Mediators (ab paths) Data Boot Bias SE TOTAL .3160 .3237 .0077 .0669 Covering .3982 .4011 .0029 .0943 Applying -.0609 -.0526 .0084 .0331 Review -.0213 -.0249 -.0036 .0694 C1 .4591 .4536 -.0055 .0965 C2 .4195 .4260 .0065 .1531 C3 -.0397 -.0277 .0120 .0849 Bias Corrected Confidence Intervals Lower Upper TOTAL .1868 .4466 Covering .2451 .6198 Applying -.1301 -.0058 Review -.1730 .1022 C1 .2929 .6805 C2 .1689 .7754 C3 -.2305 .1067 ***************************************************************** Level of Confidence for Confidence Intervals: 95 Number of Bootstrap Resamples: 10000 ***************************************************************** INDIRECT EFFECT CONTRAST DEFINITIONS: Ind_Eff1 MINUS Ind_Eff2 Contrast IndEff_1 IndEff_2 C1 Covering Applying C2 Covering Review C3 Applying Review

267
Output for Direct Effects of the Homework Types on TM Posttest 3 Dependent, Independent, and Proposed Mediator Variables: DV = PSUPerc IV = OTLbyLC MEDS = Covering Applying Review Statistical Controls: CONTROL= GainScor Sample size 237 IV to Mediators (a paths) Coeff se t p Covering .0785 .0177 4.4285 .0000 Applying -.1741 .0552 -3.1564 .0018 Review -.0622 .1239 -.5015 .6165 Direct Effects of Mediators on DV (b paths) Coeff se t p Covering 4.5831 .5999 7.6398 .0000 Applying .4199 .1564 2.6854 .0078 Review -.5971 .1020 -5.8553 .0000 Total Effect of IV on DV (c path) Coeff se t p OTLbyLC .3519 .0976 3.6069 .0004 Direct Effect of IV on DV (c' path) Coeff se t p OTLbyLC .0279 .1029 .2715 .7862 Partial Effect of Control Variables on DV Coeff se t p GainScor .8833 .0536 16.4835 .0000 Model Summary for DV Model R-sq Adj R-sq F df1 df2 p .6434 .6357 83.3533 5.0000 231.0000 .0000

268
Output for Indirect Effects of the Homework Types for TM Posttest 3
BOOTSTRAP RESULTS FOR INDIRECT EFFECTS Indirect Effects of IV on DV through Proposed Mediators (ab paths) Data Boot Bias SE TOTAL .3240 .3303 .0063 .0691 Covering .3600 .3605 .0005 .0899 Applying -.0731 -.0644 .0087 .0376 Review .0371 .0342 -.0029 .0618 C1 .4331 .4248 -.0083 .0955 C2 .3229 .3263 .0034 .1392 C3 -.1102 -.0986 .0117 .0817 Bias Corrected Confidence Intervals Lower Upper TOTAL .1899 .4604 Covering .2181 .5770 Applying -.1495 -.0072 Review -.0850 .1591 C1 .2623 .6445 C2 .0979 .6496 C3 -.2997 .0247 ***************************************************************** Level of Confidence for Confidence Intervals: 95 Number of Bootstrap Resamples: 10000 ***************************************************************** INDIRECT EFFECT CONTRAST DEFINITIONS: Ind_Eff1 MINUS Ind_Eff2 Contrast IndEff_1 IndEff_2 C1 Covering Applying C2 Covering Review C3 Applying Review

269
Algebra
Output for Direct Effects of the Homework Types on Algebra Posttest 1
Dependent, Independent, and Proposed Mediator Variables: DV = Post1Ter IV = OTLbyLC MEDS = Covering Applying Review Statistical Controls: CONTROL= GrainSco Sample size 232 IV to Mediators (a paths) Coeff se t p Covering .3583 .0489 7.3283 .0000 Applying .3862 .0756 5.1105 .0000 Review .4821 .0781 6.1717 .0000 Direct Effects of Mediators on DV (b paths) Coeff se t p Covering -1.8900 .4137 -4.5684 .0000 Applying .7125 .3832 1.8593 .0643 Review .7555 .2132 3.5430 .0005 Total Effect of IV on DV (c path) Coeff se t p OTLbyLC .5501 .0596 9.2286 .0000 Direct Effect of IV on DV (c' path) Coeff se t p OTLbyLC .5878 .0772 7.6168 .0000 Partial Effect of Control Variables on DV Coeff se t p GrainSco .6183 .0660 9.3654 .0000 Model Summary for DV Model R-sq Adj R-sq F df1 df2 p .6140 .6055 71.9004 5.0000 226.0000 .0000

270
Output for Indirect Effects of the Homework Types on Algebra Posttest 1
BOOTSTRAP RESULTS FOR INDIRECT EFFECTS Indirect Effects of IV on DV through Proposed Mediators (ab paths) Data Boot Bias SE TOTAL -.0378 -.0360 .0018 .0725 Covering -.6771 -.6742 .0029 .1914 Applying .2752 .2719 -.0032 .1742 Review .3642 .3662 .0021 .1185 C1 -.9523 -.9461 .0062 .3541 C2 -1.0413 -1.0404 .0009 .2199 C3 -.0890 -.0943 -.0053 .2531 Bias Corrected Confidence Intervals Lower Upper TOTAL -.1836 .1014 Covering -1.1023 -.3395 Applying -.0299 .6590 Review .1698 .6513 C1 -1.7512 -.3424 C2 -1.5390 -.6671 C3 -.6123 .3855 ***************************************************************** Level of Confidence for Confidence Intervals: 95 Number of Bootstrap Resamples: 10000 ***************************************************************** INDIRECT EFFECT CONTRAST DEFINITIONS: Ind_Eff1 MINUS Ind_Eff2 Contrast IndEff_1 IndEff_2 C1 Covering Applying C2 Covering Review C3 Applying Review

271
Output for Direct Effects of the Homework Types on Algebra Posttest 2
Dependent, Independent, and Proposed Mediator Variables: DV = Post2UCP IV = OTLbyLC MEDS = Covering Applying Review Statistical Controls: CONTROL= GrainSco Sample size 232 IV to Mediators (a paths) Coeff se t p Covering .3542 .0492 7.1958 .0000 Applying .3790 .0761 4.9803 .0000 Review .4699 .0796 5.9057 .0000 Direct Effects of Mediators on DV (b paths) Coeff se t p Covering -2.1121 .4415 -4.7841 .0000 Applying 1.2284 .3944 3.1147 .0021 Review .3578 .2113 1.6931 .0918 Total Effect of IV on DV (c path) Coeff se t p OTLbyLC .5574 .0607 9.1791 .0000 Direct Effect of IV on DV (c' path) Coeff se t p OTLbyLC .6719 .0805 8.3505 .0000 Partial Effect of Control Variables on DV Coeff se t p GrainSco .8137 .0822 9.9000 .0000 Model Summary for DV Model R-sq Adj R-sq F df1 df2 p .5785 .5692 62.0328 5.0000 226.0000 .0000

272
Output for Indirect Effects of the Homework Types on Algebra Posttest 2
BOOTSTRAP RESULTS FOR INDIRECT EFFECTS Indirect Effects of IV on DV through Proposed Mediators (ab paths) Data Boot Bias SE TOTAL -.1145 -.1118 .0027 .0732 Covering -.7482 -.7464 .0018 .1993 Applying .4656 .4642 -.0013 .1830 Review .1681 .1704 .0022 .0945 C1 -1.2138 -1.2107 .0031 .3734 C2 -.9163 -.9168 -.0004 .2101 C3 .2974 .2939 -.0036 .2398 Bias Corrected Confidence Intervals Lower Upper TOTAL -.2633 .0211 Covering -1.2122 -.4063 Applying .1685 .9134 Review .0082 .3799 C1 -2.1078 -.5910 C2 -1.3997 -.5541 C3 -.1189 .8435 ***************************************************************** Level of Confidence for Confidence Intervals: 95 Number of Bootstrap Resamples: 10000 ***************************************************************** INDIRECT EFFECT CONTRAST DEFINITIONS: Ind_Eff1 MINUS Ind_Eff2 Contrast IndEff_1 IndEff_2 C1 Covering Applying C2 Covering Review C3 Applying Review

273
Output for Direct Effects of the Homework Types on Algebra Posttest 3
Dependent, Independent, and Proposed Mediator Variables: DV = PSUPerce IV = OTLbyLC MEDS = Covering Applying Review Statistical Controls: CONTROL= GrainSco Sample size 232 IV to Mediators (a paths) Coeff se t p Covering .3522 .0476 7.4046 .0000 Applying .3757 .0731 5.1428 .0000 Review .4670 .0767 6.0891 .0000 Direct Effects of Mediators on DV (b paths) Coeff se t p Covering -2.2485 .4262 -5.2751 .0000 Applying 1.4527 .3832 3.7909 .0002 Review .2792 .1997 1.3982 .1634 Total Effect of IV on DV (c path) Coeff se t p OTLbyLC .5585 .0603 9.2640 .0000 Direct Effect of IV on DV (c' path) Coeff se t p OTLbyLC .6741 .0776 8.6836 .0000 Partial Effect of Control Variables on DV Coeff se t p GrainSco .7108 .0613 11.5934 .0000 Model Summary for DV Model R-sq Adj R-sq F df1 df2 p .6485 .6408 83.4015 5.0000 226.0000 .0000

274
Output for Indirect Effects of the Homework Types on Algebra Posttest 3
BOOTSTRAP RESULTS FOR INDIRECT EFFECTS Indirect Effects of IV on DV through Proposed Mediators (ab paths) Data Boot Bias SE TOTAL -.1157 -.1155 .0002 .0708 Covering -.7919 -.7938 -.0020 .1945 Applying .5458 .5474 .0016 .1798 Review .1304 .1309 .0006 .0874 C1 -1.3377 -1.3413 -.0036 .3661 C2 -.9222 -.9248 -.0025 .2023 C3 .4155 .4165 .0011 .2311 Bias Corrected Confidence Intervals Lower Upper TOTAL -.2572 .0179 Covering -1.2163 -.4445 Applying .2478 .9658 Review -.0212 .3230 C1 -2.1824 -.7149 C2 -1.3527 -.5625 C3 .0069 .9200 ***************************************************************** Level of Confidence for Confidence Intervals: 95 Number of Bootstrap Resamples: 10000 ***************************************************************** INDIRECT EFFECT CONTRAST DEFINITIONS: Ind_Eff1 MINUS Ind_Eff2 Contrast IndEff_1 IndEff_2 C1 Covering Applying C2 Covering Review C3 Applying Review

275
Research Question 3 Pre-‐Transition Mathematics
Output for Direct Effect of the Homework Types on PTM Posttest 1
Dependent, Independent, and Proposed Mediator Variables: DV = Post1CAT IV = OTLbyPos MEDS = Covering Applying Review Statistical Controls: CONTROL= GainScor Sample size 287 IV to Mediators (a paths) Coeff se t p Covering .5908 .0551 10.7168 .0000 Applying .8587 .0762 11.2687 .0000 Review 1.4699 .1292 11.3809 .0000 Direct Effects of Mediators on DV (b paths) Coeff se t p Covering .4336 .1444 3.0021 .0029 Applying .3559 .1334 2.6674 .0081 Review -.2516 .0640 -3.9309 .0001 Total Effect of IV on DV (c path) Coeff se t p OTLbyPos 1.0621 .1090 9.7413 .0000 Direct Effect of IV on DV (c' path) Coeff se t p OTLbyPos .8702 .1333 6.5269 .0000 Partial Effect of Control Variables on DV Coeff se t p GainScor .5080 .0745 6.8141 .0000 Model Summary for DV Model R-sq Adj R-sq F df1 df2 p .4673 .4578 49.3038 5.0000 281.0000 .0000

276
Output for Indirect Effects of the Homework Types on PTM Posttest 1
BOOTSTRAP RESULTS FOR INDIRECT EFFECTS Indirect Effects of IV on DV through Proposed Mediators (ab paths) Data Boot Bias SE TOTAL .1919 .1905 -.0014 .0890 Covering .2562 .2565 .0004 .0789 Applying .3056 .3031 -.0025 .1057 Review -.3699 -.3691 .0008 .0926 C1 -.0494 -.0465 .0029 .1659 C2 .6260 .6256 -.0004 .1041 C3 .6754 .6721 -.0033 .1779 Bias Corrected Confidence Intervals Lower Upper TOTAL .0169 .3689 Covering .0964 .4048 Applying .0992 .5123 Review -.5575 -.1952 C1 -.3753 .2726 C2 .4251 .8351 C3 .3262 1.0225 ***************************************************************** Level of Confidence for Confidence Intervals: 95 Number of Bootstrap Resamples: 10000 ***************************************************************** INDIRECT EFFECT CONTRAST DEFINITIONS: Ind_Eff1 MINUS Ind_Eff2 Contrast IndEff_1 IndEff_2 C1 Covering Applying C2 Covering Review C3 Applying Review

277
Output for Direct Effects of the Homework Types on PTM Posttest 2
Dependent, Independent, and Proposed Mediator Variables: DV = Post2UCP IV = OTLbyPos MEDS = Covering Applying Review Statistical Controls: CONTROL= GainScor Sample size 287 IV to Mediators (a paths) Coeff se t p Covering .7031 .0517 13.5928 .0000 Applying .8151 .0823 9.9018 .0000 Review .9618 .1480 6.4989 .0000 Direct Effects of Mediators on DV (b paths) Coeff se t p Covering .1756 .1357 1.2942 .1966 Applying .2477 .1161 2.1337 .0337 Review -.1075 .0534 -2.0118 .0452 Total Effect of IV on DV (c path) Coeff se t p OTLbyPos 1.1398 .0923 12.3525 .0000 Direct Effect of IV on DV (c' path) Coeff se t p OTLbyPos .9177 .1170 7.8469 .0000 Partial Effect of Control Variables on DV Coeff se t p GainScor .2919 .0686 4.2537 .0000 Model Summary for DV Model R-sq Adj R-sq F df1 df2 p .3974 .3867 37.0590 5.0000 281.0000 .0000

278
Output for Indirect Effects of the Homework Types on PTM Posttest 2
BOOTSTRAP RESULTS FOR INDIRECT EFFECTS Indirect Effects of IV on DV through Proposed Mediators (ab paths) Data Boot Bias SE TOTAL .2220 .2223 .0003 .0720 Covering .1235 .1247 .0012 .0819 Applying .2019 .2013 -.0006 .0864 Review -.1034 -.1036 -.0003 .0480 C1 -.0784 -.0766 .0018 .1486 C2 .2268 .2283 .0015 .0859 C3 .3053 .3049 -.0004 .1217 Bias Corrected Confidence Intervals Lower Upper TOTAL .0830 .3653 Covering -.0441 .2806 Applying .0378 .3804 Review -.2052 -.0162 C1 -.3859 .1996 C2 .0558 .3926 C3 .0788 .5552 ***************************************************************** Level of Confidence for Confidence Intervals: 95 Number of Bootstrap Resamples: 10000 ***************************************************************** INDIRECT EFFECT CONTRAST DEFINITIONS: Ind_Eff1 MINUS Ind_Eff2 Contrast IndEff_1 IndEff_2 C1 Covering Applying C2 Covering Review C3 Applying Review

279
Output for Direct Effects of the Homework Types on PTM Posttest 3
Dependent, Independent, and Proposed Mediator Variables: DV = PSUPerc IV = OTLbyPos MEDS = Covering Applying Review Statistical Controls: CONTROL= GainScor Sample size 287 IV to Mediators (a paths) Coeff se t p Covering .6117 .0845 7.2375 .0000 Applying 1.1460 .1094 10.4753 .0000 Review 1.1478 .2064 5.5614 .0000 Direct Effects of Mediators on DV (b paths) Coeff se t p Covering .7919 .1394 5.6805 .0000 Applying -.1179 .1448 -.8148 .4159 Review -.0186 .0620 -.2996 .7647 Total Effect of IV on DV (c path) Coeff se t p OTLbyPos 1.5167 .1574 9.6379 .0000 Direct Effect of IV on DV (c' path) Coeff se t p OTLbyPos 1.1888 .1744 6.8158 .0000 Partial Effect of Control Variables on DV Coeff se t p GainScor .5984 .0705 8.4937 .0000 Model Summary for DV Model R-sq Adj R-sq F df1 df2 p .5216 .5131 61.2754 5.0000 281.0000 .0000

280
Output for Indirect Effects of the Homework Types on PTM Posttest 3 BOOTSTRAP RESULTS FOR INDIRECT EFFECTS Indirect Effects of IV on DV through Proposed Mediators (ab paths) Data Boot Bias SE TOTAL .3279 .3260 -.0019 .1065 Covering .4844 .4875 .0032 .0831 Applying -.1352 -.1409 -.0058 .1584 Review -.0213 -.0205 .0008 .0661 C1 .6195 .6285 .0090 .2141 C2 .5057 .5081 .0024 .0957 C3 -.1139 -.1204 -.0065 .2069 Bias Corrected Confidence Intervals Lower Upper TOTAL .1197 .5400 Covering .3229 .6459 Applying -.4516 .1689 Review -.1566 .1047 C1 .1971 1.0411 C2 .3190 .6921 C3 -.5198 .2977 ***************************************************************** Level of Confidence for Confidence Intervals: 95 Number of Bootstrap Resamples: 10000 ***************************************************************** INDIRECT EFFECT CONTRAST DEFINITIONS: Ind_Eff1 MINUS Ind_Eff2 Contrast IndEff_1 IndEff_2 C1 Covering Applying C2 Covering Review C3 Applying Review

281
Transition Mathematics Output for Direct Effects of the Homework Types on TM Posttest 1
Dependent, Independent, and Proposed Mediator Variables: DV = IAATPerc IV = OTLbyIAA MEDS = Covering Applying Review Statistical Controls: CONTROL= GainScor Sample size 237 IV to Mediators (a paths) Coeff se t p Covering .1122 .0342 3.2802 .0012 Applying 1.0829 .0756 14.3205 .0000 Review 1.0000 .2252 4.4416 .0000 Direct Effects of Mediators on DV (b paths) Coeff se t p Covering 4.9822 .4844 10.2846 .0000 Applying .5487 .2107 2.6041 .0098 Review -.7065 .0993 -7.1180 .0000 Total Effect of IV on DV (c path) Coeff se t p OTLbyIAA .1732 .1754 .9875 .3244 Direct Effect of IV on DV (c' path) Coeff se t p OTLbyIAA -.2737 .2288 -1.1959 .2330 Partial Effect of Control Variables on DV Coeff se t p GainScor .4919 .0731 6.7252 .0000 Model Summary for DV Model R-sq Adj R-sq F df1 df2 p .4307 .4184 34.9572 5.0000 231.0000 .0000

282
Output for Indirect Effects of the Homework Types on TM Posttest 1
BOOTSTRAP RESULTS FOR INDIRECT EFFECTS Indirect Effects of IV on DV through Proposed Mediators (ab paths) Data Boot Bias SE TOTAL .4469 .4356 -.0113 .2726 Covering .5592 .5546 -.0046 .1581 Applying .5942 .5805 -.0138 .3203 Review -.7065 -.6995 .0070 .1840 C1 -.0350 -.0259 .0092 .2973 C2 1.2657 1.2541 -.0116 .3287 C3 1.3007 1.2799 -.0208 .4621 Bias Corrected Confidence Intervals Lower Upper TOTAL -.0736 .9890 Covering .2724 .8973 Applying -.0367 1.2243 Review -1.1360 -.3945 C1 -.6080 .5616 C2 .6805 1.9963 C3 .4067 2.2402 ***************************************************************** Level of Confidence for Confidence Intervals: 95 Number of Bootstrap Resamples: 10000 ***************************************************************** INDIRECT EFFECT CONTRAST DEFINITIONS: Ind_Eff1 MINUS Ind_Eff2 Contrast IndEff_1 IndEff_2 C1 Covering Applying C2 Covering Review C3 Applying Review

283
Output for Direct Effects of the Homework Types on TM Posttest 2
Dependent, Independent, and Proposed Mediator Variables: DV = AlgGeoPe IV = OTLbyAlg MEDS = Covering Applying Review Statistical Controls: CONTROL= GainScor Sample size 237 IV to Mediators (a paths) Coeff se t p Covering .0494 .0273 1.8123 .0712 Applying .5041 .0746 6.7556 .0000 Review .0268 .1840 .1457 .8843 Direct Effects of Mediators on DV (b paths) Coeff se t p Covering 3.7123 .5110 7.2642 .0000 Applying -.1173 .1819 -.6446 .5198 Review -.3653 .1082 -3.3761 .0009 Total Effect of IV on DV (c path) Coeff se t p OTLbyAlg .7804 .1288 6.0607 .0000 Direct Effect of IV on DV (c' path) Coeff se t p OTLbyAlg .6659 .1525 4.3659 .0000 Partial Effect of Control Variables on DV Coeff se t p GainScor .5646 .0717 7.8725 .0000 Model Summary for DV Model R-sq Adj R-sq F df1 df2 p .4312 .4189 35.0269 5.0000 231.0000 .0000

284
Output for Indirect Effects of the Homework Types on TM Posttest 2
BOOTSTRAP RESULTS FOR INDIRECT EFFECTS Indirect Effects of IV on DV through Proposed Mediators (ab paths) Data Boot Bias SE TOTAL .1145 .1187 .0042 .1095 Covering .1834 .1688 -.0146 .0759 Applying -.0591 -.0553 .0038 .0868 Review -.0098 .0053 .0150 .0775 C1 .2425 .2241 -.0184 .1090 C2 .1932 .1635 -.0297 .1474 C3 -.0493 -.0606 -.0113 .1109 Bias Corrected Confidence Intervals Lower Upper TOTAL -.1054 .3277 Covering .0466 .3155 Applying -.2467 .1007 Review -.1201 .1624 C1 .0551 .4456 C2 -.0864 .4306 C3 -.2120 .2358 ***************************************************************** Level of Confidence for Confidence Intervals: 95 Number of Bootstrap Resamples: 10000 ***************************************************************** INDIRECT EFFECT CONTRAST DEFINITIONS: Ind_Eff1 MINUS Ind_Eff2 Contrast IndEff_1 IndEff_2 C1 Covering Applying C2 Covering Review C3 Applying Review

285
Output for Direct Effects of the Homework Types on TM Posttest 3
Dependent, Independent, and Proposed Mediator Variables: DV = PSUPerc IV = OTLbyPSU MEDS = Covering Applying Review Statistical Controls: CONTROL= GainScor Sample size 237 IV to Mediators (a paths) Coeff se t p Covering -.1047 .0174 -6.0173 .0000 Applying -.0565 .0569 -.9928 .3218 Review -.8918 .1112 -8.0170 .0000 Direct Effects of Mediators on DV (b paths) Coeff se t p Covering 4.5732 .5218 8.7641 .0000 Applying .2747 .1741 1.5775 .1161 Review -.5037 .1165 -4.3223 .0000 Total Effect of IV on DV (c path) Coeff se t p OTLbyPSU .1341 .1011 1.3263 .1860 Direct Effect of IV on DV (c' path) Coeff se t p OTLbyPSU .1794 .1124 1.5963 .1118 Partial Effect of Control Variables on DV Coeff se t p GainScor .8626 .0547 15.7747 .0000 Model Summary for DV Model R-sq Adj R-sq F df1 df2 p .6472 .6395 84.7406 5.0000 231.0000 .0000

286
Output for Indirect Effects of the Homework Types on TM Posttest 3
BOOTSTRAP RESULTS FOR INDIRECT EFFECTS Indirect Effects of IV on DV through Proposed Mediators (ab paths) Data Boot Bias SE TOTAL -.0452 -.0414 .0038 .0827 Covering -.4789 -.4739 .0050 .0794 Applying -.0155 -.0107 .0048 .0278 Review .4492 .4432 -.0060 .1084 C1 -.4634 -.4632 .0002 .0719 C2 -.9281 -.9171 .0110 .1679 C3 -.4647 -.4539 .0109 .1275 Bias Corrected Confidence Intervals Lower Upper TOTAL -.2000 .1231 Covering -.6548 -.3369 Applying -.1074 .0186 Review .2587 .6888 C1 -.6240 -.3378 C2 -1.3060 -.6360 C3 -.7729 -.2548 ***************************************************************** Level of Confidence for Confidence Intervals: 95 Number of Bootstrap Resamples: 10000 ***************************************************************** INDIRECT EFFECT CONTRAST DEFINITIONS: Ind_Eff1 MINUS Ind_Eff2 Contrast IndEff_1 IndEff_2 C1 Covering Applying C2 Covering Review C3 Applying Review

287
Algebra Output for Direct Effects of the Homework Types on Algebra Posttest
Dependent, Independent, and Proposed Mediator Variables: DV = Post1Ter IV = OTLbyPos MEDS = Covering Applying Review Statistical Controls: CONTROL= GrainSco Sample size 232 IV to Mediators (a paths) Coeff se t p Covering .9241 .0372 24.8644 .0000 Applying 1.2944 .0608 21.2751 .0000 Review 1.3702 .0642 21.3294 .0000 Direct Effects of Mediators on DV (b paths) Coeff se t p Covering -1.1422 .3471 -3.2909 .0012 Applying -.6050 .2937 -2.0602 .0405 Review 1.1627 .1947 5.9716 .0000 Total Effect of IV on DV (c path) Coeff se t p OTLbyPos .8331 .0736 11.3261 .0000 Direct Effect of IV on DV (c' path) Coeff se t p OTLbyPos 1.0787 .1331 8.1053 .0000 Partial Effect of Control Variables on DV Coeff se t p GrainSco .6111 .0649 9.4154 .0000 Model Summary for DV Model R-sq Adj R-sq F df1 df2 p .6242 .6159 75.0672 5.0000 226.0000 .0000

288
Output for Indirect Effects of the Homework Types on Algebra Posttest 1
BOOTSTRAP RESULTS FOR INDIRECT EFFECTS Indirect Effects of IV on DV through Proposed Mediators (ab paths) Data Boot Bias SE TOTAL -.2456 -.2444 .0012 .1324 Covering -1.0555 -1.0463 .0093 .3851 Applying -.7831 -.7799 .0032 .4228 Review 1.5931 1.5818 -.0113 .2563 C1 -.2724 -.2664 .0061 .7626 C2 -2.6486 -2.6280 .0205 .4558 C3 -2.3762 -2.3617 .0145 .6096 Bias Corrected Confidence Intervals Lower Upper TOTAL -.5118 .0055 Covering -1.8096 -.2975 Applying -1.6735 .0007 Review 1.1333 2.1439 C1 -1.7145 1.2959 C2 -3.5752 -1.7849 C3 -3.6551 -1.2558 ***************************************************************** Level of Confidence for Confidence Intervals: 95 Number of Bootstrap Resamples: 10000 ***************************************************************** INDIRECT EFFECT CONTRAST DEFINITIONS: Ind_Eff1 MINUS Ind_Eff2 Contrast IndEff_1 IndEff_2 C1 Covering Applying C2 Covering Review C3 Applying Review

289
Output for Direct Effects of the Homework Types on Algebra Posttest 2
Dependent, Independent, and Proposed Mediator Variables: DV = Post2UCP IV = OTLbyPos MEDS = Covering Applying Review Statistical Controls: CONTROL= GainSco Sample size 232 IV to Mediators (a paths) Coeff se t p Covering 1.1949 .0842 14.1875 .0000 Applying 1.5414 .1357 11.3591 .0000 Review 1.4066 .1552 9.0639 .0000 Direct Effects of Mediators on DV (b paths) Coeff se t p Covering -1.2438 .4787 -2.5983 .0100 Applying -.8269 .3270 -2.5288 .0121 Review 1.6815 .2547 6.6027 .0000 Total Effect of IV on DV (c path) Coeff se t p OTLbyPos .7639 .1417 5.3918 .0000 Direct Effect of IV on DV (c' path) Coeff se t p OTLbyPos 1.1594 .2322 4.9930 .0000 Partial Effect of Control Variables on DV Coeff se t p GrainSco .8286 .0892 9.2882 .0000 Model Summary for DV Model R-sq Adj R-sq F df1 df2 p .5032 .4922 45.7879 5.0000 226.0000 .0000

290
Output for Indirect Effects of the Homework Types on Algebra Posttest 2 Output for Direct Effects of the Homework Types on Algebra Posttest 3 BOOTSTRAP RESULTS FOR INDIRECT EFFECTS Indirect Effects of IV on DV through Proposed Mediators (ab paths) Data Boot Bias SE TOTAL -.3955 -.4018 -.0062 .1962 Covering -1.4862 -1.4673 .0189 .5922 Applying -1.2745 -1.2890 -.0145 .5563 Review 2.3653 2.3546 -.0107 .4981 C1 -.2117 -.1783 .0334 .9661 C2 -3.8515 -3.8219 .0296 .9279 C3 -3.6398 -3.6436 -.0038 .9446 Bias Corrected Confidence Intervals Lower Upper TOTAL -.7803 -.0046 Covering -2.8239 -.4370 Applying -2.5145 -.3043 Review 1.4910 3.4394 C1 -2.1797 1.6741 C2 -5.8868 -2.2202 C3 -5.7251 -2.0274 ***************************************************************** Level of Confidence for Confidence Intervals: 95 Number of Bootstrap Resamples: 10000 ***************************************************************** INDIRECT EFFECT CONTRAST DEFINITIONS: Ind_Eff1 MINUS Ind_Eff2 Contrast IndEff_1 IndEff_2 C1 Covering Applying C2 Covering Review C3 Applying Review

291
Output for Direct Effects of the Homework Types on Algebra Posttest 3
Dependent, Independent, and Proposed Mediator Variables: DV = PSUPerce IV = OTLbyPos MEDS = Covering Applying Review Statistical Controls: CONTROL= GainSco Sample size 232 IV to Mediators (a paths) Coeff se t p Covering .5967 .0443 13.4842 .0000 Applying .7834 .0691 11.3306 .0000 Review .8331 .0744 11.2005 .0000 Direct Effects of Mediators on DV (b paths) Coeff se t p Covering -1.3849 .3529 -3.9242 .0001 Applying .1668 .2999 .5561 .5787 Review .7918 .1814 4.3640 .0000 Total Effect of IV on DV (c path) Coeff se t p OTLbyPos .7426 .0621 11.9644 .0000 Direct Effect of IV on DV (c' path) Coeff se t p OTLbyPos .7787 .0819 9.5104 .0000 Partial Effect of Control Variables on DV Coeff se t p GrainSco .6924 .0599 11.5596 .0000 Model Summary for DV Model R-sq Adj R-sq F df1 df2 p .6652 .6578 89.8199 5.0000 226.0000 .0000
Dependent, Independent, and Proposed Mediator Variables: DV = PSUPerce IV = OTLbyPos MEDS = Covering Applying Review Statistical Controls: CONTROL= GainSco Sample size 232 IV to Mediators (a paths) Coeff se t p Covering .5967 .0443 13.4842 .0000 Applying .7834 .0691 11.3306 .0000 Review .8331 .0744 11.2005 .0000 Direct Effects of Mediators on DV (b paths) Coeff se t p Covering -1.3849 .3529 -3.9242 .0001 Applying .1668 .2999 .5561 .5787 Review .7918 .1814 4.3640 .0000 Total Effect of IV on DV (c path) Coeff se t p OTLbyPos .7426 .0621 11.9644 .0000 Direct Effect of IV on DV (c' path) Coeff se t p OTLbyPos .7787 .0819 9.5104 .0000 Partial Effect of Control Variables on DV Coeff se t p GrainSco .6924 .0599 11.5596 .0000 Model Summary for DV Model R-sq Adj R-sq F df1 df2 p .6652 .6578 89.8199 5.0000 226.0000 .0000

292
Output for Indirect Effects of the Homework Types on Algebra Posttest 3
BOOTSTRAP RESULTS FOR INDIRECT EFFECTS Indirect Effects of IV on DV through Proposed Mediators (ab paths) Data Boot Bias SE TOTAL -.0361 -.0357 .0004 .0617 Covering -.8264 -.8226 .0038 .2559 Applying .1306 .1267 -.0040 .2553 Review .6596 .6602 .0007 .1501 C1 -.9570 -.9493 .0077 .4864 C2 -1.4860 -1.4829 .0031 .3060 C3 -.5289 -.5336 -.0046 .3544 Bias Corrected Confidence Intervals Lower Upper TOTAL -.1573 .0846 Covering -1.3472 -.3464 Applying -.3698 .6220 Review .4001 .9998 C1 -1.9281 -.0314 C2 -2.1317 -.9266 C3 -1.2600 .1267 ***************************************************************** Level of Confidence for Confidence Intervals: 95 Number of Bootstrap Resamples: 10000 ***************************************************************** INDIRECT EFFECT CONTRAST DEFINITIONS: Ind_Eff1 MINUS Ind_Eff2 Contrast IndEff_1 IndEff_2 C1 Covering Applying C2 Covering Review C3 Applying Review

293
APPENDIX F: PERMISSION TO USE INTRUMENTATIONS AND IRB APPROVAL

294
From: Denisse Thompson [email protected] To: Dr. Zalman Usiskin [email protected], Yiting Yu [email protected] Dear Zal, Several students here at USF are going to do their dissertations related to some more detailed analysis of the UCSMP evaluation data. Yiting Yu is the first person who has successfully defended her proposal and has submitted her study to the USF IRB review as using existing data, but with no names of students or teachers. She will use just the numerical codes to connect students and teachers with curriculum. Her study is entitled, The Influence of Types of Homework on Opportunity to Learn and Students' Mathematics Achievement: Examples from the University of Chicago School Mathematics Project. She is using PTM, TM, and Algebra data, just from UCSMP (3rd) edition teachers, and looking at the extent to which the types of homework assigned (Covering, Applying, Review) mediates between teachers' lesson coverage and student achievement. She did a small study on this issue related to just TM and presented results via a poster at ICME 12. There was a lot of interest, and so she has built her dissertation around this, with some revised models and seeing if the same trends hold up across all three middle grades courses. One issue that has come up from our IRB board is how she has permission from U of C to use the data. Would you provide a letter in your capacity as UCSMP Director for her to use the data and the instruments? Thanks. Let me know if you need any further information. Denisse ____________________ Denisse R. Thompson, Ph.D. Professor of Mathematics Education University of South Florida College of Education, Secondary Education 4202 E. Fowler Ave. STOP EDU105 Tampa, FL 33620 813-974-2687 813-974-3837 (fax) [email protected] Past-President, Florida Council of Teachers of Mathematics fctm.net

295
From:Yiting Yu [email protected] To: Dr. Zalman Usiskin <[email protected]> Hi Dr. Usiskin: I am finishing revising my dissertation titled "The Influence of Types of Homework on Opportunity to Learn and Students’ Mathematics Achievement: Examples from the University of Chicago School Mathematics Project". Please grant me permission to include the instrumentations from the UCSMP project as part of my Appendix. Thank you very much! Sincerely, Yiting Yu From: Zalman Usiskin <[email protected]> May 3rd, 2015 To: Yiting Yu <[email protected]> Dear Yiting: I am assuming that you have permission from Denisse Thompson, who ran the original studies, to include copies of the instruments you used in your dissertation studies. If this is the case, then I am happy to give permission for you to include the instruments used in the original UCSMP 3rd edition studies. Zalman Usiskin Professor Emeritus of Education Director, University of Chicago School Mathematics Project The University of Chicago 1225 East 60th Street Chicago, IL 60637

296
From: [email protected] Jan, 8th, 2014 To: [email protected]
IRB Study Approved
To: Yiting Yu
RE: Types of Homework as Mediators on Influence of OTL on Achievement
PI: Yiting Yu
Link: Pro00015704
You are receiving this notification because the above listed study has received Approval by the IRB. For more information, and to access your Approval Letter, navigate to the project workspace by clicking the Link above.
DO NOT REPLY: To ensure a timely response, please direct correspondence to Research Integrity & Compliance either through your project's workspace or the contact information below.
University of South Florida Research Integrity & Compliance, USF Research & Innovation 3702 Spectrum Blvd Suite 165 - Tampa, FL 33612