the impact of capital structure on stock returns ...hej.hyperion.ro/articles/1(3)_2015/hej...
TRANSCRIPT

Hyperion Economic Journal Year III, no.1(3), March 2015
56
The Impact of Capital Structure on Stock Returns: International Evidence
Reza TAHMOORESPOUR, PhD candidate Graduate School of Management (GSM), University Putra Malaysia (UPM)
Mina ALI-ABBAR
Graduate School of Management (GSM), University Putra Malaysia (UPM)
Elias RANDJBARAN
Faculty of Engineering, University Putra Malaysia (UPM)
Aerospace Manufacturing Research Centre (AMRC), Level 7, Tower Block, 43400 UPM Serdang,
Selangor – Malaysia, Tel: +44 (0) 745 2203616, [email protected]
Abstract: This study examines the relationship between capital structure and stock returns of
firms in the following eight countries in the Asia Pacific regionfor a period of 22 years from
1990 to 2012. The methodology is Panel Regression. The results indicate that the effect of
capital structure depends on the nature of industry as well as market. In Australia, China, and
Korea, return of companies in the Basic Material industry have negative relationship with
debt to common equity. Long term debt to common equity positively affects the return of firms
in Australia and Korea in the Basic Material industry.
Keywords: Capital structure, Stock return, Stock market, Industrial sector, Financial ratio,
International markets, Panel data
1. Introduction
Capital structure of a firm is one of the major concerns for managers. Theories in
finance consider debt as one of the factors for financial risk. Thus, level of debt can alters risk
and return of a company. Researchers studied several areas around capital structure for
example the impact of capital structure on stocks return, value of companies, performance of
firms, etc (Onaolapo and Kajola, 2010, Gemmill, 2001). Some scholars examined the impacts
of other factors on capital structure and the determinants of capital structure (Bevan and
Danbolt, 2002, Chang et al., 2009). Several researchers examined the role of industry
classification on capital structure (Arend, 2009, Barclay et al., 1995, Campello, 2003).
Modigliani and Miller (1958a) introduced the capital structure irrelevance theory,
which stated that the amount of debt does not affect market value of a firm. The MM
irrelevance theory stimulated other researchers to provide evidences against the MM
irrelevance theory. Therefore, two major capital structure theories have developed after the
MM irrelevance theory including trade-off and pecking order theories of capital structure.The
research by Frank and Goyal (2007)has shown that the MM capital structure irrelevance
theory fails under a variety of circumstances such as taxes, transaction costs, bankruptcy
costs, agency conflicts, adverse selection, etc. They reviewed the trade-off and pecking order
capital structure theories and found that transaction and bankruptcy costs play crucial roles in
a firm’s financing decisions. They identified the differences among private firms, small and large public firms. They concluded that private firms use retained earnings and bank debt.
Small public firms use equity financing and large public firms use retained earnings and
corporate bonds.
Hyperion Economic Journal Year III, no.1(3), March 2015
57
Kraus & Litzenberger (1973) introduced the classical trade-off capital structure theory,
which refers to the idea that a firm trade off the benefits and drawbacks of both debt and
equity. Hence, managers try to find a balance between costs and benefits of leverage.
Furthermore, agency costs (Jensen and Meckling, 1976) play an important role in deciding
about the balance. Myers (1984) declared that firms have target leverage ratio and during time
they move toward this ratio. Several scholars provided discussions about aspects of Myers’ definition. Therefore, Myers’s definition about target leverage ratio was broken into two parts including static and dynamic (target adjustment) trade-off theories. If a firm’s leverage ratio is identified by single period trade-off, it was called static trade-off theory. A firm is said to
exhibit dynamic (target adjustment) behavior if the firm has a target level of leverage and if
deviations from that target are gradually removed over time (Frank and Goyal, 2007).
Moreover, several scholars studies the tax effect on leverage (Dhaliwal et al., 2006, Graham,
2000, Martin and Sloane, 1980, Miller, 1977).
Myers (1984) argued that firms prefer internal compared to external financing. Based
on pecking order capital structure theory, managers choose retained earnings first, then debt
and finally equity financing. The motivation for the pecking order theory is adverse selection
developed by Myers and Majluf (1984)and Myers (1984).
The remainder of the paper is organized as follows. Section 2 provides a summary of
the literature review. Section 3 presents the data and industry classifications, followed by the
methodology in section 4, empirical results in section 5, implications for managers in section
6, and concluding remarks in section 7.
2. Literature review
DeAngelo and DeAngelo (2006)provided evidence against Miller and Modigliani
(1961). They found that payout policy is not irrelevant and investment policy of a firm is not
the only determinant of value, even in frictionless capital markets. They declared that when
one relaxes the assumptions of Miller and Modigliani to allow retention, pay out policy comes
into effect in exactly the same way that investment policy does.
The second proposition of Miller and Modigliani (1958b, 1963) stated that increasing
in financial leverage would lead to increase in expected stock returns. Nevertheless, several
scholars provide results contradicted to this proposition. Korteweg (2004) used time series
approach and Fama French 3 factor model and found evidences against the MM Proposition 2
that stock returns decline when gearing increases.
There are increasing researches that capital structure affects stock returns and the
results are mixed(Dimitrov and Jain, 2008, Hamada, 1972, Korteweg, 2010, Masulis, 1983,
Bhandari, 1988). Fama and French (1992) and Strong and Xu (1997)used size and book-to-
market equity to examine the cross sectional variation in stock returns. They found that
market and book gearing are positively and negatively related to stock returns respectively.
Masulis (1983)found that two of the major factors that explain stock returns are leverage
multiplied by senior security claims outstanding and variation in debt tax shields.
Most of researches tested the relationship between capital structure and stock returns
only for one way causality; either capital structure affects stock returns or vice versa. Yang,
Lee, Gu, and Lee (2010)considered two way causalities and as a result they treated the capital
structure and stock returns as endogenous variables by utilizing simultaneous equations. They
extended Titman and Wessels (1988) study that used a single equation model to find out the
capital structure determinants. They concluded that the main factors affecting stock returns
are leverage, expected growth, profitability, value, and liquidity.
Therefore, some researchers examined the impacts of stocks return on capital structure
(Baker and Wurgler, 2002a, Lucas and McDonald, 1990, Welch, 2004). M. Baker and J.
Wurgler (2002b)stated that companies issue new equity when the market values are relatively
Hyperion Economic Journal Year III, no.1(3), March 2015
58
high, and repurchase equity when the market values are low. They concluded that capital
structure heavily depends on the past market values.Welch (2004)tested the impact of stock
price on capital structure and found that firms in the United States (U.S.) neither issue nor
repurchase debt or equity to counteract the effects of stock returns on their debt equity ratios.
Moreover, he concluded that stock returns explain around 40 percent of debt ratio changes.
Some scholars found positive relationship between capital structure and stock returns
(Bhandari, 1988, Hamada, 1972, Dhaliwal et al., 2006). Bhandari (1988)asserted that there is
a positive relationship between capital structure and stock returns. He found that this
relationship neither is sensitive to variations in the market proxy nor estimation technique.
Conversely, several researchers found that capital structure negatively affects the stock
returns (Dimitrov and Jain, 2008, Korteweg, 2010, Muradoglu and Sivaprasad, 2009, Penman
et al., 2007).Dimitrov and Jain (2008)argued that variations in financial leverage can provide
better information about economic performance of a firm compared to the information from
earnings and cash flows. Thus, they did not view financial leverage as measure of risk. They
documented on how changes in gearing ratios affect the stock returns. They found that
changes in financial leverage and growth in assets are value relevant beyond the information
in accounting earnings, operating cash flows, and accruals. They focused on contemporaneous
stock returns and argued that there is a negative relationship between financial leverage and
risk-adjusted stock returns.
Korteweg (2010)studied the net benefits to leverage that identified from market values
and betas of a firm’s debt and equity for a panel data from 1994 to 2004. He found that the net
benefit to leverage for median firm is up to 5.5% of firm value. The results about small and
profitable companies to have high optimal leverage ratios are not consistent with theory. He
concluded that firms are on average marginally under levered compared to the optimal
leverage ratio. In addition, Penman, et al.(2007)decomposed book-to-price ratio into two
components including enterprise and leverage, which explains operating and financing risks
respectively. They found that the enterprise part is positively related to stock returns. For the
leverage component, they controlled for size, estimated beta, return volatility, momentum,
and default risk. Unlike the enterprise component, the leverage part is adversely related to
stock returns.
Furthermore, there are several studies examined the relationship between financial
leverage and stocks return. Hovakimian, Opler, and Titman (2001)proclaimed that firms
encounter barriers for setting their target debt ratios. Furthermore, target debt ratio may
changes during time since the profitability and stock price of a firm change.Garlappi and Yan
(2011) considered equity valuation model to study the relationship between financial distress
and asset returns. They found that leverage for firms with high level of financial distress can
explain the changes in stock returns.
Strong and Xu (1997)examined the relationship between expected returns for the
United Kingdom (U.K.) equities and several exogenous variables for the period of 1973 to
1992. They found that expected returns are positively affected by beta, book-to-market equity,
and market leverage. Nevertheless, their results indicated that expected returns of the U.K.
firms are adversely related to market value and book leverage. They used several
combinations for exogenous variables and found that either market-to-book equity or the
leverage factors cause market value to become insignificant. They concluded that either book
leverage and market leverage or book-to-market equity are the only consistently exogenous
variables for the average expected returns. Conversely, the explanatory power of any
combination of exogenous variables for average returns is low.
Ho, Strange, and Piesse (2006) provided evidence asserting conditional pricing effects
of beta, size, and book-to-market equity in the Hong Kong market. They improved their
earlier work by adding another factor, namely financial leverage with regard to market
Hyperion Economic Journal Year III, no.1(3), March 2015
59
situation meaning that market trend is upward or downward (Ho et al., 2008). Their results
indicated that market leverage shows conditional pricing relationship with returns. Their
findings on a non-U.S. market are consistent with results of Pettengill, Sundaram, and Mathur
(1995, Pettengill et al., 2002) for the U.S. market.
Gomes and Schmid (2010)studied the relationship between financial leverage and
stock returns and found that the relationship is more complex compared to the one in static
textbook. They declared that the relation between leverage and stock returns depends on the
investment opportunities available to the firm. They stated that when financial market
imperfections exists, financial leverage and investment opportunities are correlated meaning
that firms with high leverage are also mature firms with more book assets and fewer growth
opportunities. Moreover, they found that book gearing does not significantly affect the stock
returns. However, stock returns positively impacted by market gearing. George and Hwang
(2010)stated that companies with high level of cost consider low leverage to avoid financial
distress; however, they still expose to the systematic risk of bearing such costs in low states.
Moreover, firms with low gearing suffer more than firms with gearing in the case of financial
distress. They found that returns are adversely associated with financial distress and leverage.
Several researches referred to the role of industry on capital structure since the
optimum of capital structure heavily depends on industry that a firm operates. Thus, industry
characteristics is one of the major factors that change the capital structure (Arend, 2009,
Barclay et al., 1995, Bradley et al., 1984, Campello, 2003). Hence, this study inspects the
relationship between capital structure and stock returns separately for each industry. The
relationship between gearing and abnormal return is negative for companies in non-regulated
industries (Muradoğlu and Sivaprasad, 2012). MacKay and Phillips (2005)studied the
importance of industry to financial aspect of firms. They expressed that financial leverage is
higher in concentrated industries. Furthermore, Hou and Robinson (2006) found that firms in
highly concentrated industries earn lowerreturns.
Miao (2005)examined the equilibrium model of capital structure and industry
dynamics. He declared that high growth industries have lower level of leverage. Campello
(2003)studied firm and industry level impacts on capital structure. He found that leverage
adversely affects the sales growth in industries that competitors are relatively unlevered
during bearish market, but not bullish trend. Hull (1999) studied the stock value by how a
firm changes the capital structure in relation to industry leverage ratio norm. He found that
stock returns for firms moving away from industry norm is significantly more negative than
returns for companies moving closer to industry norms. Hence, there is an adverse
relationship between gearing and stock returns.
This research contributes to the literature on capital structure and stock returns in two
major ways. First, by considering eight markets in the Asia Pacific region, that there is lack of
study on this area. Second, this study examines the relationship between capital structure and
stock returns separately for industrial sectors in each market. Thus, results can be helpful for
managers and investors in each industrial sector.
3. Data collection and industry classification
This study examines the relationship between capital structures and returns of the
firms in the following eight countries in the Asia Pacific region: Australia, China, Hong
Kong, Japan, Malaysia, Singapore, South Korea, and Taiwan.The sample in this study
comprises 1082 firms for a period of 22 years from 1990 to 2012 on an annually basis. The
total number of observation for the whole sample is 24,222. All the data were collected from
Datastream database. In each country, industrial sectors were different based on the
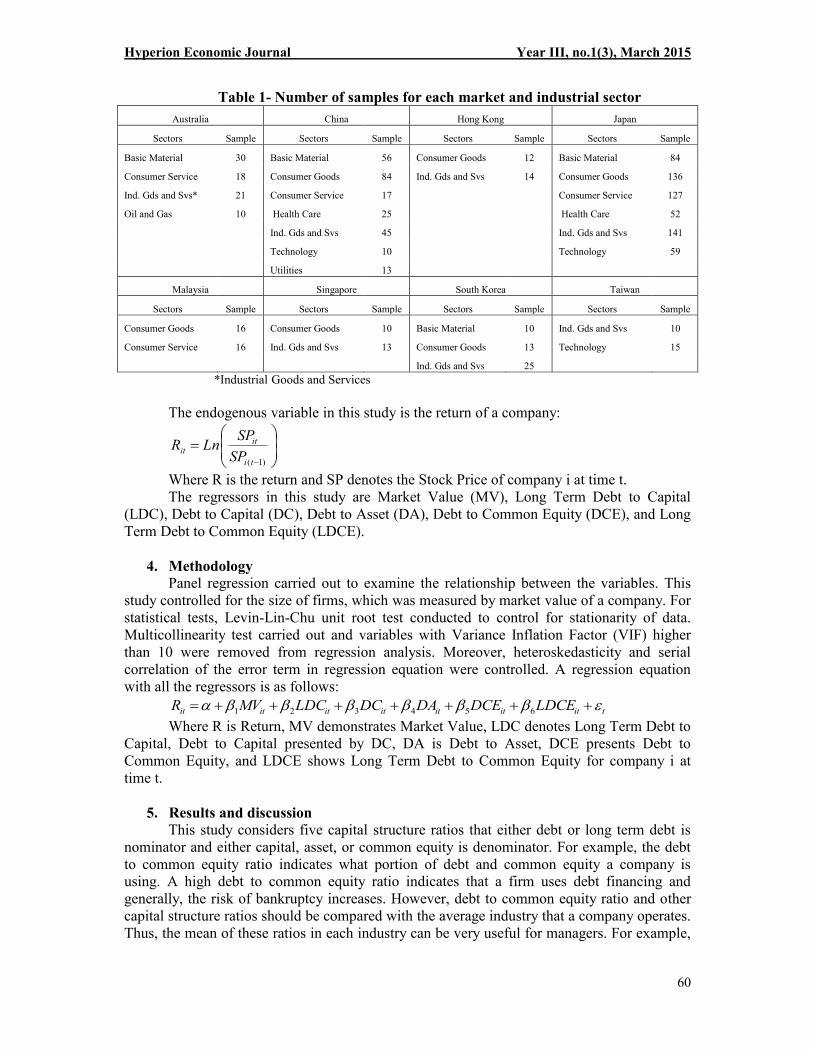
availability of data. Table 1demonstrates the number of sample for each industrial sector.
Hyperion Economic Journal Year III, no.1(3), March 2015
60
Table 1- Number of samples for each market and industrial sector
Australia China Hong Kong Japan
Sectors Sample Sectors Sample Sectors Sample Sectors Sample
Basic Material 30 Basic Material 56 Consumer Goods 12 Basic Material 84
Consumer Service 18 Consumer Goods 84 Ind. Gds and Svs 14 Consumer Goods 136
Ind. Gds and Svs* 21 Consumer Service 17
Consumer Service 127
Oil and Gas 10 Health Care 25
Health Care 52
Ind. Gds and Svs 45
Ind. Gds and Svs 141
Technology 10
Technology 59
Utilities 13
Malaysia Singapore South Korea Taiwan
Sectors Sample Sectors Sample Sectors Sample Sectors Sample
Consumer Goods 16 Consumer Goods 10 Basic Material 10 Ind. Gds and Svs 10
Consumer Service 16 Ind. Gds and Svs 13 Consumer Goods 13 Technology 15
Ind. Gds and Svs 25
*Industrial Goods and Services
The endogenous variable in this study is the return of a company:
÷÷ø
öççè
æ=
- )1(ti
itit
SP
SPLnR
Where R is the return and SP denotes the Stock Price of company i at time t.
The regressors in this study are Market Value (MV), Long Term Debt to Capital
(LDC), Debt to Capital (DC), Debt to Asset (DA), Debt to Common Equity (DCE), and Long
Term Debt to Common Equity (LDCE).
4. Methodology
Panel regression carried out to examine the relationship between the variables. This
study controlled for the size of firms, which was measured by market value of a company. For
statistical tests, Levin-Lin-Chu unit root test conducted to control for stationarity of data.
Multicollinearity test carried out and variables with Variance Inflation Factor (VIF) higher
than 10 were removed from regression analysis. Moreover, heteroskedasticity and serial
correlation of the error term in regression equation were controlled. A regression equation
with all the regressors is as follows:
tititititititit LDCEDCEDADCLDCMVR ebbbbbba +++++++= 654321
Where R is Return, MV demonstrates Market Value, LDC denotes Long Term Debt to
Capital, Debt to Capital presented by DC, DA is Debt to Asset, DCE presents Debt to
Common Equity, and LDCE shows Long Term Debt to Common Equity for company i at
time t.
5. Results and discussion
This study considers five capital structure ratios that either debt or long term debt is
nominator and either capital, asset, or common equity is denominator. For example, the debt
to common equity ratio indicates what portion of debt and common equity a company is
using. A high debt to common equity ratio indicates that a firm uses debt financing and
generally, the risk of bankruptcy increases. However, debt to common equity ratio and other
capital structure ratios should be compared with the average industry that a company operates.
Thus, the mean of these ratios in each industry can be very useful for managers. For example,
Hyperion Economic Journal Year III, no.1(3), March 2015
61
capital intensive industries, such as the Oil and Gas, are more leveraged compared to other
industries.
5.1 Empirical results of Australia
Tables 2 to 5 present the regression results for Australia. In Australia, four industrial
sectors were considered including Basic Material, Consumer Service, Industrial Goods and
Services, and Oil and Gas. The lowest and highest R-squared values are approximately 7%
and 33% for the Basic Material and Oil and Gas sectors respectively. The total number of
observations for Australia is 1,738.
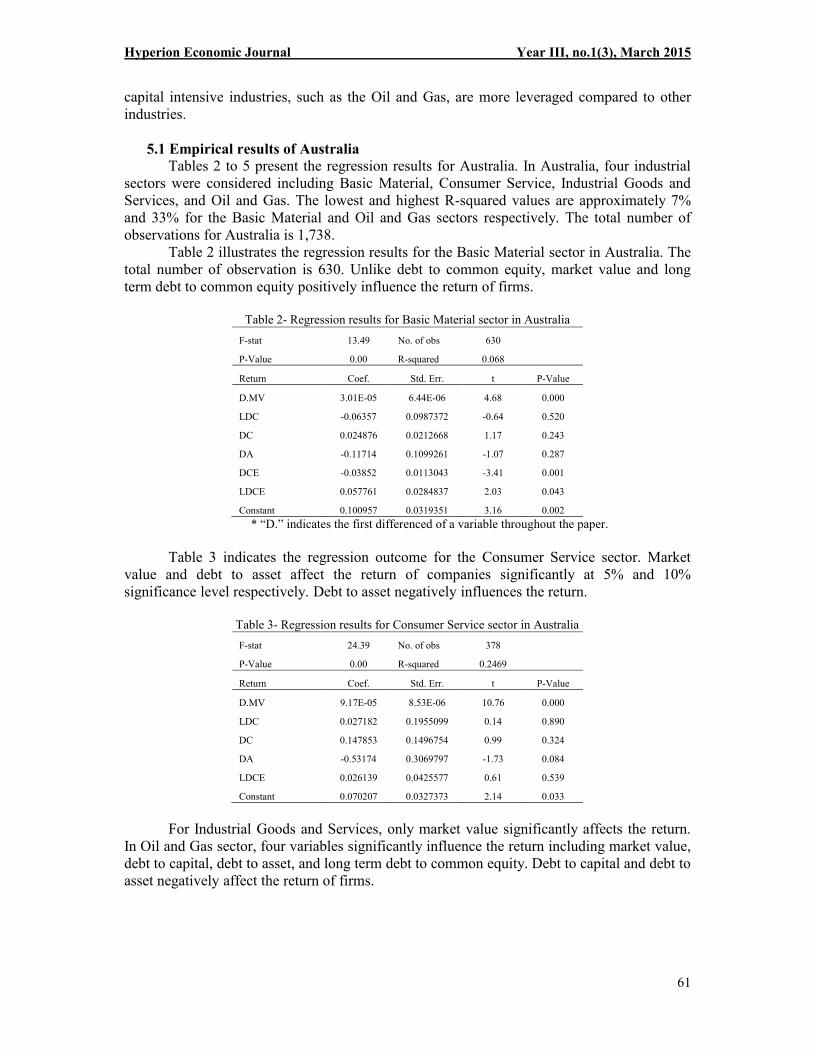
Table 2 illustrates the regression results for the Basic Material sector in Australia. The
total number of observation is 630. Unlike debt to common equity, market value and long
term debt to common equity positively influence the return of firms.
Table 2- Regression results for Basic Material sector in Australia
F-stat 13.49 No. of obs 630
P-Value 0.00 R-squared 0.068
Return Coef. Std. Err. t P-Value
D.MV 3.01E-05 6.44E-06 4.68 0.000
LDC -0.06357 0.0987372 -0.64 0.520
DC 0.024876 0.0212668 1.17 0.243
DA -0.11714 0.1099261 -1.07 0.287
DCE -0.03852 0.0113043 -3.41 0.001
LDCE 0.057761 0.0284837 2.03 0.043
Constant 0.100957 0.0319351 3.16 0.002
* “D.” indicates the first differenced of a variable throughout the paper.
Table 3 indicates the regression outcome for the Consumer Service sector. Market
value and debt to asset affect the return of companies significantly at 5% and 10%
significance level respectively. Debt to asset negatively influences the return.
Table 3- Regression results for Consumer Service sector in Australia
F-stat 24.39 No. of obs 378
P-Value 0.00 R-squared 0.2469
Return Coef. Std. Err. t P-Value
D.MV 9.17E-05 8.53E-06 10.76 0.000
LDC 0.027182 0.1955099 0.14 0.890
DC 0.147853 0.1496754 0.99 0.324
DA -0.53174 0.3069797 -1.73 0.084
LDCE 0.026139 0.0425577 0.61 0.539
Constant 0.070207 0.0327373 2.14 0.033
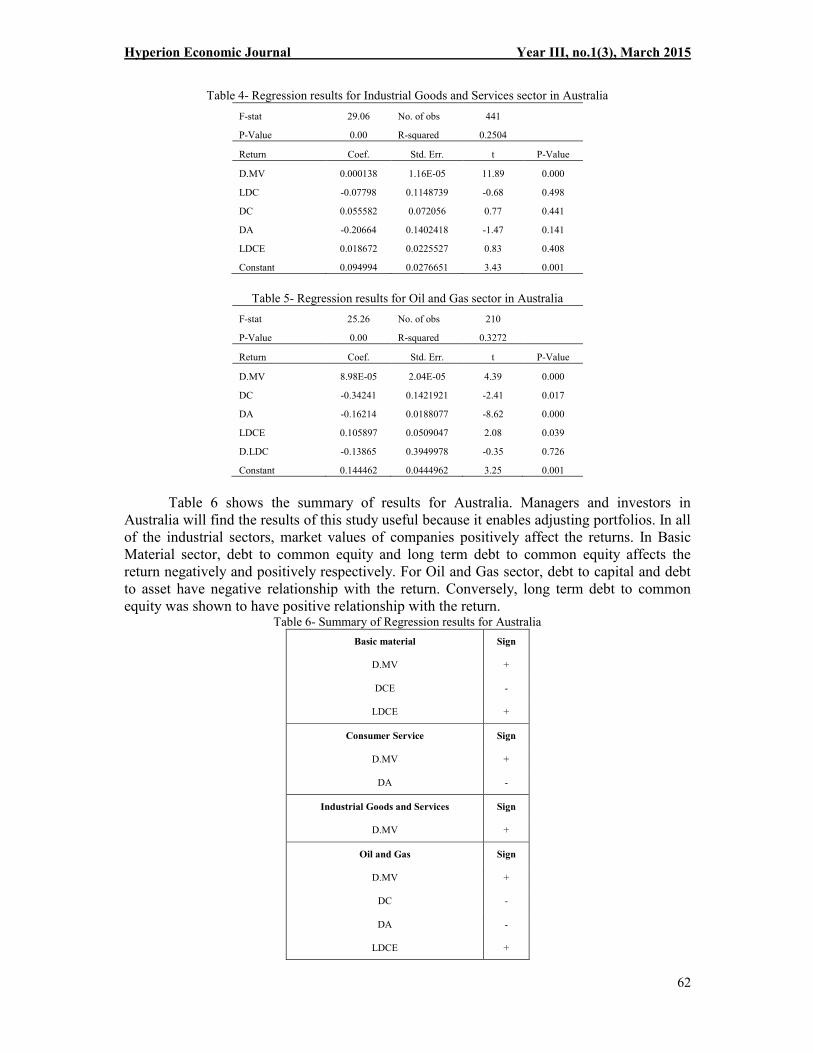
For Industrial Goods and Services, only market value significantly affects the return.
In Oil and Gas sector, four variables significantly influence the return including market value,
debt to capital, debt to asset, and long term debt to common equity. Debt to capital and debt to
asset negatively affect the return of firms.
Hyperion Economic Journal Year III, no.1(3), March 2015
62
Table 4- Regression results for Industrial Goods and Services sector in Australia
F-stat 29.06 No. of obs 441
P-Value 0.00 R-squared 0.2504
Return Coef. Std. Err. t P-Value
D.MV 0.000138 1.16E-05 11.89 0.000
LDC -0.07798 0.1148739 -0.68 0.498
DC 0.055582 0.072056 0.77 0.441
DA -0.20664 0.1402418 -1.47 0.141
LDCE 0.018672 0.0225527 0.83 0.408
Constant 0.094994 0.0276651 3.43 0.001
Table 5- Regression results for Oil and Gas sector in Australia
F-stat 25.26 No. of obs 210
P-Value 0.00 R-squared 0.3272
Return Coef. Std. Err. t P-Value
D.MV 8.98E-05 2.04E-05 4.39 0.000
DC -0.34241 0.1421921 -2.41 0.017
DA -0.16214 0.0188077 -8.62 0.000
LDCE 0.105897 0.0509047 2.08 0.039
D.LDC -0.13865 0.3949978 -0.35 0.726
Constant 0.144462 0.0444962 3.25 0.001
Table 6 shows the summary of results for Australia. Managers and investors in
Australia will find the results of this study useful because it enables adjusting portfolios. In all
of the industrial sectors, market values of companies positively affect the returns. In Basic
Material sector, debt to common equity and long term debt to common equity affects the
return negatively and positively respectively. For Oil and Gas sector, debt to capital and debt
to asset have negative relationship with the return. Conversely, long term debt to common
equity was shown to have positive relationship with the return. Table 6- Summary of Regression results for Australia
Basic material Sign
D.MV +
DCE -
LDCE +
Consumer Service Sign
D.MV +
DA -
Industrial Goods and Services Sign
D.MV +
Oil and Gas Sign
D.MV +
DC -
DA -
LDCE +
Hyperion Economic Journal Year III, no.1(3), March 2015
63
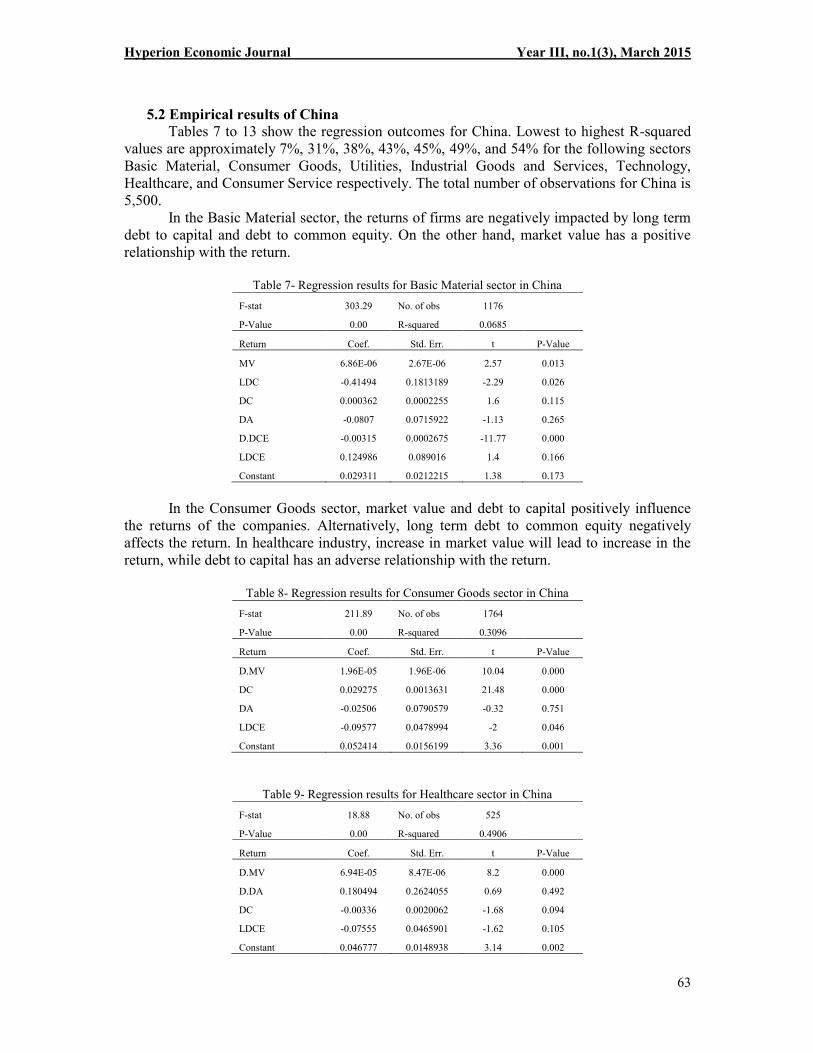
5.2 Empirical results of China
Tables 7 to 13 show the regression outcomes for China. Lowest to highest R-squared
values are approximately 7%, 31%, 38%, 43%, 45%, 49%, and 54% for the following sectors
Basic Material, Consumer Goods, Utilities, Industrial Goods and Services, Technology,
Healthcare, and Consumer Service respectively. The total number of observations for China is
5,500.
In the Basic Material sector, the returns of firms are negatively impacted by long term
debt to capital and debt to common equity. On the other hand, market value has a positive
relationship with the return.
Table 7- Regression results for Basic Material sector in China
F-stat 303.29 No. of obs 1176
P-Value 0.00 R-squared 0.0685
Return Coef. Std. Err. t P-Value
MV 6.86E-06 2.67E-06 2.57 0.013
LDC -0.41494 0.1813189 -2.29 0.026
DC 0.000362 0.0002255 1.6 0.115
DA -0.0807 0.0715922 -1.13 0.265
D.DCE -0.00315 0.0002675 -11.77 0.000
LDCE 0.124986 0.089016 1.4 0.166
Constant 0.029311 0.0212215 1.38 0.173
In the Consumer Goods sector, market value and debt to capital positively influence
the returns of the companies. Alternatively, long term debt to common equity negatively
affects the return. In healthcare industry, increase in market value will lead to increase in the
return, while debt to capital has an adverse relationship with the return.
Table 8- Regression results for Consumer Goods sector in China
F-stat 211.89 No. of obs 1764
P-Value 0.00 R-squared 0.3096
Return Coef. Std. Err. t P-Value
D.MV 1.96E-05 1.96E-06 10.04 0.000
DC 0.029275 0.0013631 21.48 0.000
DA -0.02506 0.0790579 -0.32 0.751
LDCE -0.09577 0.0478994 -2 0.046
Constant 0.052414 0.0156199 3.36 0.001
Table 9- Regression results for Healthcare sector in China
F-stat 18.88 No. of obs 525
P-Value 0.00 R-squared 0.4906
Return Coef. Std. Err. t P-Value
D.MV 6.94E-05 8.47E-06 8.2 0.000
D.DA 0.180494 0.2624055 0.69 0.492
DC -0.00336 0.0020062 -1.68 0.094
LDCE -0.07555 0.0465901 -1.62 0.105
Constant 0.046777 0.0148938 3.14 0.002
Hyperion Economic Journal Year III, no.1(3), March 2015
64
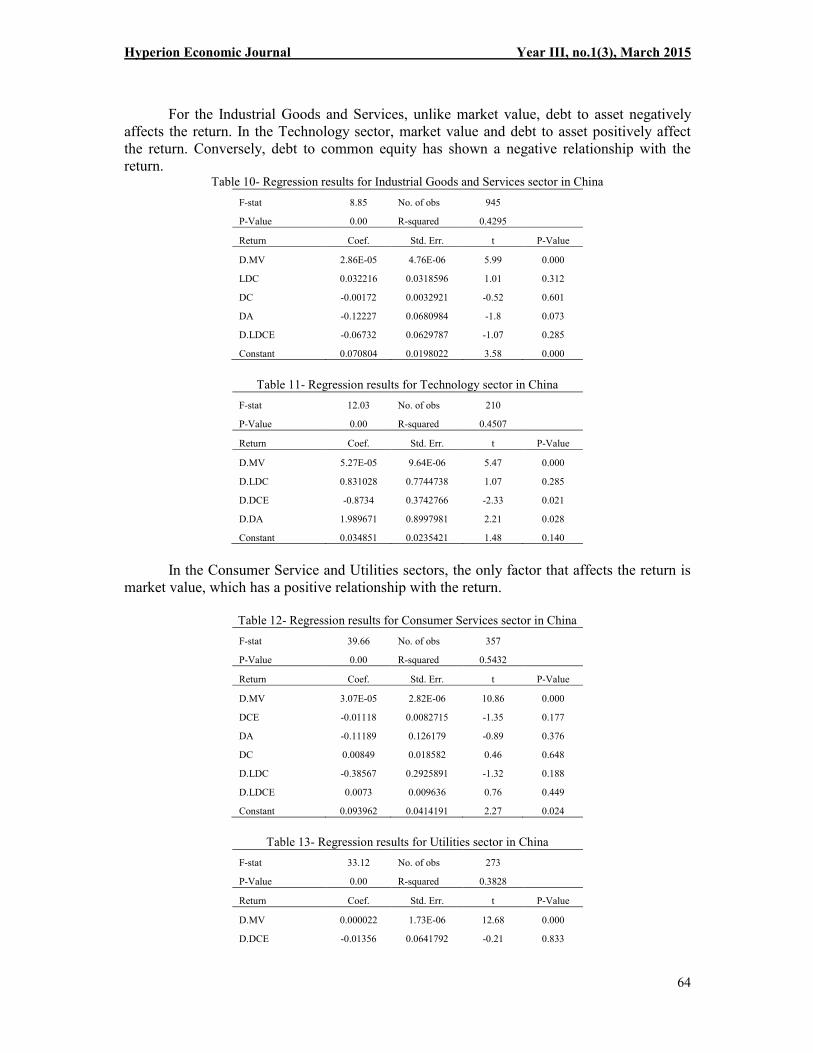
For the Industrial Goods and Services, unlike market value, debt to asset negatively
affects the return. In the Technology sector, market value and debt to asset positively affect
the return. Conversely, debt to common equity has shown a negative relationship with the
return. Table 10- Regression results for Industrial Goods and Services sector in China
F-stat 8.85 No. of obs 945
P-Value 0.00 R-squared 0.4295
Return Coef. Std. Err. t P-Value
D.MV 2.86E-05 4.76E-06 5.99 0.000
LDC 0.032216 0.0318596 1.01 0.312
DC -0.00172 0.0032921 -0.52 0.601
DA -0.12227 0.0680984 -1.8 0.073
D.LDCE -0.06732 0.0629787 -1.07 0.285
Constant 0.070804 0.0198022 3.58 0.000
Table 11- Regression results for Technology sector in China
F-stat 12.03 No. of obs 210
P-Value 0.00 R-squared 0.4507
Return Coef. Std. Err. t P-Value
D.MV 5.27E-05 9.64E-06 5.47 0.000
D.LDC 0.831028 0.7744738 1.07 0.285
D.DCE -0.8734 0.3742766 -2.33 0.021
D.DA 1.989671 0.8997981 2.21 0.028
Constant 0.034851 0.0235421 1.48 0.140
In the Consumer Service and Utilities sectors, the only factor that affects the return is
market value, which has a positive relationship with the return.
Table 12- Regression results for Consumer Services sector in China
F-stat 39.66 No. of obs 357
P-Value 0.00 R-squared 0.5432
Return Coef. Std. Err. t P-Value
D.MV 3.07E-05 2.82E-06 10.86 0.000
DCE -0.01118 0.0082715 -1.35 0.177
DA -0.11189 0.126179 -0.89 0.376
DC 0.00849 0.018582 0.46 0.648
D.LDC -0.38567 0.2925891 -1.32 0.188
D.LDCE 0.0073 0.009636 0.76 0.449
Constant 0.093962 0.0414191 2.27 0.024
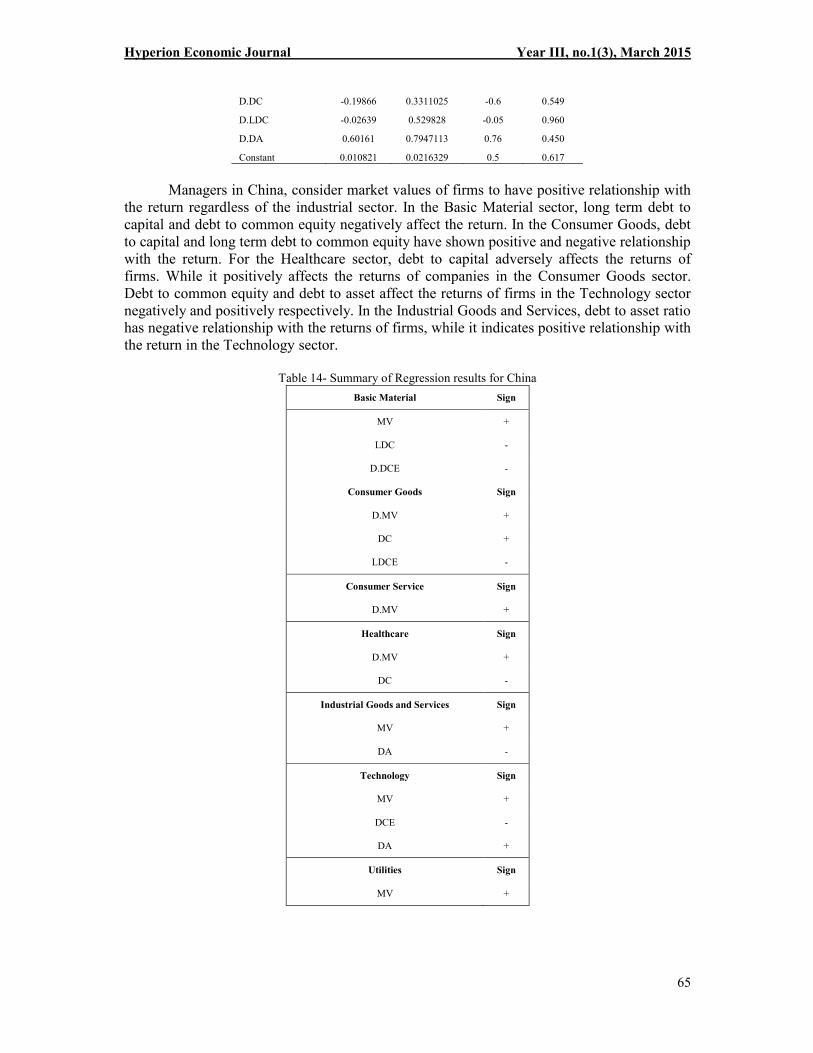
Table 13- Regression results for Utilities sector in China
F-stat 33.12 No. of obs 273
P-Value 0.00 R-squared 0.3828
Return Coef. Std. Err. t P-Value
D.MV 0.000022 1.73E-06 12.68 0.000
D.DCE -0.01356 0.0641792 -0.21 0.833
Hyperion Economic Journal Year III, no.1(3), March 2015
65
D.DC -0.19866 0.3311025 -0.6 0.549
D.LDC -0.02639 0.529828 -0.05 0.960
D.DA 0.60161 0.7947113 0.76 0.450
Constant 0.010821 0.0216329 0.5 0.617
Managers in China, consider market values of firms to have positive relationship with
the return regardless of the industrial sector. In the Basic Material sector, long term debt to
capital and debt to common equity negatively affect the return. In the Consumer Goods, debt
to capital and long term debt to common equity have shown positive and negative relationship
with the return. For the Healthcare sector, debt to capital adversely affects the returns of
firms. While it positively affects the returns of companies in the Consumer Goods sector.
Debt to common equity and debt to asset affect the returns of firms in the Technology sector
negatively and positively respectively. In the Industrial Goods and Services, debt to asset ratio
has negative relationship with the returns of firms, while it indicates positive relationship with
the return in the Technology sector.
Table 14- Summary of Regression results for China
Basic Material Sign
MV +
LDC -
D.DCE -
Consumer Goods Sign
D.MV +
DC +
LDCE -
Consumer Service Sign
D.MV +
Healthcare Sign
D.MV +
DC -
Industrial Goods and Services Sign
MV +
DA -
Technology Sign
MV +
DCE -
DA +
Utilities Sign
MV +
Hyperion Economic Journal Year III, no.1(3), March 2015
66
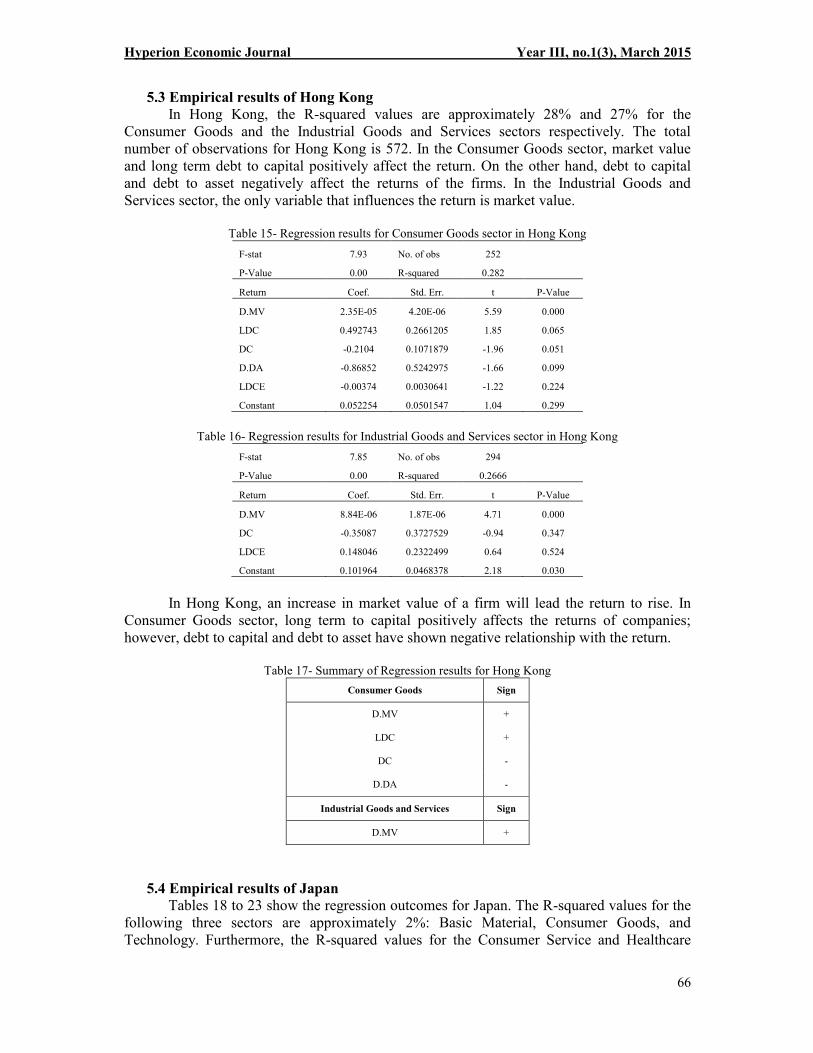
5.3 Empirical results of Hong Kong
In Hong Kong, the R-squared values are approximately 28% and 27% for the
Consumer Goods and the Industrial Goods and Services sectors respectively. The total
number of observations for Hong Kong is 572. In the Consumer Goods sector, market value
and long term debt to capital positively affect the return. On the other hand, debt to capital
and debt to asset negatively affect the returns of the firms. In the Industrial Goods and
Services sector, the only variable that influences the return is market value.
Table 15- Regression results for Consumer Goods sector in Hong Kong
F-stat 7.93 No. of obs 252
P-Value 0.00 R-squared 0.282
Return Coef. Std. Err. t P-Value
D.MV 2.35E-05 4.20E-06 5.59 0.000
LDC 0.492743 0.2661205 1.85 0.065
DC -0.2104 0.1071879 -1.96 0.051
D.DA -0.86852 0.5242975 -1.66 0.099
LDCE -0.00374 0.0030641 -1.22 0.224
Constant 0.052254 0.0501547 1.04 0.299
Table 16- Regression results for Industrial Goods and Services sector in Hong Kong
F-stat 7.85 No. of obs 294
P-Value 0.00 R-squared 0.2666
Return Coef. Std. Err. t P-Value
D.MV 8.84E-06 1.87E-06 4.71 0.000
DC -0.35087 0.3727529 -0.94 0.347
LDCE 0.148046 0.2322499 0.64 0.524
Constant 0.101964 0.0468378 2.18 0.030
In Hong Kong, an increase in market value of a firm will lead the return to rise. In
Consumer Goods sector, long term to capital positively affects the returns of companies;
however, debt to capital and debt to asset have shown negative relationship with the return.
Table 17- Summary of Regression results for Hong Kong
Consumer Goods Sign
D.MV +
LDC +
DC -
D.DA -
Industrial Goods and Services Sign
D.MV +
5.4 Empirical results of Japan
Tables 18 to 23 show the regression outcomes for Japan. The R-squared values for the
following three sectors are approximately 2%: Basic Material, Consumer Goods, and
Technology. Furthermore, the R-squared values for the Consumer Service and Healthcare

Hyperion Economic Journal Year III, no.1(3), March 2015
67
sectors are roughly 1%. Industrial Goods and Services have shown the highest R-squared
value for about 3%. The total number of observations for Japan is 13,178.
Table 18 indicates the regression results for theBasic Material sector in Japan. Unlike
market value, debt to asset and long term debt to common equity ratios adversely influence
the return of firms. Moreover, the returns of firms have most affected debt to asset ratio.
Table 18- Regression results for Basic Material sector in Japan
F-stat 7.11 No. of obs 1764
P-Value 0.00 R-squared 0.0198
Return Coef. Std. Err. t P-Value
MV 1.07E-07 2.49E-08 4.28 0.000
LDC 0.81906 0.1010513 0.81 0.418
DC 0.008888 302493945 0.36 0.716
DA -0.24587 0.1207748 -2.04 0.042
LDCE -0.00631 0.0026578 -2.37 0.018
Constant 0.0079 0.0174901 0.45 0.652
In the Consumer Goods sector, four factors of capital structure significantly affect the
return of companies including market value, debt to capital equity, long term debt to capital,
and debt to capital. The two former variables have shown positive relationship with the return,
while the later ones negatively affect the return of firms. Among these four factors, long term
debt to capital ratio affects the return the most.
Table 19- Regression results for Consumer Goods sector in Japan
F-stat 43.42 No. of obs 2992
P-Value 0.00 R-squared 0.0173
Return Coef. Std. Err. t P-Value
MV 1.85E-08 7.89E-09 2.34 0.021
LDC -0.08401 0.0491749 -1.71 0.090
DC -0.02858 0.0109232 -2.62 0.010
DA -0.0697 0.0565032 -1.23 0.220
DCE 0.002214 0.0004409 5.02 0.000
LDCE -0.00597 0.0055891 -1.07 0.287
Constant 0.009197 0.0067312 1.37 0.174
In the Consumer Service and Healthcare sectors, debt to asset and long term debt to
common equity ratios affect the return of firms negatively respectively. However, in both
sectors, market value positively related with the return of companies.
Table 20- Regression results for Consumer Services sector in Japan
F-stat 10.38 No. of obs 2667
P-Value 0.00 R-squared 0.0102
Return Coef. Std. Err. t P-Value
MV 9.06E-08 2.68E-08 3.39 0.001
DC 0.002383 0.0021634 1.1 0.273
DA -0.07606 0.0317659 -2.39 0.018
DCE -0.00025 0.0018297 -0.14 0.892
LDCE -0.0063 0.0072802 -0.87 0.388

Hyperion Economic Journal Year III, no.1(3), March 2015
68
DLDC -0.01895 0.0174091 -1.09 0.279
Constant 0.003375 0.0095882 0.35 0.725
Table 21- Regression results for Healthcare sector in Japan
F-stat 2.87 No. of obs 1144
P-Value 0.0321 R-squared 0.0102
Return Coef. Std. Err. t P-Value
MV 2.41E-08 1.08E-08 2.22 0.031
LDC 1.29E-01 1.00E-01 1.29 0.204
DC -0.03807 0.0370441 -1.03 0.309
LDCE -0.05654 0.0287097 -1.97 0.054
Constant -0.00667 0.009168 -0.73 0.471
In Industrial Goods and Services sector, market value and debt to capital equity affect
the return of firms positively. On the other hand, long term debt to capital equity and debt to
asset ratios adversely influence the return. Among these four factors, debt to asset affects the
returns of firms the most. For the Technology sector, market value is the only variable that
significantly affects the return.
Table 22- Regression results for Industrial Goods and Services sector in Japan
F-stat 203.42 No. of obs 3102
P-Value 0.00 R-squared 0.0308
Return Coef. Std. Err. t P-Value
MV 9.58E-08 1.53E-08 6.26 0.000
DC -0.00011 0.0003723 -0.29 0.770
DA -0.21803 0.0216144 -10.09 0.000
DCE 0.002679 0.000264 10.15 0.000
LDCE -0.00252 0.0011514 -2.19 0.030
Constant -0.02258 0.0082929 -2.72 0.007
Table 23- Regression results for Technology sector in Japan
F-stat 2.67 No. of obs 1298
P-Value 0.0308 R-squared 0.0191
Return Coef. Std. Err. t P-Value
MV 6.90E-08 2.20E-08 3.13 0.003
LDC -1.21E-01 1.12E-01 -1.07 0.288
DC 0.006634 0.0132559 0.5 0.619
DA 0.033986 0.1202404 0.28 0.778
LDCE -0.00329 0.0138144 -0.25 0.813
Constant -0.04494 0.0150162 -2.99 0.004
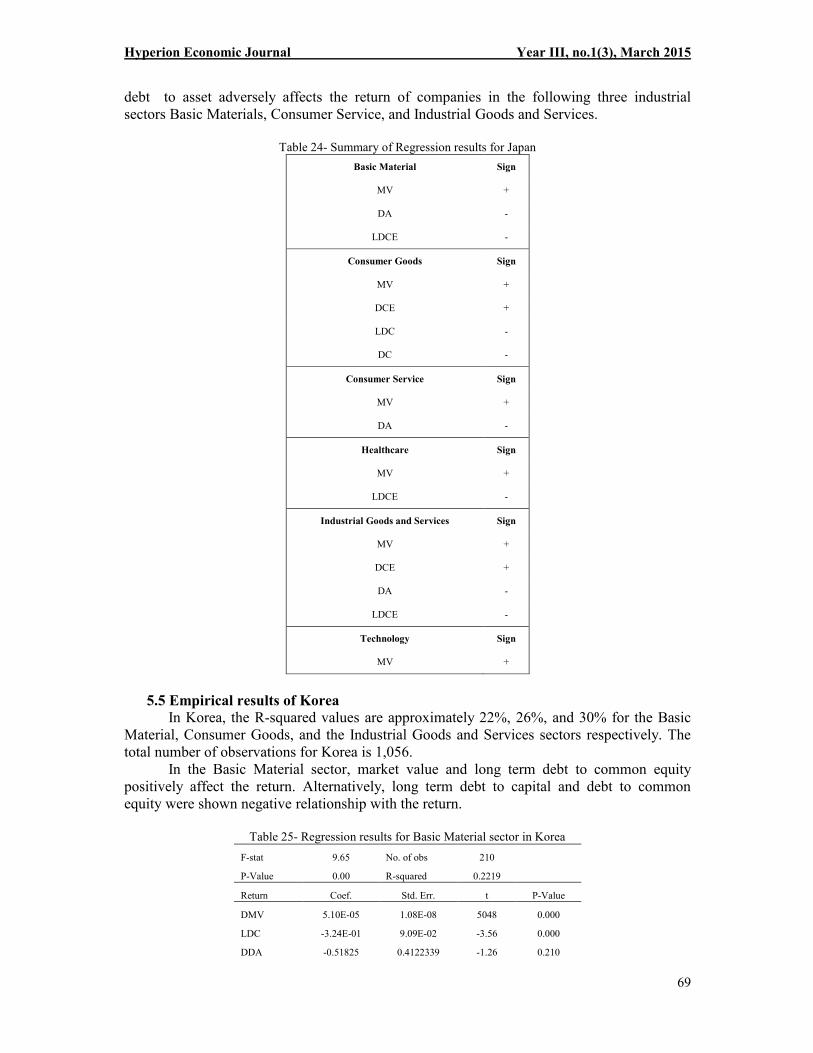
Table 24 shows the summary of results for Japan. Debt to common equity positively
affects the return of firms in the Consumer Goods and Industrial Goods and Services sectors.
Conversely, long term debt to common equity adversely influences the return of firms in three
industrial sectors namely the Basic Material, Healthcare, and Industrial Goods and Services.
Market value positively affects the return of firms in all the industrial sectors. Nevertheless,
Hyperion Economic Journal Year III, no.1(3), March 2015
69
debt to asset adversely affects the return of companies in the following three industrial
sectors Basic Materials, Consumer Service, and Industrial Goods and Services.
Table 24- Summary of Regression results for Japan
Basic Material Sign
MV +
DA -
LDCE -
Consumer Goods Sign
MV +
DCE +
LDC -
DC -
Consumer Service Sign
MV +
DA -
Healthcare Sign
MV +
LDCE -
Industrial Goods and Services Sign
MV +
DCE +
DA -
LDCE -
Technology Sign
MV +
5.5 Empirical results of Korea
In Korea, the R-squared values are approximately 22%, 26%, and 30% for the Basic
Material, Consumer Goods, and the Industrial Goods and Services sectors respectively. The
total number of observations for Korea is 1,056.
In the Basic Material sector, market value and long term debt to common equity
positively affect the return. Alternatively, long term debt to capital and debt to common
equity were shown negative relationship with the return.
Table 25- Regression results for Basic Material sector in Korea
F-stat 9.65 No. of obs 210
P-Value 0.00 R-squared 0.2219
Return Coef. Std. Err. t P-Value
DMV 5.10E-05 1.08E-08 5048 0.000
LDC -3.24E-01 9.09E-02 -3.56 0.000
DDA -0.51825 0.4122339 -1.26 0.210
Hyperion Economic Journal Year III, no.1(3), March 2015
70
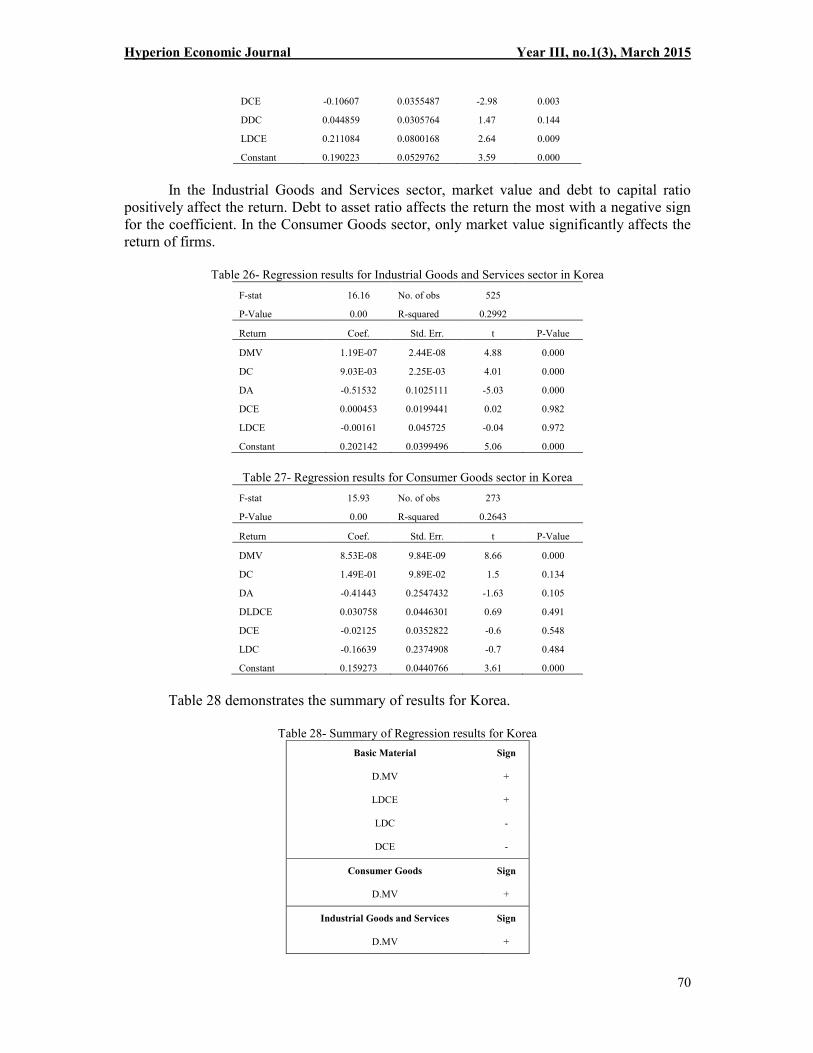
DCE -0.10607 0.0355487 -2.98 0.003
DDC 0.044859 0.0305764 1.47 0.144
LDCE 0.211084 0.0800168 2.64 0.009
Constant 0.190223 0.0529762 3.59 0.000
In the Industrial Goods and Services sector, market value and debt to capital ratio
positively affect the return. Debt to asset ratio affects the return the most with a negative sign
for the coefficient. In the Consumer Goods sector, only market value significantly affects the
return of firms.
Table 26- Regression results for Industrial Goods and Services sector in Korea
F-stat 16.16 No. of obs 525
P-Value 0.00 R-squared 0.2992
Return Coef. Std. Err. t P-Value
DMV 1.19E-07 2.44E-08 4.88 0.000
DC 9.03E-03 2.25E-03 4.01 0.000
DA -0.51532 0.1025111 -5.03 0.000
DCE 0.000453 0.0199441 0.02 0.982
LDCE -0.00161 0.045725 -0.04 0.972
Constant 0.202142 0.0399496 5.06 0.000
Table 27- Regression results for Consumer Goods sector in Korea
F-stat 15.93 No. of obs 273
P-Value 0.00 R-squared 0.2643
Return Coef. Std. Err. t P-Value
DMV 8.53E-08 9.84E-09 8.66 0.000
DC 1.49E-01 9.89E-02 1.5 0.134
DA -0.41443 0.2547432 -1.63 0.105
DLDCE 0.030758 0.0446301 0.69 0.491
DCE -0.02125 0.0352822 -0.6 0.548
LDC -0.16639 0.2374908 -0.7 0.484
Constant 0.159273 0.0440766 3.61 0.000
Table 28 demonstrates the summary of results for Korea.
Table 28- Summary of Regression results for Korea
Basic Material Sign
D.MV +
LDCE +
LDC -
DCE -
Consumer Goods Sign
D.MV +
Industrial Goods and Services Sign
D.MV +
Hyperion Economic Journal Year III, no.1(3), March 2015
71
DC +
DA -
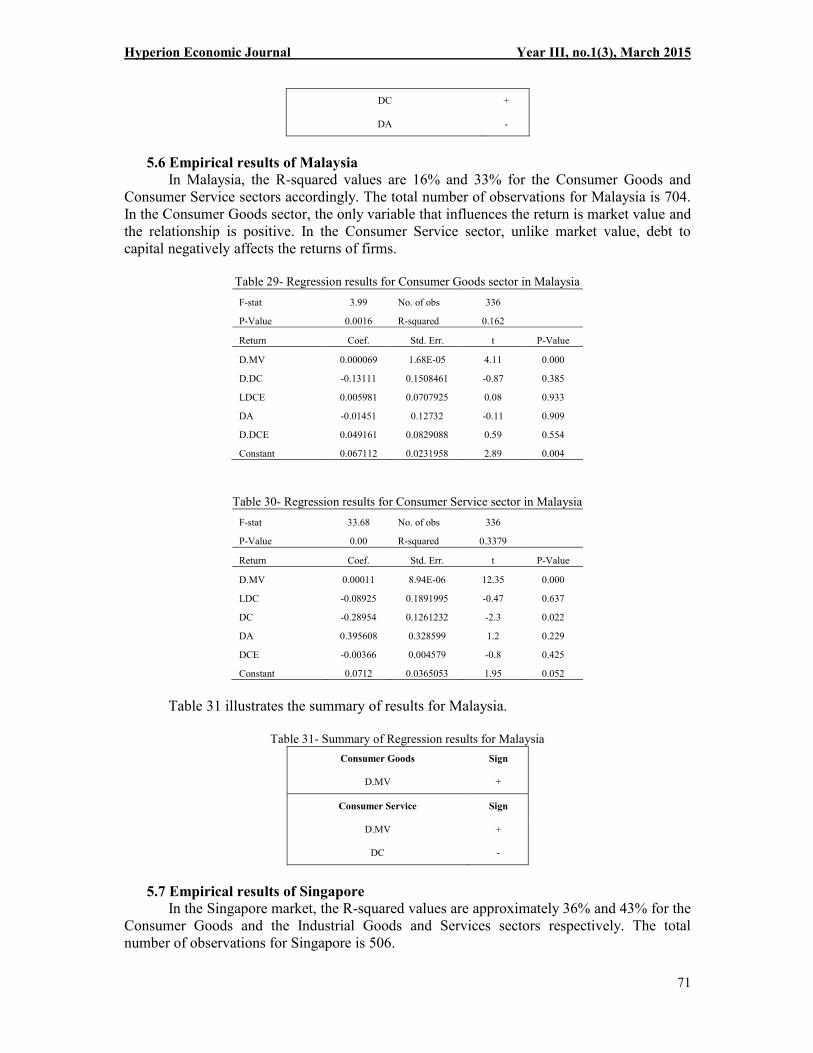
5.6 Empirical results of Malaysia
In Malaysia, the R-squared values are 16% and 33% for the Consumer Goods and
Consumer Service sectors accordingly. The total number of observations for Malaysia is 704.
In the Consumer Goods sector, the only variable that influences the return is market value and
the relationship is positive. In the Consumer Service sector, unlike market value, debt to
capital negatively affects the returns of firms.
Table 29- Regression results for Consumer Goods sector in Malaysia
F-stat 3.99 No. of obs 336
P-Value 0.0016 R-squared 0.162
Return Coef. Std. Err. t P-Value
D.MV 0.000069 1.68E-05 4.11 0.000
D.DC -0.13111 0.1508461 -0.87 0.385
LDCE 0.005981 0.0707925 0.08 0.933
DA -0.01451 0.12732 -0.11 0.909
D.DCE 0.049161 0.0829088 0.59 0.554
Constant 0.067112 0.0231958 2.89 0.004
Table 30- Regression results for Consumer Service sector in Malaysia
F-stat 33.68 No. of obs 336
P-Value 0.00 R-squared 0.3379
Return Coef. Std. Err. t P-Value
D.MV 0.00011 8.94E-06 12.35 0.000
LDC -0.08925 0.1891995 -0.47 0.637
DC -0.28954 0.1261232 -2.3 0.022
DA 0.395608 0.328599 1.2 0.229
DCE -0.00366 0.004579 -0.8 0.425
Constant 0.0712 0.0365053 1.95 0.052
Table 31 illustrates the summary of results for Malaysia.
Table 31- Summary of Regression results for Malaysia
Consumer Goods Sign
D.MV +
Consumer Service Sign
D.MV +
DC -
5.7 Empirical results of Singapore
In the Singapore market, the R-squared values are approximately 36% and 43% for the
Consumer Goods and the Industrial Goods and Services sectors respectively. The total
number of observations for Singapore is 506.
Hyperion Economic Journal Year III, no.1(3), March 2015
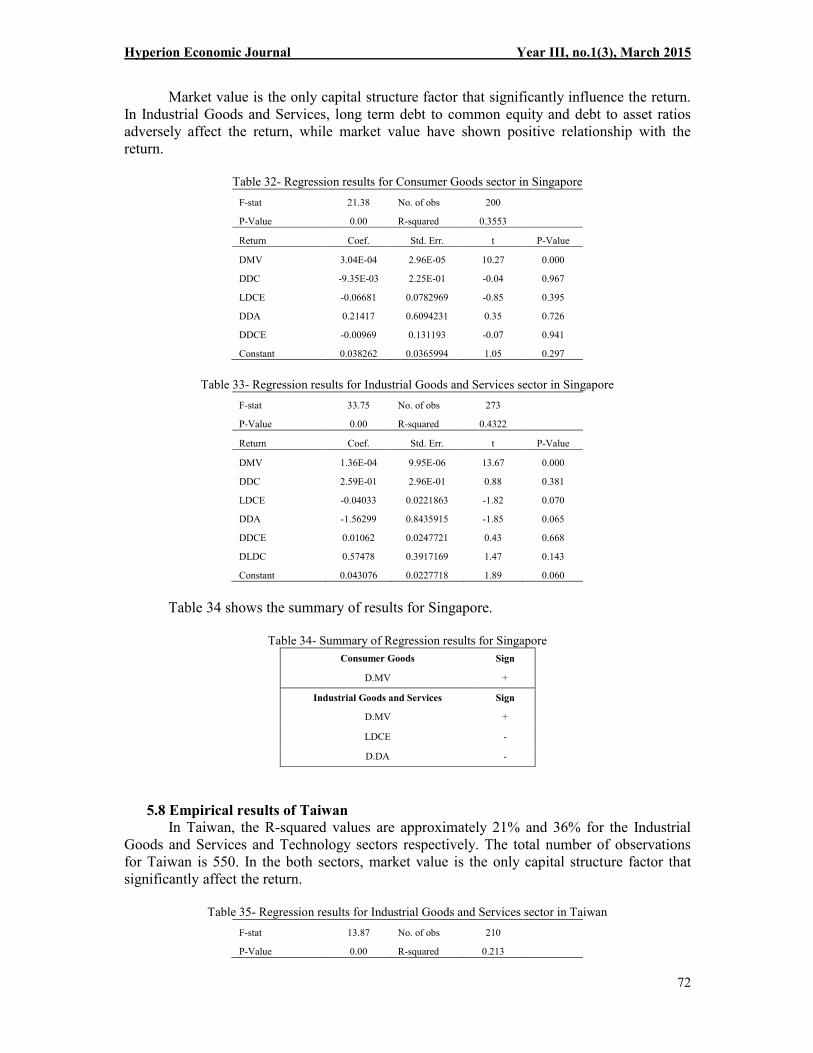
72
Market value is the only capital structure factor that significantly influence the return.
In Industrial Goods and Services, long term debt to common equity and debt to asset ratios
adversely affect the return, while market value have shown positive relationship with the
return.
Table 32- Regression results for Consumer Goods sector in Singapore
F-stat 21.38 No. of obs 200
P-Value 0.00 R-squared 0.3553
Return Coef. Std. Err. t P-Value
DMV 3.04E-04 2.96E-05 10.27 0.000
DDC -9.35E-03 2.25E-01 -0.04 0.967
LDCE -0.06681 0.0782969 -0.85 0.395
DDA 0.21417 0.6094231 0.35 0.726
DDCE -0.00969 0.131193 -0.07 0.941
Constant 0.038262 0.0365994 1.05 0.297
Table 33- Regression results for Industrial Goods and Services sector in Singapore
F-stat 33.75 No. of obs 273
P-Value 0.00 R-squared 0.4322
Return Coef. Std. Err. t P-Value
DMV 1.36E-04 9.95E-06 13.67 0.000
DDC 2.59E-01 2.96E-01 0.88 0.381
LDCE -0.04033 0.0221863 -1.82 0.070
DDA -1.56299 0.8435915 -1.85 0.065
DDCE 0.01062 0.0247721 0.43 0.668
DLDC 0.57478 0.3917169 1.47 0.143
Constant 0.043076 0.0227718 1.89 0.060
Table 34 shows the summary of results for Singapore.
Table 34- Summary of Regression results for Singapore
Consumer Goods Sign
D.MV +
Industrial Goods and Services Sign
D.MV +
LDCE -
D.DA -
5.8 Empirical results of Taiwan
In Taiwan, the R-squared values are approximately 21% and 36% for the Industrial
Goods and Services and Technology sectors respectively. The total number of observations
for Taiwan is 550. In the both sectors, market value is the only capital structure factor that
significantly affect the return.
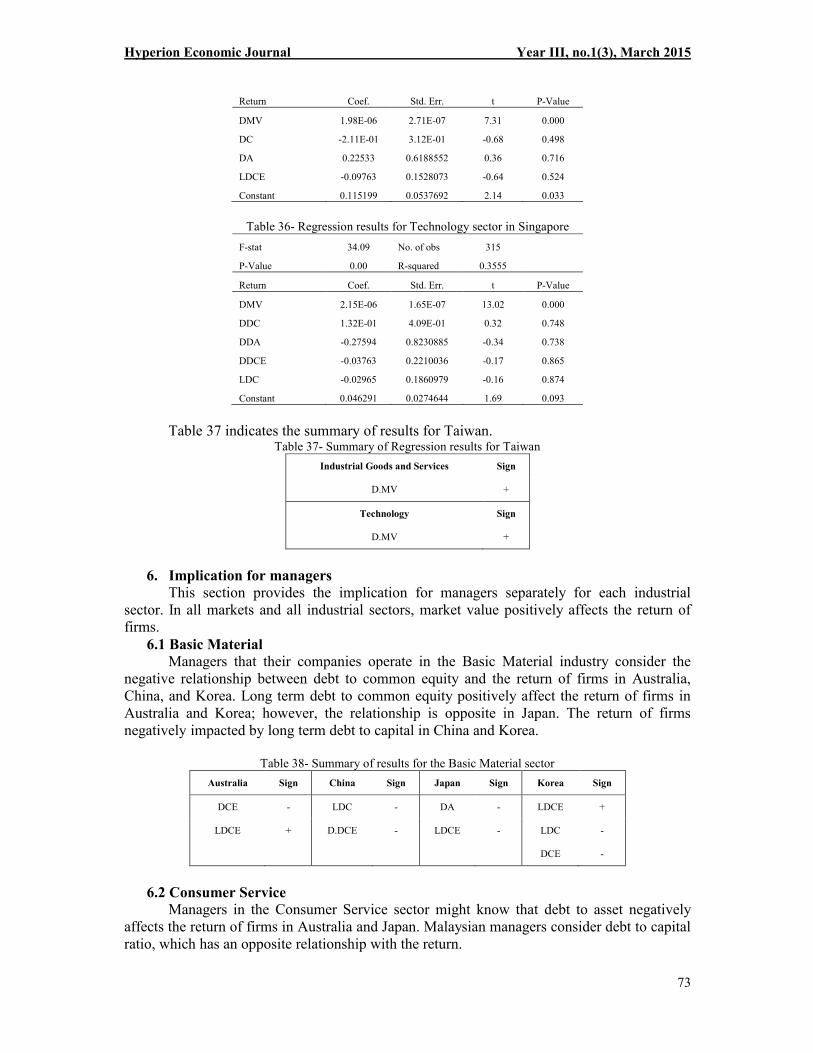
Table 35- Regression results for Industrial Goods and Services sector in Taiwan
F-stat 13.87 No. of obs 210
P-Value 0.00 R-squared 0.213
Hyperion Economic Journal Year III, no.1(3), March 2015
73
Return Coef. Std. Err. t P-Value
DMV 1.98E-06 2.71E-07 7.31 0.000
DC -2.11E-01 3.12E-01 -0.68 0.498
DA 0.22533 0.6188552 0.36 0.716
LDCE -0.09763 0.1528073 -0.64 0.524
Constant 0.115199 0.0537692 2.14 0.033
Table 36- Regression results for Technology sector in Singapore
F-stat 34.09 No. of obs 315
P-Value 0.00 R-squared 0.3555
Return Coef. Std. Err. t P-Value
DMV 2.15E-06 1.65E-07 13.02 0.000
DDC 1.32E-01 4.09E-01 0.32 0.748
DDA -0.27594 0.8230885 -0.34 0.738
DDCE -0.03763 0.2210036 -0.17 0.865
LDC -0.02965 0.1860979 -0.16 0.874
Constant 0.046291 0.0274644 1.69 0.093
Table 37 indicates the summary of results for Taiwan. Table 37- Summary of Regression results for Taiwan
Industrial Goods and Services Sign
D.MV +
Technology Sign
D.MV +
6. Implication for managers
This section provides the implication for managers separately for each industrial
sector. In all markets and all industrial sectors, market value positively affects the return of
firms.
6.1 Basic Material
Managers that their companies operate in the Basic Material industry consider the
negative relationship between debt to common equity and the return of firms in Australia,
China, and Korea. Long term debt to common equity positively affect the return of firms in
Australia and Korea; however, the relationship is opposite in Japan. The return of firms
negatively impacted by long term debt to capital in China and Korea.
Table 38- Summary of results for the Basic Material sector
Australia Sign China Sign Japan Sign Korea Sign
DCE - LDC - DA - LDCE +
LDCE + D.DCE - LDCE - LDC -
DCE -
6.2 Consumer Service
Managers in the Consumer Service sector might know that debt to asset negatively
affects the return of firms in Australia and Japan. Malaysian managers consider debt to capital
ratio, which has an opposite relationship with the return.

Hyperion Economic Journal Year III, no.1(3), March 2015
74
Table 39- Summary of results for the Consumer Service sector
Australia Sign Japan Sign Malaysia Sign
DA - DA - DC -
6.3 Industrial Goods and Services
Managers in the Industrial Goods and Services sector could be aware that the return of
their firms negatively impacted by debt to asset ratio in Korea, China, Japan, and Singapore.
Moreover, long term debt to common equity adversely affects the return of companies in the
Industrial Goods and Services in Japan and Singapore.
Table 40- Summary of results for the Industrial Goods and Services sector
Korea Sign China Sign Japan Sign Singapore Sign
DC + DA - DCE + LDCE -
DA -
DA - D.DA -
LDCE -
6.1. Consumer Goods
Managers that their firms operate in the Consumer Goods sector might know that debt
to capital negatively affects the return in Hong Kong and Japan. Alternatively, return of firms
positively impacted by debt to capital ratio. Long term debt to common equity and debt to
asset adversely affect the return of firms in China and Hong Kong respectively. Table 41- Summary of results for the Consumer Goods sector
China Sign Hong Kong Sign Japan Sign
DC + LDC + DCE +
LDCE - DC - LDC -
D.DA - DC -
6.2. Oil and Gas
In this study, the only Oil and Gas sector is in Australia. Return of firms in this sector
negatively impacted by debt to capital and debt to asset. On the other hand, long term debt to
common equity positively affects the return of firms. Table 42- Summary of results for the Oil and Gas sector
Australia Sign
DC -
DA -
LDCE +
6.4 Healthcare
Debt to capital and long term debt to common equity adversely affect the return of
firms in the Healthcare industry in China and Japan.

Hyperion Economic Journal Year III, no.1(3), March 2015
75
Table 43- Summary of results for the Healthcare sector
China Sign Japan Sign
DC - LDCE -
6.5 Technology
Return of firms in the Technology industry negatively and positively impacted by debt
to common equity and debt to asset respectively in China. Market value is the only factor that
significantly affects the return of firms in this sector in Japan and Taiwan.
Table 44- Summary of results for the Technology sector
China Sign
DCE -
DA +
6.6 Utilities
In this study, the only Utilities sector is in China. Market value is the only factor that
significantly affects the return of firms in this sector in China.
7. Conclusion
This study examines the relationship between capital structure ratios and returns of
firms in the following countries Australia, China, Hong Kong, Japan, South Korea, Malaysia,
Singapore, and Taiwan from 1990 to 2012. The results of this study differ for the countries as
well as the industrial sectors.
In Australia, in the Basic Material industry, adverse relationship between debt to
common equity and the return of a firm was observed. Furthermore, debt to capital of
companies in the Oil and Gas industry has shown a negative relationship with the return. Debt
to asset in the both Consumer Service and Oil and Gas industries negatively affects the return
of firms. Thus, an increase in the value of these ratios would decline the return of a firm.
Conversely, in the both Basic Material and Oil and Gas industries, the return of firms
positively affected by long term debt to common equity. In the Basic Material industry, debt
to common equity and long term debt to common equity negatively and positively affect the
return of firms respectively. Therefore, managers may consider the positive effect of long
term debt on the return of firms.
In China, debt to common equity in the both Basic Material and Technology industries
adversely affect the return of firms. In addition, long term debt to capital and long term debt
to common equity negatively affect the return of companies in the Basic Material and the
Consumer Goods industries respectively. In the Consumer Goods industry, debt to capital
positively affects the return. Alternatively, return of firms in the Healthcare industry adversely
affected by debt to capital. Furthermore, debt to asset has negative impacts on the return of
firms in the Industrial Goods and Services industry. On the other hand, debt to asset positively
affects the return of companies in the Technology industry.
In Hong Kong, long term debt to capital and debt to capital positively and negatively
affect the return of firms respectively. Hence, managers may consider the positive effect of
long term debt on the return of firms.
In Japan, debt to asset and long term debt to common equity adversely affect the return
of firms in the both Basic Material and Industrial Goods and Services industries. In addition,
the return of companies in the Consumer Service and the Healthcare industries negatively
impacted by debt to asset and long term debt to common equity respectively. Debt to common
equity positively affects the return of firms in the both Consumer Goods and Industrial Goods
Hyperion Economic Journal Year III, no.1(3), March 2015
76
and Services industries. Conversely, the return of companies in the Consumer Goods industry
negatively impacted by long term debt to capital and debt to capital ratios.
In Korea, in the Basic Material industry, the return of firms negatively impacted by
long term debt to common equity, debt to common equity, and long term debt to capital. In
the Industrial Goods and Services sector, debt to capital and debt to asset affect the return of
companies positively and negatively respectively.
In Singapore, both long term debt to common equity and debt to asset adversely affect
the return of firms in the Industrial Goods and Services sector.
Acknowledgement
We would like to express our gratitude to Dr. Meysam Safari, whosehelp, stimulating
suggestions, and encouragement helped us in all of the time ofresearch. All errors are ours.
REFRENCES
AREND, R. J. 2009. Industry effects and firm effects: No effect is an island. Journal of
Business Research, 62, 651-659.
BAKER, M. & WURGLER, J. 2002a. Market timing and capital structure. The journal of
finance, 57, 1-32.
BAKER, M. & WURGLER, J. 2002b. Market timing and capital structure. Journal of
Finance, 57, 1-32.
BARCLAY, M. J., SMITH, C. W. & WATTS, R. L. 1995. The determinants of corporate
leverage and dividend policies. Journal of applied corporate finance, 7, 4-19.
BEVAN, A. A. & DANBOLT, J. 2002. Capital structure and its determinants in the UK-a
decompositional analysis. Applied Financial Economics, 12, 159-170.
BHANDARI, L. C. 1988. Debt/equity ratio and expected common stock returns: Empirical
evidence. The journal of finance, 43, 507-528.
BRADLEY, M., JARRELL, G. A. & KIM, E. 1984. On the existence of an optimal capital
structure: Theory and evidence. The journal of finance, 39, 857-878.
CAMPELLO, M. 2003. Capital structure and product markets interactions: evidence from
business cycles. Journal of financial economics, 68, 353-378.
CHANG, C., LEE, A. C. & LEE, C. F. 2009. Determinants of capital structure choice: A
structural equation modeling approach. The quarterly review of economics and
finance, 49, 197-213.
DEANGELO, H. & DEANGELO, L. 2006. The irrelevance of the MM dividend irrelevance
theorem. Journal of financial economics, 79, 293-315.
DHALIWAL, D., HEITZMAN, S. & ZHEN LI, O. 2006. Taxes, leverage, and the cost of
equity capital. Journal of Accounting Research, 44, 691-723.
DIMITROV, V. & JAIN, P. C. 2008. The value-relevance of changes in financial leverage
beyond growth in assets and GAAP earnings. Journal of Accounting, Auditing &
Finance, 23, 191-222.
FAMA, E. F. & FRENCH, K. R. 1992. The cross section of expected stock returns. The
journal of finance, 47, 427-465.
FRANK, M. & GOYAL, V. 2007. Trade-off and pecking order theories of debt. Available at
SSRN 670543.
GARLAPPI, L. & YAN, H. 2011. Financial Distress and the Cross section of Equity Returns.
The journal of finance, 66, 789-822.

Hyperion Economic Journal Year III, no.1(3), March 2015
77
GEMMILL, G. Year. Capital structure and firm value: A study of split-capital closed-end
funds in the UK. In: EFMA 2001 Lugano Meetings, 2001.
GEORGE, T. J. & HWANG, C.-Y. 2010. A resolution of the distress risk and leverage
puzzles in the cross section of stock returns. Journal of financial economics, 96, 56-
79.
GOMES, J. F. & SCHMID, L. 2010. Levered returns. The journal of finance, 65, 467-494.
GRAHAM, J. R. 2000. How big are the tax benefits of debt? Journal of Finance, 55, 1901-
1941.
HAMADA, R. S. 1972. The effect of the firm's capital structure on the systematic risk of
common stocks. The journal of finance, 27, 435-452.
HO, R. Y. W., STRANGE, R. & PIESSE, J. 2006. On the conditional pricing effects of beta,
size, and book-to-market equity in the Hong Kong market. Journal of International
Financial Markets, Institutions and Money, 16, 199-214.
HO, R. Y. W., STRANGE, R. & PIESSE, J. 2008. Corporate financial leverage and asset
pricing in the Hong Kong market. International Business Review, 17, 1-7.
HOU, K. & ROBINSON, D. T. 2006. Industry concentration and average stock returns. The
journal of finance, 61, 1927-1956.
HOVAKIMIAN, A., OPLER, T. & TITMAN, S. 2001. The debt-equity choice. Journal of
Financial and Quantitative analysis, 36, 1-24.
HULL, R. M. 1999. Leverage ratios, industry norms, and stock price reaction: An empirical
investigation of stock-for-debt transactions. Financial Management, 32-45.
JENSEN, M. C. & MECKLING, W. H. 1976. Theory of the firm: Managerial behavior,
agency costs and ownership structure. Journal of financial economics, 3, 305-360.
KORTEWEG, A. 2004. Financial leverage and expected stock returns: evidence from pure
exchange offers. Available at SSRN 597922.
KORTEWEG, A. 2010. The net benefits to leverage. The journal of finance, 65, 2137-2170.
KRAUS, A. & LITZENBERGER, R. H. 1973. A state-preference model of optimal financial
leverage. Journal of Finance, 28, 911-922.
LUCAS, D. J. & MCDONALD, R. L. 1990. Equity issues and stock price dynamics. The
journal of finance, 45, 1019-1043.
MACKAY, P. & PHILLIPS, G. M. 2005. How does industry affect firm financial structure?
Review of Financial Studies, 18, 1433-1466.
MARTIN, D. R. & SLOANE, W. R. 1980. Financial Leverage: A Note on a More Precise
Approach. Journal of Business Finance & Accounting, 7, 585-590.
MASULIS, R. W. 1983. The impact of capital structure change on firm value: Some
estimates. The journal of finance, 38, 107-126.
MIAO, J. 2005. Optimal capital structure and industry dynamics. The journal of finance, 60,
2621-2659.
MILLER, M. H. 1977. Debt and taxes. Journal of Finance, 32, 261-275.
MILLER, M. H. & MODIGLIANI, F. 1961. Dividend policy, growth, and the valuation of
shares. the Journal of Business, 34, 411-433.
MODIGLIANI, F. & MILLER, M. H. 1958a. The cost of capital, corporation finance and the
theory of investment. The American economic review, 48, 261-297.
MODIGLIANI, F. & MILLER, M. H. 1958b. The cost of capital, corporation finance, and the
theory of investment. American Economic Review, 48, 261-297.
MODIGLIANI, F. & MILLER, M. H. 1963. Corporate income taxes and the cost of capital: A
correction. American Economic Review, 53, 433-443.
MURADOGLU, G. & SIVAPRASAD, S. 2009. An Empirical Analysis of Capital Structure
and Abnormal Returns.
Hyperion Economic Journal Year III, no.1(3), March 2015
78
MURADOĞLU, Y. G. & SIVAPRASAD, S. 2012. Capital structure and abnormal returns. International Business Review, 21, 328-341.
MYERS, S. C. 1984. The capital structure puzzle. Journal of Finance, 39, 575-592.
MYERS, S. C. & MAJLUF, N. S. 1984. Corporate financing and investment decisions when
firms have information that investors do not have. Journal of financial economics, 13,
187-221.
ONAOLAPO, A. A. & KAJOLA, S. O. 2010. Capital structure and firm performance:
Evidence from Nigeria. European Journal of Economics, Finance and Administrative
Sciences, 70-82.
PENMAN, S. H., RICHARDSON, S. A. & TUNA, I. 2007. The Book to Price Effect in
Stock Returns: Accounting for Leverage. Journal of Accounting Research, 45, 427-
467.
PETTENGILL, G. N., SUNDARAM, S. & MATHUR, I. 1995. The conditional relation
between beta and returns. Journal of Financial and Quantitative analysis, 30, 101-
116.
PETTENGILL, G. N., SUNDARAM, S. & MATHUR, I. 2002. Payment for risk: Constant
beta vs. dual-beta models. The Financial Review, 37, 123-136.
STRONG, N. & XU, X. G. 1997. Explaining the cross-section of UK expected stock returns.
The British Accounting Review, 29, 1-23.
TITMAN, S. & WESSELS, R. 1988. The determinants of capital structure choice. Journal of
Finance, 43, 1-19.
WELCH, I. 2004. Capital structure and stock returns. Journal of Political Economy, 112, 106-
132.
YANG, C.-C., LEE, C.-F., GU, Y.-X. & LEE, Y.-W. 2010. Co-determination of capital
structure and stock returns—A LISREL approach: An empirical test of Taiwan stock
markets. The quarterly review of economics and finance, 50, 222-233.