the governance environment and innovative smes/media/giawb/enterprisesurveys/... · the governance...
TRANSCRIPT
1
The governance environment and innovative SMEs
Judy S. Yang1
The World Bank
Version: November 8, 2016
This paper examines the impact of the governance environment on SME performance,
concentrating on differences between innovators and non-innovators. A poor environment is
related to lower profits and sales for SME innovators than non-innovators. Using a complementary
indicator, SME innovators tend to have higher sales and profits when courts are perceived to be
strong. On the other hand, the governance environment does not impact large innovative and non-
innovative firm performance differently. Latin America and the Caribbean is a region with many
entrepreneurs but few innovators. The region also has a larger proportion of smaller firms
compared to other regions. In this context, lessons on SME constraints related to governance is
important for developing enabling policies.
Keywords: Firm performance, innovation, SMEs, governance, business environment, Latin
America and the Caribbean,
JEL codes: D22, D73, O31, L25
s Contact: Judy S. Yang: [email protected], The World Bank
The author would like to thank Mohammad Amin for helpful comments, and participants at the 2014 Doing Business: Past, Present
and Future of Business Regulation conference. All errors are my own.
The findings, interpretations, and conclusions expressed in this paper are entirely those of the author. They do not necessarily
represent the views of the International Bank for Reconstruction and Development/World Bank and its affiliated organizations, or
those of the Executive Directors of the World Bank or the governments they represent.
2
1. Introduction
Latin America and the Caribbean (LAC) is a region with many entrepreneurs, characterized by
a large number of business owners per capita. Yet there is not a large presence of innovative
activity (Lederman et al, 2014). LAC also has a higher proportion of SMEs than other regions in
the world (World Bank, 2014), but SMEs innovate less than large firms. Using firm-level panel
data collected by the World Bank, small, medium, and large firms in LAC innovated at 27.5, 38.1,
and 42.1 percent respectively2. Annual sales and profits from SME innovators are lower than non-
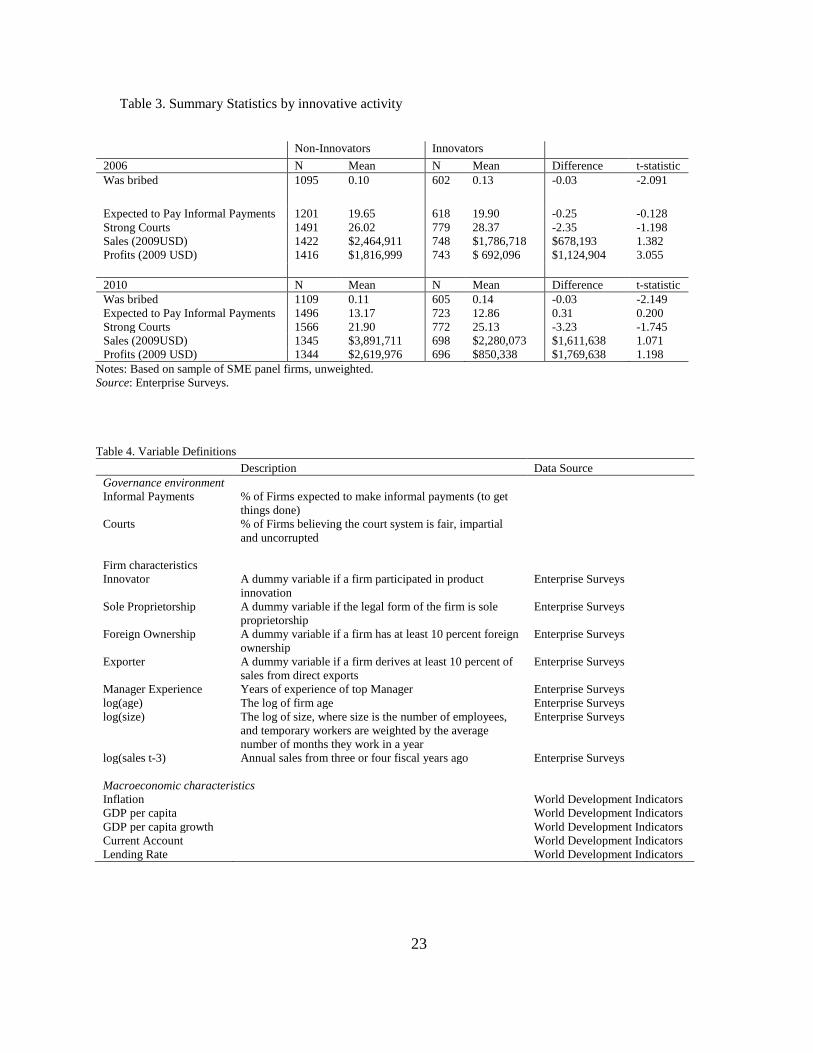
innovators. Moreover, in 2010, 14 percent of innovative SMEs in LAC were bribed when
conducting business transactions compared to 11 percent of SMEs that did not innovate; this
difference is significant (Table 3). In contrary, in Europe and Central Asia, there is no significant
difference in how often firms are bribed according to their innovation activity. These findings
highlight potential challenges to innovation activity and growth for SMEs in the LAC region.
This study shows that there are differential effects from a poor governance environment on
SMEs by whether or not they are innovators3. Results show that innovative SMEs experience lower
sales and profits than non-innovators when they operate in poor governance environments,
measured by the percent of firms expected to pay informal payments “to get things done”.
Complementarily, when perceptions of the court system are better, innovative SMEs have higher
sales and profits than non-innovators as is expected in developed countries.
While corruption has been linked to reduced innovation, there is limited literature linking these
two aspects to firm sales and profits. A poor climate for doing business obstructs firms from
bringing ideas to market and hurts innovation and growth (Pagés, 2010). Paunov (2016) uses firm-
level data from 48 countries and finds that corruption lowers the adoption of quality certificates
and machinery investments. Anokhin and Schulze (2009) use cross-country data from 64 countries
and find support that increasing the control of corruption can rise levels of innovation and
entrepreneurship.
2 Based on a set of panel firms from 14 LAC countries in 2006 and 2010. 3 Firms are innovators if they have created new or significantly modified products in the last 3 years. This is an objective measure
in the Enterprise Surveys.
3
In some country studies, corruption was found to negatively affect firm-level outcomes,
however results vary by country4. These papers also do not investigate why impacts may differ for
firms that are innovators. Given the relation of innovation to growth, this is an important question.
The literature has also linked the quality of governance to various measures of firm performance
such as investment growth, employment growth, total factor productivity, and sales growth. Yet,
these results either utilized perception-based measures of corruption or do not find a significant or
robust effect from corruption onto firm sales growth, investment, nor employment growth5.
This paper expands on the literature of firm-level analysis of corruption and innovation by
linking these features to firm performance, as well as focusing on SMEs. The subset of SMEs is
important to study in isolation as there is a very high proportion of SMEs in LAC, and the size of
the SME sector has been linked to growth (Beck, Demirguc-Kunt, and Levine, 2005). In terms of
SME constraints, a well-developed literature exists on access to finance as a constraint6, but lesser
literature exists on the impacts of governance. This paper finds that sales and profits among SME
innovators are lower when the governance environment is poor. In terms of policy, this is
important. Private sector development policies are frequently aimed at SMEs since the imbalance
between small and large stakeholders are often viewed to be a reason for inequity. Reforms in
strengthening good governance and easing the process for firm operations may increase the
propensity to innovate in LAC and also contribute to growth.
Firm-level analysis is important since corruption can affect firms differently depending on their
characteristics. Recognizing which type of firms are sensitive to corruption or poor governance is
important to develop targeted and evidence based policy7. Many well-cited research on corruption
often focuses on effects conditional on country and institutional characteristics and not firm-level
characteristics8. It is important to underscore differences across firms and differential impacts from
4 See Fisman & Svensson 200); Francisco & Pontara 2007; Hallward-Driemeier et al 2006; Honorati & Mengistae 2005; Bastos &
Nasir 2004; Beck et al 2005; Carlin et al 2006; Gaviria 2002.
5 See Aterido et al 2010; Aterido et al 2011; Asiedu 2009, Bastos & Nasir 2004; Beck et al 2005; Dollar et al 2005, 2006; Escribano
& Guasch 2005; Hallward-Driemeier et al 2006; Seker & Yang 2014; Bhaumik & Estrin 2007; see Dethier et al 2010 review of
Enterprise Surveys literature. 6 Just to cite a few: Carpenter and Petersen 2002; Beck and Demirguc-Kunt, 2006; Hutchinson and Xavier 2006. 7 See World Bank 2004; Pande & Udry 2005; Durlauf et al 2008; Dethier et al 2010 8 See Belitski, Chowdhury, and Desai 2016; Mauro 1995; Kaufmann et al 2004; Mo 2001; Wei 2000; Lambsdorff 2003; Johnson
et al 2011; Djankov et al 2002; Shleifer & Vishny 1993; Seligson 2006
4
corruption by firm characteristics. In LAC, there is no significant difference in bribery incidence
between large innovative and non-innovative firms. Moreover, in analysis on the subset of large
firms, there is no impact from a poor governance climate onto large firm’s performance, there are
also no differential impacts by innovation status.
SMEs or innovators can be more negatively affected by or targeted for bribery. Bribery can
have smaller distortionary effects for large or established firms because they are more likely to be
in a position to benefit from regulatory capture since they have larger influence or tenure in an
industry. Şeker and Yang (2014) find firms in LAC have lower sales growth when operating in
areas with a higher propensity of bribery when conducting business transactions with public
officials; and the negative distortion is even larger for young firms or firms with low levels of
sales. Dealing with bribes also consumes time. For smaller firms with fewer employees, the
distraction of continuous bribery requests can be costlier. Moreover, bribes can be petty rather than
proportional to a firm’s sales (Clarke, 2011). Firms with higher sales may be abler to shoulder the
financial burden of bribery.
Profitable firms are often targets of bribery (Svensson 2003). Evidence from developed
countries suggests that innovative firms are more profitable than non-innovative firms.9 Innovative
firms tend to be characterized by more educated managers, better technologies, and have access to
finance (Ayyagari et al, 2011). Geroski et al (1993) finds that innovators enjoy higher profit
margins than non-innovators; and not only during periods when they introduce specific
innovations. In LAC, this paper actually find that innovators have lower profit. Ayyagari et al
(2010) find that firms who pay bribes do evade taxes but innovative firms are net victims.
This paper uses firm-level panel data collected by the World Bank. The World Bank’s
Enterprise Surveys paid special attention to the panel data collection in the LAC region in 2010.
This was the surveys’ first concerted effort to create a large panel component across an entire
region. The survey also allows for objective measures of innovation, corruption, and firm sales.
9 See Geroski et al 1993; Leiponen 2000; Cefis & Ciccarelli 2005; Love, Roper and Du, 2009
5
Outcomes of interest are firm-level profits and sales. The principle explanatory variable of
interest is the interaction term between the average governance environment and whether or not a
firm is an innovator. A firm is considered to be an innovator if it has created new or significantly
modified existing products within the last three years. Firms in the LAC region are much less likely
to have recently conducted product innovation when compared to firms in the Europe and Central
Asia (ECA) region. Within LAC, Central American countries have the lowest levels of product
innovation. In El Salvador, Nicaragua, and Honduras, less than 10 percent of SMEs recently
created new or modified existing products. To capture the quality of governance related to doing
business, this paper focuses on two variables; if firms are expected to pay informal payments to
get things done, and if firms believe the court system is fair, impartial, and uncorrupted.
Results show that sales and profits among innovators are lower when governance dimensions
of the business environment are poor. The creation of new products requires more interactions
with the government through compliance with additional regulations, obtaining licenses, and
undergoing more processes and procedures. These firms may experience more frictions when
attempting to grow their business or enter new markets, which creates more opportunities for firms
to encounter red tape or bribery. This evidence corroborates with other research that has found
profitable and innovative firms to be candidate victims of bribery or extortion.10
The next sections are organized as follows. Section 2 describes the data. Section 3 discusses
the empirical strategy. Section 4 discusses the results and robustness. Section 5 concludes.
2. Data
This section reviews data and key variables. The construction of sales, profit, governance
environment, and innovation variables are described in detail.
Sample of Firms
Firm-level data is obtained from the Enterprise Surveys database and yields a set of panel firms
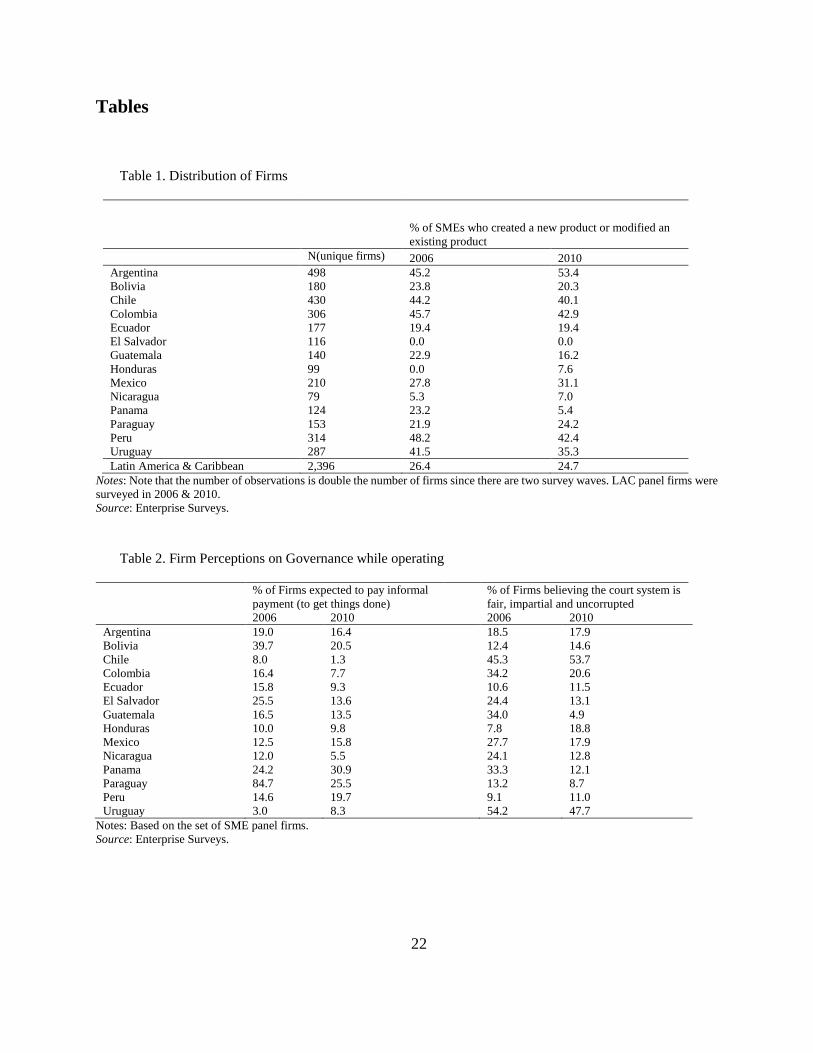
from 14 countries in LAC surveyed in 2006 and 2010. Table 1shows the distribution of panel firms
10 See Svensson 2003; Ayyagari et al 2010; Anokhin & Schulze 2009; Murphy, Shleifer, Vishny 1993
6
across countries. The original sample of panel firms included 2,396 unique SMEs in LAC with
two periods of data. However, after reducing the sample to those with a complete data profile in
profits and other explanatory variables, the set of firms is reduced to about 1,195 unique SMEs in
LAC. Compared to other regions with Enterprise Surveys data, the number of unique panel firms
in much larger in LAC since it is the first region to undergo field work with a strict focus on the
response rates of panel firms. However, the sample of panel firms alone is not representative of
any population of firms, and thus this paper precludes the use of weights. The main variable with
missing values that is reducing this sample size is recall data on sales from 3 to 4 fiscal years ago.
If the lagged sales variable is not used, then the sample size is increases to 1,607 unique firms.
Previous sales and performance are important determinants of current profits (McDonald 1999).
However, due to the large improvement in sample size, results will be compared with and without
lagged sales. Results will be shown to remain robust.
Sales and Profit
The impact of the governance on firm profits and sales is important since firms are likely to
base operating decisions on these two financial measures.
Sales refers to annual sales from the last complete fiscal year. The annual profit for a firm is
the total annual sales from the last complete fiscal year less all reported costs. All monetary values
are converted to U.S. dollars in 2009 values using a GDP deflator. Costs are reported for k
categories: labor costs, energy, fuel, inputs etc. Costs categories lack consistency across survey
waves. However, since costs are totaled over all categories, this will reduce differences from
classification.
Firm-level data on sales and costs is one of the most unique aspects of Enterprise Surveys;
however it is also where data error can occur. There are two sources of error: reporting error and
data entry error. In some instances, financial data is reported without referring to books. Firms
report financing figures directly from books only 47 percent of the time in our sample, another 45
percent report figures that the interviewer judged to be reliable but estimated. Interviewers judged
about 7 percent of firms to have unreliable financial information. On the data entry side, care is
taken to ensure accuracy of reporting. For instance, if profits are calculated to be negative, then
firms are re-contacted to double check if the data is correct. Ratio checks are also used to compare
7
the ratio of sales to costs to flag any unreasonable ratios. Quality control programs also flag outliers
and firms are re-contacted if their reported costs or sales are in the extreme tails of the
distribution.11 Beginning in 2012, monetary values were recorded in words as well as numerically
as an extra level of data verification.
SMEs are excluded whose sales, cost, or profit data is an outlier in their country-year survey
group. In the final sample of panel firms used in the regressions, all firms have positive sales,
though some are very low. In the Latin America and Caribbean region in 2010, SMEs in Mexico
had the highest annual profits averaging $10.3 million USD2009. On the lower end, Colombian
SMEs had the lowest average profits in 2010 at $1.9 million USD2009.
The Governance Environment
Enterprise Surveys provides data on how firms experience and perceive the business
environment. This paper focuses on two variables that characterize the governance and corruption
dimension of the business climate. The first variable is if firms are expected to pay informal
payments to get things done. The second variable is if firms believe the court system is fair,
impartial, and uncorrupted.
Because firms are asked for their general perception about these conditions, they are more
likely to respond honestly than if an interviewer asked about the firm’s own experience with
officials. But naturally, the firms are more likely to report based on own experiences which they
are familiar with. Moreover, since the set of panel firms are not necessarily representative of
incidences of bribery in the population, the use of these perception variables on aspects of
governance are useful. There is also a lack of availability of objective measures of bribery. In the
questionnaire, firms are asked if bribery occurred only in regards to specific activities such as
during obtainment of a construction permit. Therefore, the use of these objective measures would
be biased since not all firms conduct these activities.
There are consistencies between Enterprise Surveys reporting and other international measures
of corruption. In 2010, the two least corrupt countries in LAC according to the Corruption
11 A data point is considered to be an outlier if it lies three standard deviations away from the mean. Outliers are examined over the
distribution of panel firms.
8
Perception Index was Chile and Uruguay. In the Enterprise Surveys data, these two countries also
have the highest proportions of SMEs who believe “…the court system is fair, impartial and
uncorrupted” (Table 2). In terms of the percent of SMEs who are expected to pay informal
payments to get things done, Chile also has the lowest proportion at only 1.3 percent of SMEs
believing this to be true in 2010. Enterprise Survey’s perception data has also been shown to align
well with objective measures and that perceptions are often honest. Hallward-Driemeier and
Aterido (2009) do find a high correlation between firm perceptions and objective measures of the
business environment in the ES data. Gelb et al (2007) also find that firms do not discriminately
complain about the business climate.
As an added level of precaution, since perception-based indicators may introduce bias
(Bertrand & Mullainathan, 2001), a firm’s own perception of the business environment is not used.
Firm f’s own response to a governance climate question is denoted by the variable G𝑓 . For a firm
f=F, the average perception of a governance indicator by other firms in their common cluster (g)
is denoted as G̅𝐹 (Equation 1). Excluding firm F’s own response will also reduce reverse causality
or simultaneity; although a firm’s individual contribution to the average is small. A minimum
cluster size of n=25 is also imposed to ensure the average is computed from an adequately sized
sample.
G̅𝐹 =1
𝑛−1𝑤𝑓(∑ {G𝑓∈𝑔}
𝑛𝑓∈𝑔 − G𝐹 ) × 100 (1)
Aggregate responses are computed from the complete set of firms (including large firms), and
not just panel firms, further reducing reverse causality. The total number of firms of all sizes
surveyed before restricting to panel firms was 37,519 observations, compared to 3,056 unique
panel firms or 6,112 observations. Virtually all firms respond to the two governance questions
described above since it is a required question. A larger group of firms allows for a stronger
representative measure of the average external governance climate that is experienced by a group
of firms.
Enterprise Surveys stratifies by sector, size, and sub-national locations. Aggregate statistics at
these levels of stratifications with survey weights (𝑤𝑓) will yield statistics that are representative

9
of the population of firms at that level of stratification. Weighted averages of governance climate
perceptions at these levels of stratification will closely reflect the perceptions of the population.12
The strategy of utilizing group averages to disassociate individual unobservable factors from
measures of the business climate is a common empirical strategy used by researchers.13 It is unclear
if the selection of firms to bribe is random. Profitable firms may be more likely targets of bribery
(Svensson, 2003). Aggregate perceptions reflect the external governance climate and helps
disassociate biases observed by a firm from within. For example, exporters are more likely to
complain about customs regulations or firms without generators may complain about electricity
regardless of the local supply of power.
Innovators
Firms are classified as innovators if they had “introduce any new or significantly improved
(goods or services)” over the last three years, also known as product innovation. While there are
different definitions of innovation, Ayyagari et al (2011) examined the relationship between firm-
level innovation and financing and find similar relationships across different definitions of
innovation. Notice that by asking about innovation in only the previous three years and not any
earlier, we avoid the firm remarking on innovation activity in the same time period in the two
survey waves. Compared to R&D, product innovation is more descriptive of active innovation
activity that is affecting products sold rather than experimentation or development that has yet to
affect sales.
Firms in LAC have a low rate of innovation which may be related to lagging productivity and
growth (Lederman et al, 2014). Low innovation rates are evident when compared to rates in ECA.
Among all firms, 55 percent of firms in LAC did not recently create new or modify existing
products in either survey wave, compared to only 33 percent in ECA. In the most recent survey
waves for each region, 53 percent of firms recently innovated in ECA compared to only 33 percent
in LAC. Firms are also more dynamic in their innovation in ECA than in LAC. Half of firms who
12 I use the term “closely” since I exclude the firm’s own perception response from the average. For firms who did not respond to
these questions, I impute the average from their cluster. These instances are rare since obstacle questions are required and there are
few instances when a firm chose “don’t know”. 13 See Dethier et al 2010; Escribano & Guasch 2005; Şeker & Yang 2014; Dollar et al 2005, 2006; Hallward-Driemier et al 2006
10
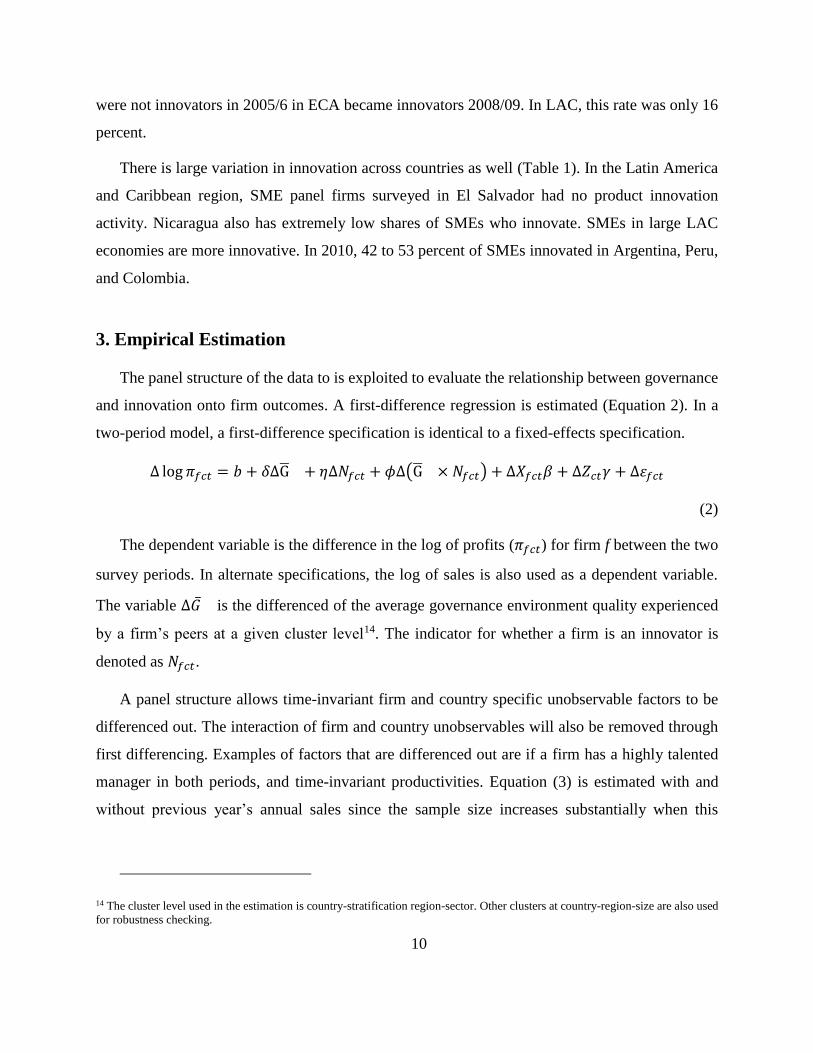
were not innovators in 2005/6 in ECA became innovators 2008/09. In LAC, this rate was only 16
percent.
There is large variation in innovation across countries as well (Table 1). In the Latin America
and Caribbean region, SME panel firms surveyed in El Salvador had no product innovation
activity. Nicaragua also has extremely low shares of SMEs who innovate. SMEs in large LAC
economies are more innovative. In 2010, 42 to 53 percent of SMEs innovated in Argentina, Peru,
and Colombia.
3. Empirical Estimation
The panel structure of the data to is exploited to evaluate the relationship between governance
and innovation onto firm outcomes. A first-difference regression is estimated (Equation 2). In a
two-period model, a first-difference specification is identical to a fixed-effects specification.
Δ log 𝜋𝑓𝑐𝑡 = 𝑏 + 𝛿ΔG̅ + 𝜂∆𝑁𝑓𝑐𝑡 + 𝜙∆(G̅ × 𝑁𝑓𝑐𝑡) + ∆𝑋𝑓𝑐𝑡𝛽 + ∆𝑍𝑐𝑡𝛾 + ∆휀𝑓𝑐𝑡
(2)
The dependent variable is the difference in the log of profits (𝜋𝑓𝑐𝑡) for firm f between the two
survey periods. In alternate specifications, the log of sales is also used as a dependent variable.
The variable Δ�̅� is the differenced of the average governance environment quality experienced
by a firm’s peers at a given cluster level14. The indicator for whether a firm is an innovator is
denoted as 𝑁𝑓𝑐𝑡.
A panel structure allows time-invariant firm and country specific unobservable factors to be
differenced out. The interaction of firm and country unobservables will also be removed through
first differencing. Examples of factors that are differenced out are if a firm has a highly talented
manager in both periods, and time-invariant productivities. Equation (3) is estimated with and
without previous year’s annual sales since the sample size increases substantially when this
14 The cluster level used in the estimation is country-stratification region-sector. Other clusters at country-region-size are also used
for robustness checking.
11
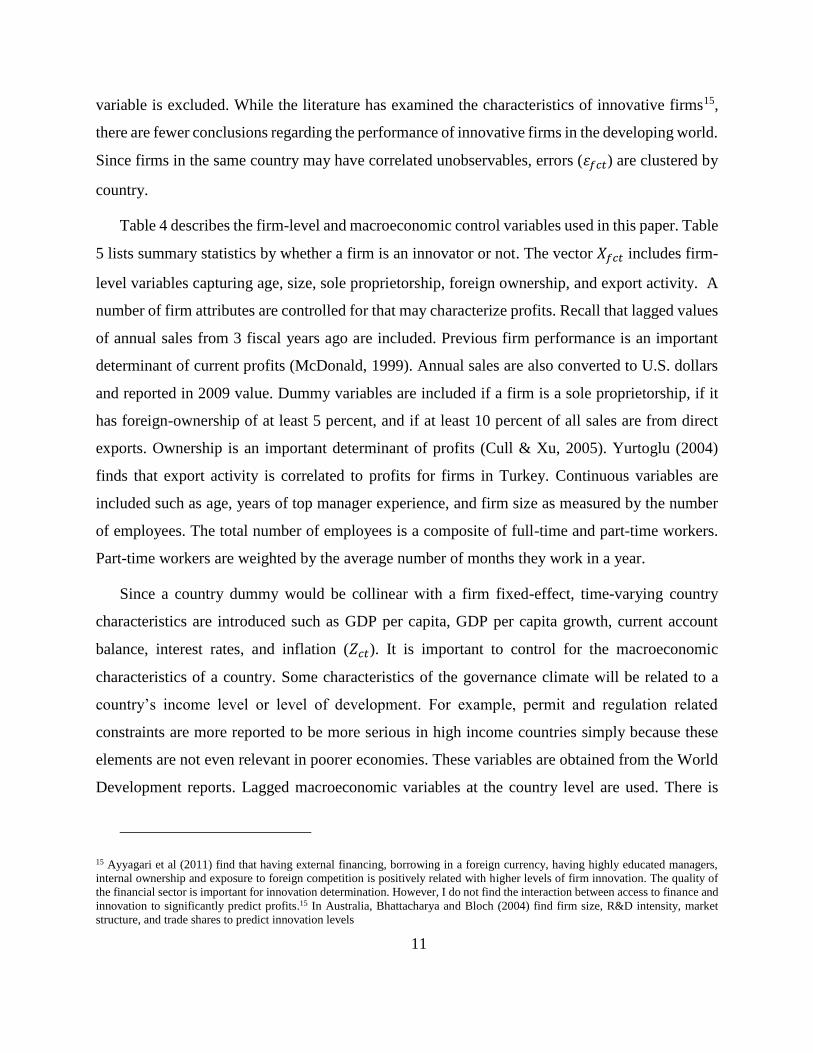
variable is excluded. While the literature has examined the characteristics of innovative firms15,
there are fewer conclusions regarding the performance of innovative firms in the developing world.
Since firms in the same country may have correlated unobservables, errors (휀𝑓𝑐𝑡) are clustered by
country.
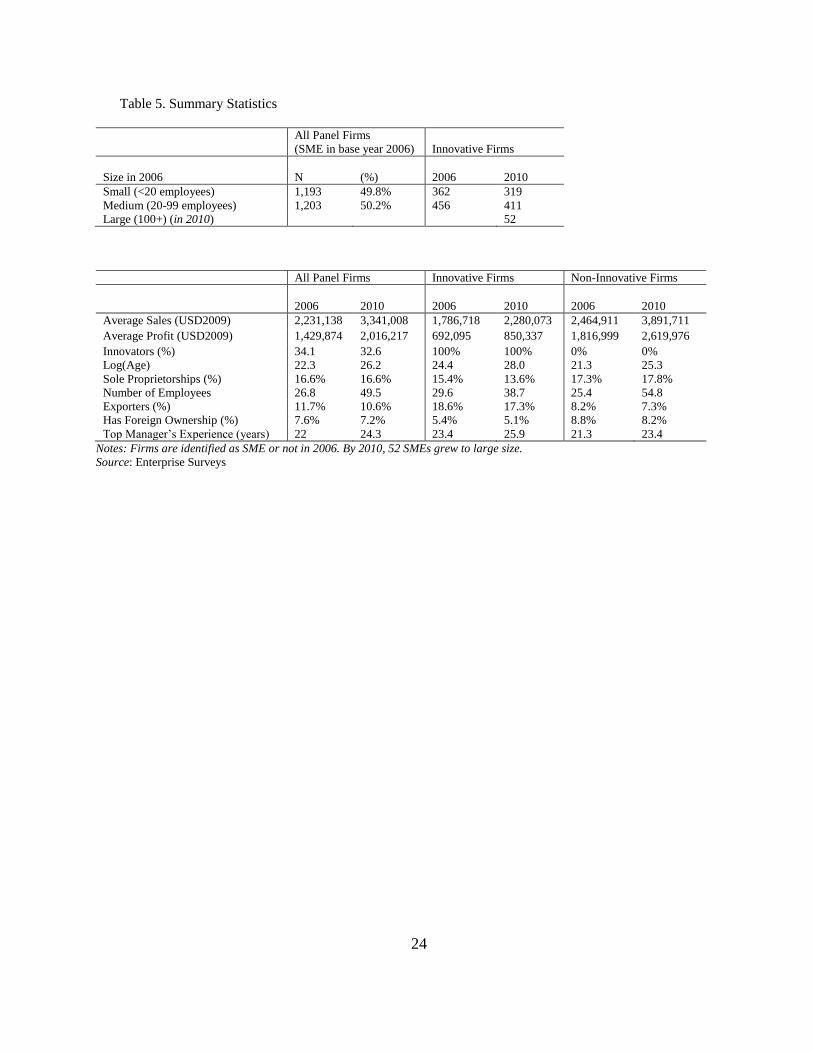
Table 4 describes the firm-level and macroeconomic control variables used in this paper. Table
5 lists summary statistics by whether a firm is an innovator or not. The vector 𝑋𝑓𝑐𝑡 includes firm-
level variables capturing age, size, sole proprietorship, foreign ownership, and export activity. A
number of firm attributes are controlled for that may characterize profits. Recall that lagged values
of annual sales from 3 fiscal years ago are included. Previous firm performance is an important
determinant of current profits (McDonald, 1999). Annual sales are also converted to U.S. dollars
and reported in 2009 value. Dummy variables are included if a firm is a sole proprietorship, if it
has foreign-ownership of at least 5 percent, and if at least 10 percent of all sales are from direct
exports. Ownership is an important determinant of profits (Cull & Xu, 2005). Yurtoglu (2004)
finds that export activity is correlated to profits for firms in Turkey. Continuous variables are
included such as age, years of top manager experience, and firm size as measured by the number
of employees. The total number of employees is a composite of full-time and part-time workers.
Part-time workers are weighted by the average number of months they work in a year.
Since a country dummy would be collinear with a firm fixed-effect, time-varying country
characteristics are introduced such as GDP per capita, GDP per capita growth, current account
balance, interest rates, and inflation (𝑍𝑐𝑡). It is important to control for the macroeconomic
characteristics of a country. Some characteristics of the governance climate will be related to a
country’s income level or level of development. For example, permit and regulation related
constraints are more reported to be more serious in high income countries simply because these
elements are not even relevant in poorer economies. These variables are obtained from the World
Development reports. Lagged macroeconomic variables at the country level are used. There is
15 Ayyagari et al (2011) find that having external financing, borrowing in a foreign currency, having highly educated managers,
internal ownership and exposure to foreign competition is positively related with higher levels of firm innovation. The quality of
the financial sector is important for innovation determination. However, I do not find the interaction between access to finance and
innovation to significantly predict profits.15 In Australia, Bhattacharya and Bloch (2004) find firm size, R&D intensity, market
structure, and trade shares to predict innovation levels
12
some incompleteness in this data across countries. To deal with missing data, if a macroeconomic
variable is missing for surveys in 2006, an average from 2004 to 2006 is used instead. If a variable
is missing for 2006, the 2007-2010 average fills the gap. Regressions are mostly robust with or
without macroeconomic variables.
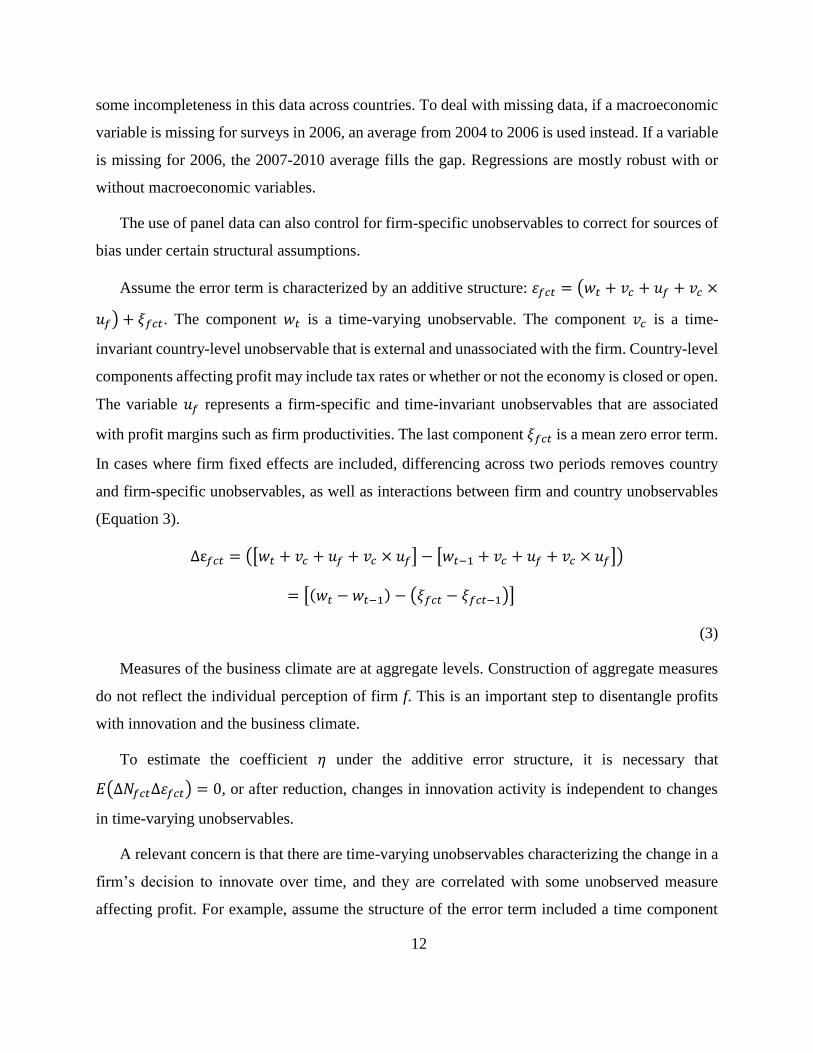
The use of panel data can also control for firm-specific unobservables to correct for sources of
bias under certain structural assumptions.
Assume the error term is characterized by an additive structure: 휀𝑓𝑐𝑡 = (𝑤𝑡 + 𝑣𝑐 + 𝑢𝑓 + 𝑣𝑐 ×
𝑢𝑓) + 𝜉𝑓𝑐𝑡. The component 𝑤𝑡 is a time-varying unobservable. The component 𝑣𝑐 is a time-
invariant country-level unobservable that is external and unassociated with the firm. Country-level
components affecting profit may include tax rates or whether or not the economy is closed or open.
The variable 𝑢𝑓 represents a firm-specific and time-invariant unobservables that are associated
with profit margins such as firm productivities. The last component 𝜉𝑓𝑐𝑡 is a mean zero error term.
In cases where firm fixed effects are included, differencing across two periods removes country
and firm-specific unobservables, as well as interactions between firm and country unobservables
(Equation 3).
∆ε𝑓𝑐𝑡 = ([𝑤𝑡 + 𝑣𝑐 + 𝑢𝑓 + 𝑣𝑐 × 𝑢𝑓] − [𝑤𝑡−1 + 𝑣𝑐 + 𝑢𝑓 + 𝑣𝑐 × 𝑢𝑓])
= [(𝑤𝑡 − 𝑤𝑡−1) − (𝜉𝑓𝑐𝑡 − 𝜉𝑓𝑐𝑡−1)]
(3)
Measures of the business climate are at aggregate levels. Construction of aggregate measures
do not reflect the individual perception of firm f. This is an important step to disentangle profits
with innovation and the business climate.
To estimate the coefficient 𝜂 under the additive error structure, it is necessary that
𝐸(∆𝑁𝑓𝑐𝑡∆휀𝑓𝑐𝑡) = 0, or after reduction, changes in innovation activity is independent to changes
in time-varying unobservables.
A relevant concern is that there are time-varying unobservables characterizing the change in a
firm’s decision to innovate over time, and they are correlated with some unobserved measure
affecting profit. For example, assume the structure of the error term included a time component

13
that was also interacted with a firm-specific component. For example, a time-varying unobservable
is present if a firm switched managers between the two survey rounds who had different levels of
experience or hired a talented research team to create new products. In LAC, the number of years
of a manager’s experience is observable and changes in management can be accounted for.
Changes in export activity and foreigner ownership are also observed. Unobserved changes in firm
productivities are an example of unobservable that may induce bias. While it is reasonable that
this unobservable is related to the changes in innovation activity, it is not straightforward when it
is related to the interaction between innovation and business climate.
To retrieve the coefficient 𝜙 under the additive error structure that was presented, changes in
unobservables associated with firm profit are assumed to be uncorrelated to unobservables in the
interaction between business climate and firm innovation (Equation 4). This assumption is valid
even if unobservables are correlated with the business climate or innovation alone. Identification
of the parameter 𝜂 also follows from this assumption.
(G𝑐𝑡 × 𝑁𝑓𝑡 − G𝑐𝑡−1 ×𝑁𝑓𝑡−1) ⊥ [(𝑤𝑡 − 𝑤𝑡−1) − (𝜉𝑓𝑐𝑡 − 𝜉𝑓𝑐𝑡−1)]
(4)
The last consideration is if there are significant unobserved interaction effects between time
and country. The subscript m to denote country and year effects. This is primarily a concern when
the firm business perceptions created using ES data are averaged at the country-level. The concern
is that reforms are correlated to the market and the economy. It is unlikely that one reform occurs
in isolation; reforms can reflect a wide spread attitude regarding change and development. A wide
range of macroeconomic variables are used to control for changes in the economic landscape,
including GDP, GDP growth, inflation, current account balance, and interest rates. In robust
results, the inclusion of these country variables does not impact the significance or magnitude of
the impact of business climate and innovation.
As a further robustness check, country-year interactions are introduced into the regression
instead of controlling for macroeconomic changes over time using variables such as GDP. In this
case, in the presence of firm and country-time fixed effects, the identifying assumption is shown
in (Equation 5).
14
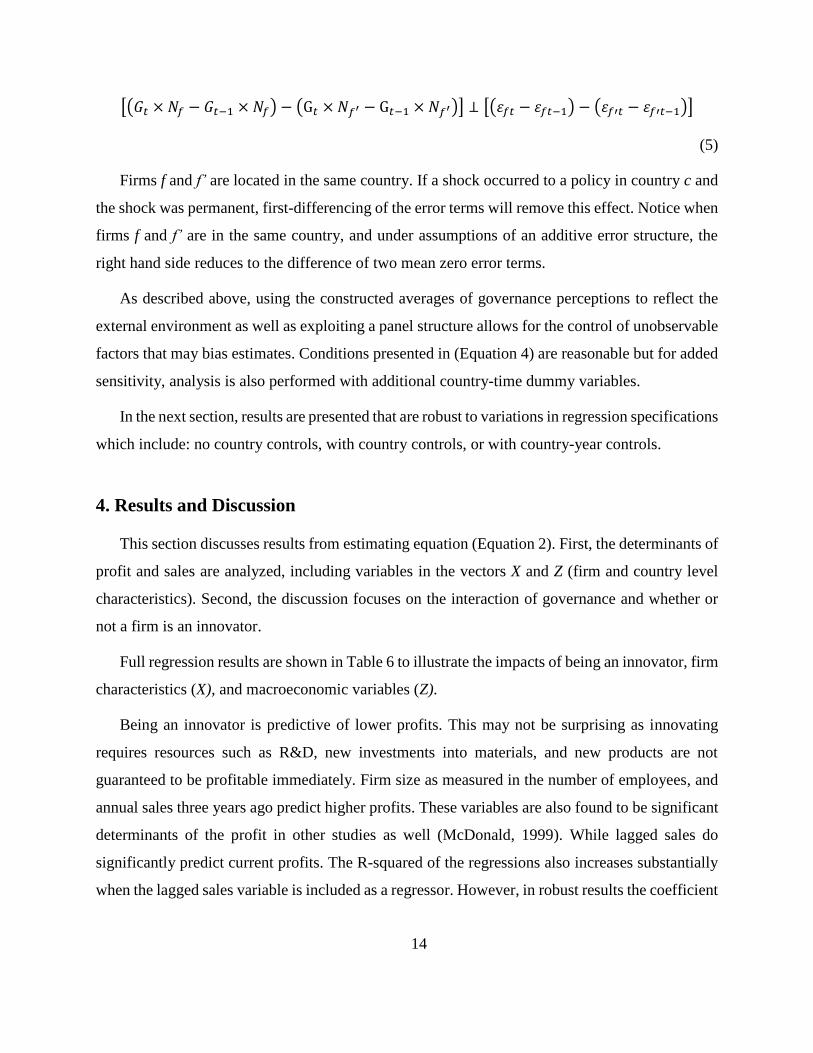
[(𝐺𝑡 × 𝑁𝑓 − 𝐺𝑡−1 × 𝑁𝑓) − (G𝑡 ×𝑁𝑓′ − G𝑡−1 × 𝑁𝑓′)] ⊥ [(휀𝑓𝑡 − 휀𝑓𝑡−1) − (휀𝑓′𝑡 − 휀𝑓′𝑡−1)]
(5)
Firms f and f’ are located in the same country. If a shock occurred to a policy in country c and
the shock was permanent, first-differencing of the error terms will remove this effect. Notice when
firms f and f’ are in the same country, and under assumptions of an additive error structure, the
right hand side reduces to the difference of two mean zero error terms.
As described above, using the constructed averages of governance perceptions to reflect the
external environment as well as exploiting a panel structure allows for the control of unobservable
factors that may bias estimates. Conditions presented in (Equation 4) are reasonable but for added
sensitivity, analysis is also performed with additional country-time dummy variables.
In the next section, results are presented that are robust to variations in regression specifications
which include: no country controls, with country controls, or with country-year controls.
4. Results and Discussion
This section discusses results from estimating equation (Equation 2). First, the determinants of
profit and sales are analyzed, including variables in the vectors X and Z (firm and country level
characteristics). Second, the discussion focuses on the interaction of governance and whether or
not a firm is an innovator.
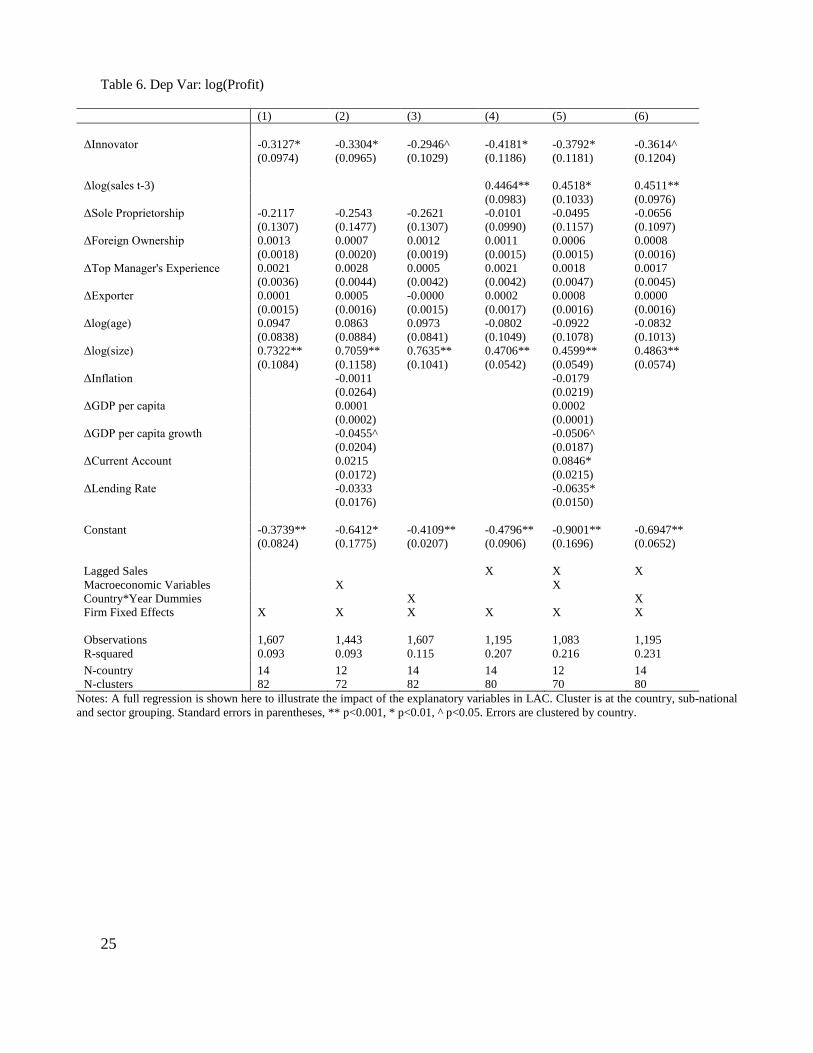
Full regression results are shown in Table 6 to illustrate the impacts of being an innovator, firm
characteristics (X), and macroeconomic variables (Z).
Being an innovator is predictive of lower profits. This may not be surprising as innovating
requires resources such as R&D, new investments into materials, and new products are not
guaranteed to be profitable immediately. Firm size as measured in the number of employees, and
annual sales three years ago predict higher profits. These variables are also found to be significant
determinants of the profit in other studies as well (McDonald, 1999). While lagged sales do
significantly predict current profits. The R-squared of the regressions also increases substantially
when the lagged sales variable is included as a regressor. However, in robust results the coefficient
15
estimate on our interaction term of interest is unaffected. Sole proprietorship predicts lower profits.
Foreign ownership, export activity, and the age of the firm do not significantly predict profits.
Macroeconomic variables are important controls however they have little influence in on our
variables of interest.
Enterprise Surveys firm-level data offers the advantage of observing variations of the
governance climate at local levels. Recall the governance climate variable is an average measure
of the external governance climate that a firm’s peers experience and excludes the firm’s own
response. Moreover, these grouped averages are computed using all SMEs in the data, not just the
panel firms, which creates a more representative indicator of the local governance environment16.
For example, the value of ‘Informal Payments’ assigned to any particular firm reflects how similar
peers view the prevalence of informal payments to government officials.
Table 7 and Table 8 illustrates results of the interaction between informal payments and
whether or not the firm is an innovator. The coefficient on the interaction term is negative and
significant across most specifications and also in regressions where the dependent is either profit
or sales. However, results are weaker when the dependent variable is sales. This implies that firms
who are conducting product innovation and in environments where informal payments are more
common have lower profits. The results are robust, with the interaction term being significant in
specifications with and without macroeconomic controls, lagged sales, or country-year interaction
dummies.
This result is consistent with several findings in the literature. Using the Enterprise Surveys
data set with multiple countries, Ayyagari et al (2010) find that innovative firms are victims of
corruption and pay larger bribes as a proportion of their annual sales. Anokhin and Schulze (2009)
find evidence that corruption reduces trust and the absence of trust increases transaction costs that
can hamper productivity, innovation, and entrepreneurship. Firms often cite red tape and
regulatory barriers as principle problems facing entrepreneurship (IDB, 2002). Moreover, Şeker
16 Furthermore, the regression includes only firms who are in groups where the average business climate was averaged across at
least 25 firms. Recall this was done to ensure that average business climate measures were computed with enough firms. This is
not a strict restriction since governance questions are not allowed to be skipped in the survey and averages are calculated from the
full sample of firms. However, there are some cases where a location has very small number of firms and these cases are excluded.
16
and Yang (2014) find that firms in LAC have lower sales growth when faced with bribery. The
negative distortions from bribery are larger for young firms and firms with lower levels of annual
sales, which are precisely the types of firms with less power or voice.
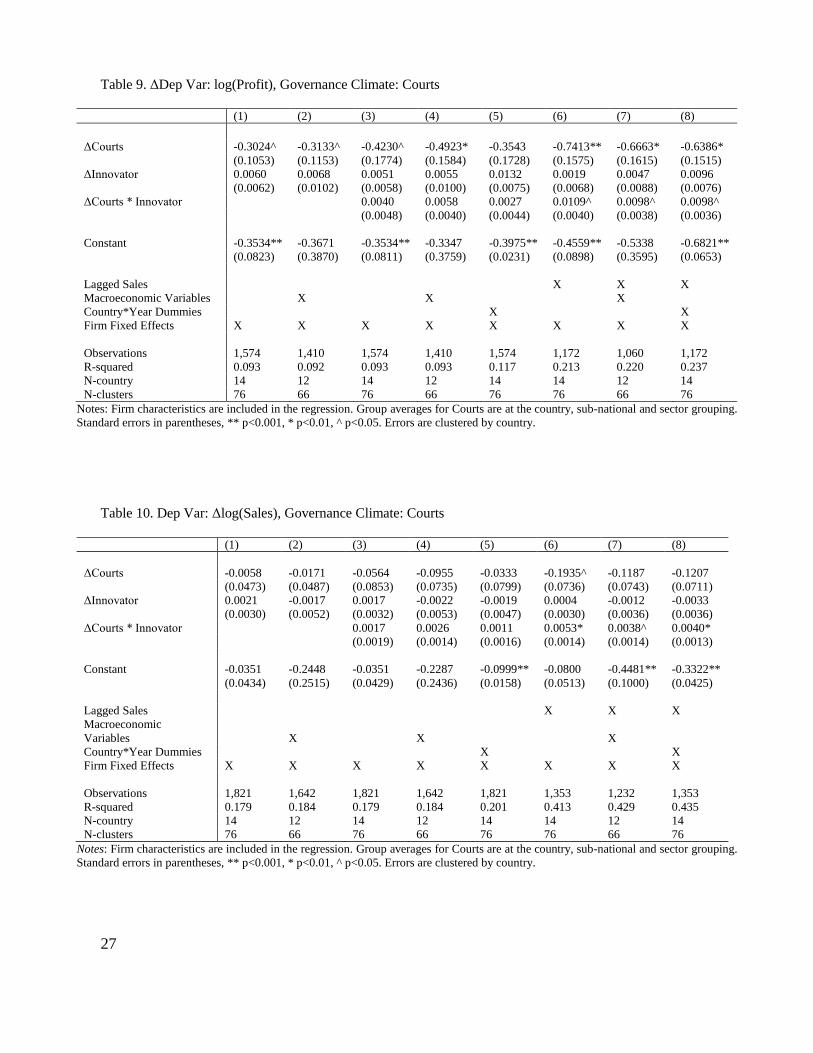
From the a complementary but opposite perspective, when the courts are strong, a consistent
and complementary result is that SME sales and profits are higher. The court system can be closely
linked to the decision or incidence of conducting innovative activities since the patent system and
protection of ideas rely on strong institutions and courts.
Table 9 and Table 10 illustrate results when examining the relationship of firms perception of
the court system and innovation activity. In these regressions, when controlling for lagged sales, a
higher quality courts system predicts higher sales and profits for innovating SMEs.
Notice that the two governance questions are completely unrelated to each other in the
questionnaire, so it is validating to see both a positive and negative governance indicator leading
to respectively consistent results. A negative governance indicator yielded lower sales and profits,
and a positive indicator yielded higher sales and profits for innovators.
To investigate if the issue of innovation and poor governance is limited to SMEs, additional
regressions of the same specification were also estimated on the subsample of large firms. In the
data there are 519 large panel firms that were surveyed in both 2006 and 2010. In these regressions,
interaction terms between governance and innovation were insignificant. It is important to note
this particular finding since it emphasizes the constraint is on primarily smaller sized firms. It is
often noted that in markets, size is a factor of inequity due to differences in voice and power. In
this paper, it seems that when it comes to innovation activity, poor governance hinders SME
performance.
5. Conclusion
Innovative firms are often seen as drivers of economic growth and this concept has been
established as early as Schumpeter (1911) and continues to motivate economists and policy makers
to encourage businesses to innovate. Innovation promotion is an especially relevant policy agenda
for upper-middle countries. In these countries, efficiencies from sectoral shifts and resource and
17
labor reallocation have been achieved. Further growth must come from productivity growth driven
by innovation or competition (Aghion and Howitt, 2005).
LAC suffers from too little competition and not enough innovators. The fact that innovative
SMEs are found to be hindered by poor governance is a caution of the potential harmful
implications of a poor governance climate onto growth. Lederman et al (2014) suggest policy to
shape an enabling environment for entrepreneurs such as building human capital, improving
infrastructure, enhancing competition, and improving the contractual environment. Their
suggestions are complementary with the findings of this report that governance and institutions
are important, in particular for SMEs innovators. An enabling environment is important for
promoting entrepreneurship, innovation to occur, increasing productivity, and also boosting
growth. Regulatory impediments are major disincentives to entrepreneurship. Other comparative
studies have also noted the more challenging business climate in LAC compared to other regions.
In a study comparing new firms in East Asia to those in LAC, it was found that new entrepreneurs
in LAC take longer to identify opportunities and also rely on informal social networks (Kantis et
al 2002). The study also found that regulatory impediments are cited to be major disincentives to
entrepreneurship in Mexico, Brazil, and Peru.
This paper uses two variables to characterize how the governance climate is perceived by
SMEs. First, if firms are expected to pay informal payments, and secondly perceptions on the
quality of the court system. Evidence in this paper suggests that the profits of innovative SMEs
decline more than non-innovation firms when regulatory or governance aspects are poor. When
conducting identical estimations for large firms, there are no impacts from the interaction of
governance and whether or not a firm innovates. Not only is boosting innovation important for
growth, LAC is home to a large proportion of SMEs. An understanding of challenges facing SMEs,
and especially their innovation activity is important. Creating an enabling environment involves
many pillars, but one that cannot be ignored is the role of governance and institutions.

18
References
Aghion, Philippe and Howitt, Peter, editors. (2005). Chapter 2 Growth with Quality-Improving
Innovations: An Integrated Framework. Handbook of Economic Growth Volume 1, Part A, pages
67-110.
Anokhin, Sergey, and William S. Schulze. (2009). “Entrepreneurship, innovation, and corruption,”
Journal of Business Venturing, 24(5): 465-476. doi: 10.1016/j.jbusvent.2008.06.001.
Asiedu, Elizabeth, and James Freeman. (2009). “The Effect of Corruption on Investment Growth:
Evidence from Firms in Latin America, Sub-Saharan Africa, and Transition Countries,” Review of
Economic Development, 13(2): 200-214. doi: 10.1111/j.1467-9361.2009.00507.x.
Aterido, Reyes, and Mary Hallward-Driemeier. (2010). “The Impact of the Investment Climate on
Employment Growth. Does Sub-Saharan Africa Mirror Other Low-Income Regions,” World Bank
Policy Research Working Paper 5218. doi: 10.1596/1813-9450-5218.
Aterido, Reyes, Mary Hallward-Driemeier, and Carmen Pagés. (2011). “Big Constraints to Small
Firms’ Growth? Business Environment and Employment Growth across Firms,” Economic
Development and Cultural Change, 59(3): 609-647. doi:10.1086/658349.
Ayyagari, Meghana, Asli Demirgüç-Kunt, and Vojislav Maksimovic. (2011). “Firm innovation in
emerging markets: the role of finance, governance, and competition,” Journal of Financial and
Quantitative Analysis, 46(6): 1545-1580. doi:10.1017/S0022109011000378.
--------------------. (2010). “Are Innovating Firms Victims or Perpetrators? Tax Evasion, Bribe
Payments, and the Role of External Finance in Developing Countries,” World Bank Policy
Research Working Paper No. 5389. doi: 10.1596/1813-9450-5389.
Bastos, Fabiano, and John Nasir. (2004). “Productivity and the Investment Climate: What Matters
Most?” World Bank Policy Research Working Paper 3335. doi: 10.1596/1813-9450-3335.
Beck, Thorsten, Asli Demirguc-Kunt. (2006). “Small and medium-sized enterprises: Access to
finance as a growth constraint”, Journal of Banking and Finance 30:2931-2943.
doi:10.1016/j.jbankfin.2006.05.009.
Beck, Thorsten, Demirguc-Kunt, Asli and Levine, Ross. (2005). “SMEs, Growth, and Poverty:
Cross-Country Evidence”, Journal of Economic Growth 10(3):199-229. doi:10.1007/s10887-005-
3533-5.
Beck, Thorsten, Asli Demirguc-Kunt, and Vojislav Maksimovic. (2005). “Financial and Legal
Constraints to Growth: Does Firm Size Matter?.” The Journal of Finance, 60(1): 137-177. doi:
10.1111/j.1540-6261.2005.00727.x.
Belitski, M., Chowdhury, F. & Desai, S. (2016). “Taxes, corruption, and entry,” Small Business
Economics, 47(1): 201-216. doi:10.1007/s11187-016-9724-y.
19
Bertrand, M., and S. Mullainathan. (2001). “Do People Mean What They Say? Implications for
Subjective Survey Data.” The American Economic Review 91(2): 67–72. doi: 10.1257/aer.91.2.67.
Bhattacharya, Mita, and Harry Bloch. (2004). “Determinants of Innovation,” Small Business
Economics, 22: 155-162. doi:10.1023/B:SBEJ.0000014453.94445.de.
Bhaumik, Sumon Kumar, and Saul Estrin. (2007). “How transition paths differ: Enterprise
performance in Russia and China,” Journal of Development Economics 82(2): 374-392. doi:
10.1016/j.jdeveco.2005.08.003.
Carlin, Wendy, Mark Schaffer, and Paul Seabright. (2006). “Where are the Real Bottlenecks? A
Lagrangian Approach to Identifying Constraints on Growth from Subjective Survey Data,”
Working Paper.
Carpenter, Robert E., and Bruce C. Petersen. (2002). “Is the Growth of Small Firms Constrained
by Internal Finance?”, The Review of Economics and Statistics 84(2): 298-309.
doi:10.1162/003465302317411541.
Cefis, Elena, and Matteo Ciccarelli. (2005). “Profit differentials and innovation,” Economics of
Innovation and New Technology 14:43-61. doi:10.1080/1043859042000232160.
Cull, Robert, and Lixin Colin Xu. (2005). “Institutions, ownership, and finance: the determinants
of profit reinvestment among Chinese firms,” Journal of Financial Economics 77: 117-146. doi:
10.1016/j.jfineco.2004.05.010.
Dethier, Jean-Jacques, Maximilian Hirn, and Stephane Straub. (2010). “Explaining Enterprise
Performance in Developing Countries with Business Climate Survey Data,” The World Bank
Research Observer, 26: 258-309. doi: 10.1093/wbro/lkq007.
Dollar, David, Mary Hallward-Driemeier, and Taye Mengistae. (2005). “Investment Climate and
Firm Performance in Developing Economies,” Economic Development and Cultural Change,
54(1): 1-31. doi: 10.1086/431262.
--------------------. (2006). “Investment Climate and International Integration”, World
Development, 34(9): 1498-1516. doi: 10.1016/j.worlddev.2006.05.001.
Djankov, Simeon, Rafael La Porta, Florencio Lopez-de-Silanes, and Andrei Shleifer. (2002). “The
Regulation of Entry,” The Quarterly Journal of Economics 117(1): 1-37. doi:
10.1162/003355302753399436.
Durlauf, Steven N., Andros Kourtellos, and Chih Ming Tan. (2008). “Are any growth theories
robust?” The Economic Journal 118: 329-346. doi: 10.1111/j.1468-0297.2007.02123.x.
Escribano, A., and J.L. Guasch. (2005). “Assessing the Impact of the Business Climate on
Productivity Using Firm Level Data: Methodology and the Cases of Guatemala, Honduras, and
Nicaragua,” World Bank Policy Research Working Paper No. 3621. doi: 10.1596/1813-9450-
3621.
20
Gaviria, Alejandro. (2002). “Assessing the effects of corruption and crime on firm performance:
evidence from Latin America,” Emerging Markets Review 3(3):245-268. doi:10.1016/S1566-
0141(02)00024-9.
Gelb, Alan, Vijaya Ramachandran, Manju Kedia-Shah, and Ginger Turner. (2007). “What Matters
to African Firms? The Relevance of Perceptions Data.” World Bank Policy Research Working
Paper No. 4446. doi: 10.1596/1813-9450-4446.
Geroski, Paul, Steve Machin, and John Van Reenen. (1993). “The Profitability of Innovating
Firms,” The RAND Journal of Economics 24(2): 198-211. doi: 10.2307/2555757.
Hallward-Driemeier, Mary, and Reyes Aterido. (2009). “Comparing Apples with … Apples: how
to Make (More) Sense of Subjective Rankings of Constraints to Business,” World Bank Policy
Research Working Paper No. 5054. doi: 10.1596/1813-9450-5054.
Hallward-Driemeier, Mary, Scott Wallsten, and Lixin Colin Xu. (2006). “Ownership, investment
climate and firm performance. Evidence from Chinese firms,” Economics of Transition, 14(4):
629-647. doi: 10.1111/j.1468-0351.2006.00267.x.
Hutchinson, J. & Xavier, A. (2006). “Comparing the Impact of Credit Constraints on the Growth
of SMEs in a Transition Country with an Established Market Economy”, Small Business
Economics 27(2):169-179. doi:10.1007/s11187-005-4412-3.
Johnson, Noel D., Courtney L. LaFountain, Steven Yamarik. (2011). “Corruption is bad for growth
(even in the United States),” Public Choice 147: 377–393. doi: 10.1007/s11127-010-9634-5.
Kantis, Hugo, Masahiko Ishida, and Masahiko Komori. (2002). “Entrepreneurship in Emerging
Economies: the Creation and Development of New Firms in Latin America and East Asia”,
Washington D.C: Inter-American Development Bank.
Kaufmann, Daniel, Aart Kraay, and Massimo Mastruzzi. (2004). “Governance Matters III:
Governance Indicators for 1996, 1998, 2000, and 2002,” World Bank Economic Review 18(2):
253-287. doi: 10.1093/wber/lhh041.
Lambsdorff, J.G. (2003). “How corruption affects persistent capital flows,” Economics of
Governance 4: 229–243. doi: 10.1007/s10101-002-0060-0.
Lederman, Daniel, Julian Messina, Samuel Pienknagura, and Jamele Rigolini. (2014). Latin
American Entrepreneurs, Many Firms But Little Innovation. Washington D.C.: The World Bank.
doi:10.1596/978-1-4648-0012-2.
Leiponen, Ada. (2000). “Competencies, Innovation and Profitability of Firms,” Economics of
Innovation and New Technology 9(1): 1-24. doi:10.1080/10438590000000001.
Love, James H., Stephen Roper, and Jun Du. (2009). “Innovation, ownership and profitability,”
International Journal of Industrial Organization, 27(3): 424-434. doi:
10.1016/j.ijindorg.2008.11.001.
21
Mauro, P. (1995). “Corruption and growth,” Quarterly Journal of Economics 110: 681–712. doi:
10.2307/2946696.
McDonald, James Ted. (1999). “The Determinants of Firm Profitability in Australian
Manufacturing,” Economic Record 75(2): 115-126. 10.1111/j.1475-4932.1999.tb02440.x.
Mo, P.H. (2001). “Corruption and economic growth,” Journal of Comparative Economics 29: 66–
79. doi:10.1006/jcec.2000.1703.
Murphy, Kevin M., Andrei Shleifer, and Robert W. Vishny. (1993). “Why is rent-seeking so costly
to growth?” American Economic Review 83(2): 409-414. http://www.jstor.org/stable/2117699.
Pagés, Carmen, editor. (2010). The Age of Productivity: Transforming Economies from the Bottom
Up, Palgrave Macmillan. doi: 10.1057/9780230107618.
Schumpeter, Joseph. (1911). The Theory of Economic Development, Leipzig: Duncker & Humblot.
Pande, Rohini, and Christopher Udry. (2005). “Institutions and Development: A View from
Below,” Yale University Economic Growth Center Discussion Paper No. 928.
Paunov, Caroline. (2016). “Corruption's asymmetric impacts on firm innovation.” Journal of
Development Economics, 118: 216–231. doi: 10.1016/j.jdeveco.2015.07.006
Seligson, Mitchell A. (2006). “The Measurement and Impact of Corruption Victimization: Survey
Evidence from Latin America”, World Development 34(2): 381-404. doi:
10.1016/j.worlddev.2005.03.012.
Şeker, Murat, and Judy S. Yang. (2014). “Bribery solicitations and firm performance in the Latin
America and Caribbean region,” Journal of Comparative Economics 42(1): 246-264. doi:
10.1016/j.jce.2013.05.004.
Shleifer, Andrei, and Robert W. Vishny. (1993). “Corruption,” The Quarterly Journal of
Economics 108(3):599-617. doi: 10.2307/2118402.
Svennson, Jakob. (2003). “Who Must Pay Bribes and How Much? Evidence from a cross section
of firms,” Quarterly Journal of Economics February: 207-230. doi: 10.1162/00335530360535180.
Wei, S.-J. (2000). “Local corruption and global capital flows,” Brookings Papers on Economic
Activity 2: 303–346.
World Bank. (2004). World Development Report 2005: A Better Business Climate for Everyone.
World Bank, Washington D.C.
--------------------. (2014). “Mapping Enterprises in Latin America and the Caribbean”, Enterprise
Surveys Latin America and the Caribbean Series, Note No. 1. Washington D.C: World Bank
Group.
Yurtoglu, B. Burcin. (2004). “Persistence of firm-level profitability in Turkey,” Applied
Econometrics, 36: 615-625. doi: 10.1080/0003684042000217652.
22
Tables
Table 1. Distribution of Firms
% of SMEs who created a new product or modified an
existing product
N(unique firms) 2006 2010
Argentina 498 45.2 53.4
Bolivia 180 23.8 20.3
Chile 430 44.2 40.1
Colombia 306 45.7 42.9
Ecuador 177 19.4 19.4
El Salvador 116 0.0 0.0
Guatemala 140 22.9 16.2
Honduras 99 0.0 7.6
Mexico 210 27.8 31.1
Nicaragua 79 5.3 7.0
Panama 124 23.2 5.4
Paraguay 153 21.9 24.2
Peru 314 48.2 42.4
Uruguay 287 41.5 35.3
Latin America & Caribbean 2,396 26.4 24.7
Notes: Note that the number of observations is double the number of firms since there are two survey waves. LAC panel firms were
surveyed in 2006 & 2010.
Source: Enterprise Surveys.
Table 2. Firm Perceptions on Governance while operating
% of Firms expected to pay informal
payment (to get things done)
% of Firms believing the court system is
fair, impartial and uncorrupted
2006 2010 2006 2010
Argentina 19.0 16.4 18.5 17.9
Bolivia 39.7 20.5 12.4 14.6
Chile 8.0 1.3 45.3 53.7
Colombia 16.4 7.7 34.2 20.6
Ecuador 15.8 9.3 10.6 11.5
El Salvador 25.5 13.6 24.4 13.1
Guatemala 16.5 13.5 34.0 4.9
Honduras 10.0 9.8 7.8 18.8
Mexico 12.5 15.8 27.7 17.9
Nicaragua 12.0 5.5 24.1 12.8
Panama 24.2 30.9 33.3 12.1
Paraguay 84.7 25.5 13.2 8.7
Peru 14.6 19.7 9.1 11.0
Uruguay 3.0 8.3 54.2 47.7
Notes: Based on the set of SME panel firms.
Source: Enterprise Surveys.
23
Table 3. Summary Statistics by innovative activity
Non-Innovators Innovators
2006 N Mean N Mean Difference t-statistic
Was bribed 1095 0.10 602 0.13 -0.03 -2.091
Expected to Pay Informal Payments 1201 19.65 618 19.90 -0.25 -0.128
Strong Courts 1491 26.02 779 28.37 -2.35 -1.198
Sales (2009USD) 1422 $2,464,911 748 $1,786,718 $678,193 1.382
Profits (2009 USD) 1416 $1,816,999 743 $ 692,096 $1,124,904 3.055
2010 N Mean N Mean Difference t-statistic
Was bribed 1109 0.11 605 0.14 -0.03 -2.149
Expected to Pay Informal Payments 1496 13.17 723 12.86 0.31 0.200
Strong Courts 1566 21.90 772 25.13 -3.23 -1.745
Sales (2009USD) 1345 $3,891,711 698 $2,280,073 $1,611,638 1.071
Profits (2009 USD) 1344 $2,619,976 696 $850,338 $1,769,638 1.198
Notes: Based on sample of SME panel firms, unweighted.
Source: Enterprise Surveys.
Table 4. Variable Definitions
Description Data Source
Governance environment
Informal Payments % of Firms expected to make informal payments (to get
things done)
Courts % of Firms believing the court system is fair, impartial
and uncorrupted
Firm characteristics
Innovator A dummy variable if a firm participated in product
innovation
Enterprise Surveys
Sole Proprietorship A dummy variable if the legal form of the firm is sole
proprietorship
Enterprise Surveys
Foreign Ownership A dummy variable if a firm has at least 10 percent foreign
ownership
Enterprise Surveys
Exporter A dummy variable if a firm derives at least 10 percent of
sales from direct exports
Enterprise Surveys
Manager Experience Years of experience of top Manager Enterprise Surveys
log(age) The log of firm age Enterprise Surveys
log(size) The log of size, where size is the number of employees,
and temporary workers are weighted by the average
number of months they work in a year
Enterprise Surveys
log(sales t-3) Annual sales from three or four fiscal years ago Enterprise Surveys
Macroeconomic characteristics
Inflation World Development Indicators
GDP per capita World Development Indicators
GDP per capita growth World Development Indicators
Current Account World Development Indicators
Lending Rate World Development Indicators
24
Table 5. Summary Statistics
All Panel Firms
(SME in base year 2006) Innovative Firms
Size in 2006 N (%) 2006 2010
Small (<20 employees) 1,193 49.8% 362 319
Medium (20-99 employees) 1,203 50.2% 456 411
Large (100+) (in 2010) 52
All Panel Firms Innovative Firms Non-Innovative Firms
2006 2010 2006 2010 2006 2010
Average Sales (USD2009) 2,231,138 3,341,008 1,786,718 2,280,073 2,464,911 3,891,711
Average Profit (USD2009) 1,429,874 2,016,217 692,095 850,337 1,816,999 2,619,976
Innovators (%) 34.1 32.6 100% 100% 0% 0%
Log(Age) 22.3 26.2 24.4 28.0 21.3 25.3
Sole Proprietorships (%) 16.6% 16.6% 15.4% 13.6% 17.3% 17.8%
Number of Employees 26.8 49.5 29.6 38.7 25.4 54.8
Exporters (%) 11.7% 10.6% 18.6% 17.3% 8.2% 7.3%
Has Foreign Ownership (%) 7.6% 7.2% 5.4% 5.1% 8.8% 8.2%
Top Manager’s Experience (years) 22 24.3 23.4 25.9 21.3 23.4
Notes: Firms are identified as SME or not in 2006. By 2010, 52 SMEs grew to large size.
Source: Enterprise Surveys
25
Table 6. Dep Var: log(Profit)
(1) (2) (3) (4) (5) (6)
ΔInnovator -0.3127* -0.3304* -0.2946^ -0.4181* -0.3792* -0.3614^
(0.0974) (0.0965) (0.1029) (0.1186) (0.1181) (0.1204)
Δlog(sales t-3) 0.4464** 0.4518* 0.4511**
(0.0983) (0.1033) (0.0976)
ΔSole Proprietorship -0.2117 -0.2543 -0.2621 -0.0101 -0.0495 -0.0656
(0.1307) (0.1477) (0.1307) (0.0990) (0.1157) (0.1097)
ΔForeign Ownership 0.0013 0.0007 0.0012 0.0011 0.0006 0.0008
(0.0018) (0.0020) (0.0019) (0.0015) (0.0015) (0.0016)
ΔTop Manager's Experience 0.0021 0.0028 0.0005 0.0021 0.0018 0.0017
(0.0036) (0.0044) (0.0042) (0.0042) (0.0047) (0.0045)
ΔExporter 0.0001 0.0005 -0.0000 0.0002 0.0008 0.0000
(0.0015) (0.0016) (0.0015) (0.0017) (0.0016) (0.0016)
Δlog(age) 0.0947 0.0863 0.0973 -0.0802 -0.0922 -0.0832
(0.0838) (0.0884) (0.0841) (0.1049) (0.1078) (0.1013)
Δlog(size) 0.7322** 0.7059** 0.7635** 0.4706** 0.4599** 0.4863**
(0.1084) (0.1158) (0.1041) (0.0542) (0.0549) (0.0574)
ΔInflation -0.0011 -0.0179
(0.0264) (0.0219)
ΔGDP per capita 0.0001 0.0002
(0.0002) (0.0001)
ΔGDP per capita growth -0.0455^ -0.0506^
(0.0204) (0.0187)
ΔCurrent Account 0.0215 0.0846*
(0.0172) (0.0215)
ΔLending Rate -0.0333 -0.0635*
(0.0176) (0.0150)
Constant -0.3739** -0.6412* -0.4109** -0.4796** -0.9001** -0.6947**
(0.0824) (0.1775) (0.0207) (0.0906) (0.1696) (0.0652)
Lagged Sales X X X
Macroeconomic Variables X X
Country*Year Dummies X X
Firm Fixed Effects X X X X X X
Observations 1,607 1,443 1,607 1,195 1,083 1,195
R-squared 0.093 0.093 0.115 0.207 0.216 0.231
N-country 14 12 14 14 12 14
N-clusters 82 72 82 80 70 80
Notes: A full regression is shown here to illustrate the impact of the explanatory variables in LAC. Cluster is at the country, sub-national
and sector grouping. Standard errors in parentheses, ** p<0.001, * p<0.01, ^ p<0.05. Errors are clustered by country.

26
Table 7. Dep Var: Δlog(Profit), Governance Climate: % of Firms Expected to Pay Informal Payments
(1) (2) (3) (4) (5) (6) (7) (8)
ΔInformal Payments -0.3075* -0.3285* -0.0777 -0.1158 -0.0931 -0.1180 -0.1089 -0.1127
(0.0983) (0.0993) (0.0958) (0.0963) (0.0972) (0.1134) (0.1173) (0.1224)
ΔInnovator 0.0069** 0.0086** 0.0098** 0.0113** 0.0050 0.0083* 0.0086* 0.0034
(0.0016) (0.0017) (0.0022) (0.0014) (0.0035) (0.0021) (0.0022) (0.0043)
ΔInformal Payments * Innovator -0.0175^ -0.0163^ -0.0156* -0.0227** -0.0209** -0.0193**
(0.0059) (0.0056) (0.0048) (0.0041) (0.0037) (0.0033)
Constant -0.3002* -0.5551** -0.3188* -0.5721** -0.3853** -0.4496** -0.8187** -0.6873**
(0.0786) (0.1093) (0.0757) (0.1073) (0.0351) (0.0820) (0.1625) (0.0849)
Lagged Sales X X X
Macroeconomic Variables X X X
Country*Year Dummies X X
Firm Fixed Effects X X X X X X X X
Observations 1,574 1,410 1,574 1,410 1,574 1,172 1,060 1,172
R-squared 0.096 0.096 0.103 0.102 0.119 0.221 0.227 0.240
N-country 14 12 14 12 14 14 12 14
N-clusters 76 66 76 66 76 76 66 76
Notes: Firm characteristics are included in the regression. Group averages for informal payments are at the country, sub-national and sector
grouping. Standard errors in parentheses, ** p<0.001, * p<0.01, ^ p<0.05. Errors are clustered by country.
Table 8. Dep Var: Δlog(Sales), Governance Climate: % of Firms Expected to Pay Informal Payments
(1) (2) (3) (4) (5) (6) (7) (8)
ΔInformal Payments -0.0075 -0.0134 0.0731 0.0640 0.0718 0.0417 0.0607 0.0583
(0.0456) (0.0442) (0.0432) (0.0416) (0.0395) (0.0523) (0.0503) (0.0524)
ΔInnovator 0.0016 0.0007 0.0026 0.0017 0.0043^ 0.0022 0.0015 0.0023
(0.0021) (0.0014) (0.0021) (0.0014) (0.0015) (0.0017) (0.0012) (0.0017)
ΔInformal Payments *
Innovator -0.0062** -0.0060** -0.0056** -0.0063^ -0.0051 -0.0045
(0.0014) (0.0013) (0.0012) (0.0027) (0.0030) (0.0034)
Constant -0.0248 -0.1957 -0.0317 -0.2031 -0.0832** -0.0798 -0.4643** -0.3267**
(0.0511) (0.1609) (0.0512) (0.1663) (0.0180) (0.0522) (0.0725) (0.0429)
Lagged Sales X X X
Macroeconomic
Variables X X X
Country*Year Dummies X X
Firm Fixed Effects X X X X X X X X
Observations 1,821 1,642 1,821 1,642 1,821 1,353 1,232 1,353
R-squared 0.179 0.184 0.181 0.186 0.203 0.412 0.429 0.434
N-country 14 12 14 12 14 14 12 14
N-clusters 76 66 76 66 76 76 66 76
Notes: Firm characteristics are included in the regression. Group averages for informal payments are at the country, sub-national and sector
grouping. Standard errors in parentheses, ** p<0.001, * p<0.01, ^ p<0.05. Errors are clustered by country.
27
Table 9. ΔDep Var: log(Profit), Governance Climate: Courts
(1) (2) (3) (4) (5) (6) (7) (8)
ΔCourts -0.3024^ -0.3133^ -0.4230^ -0.4923* -0.3543 -0.7413** -0.6663* -0.6386*
(0.1053) (0.1153) (0.1774) (0.1584) (0.1728) (0.1575) (0.1615) (0.1515)
ΔInnovator 0.0060 0.0068 0.0051 0.0055 0.0132 0.0019 0.0047 0.0096
(0.0062) (0.0102) (0.0058) (0.0100) (0.0075) (0.0068) (0.0088) (0.0076)
ΔCourts * Innovator 0.0040 0.0058 0.0027 0.0109^ 0.0098^ 0.0098^
(0.0048) (0.0040) (0.0044) (0.0040) (0.0038) (0.0036)
Constant -0.3534** -0.3671 -0.3534** -0.3347 -0.3975** -0.4559** -0.5338 -0.6821**
(0.0823) (0.3870) (0.0811) (0.3759) (0.0231) (0.0898) (0.3595) (0.0653)
Lagged Sales X X X
Macroeconomic Variables X X X
Country*Year Dummies X X
Firm Fixed Effects X X X X X X X X
Observations 1,574 1,410 1,574 1,410 1,574 1,172 1,060 1,172
R-squared 0.093 0.092 0.093 0.093 0.117 0.213 0.220 0.237
N-country 14 12 14 12 14 14 12 14
N-clusters 76 66 76 66 76 76 66 76
Notes: Firm characteristics are included in the regression. Group averages for Courts are at the country, sub-national and sector grouping.
Standard errors in parentheses, ** p<0.001, * p<0.01, ^ p<0.05. Errors are clustered by country.
Table 10. Dep Var: Δlog(Sales), Governance Climate: Courts
(1) (2) (3) (4) (5) (6) (7) (8)
ΔCourts -0.0058 -0.0171 -0.0564 -0.0955 -0.0333 -0.1935^ -0.1187 -0.1207
(0.0473) (0.0487) (0.0853) (0.0735) (0.0799) (0.0736) (0.0743) (0.0711)
ΔInnovator 0.0021 -0.0017 0.0017 -0.0022 -0.0019 0.0004 -0.0012 -0.0033
(0.0030) (0.0052) (0.0032) (0.0053) (0.0047) (0.0030) (0.0036) (0.0036)
ΔCourts * Innovator 0.0017 0.0026 0.0011 0.0053* 0.0038^ 0.0040*
(0.0019) (0.0014) (0.0016) (0.0014) (0.0014) (0.0013)
Constant -0.0351 -0.2448 -0.0351 -0.2287 -0.0999** -0.0800 -0.4481** -0.3322**
(0.0434) (0.2515) (0.0429) (0.2436) (0.0158) (0.0513) (0.1000) (0.0425)
Lagged Sales X X X
Macroeconomic
Variables X X X
Country*Year Dummies X X
Firm Fixed Effects X X X X X X X X
Observations 1,821 1,642 1,821 1,642 1,821 1,353 1,232 1,353
R-squared 0.179 0.184 0.179 0.184 0.201 0.413 0.429 0.435
N-country 14 12 14 12 14 14 12 14
N-clusters 76 66 76 66 76 76 66 76
Notes: Firm characteristics are included in the regression. Group averages for Courts are at the country, sub-national and sector grouping.
Standard errors in parentheses, ** p<0.001, * p<0.01, ^ p<0.05. Errors are clustered by country.