the german energiewende and implications for · pdf filethe german energiewende and...
TRANSCRIPT

RWE AG PAGE 1
The German Energiewende and Implications for Utilities
Graham Weale, Chief Economist – RWE AGUC Davis IAEE Seminar 3rd June 2014
24/05/2014

RWE AG PAGE 2
Contents
1. What is the position of the German utilities?
2. What has brought them there?
3. What changes are underway in Berlin?
4. What will be the utilities’ role in the future?
24/05/2014

RWE AG PAGE 3
The position of the German utilities – high capital invested in conventional plants…
24/05/2014
0
20
40
60
80
100
GW
OtherBig-4
Other non-RES
RES (incl.hydro)
Nuclear
Lignite
Hard Coal
Gas
0
10
20
30
40
50
60
70
€ bn
OtherBig-4
Net Capacity End 2012 Indicative capital employed based on 50% new value
Peak demand
Source: BMWi

RWE AG PAGE 4
… but making a low EBIT with declining market value and reduced investments
24/05/2014
EBIT Market Value
Investments Cumulative impairments
0
5
10
15
20
25
€ bn
-35%
2013201220112010200920082007
Vattenfall
RWE
EnBW
E.ON
0
50
100
150
200 -70%
2013201220112010200920082007
€ bn
50
160
2010200920082007 20122011
€ bn
20
15
10
5
02013
0
5
10
15
20
25
30
€ bn
2007 20122011201020092008
-45%
2015*2014*2013
Source: Company annual reports

Page 5RWE AG – CEA 01/04/2014
€ 000 / MW
20142010 2013 201520122009
0
10
20
30
40
50
60
70
80
90
2011
80
90
30
2013
10
2015
€ 000 / MW
0
2014
20
2012
40
70
60
50
2009 2010 2011
Gas plants never recovered their full costs; from2011/2012 failed to cover depreciation then O&M
New plants Old (fully amortised) plants
Normal return on capital
Depreciation
Staff & Maintenance
Annual proceeds
Annual proceeds Staff & Maintenance

Page 6RWE AG – CEA 01/04/2014
2009 2011 2012 2013 2014
100
150
€ 000 / MW
2010
0
2015
50
2013
0
20152010 201220112009 2014
50
100
150
€ 000 / MW
…but new coal plants not earning a return on capital whilst old plants covering fixed costs
New plants Old (fully amortised) plants
Normal return on capital
Depreciation
Staff & Maintenance
Annual proceedsAnnual proceeds
Staff & Maintenance
RWE AG PAGE 7
Contents
1. What is the position of the German utilities?
2. What has brought them there?
3. What changes are underway in Berlin and Brussels?
4. What will be the utilities’ role in the future?
24/05/2014

RWE AG PAGE 8
Energiewende
2010 20122011
The Energiewende – a plan to move from nuclearand coal to renewables: milestones from 1991
2050
Start ofEU
EmissionsTrading Scheme
Nuclear phase-out by 2022
Energyconcept
Nuclear operatinglifetime extension
1st Feed-in Law
Last nuclearreactor will
be shut down
80% to 90% reduction in
emissions, and 80% renewables share in
power
EEG 2012
Closure of 8 nuclear plants andchange to nuclear law to close
all plants by 2022
Eckpunkte-papier
Market Liberalization
19981991 20022000 2005 202220142004 2009
EEG 2004 12.5% / 20% power sharein 2010 / 2020
EEG 2009 35% power
share by2020
EEG Reform
1st EEG
Double RES share of
total energyby 2010

Page 9RWE AG – CEA : 01/04/2014
Further targets introduced in 2011…
W1
Currently only loosely defined goals
C
C
Limit renewables surcharge to 3.5 cents/kWh
Reduce heat demand of buildings compared to 2008
Annual rate of energy-saving renovation in housing of 2%
V Additional construction of firm fossil fuel power p lant capacity
Not availabe
- - EnEV
- - Only indirect – loanprogramme
10 GW - Not available
V1 Supply security - Strategic Reserve
C1
C2
C3
C4
C5
C6
C7
C8
N1
Increase proportion of renewables (RES) in gross fi nal energy consumption to
Increase the proportion of RES in gross elec. consu mption to
Reduce primary energy consumption compared to 2008 to
Reduce electricity consumption compared to 2008 by
Increase energy efficiency compared to 2007 by
Reduce heat demand of buildings compared to 2008 by
Increase number of electric vehicles to
Reduce final energy consumption in transport vs.200 8 by
Grid expansion according to ENLAG
35% 50% EEG
20% - Environmental tax, EnEV
10% - Environmental tax
20% - Environmental tax and otherlaws
20% - EnEV
1 Mio. 6 Mio. Energy and climate funds
10% - Reform car tax
- - EnLAG
Firm goals 2020 2030 Instruments 1
C0 Reduce greenhouse gas emissions compared to 1990 by 40% 55% ETS with German version
18% 30% Renewable heating, andBiomass laws,
N2 Punctuality of the grid connection of offshore wind farms - - EnWG
N3 Increase installed capacity of offshore wind to 10 GW 25 GW EEG
-
K1 Phase out nuclear power by 2022 2011 Nuclear Power Law

Slide 10RWE AG – 01/04/2014
1. Achievement of federal government‘s CO2 reduction target (-40 %) increasingly unrealistic2. Share of renewables rising in the case of electricity – stagnation in the transport and heating sectors3. Due to first results from coalition talks the watering down of heating efficiecy targets is likely
1. More than 80% of expansion projects still delayed2. By 2015 a number of offshore wind farms will be completed, but key grid expansion projects for
overland transmission of electricty will not be ready until that time3. At least there is some improvement in sight for offshore wind power connections to the grid
Grid expansion
… which were badly off track after just two years, except for renewables growth
Source: own calculations
78%
Sustainability
Security of supply
Costs/EEG levy
15%
50%
22%1. With 6.2 ct /kwh the EEG levy has exceeded the government‘s own threshold of 3.5 ct / kWh by far2. With the new government at least modest reforms that are targeting at limiting the costs are to
expect, so we come to an neutral outlook for the next years, but situation will not improve quickly
1. Increasing intervention by transmission system operators in the market to avoid critical situations with the power grid. The situation continued in whole 2013.
2. End of March 2013 there were some severe situations in the German grid due to very high wind feed-in.
= 41%Adherence to target path:

RWE AG PAGE 11
The implications of the Energiewende together with the 2007 global recession1. Renewables subsidy system without
any cap
– annual support originally expected to be € 0,6 bn, not € 22 bn
– has its origins in the 2000 EEG, rather than the 2011 “Energiewende”
– costs (esp. PV) continually lower than subsidies = strong incentive
2. Recession
3. Low CO2 prices
4. Low coal prices
5. Over-investment in conventional plant based on trend from early 2000’s
24/05/2014
0
5
10
15
20
25
0
1
2
3
4
5
6
2002
€ bn
201220102008200620042000
€cts/kWh
EEG levy
EEG Surcharge
CHP
Levy based on §§§§19
Offshore charges
0
50
100
150
2000 2002 2004 2006 2008 2010 2012
GW
PV
Total
Water (exc. PS)
Biomass
Wind
Renewables capacity build-up
Subsidies for the Energiewende
2000 2004 2009

RWE AG PAGE 12
Generators suffered from two effects cutting volume by 15% vs. expected level...
� 15% lower than expected demand due 60% to recession and 40% to renewables
24/05/2014
0
100
200
300
400
500
600
700
2000 2002 2004 2006 2008 2010 2012
TWh
Lower residual demand
Renewables expected base on trend to 2005
Renewables actual
Gross demand actual
Gross demand expected
Thermal power supplied by large generators
Actual and expected (as of 2005) demand and renewab les
RWE AG PAGE 13
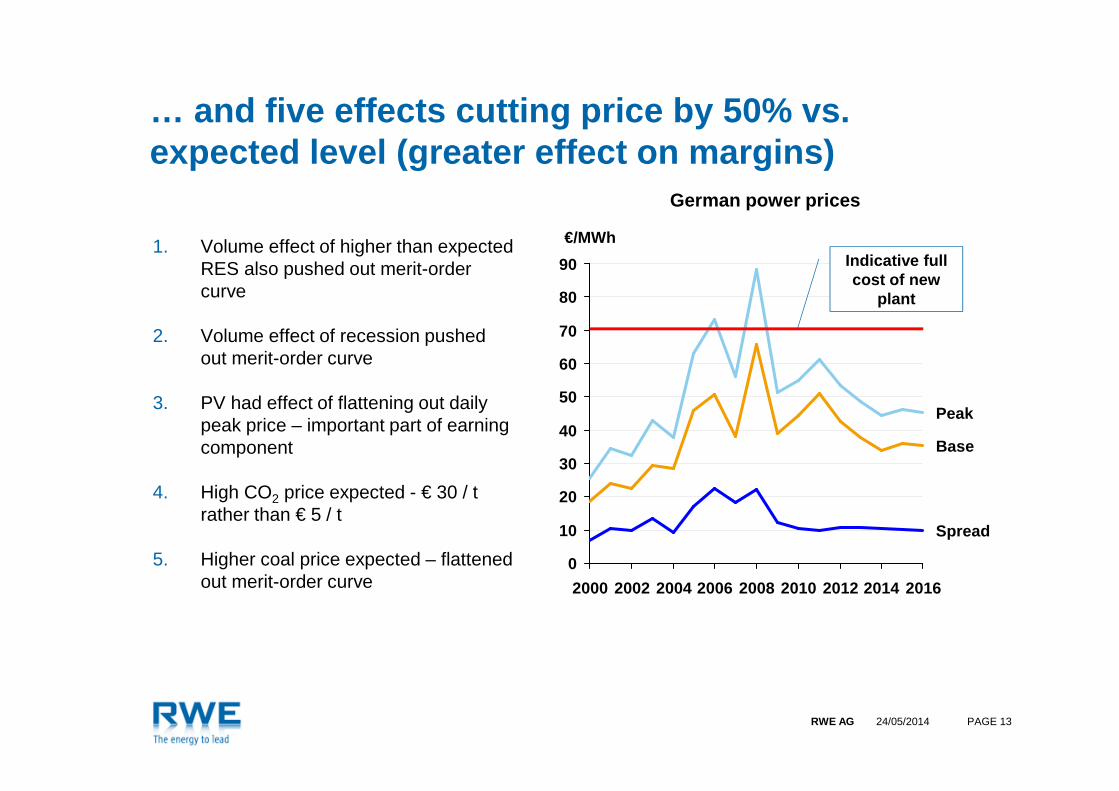
… and five effects cutting price by 50% vs. expected level (greater effect on margins)
1. Volume effect of higher than expected RES also pushed out merit-order curve
2. Volume effect of recession pushed out merit-order curve
3. PV had effect of flattening out daily peak price – important part of earning component
4. High CO2 price expected - € 30 / t rather than € 5 / t
5. Higher coal price expected – flattened out merit-order curve
24/05/2014
0
10
20
30
40
50
60
70
80
90
201620082002 2012 20142000
Base
2006
Peak
2010
Spread
2004
€/MWhIndicative fullcost of new
plant
German power prices

Page 14RWE AG – 01/04/2014
0
20
40
60
80
100
120
140
160
180
200
Peak loadMin load
MW
Germany: Merit Order 2009 (€ / MWh)
Average available
Wind / PV / Hydro / other Renew.
Renewables / CHP
Nuclear
Hard Coal
Gas
Oil / Gasoil
Lignite
Thermal plant Merit-Order 2009: new gas andhard coal plants competing strongly

Page 15RWE AG – 01/04/2014
Germany: Merit Order 2012 (€ / MWh)
0
20
40
60
80
100
120
140
160
180
200
Peak loadMin load
Thermal plant Merit Order 2012: hard coal plantswith high utilisation but gas weakening
Average available
Wind / PV / Hydro / other Renew.
Renewables / CHP
Nuclear
Hard Coal
Gas
Oil / Gasoil
Lignite
MW

Page 16RWE AG – 01/04/2014
Progressive reduction of mid-day price through PV-genera tion
The PV reduced the mid-day prices whichaccounted for high share of earnings
0
50
100
150
200
250[%]
Hour of day242322212019181716151413121110987654321
2011
2010
2009
2008
2007

PAGE 17RWE AG CEA - Weale
Power prices for industrial consumers (20-70 GWh) €ct/kWh excl. VAT
The Consumer Price has been driven up by the surcharge despite a falling wholesale price
0
2
4
6
8
10
12
2008 2009 2010 2011 2012
Base price
Consumer
Power prices for households(2.5-5 MWh) €ct/kWh incl. all taxes
0
5
10
15
20
25
30
2008 2009 2010 2011 2012
Peak price
Consumer
Source: BMWi Energiedaten 21.05.2013 and EEX
0
5
10
15
20
25
01
23
45
6€ bn
2012201020082006200420022000
€cts/kWh
EEG levy
CHP
Levy based on §§§§19
Offshore charges
EEG Surcharge
EEG Subsidies and Consumer Price Surcharge

PAGE 18RWE AG CEA - Weale
The renewables policy has led to work for 0.8% of the German workforce
� Earlier Red-Green Coalition had hopes that 500 T jobs would be created by 2020
– But loss of jobs (including growth prospects) in other sectors should be deducted
� Growing number of bankruptcies in renewables area since 2011, especially PV but also wind
100
150
200
250
300
1998 2004 2006 2007 2008 2009 2010 2011 2012 2013e
350
400000s
0
50
R&D / Admin
Hydropower
Geothermal
Biomass
Windpower
PV
Unclassified
Employees in the renewables sector

RWE AG PAGE 19
Contents
1. What is the position of the German utilities?
2. What has brought them there?
3. What changes are underway in Berlin?
4. What will be the utilities’ role in the future?
24/05/2014

Page 20RWE AG CEA - Weale
The proposal for revision of the EEG agreed in Cabinet on 8th April 2014
� Aim to reach 40-45% by 2025 then 55-60% by 2035 rene wables share of power but always ensuring affordability and supply security
� Reduce average RES cost level from €cts 17 / kWh to € 12 / kWh
� RES growth corridor will be legally fixed , with technology-specific instruments and focus on the most cost-efficient technologies
– Offshore wind 6.5 GW to 2020 and 15 GW to 2030 and afterwards 2 wind-parks p.a.
– Onshore wind and PV each a maximum growth of 2.5 GW p.a. (excluding repowering), with appropriate tariff adjustment
– Biomass maximum 100 MW p.a. (considered too expensive for more)
� Improved market integration through a market-premium approach and direct marketing
� New EEG (renewables law) will be fully EU-conform, including industry privileges
� Market design – a capacity market is envisaged medium-term
– not clear whether it will be technologically-neutral and all plants will be eligible
� Time-plan – Parliamentary process to be followed with am of entering into law 1st August 2014

Page 21RWE AG CEA - Weale
Renewables growth path proposed by new EEG compared with past…
2000 2002 2004 2006 2008 2010 2012 2014 2016 2018 2020 2022 2024 2026
GW 8765
43210
Biomass
Wind Offshore
Wind Onshore
PV
2000 2002 2004 2006 2008 2010 2012 2014 2016 2018 2020 2022 2024 2026
150GW
100
50
0
Total
PV
Wind Onshore
Wind Offshore
Biomass
Annual growth
Total capacity

Page 22RWE AG – CEA : 01/04/2014
The cost for power supply with a 35% RES share (target for 2020)
EE
G*
1.0
conventional generation
Price (ct/kWh)
0
4
12
17
20
60 TWh150 TWh
35 % RES 65 % Conventional
390 TWh
Ensure a cost efficient expansion of renewables
Capacity remuneration mechanism to ensure security of supply cost efficient
~600TWh
EE
G*
2.0
* EEG = German renewable energy act
Source: Federal Ministry of Economic Affairs and Energy

Page 23RWE AG – CEA : 01/04/2014
1 2 3 4 5 6 7 8 9 10
Power generation in TWh
20
18
16
14
12
10
8
6
4
2
Offshore wind
Bio
mas
s
PVOnshore wind
Average depends on technology mix
Remuneration ct/kWh
* EEG = German renewable energy act
Source: Federal Ministry of Economic Affairs and Energy
The plan to reduce the average cost forincremental RES to €cts 12 /kWh

Page 24RWE AG CEA - Weale
… and putting a limit on subsidies and the EEG surcharge even in a worst case
0
5
10
15
20
25€ bn
50% 40%
202520222020201820162014
0
Constant
Rising
2025202220202018
€cts/kWh
201620142012
8
7
6
5
4
Wholesale prices:
Subsidy costs by type
Onshore
Others
PV
Hydro
Biomass
Offshore
EEG-Surcharge
RWE AG PAGE 25
Contents
1. What is the position of the German utilities?
2. What has brought them there?
3. What changes are underway in Berlin?
4. What will be the utilities’ role in the future?
24/05/2014

RWE AG PAGE 26
Three essential elements to the supply
1. Affordability – the commodity (kWh) and service level must be delivered at lowest cost
– Use lowest cost fuels consistent with meeting EU carbon targets and most efficient plants
– Make use of existing thermal plants to provide service element
24/05/2014
2. Supply-security
– Achieved by the round-the-clock availability of conventional plants and their increasing flexibility
– Also by introduction of further flexibility along delivery chain –smart grids, smart meters etc
3. Carbon reduction
– Controlled by Emissions Trading Scheme – ensures targets are met
– Achieved by combination of renewables and fuel-switching

RWE AG PAGE 27
80
60
40
20
Mo Tu We Th Fr Sa Su
Demand
PV
Water
Thermal plants
Wind Onshore/Offshore
Biomass
GW Almost no thermal plant contribution
Some 20-30 GWcontribution
Indication of the role for thermal plants in August 2022
The integration of renewables will require a muchhigher „service“ component
� Wind and PV will become the basis for power supply; the remaining plants will optimisethemselves around this supply
� Most thermal plants will be only needed in the future at times of low wind / sun – there will be nolonger base-load plants
Source: Agora Energiewende (12 Thesen zur Energiewende, 2012)

RWE AG PAGE 28
Where are the utilities going? Shifting from kWh production to even higher emphasis on service
24/05/2014
0
100
200
300
400
500
600
700TWh
Therm - utilities
RES - utilities
Therm - other
RES - other
2035*2020*2013*2007
Less conventional production(indicative figures)
More effort on serviceQualititive Index vs. 2010
0
20
40
60
80
100
120
140
Therm. firm capacity
Therm. flexibility
Ren. firm capacity
Trading
Network
Retail
2030202020132007
RES. = renewables, Therm. = conventional thermal plants

RWE AG PAGE 29
What does flexibility mean for power plants?
1
2
Wholesale price vs. variable costs (€/MWh)
50
Power production (MW)-
0
Inflexible plant
Flexible plant
�
�400
800
600
EEX
Variable costs
� Dynamic performance
– High rate of changing load output
– Short-times for ramping up/down
� Operational flexibility
– Low minimum load with high efficiency
– High number of start p.a.
– Low costs for ramping up/down
– Short minimum load times
� Organisational flexibility
– Flexible shift models with wide range of staff qualifications
– Market-orientated maintenance plan
� Additional factors
– Permit restrictions, fuel quality and contract flexibility

RWE AG PAGE 30
Time (minutes)
600 MW - Block old position
600 MW - Blocknew position
Example Weisweiler Lignite Plant: renewal of theControl Technology increases the load rates
� Retrofitting of all 600-MW-Blocks withmodern digital control in combination withthe required technical adjustments to theplant
� Renewal of the control system is therequirement to improve the ramping
� Increasing the flexibility of the 600-MW Lignite blocks: ramping rate increased to 10 MW/ minute and minimum load to 170 MW.
� Contributes to life-time extension
� Allows the plant to operate in the secondarymarkets
0
100
200
300
400
500
600
MW

RWE AG 01/04/2014 31
RWE Contributions downstream - Smart grids
Quelle: ZSW

RWE AG 01/04/2014 32
Summary – examples RWE: future earnings shifting from production to service side
RWE develops towards an attractive stable downstrea m business profile with additional focus on renewables and upside potential from conven tional power generation
6.4
51%
48%
24%
55%
Operating result in € bn
5.9
4.5 – 4.9e
<20%
>60%
UpstreamGas & OilRenewables
Distribution andSupply
Conventionalpower generation
Trading GasMidstream 2012 2013 2014e
5%–10%
Of whichcirca40%-50%regulated
>70%
10%–15%
Mid-term
4

RWE AG PAGE 33
THANK YOU VERY MUCH FOR YOUR ATTENTION.
+ 49 201 17 17471 or + 49 162 254 4846