energiewende presentation
TRANSCRIPT
??
1
Storage Requirement Analysis
??
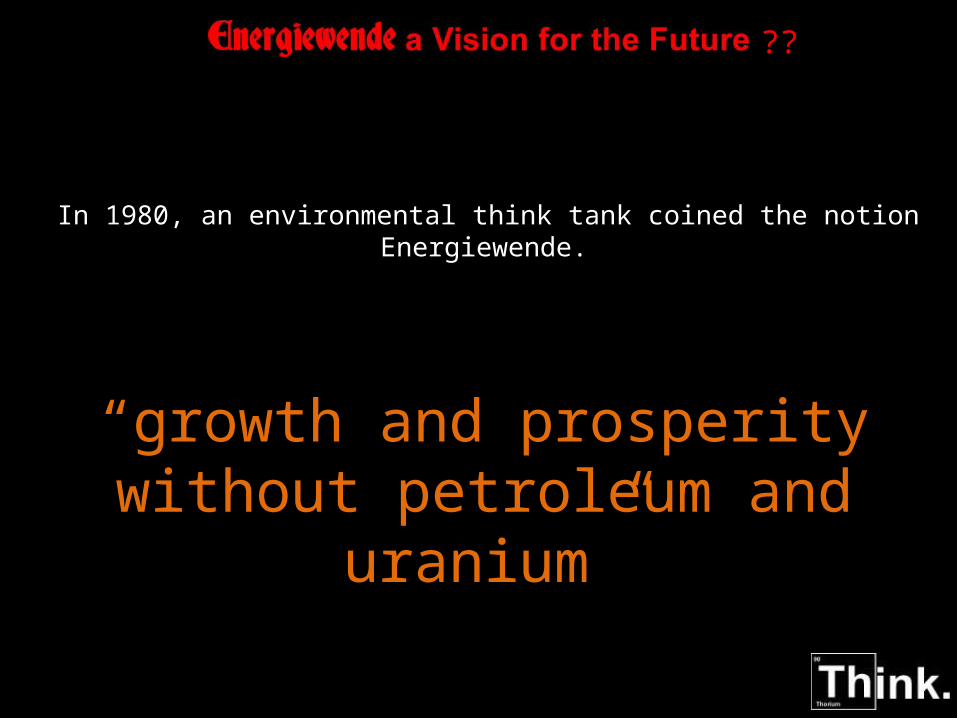
In 1980, an environmental think tank coined the notion Energiewende.
“growth and prosperity without petroleum and uranium”
??
In this slide show, German PV, wind & demand data for every hour between January 1st 2012 & December 31st 2013 has been recorded and is used to build an image of the grid as it stands today. PV & Wind power output is then increased by varying factors to build a realistic picture of a future German grid.
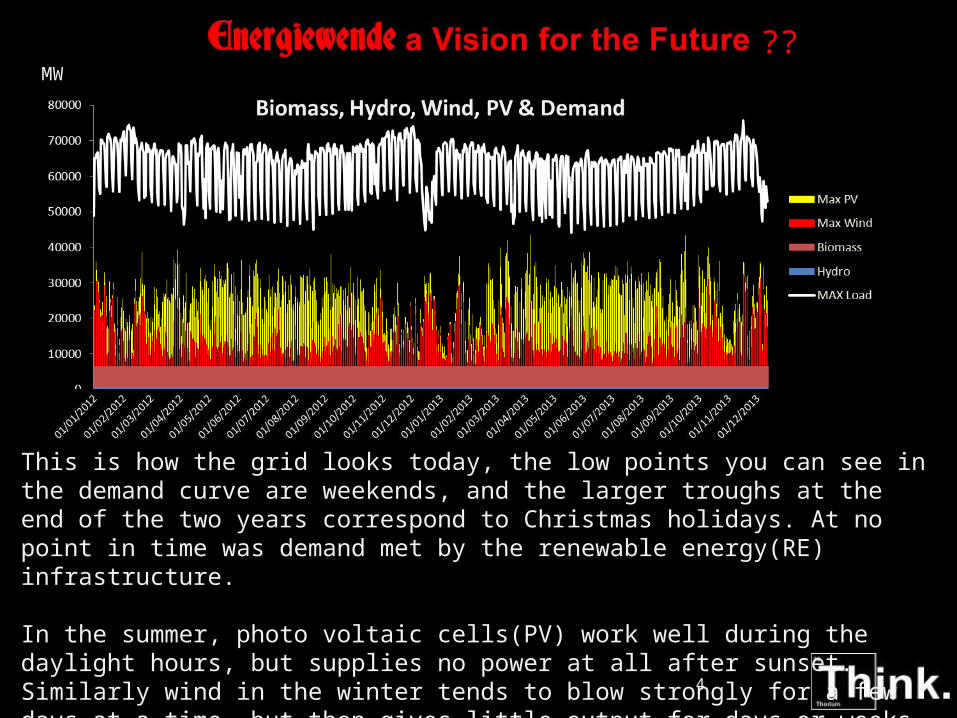
Hydro & Biomass power output is assumed to be constant at 500MW & 6000 MW throughout.
3
??
This is how the grid looks today, the low points you can see in the demand curve are weekends, and the larger troughs at the end of the two years correspond to Christmas holidays. At no point in time was demand met by the renewable energy(RE) infrastructure.
In the summer, photo voltaic cells(PV) work well during the daylight hours, but supplies no power at all after sunset. Similarly wind in the winter tends to blow strongly for a few days at a time, but then gives little output for days or weeks. For RE to be effective & replace fossil fuel it needs to be increased dramatically and its variability somehow reduced or compensated.
MW
4
??
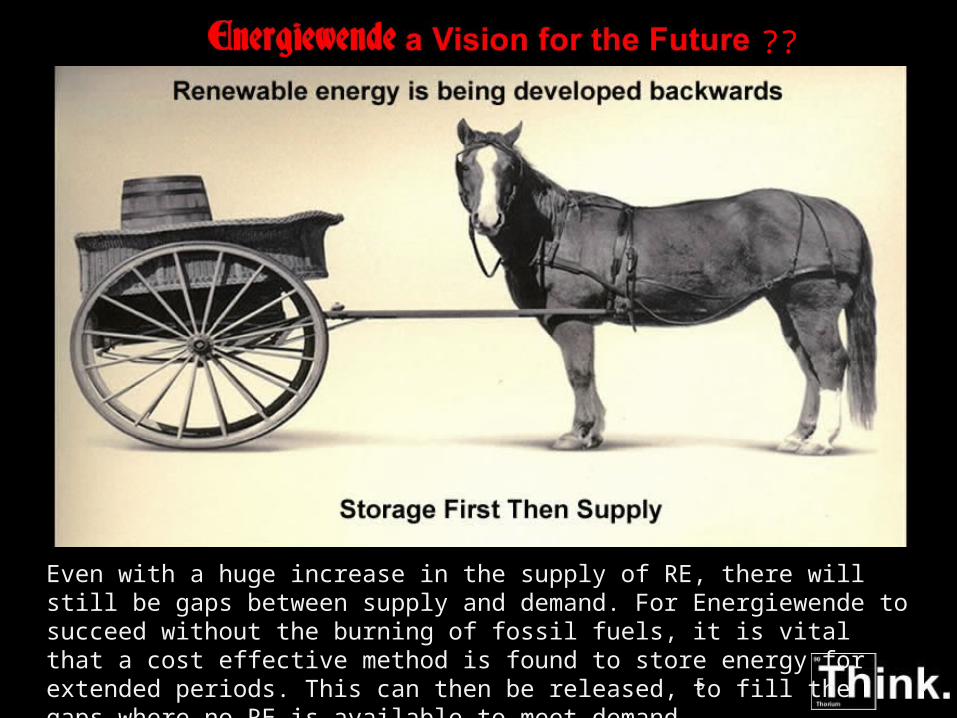
Even with a huge increase in the supply of RE, there will still be gaps between supply and demand. For Energiewende to succeed without the burning of fossil fuels, it is vital that a cost effective method is found to store energy for extended periods. This can then be released, to fill the gaps where no RE is available to meet demand.
5
??
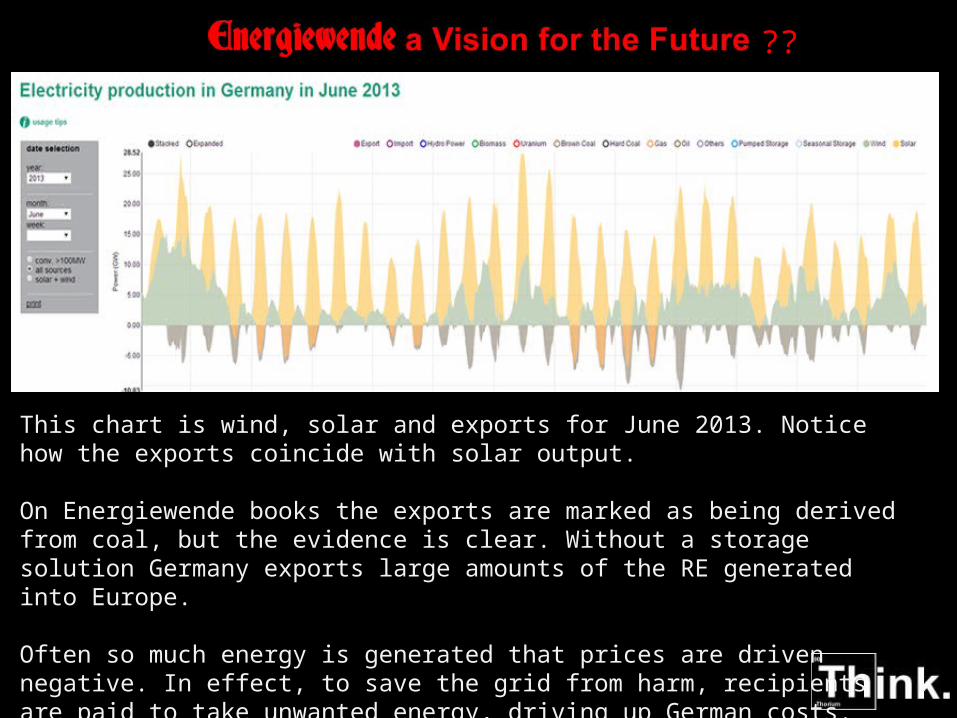
This chart is wind, solar and exports for June 2013. Notice how the exports coincide with solar output.
On Energiewende books the exports are marked as being derived from coal, but the evidence is clear. Without a storage solution Germany exports large amounts of the RE generated into Europe.
Often so much energy is generated that prices are driven negative. In effect, to save the grid from harm, recipients are paid to take unwanted energy, driving up German costs.
??
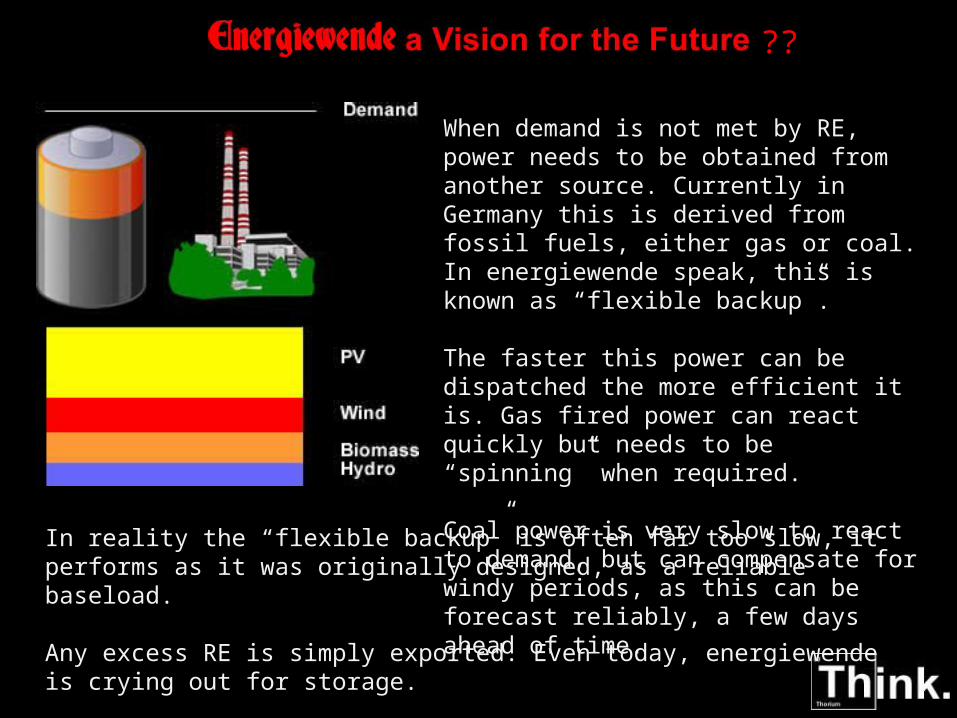
When demand is not met by RE, power needs to be obtained from another source. Currently in Germany this is derived from fossil fuels, either gas or coal. In energiewende speak, this is known as “flexible backup”.
The faster this power can be dispatched the more efficient it is. Gas fired power can react quickly but needs to be “spinning” when required.
Coal power is very slow to react to demand, but can compensate for windy periods, as this can be forecast reliably, a few days ahead of time.
In reality the “flexible backup” is often far too slow, it performs as it was originally designed, as a reliable baseload.
Any excess RE is simply exported. Even today, energiewende is crying out for storage.
??
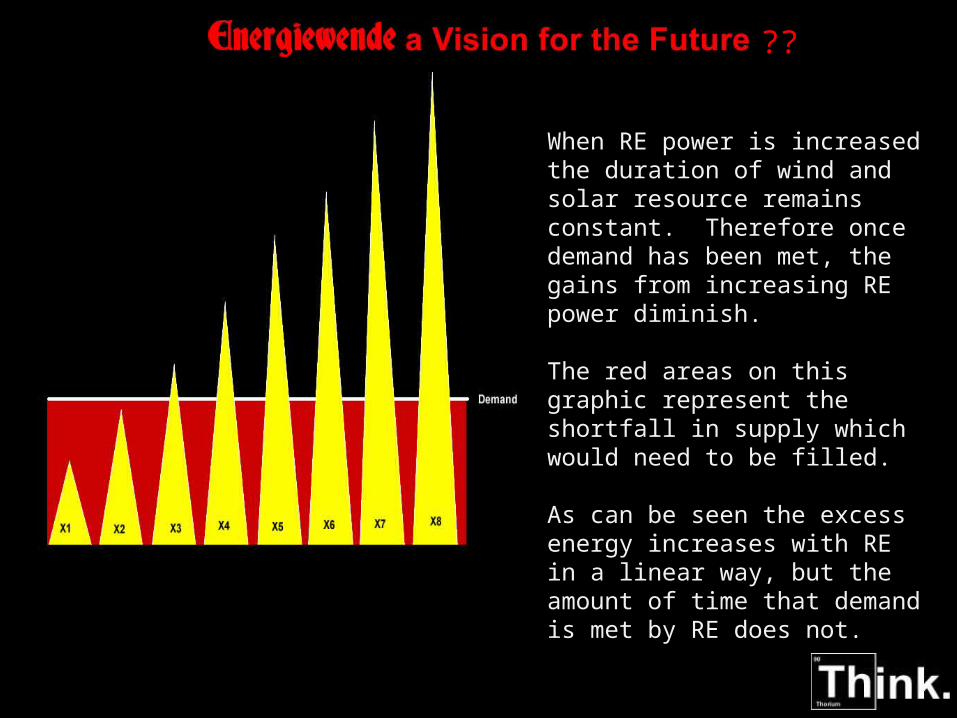
When RE power is increased the duration of wind and solar resource remains constant. Therefore once demand has been met, the gains from increasing RE power diminish.
The red areas on this graphic represent the shortfall in supply which would need to be filled.
As can be seen the excess energy increases with RE in a linear way, but the amount of time that demand is met by RE does not.
??
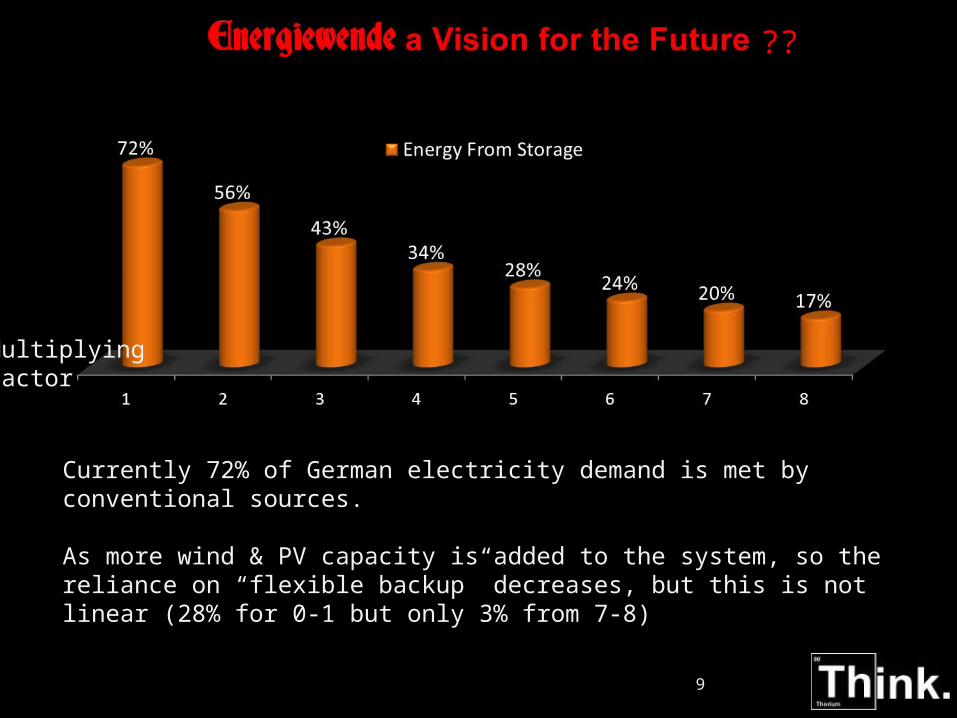
Currently 72% of German electricity demand is met by conventional sources.
As more wind & PV capacity is added to the system, so the reliance on “flexible backup” decreases, but this is not linear (28% for 0-1 but only 3% from 7-8)
MultiplyingFactor
9
??TWh
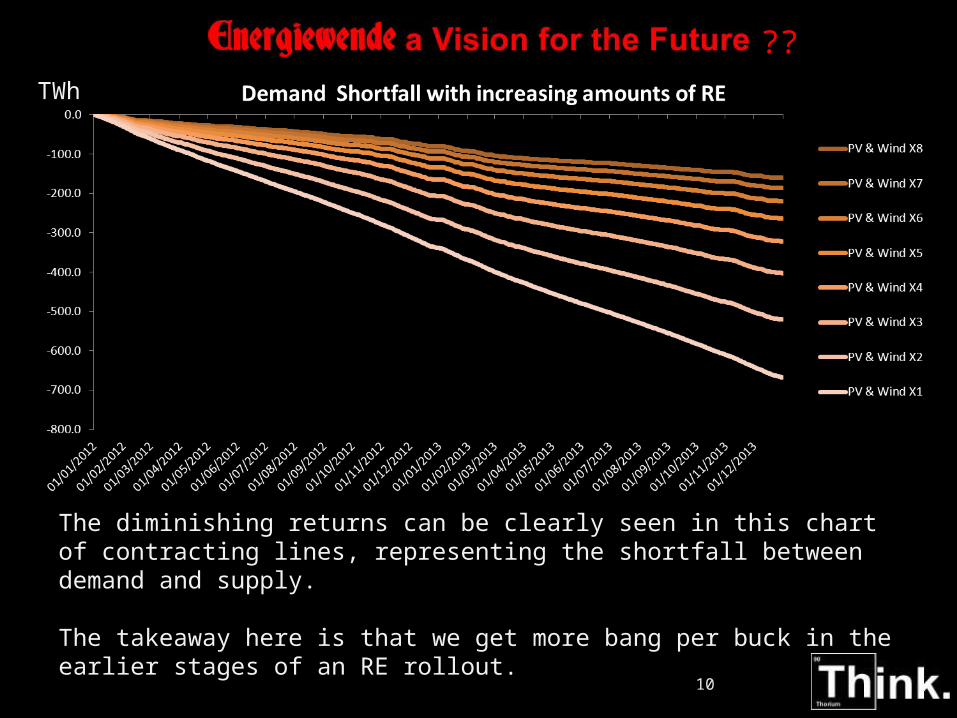
The diminishing returns can be clearly seen in this chart of contracting lines, representing the shortfall between demand and supply.
The takeaway here is that we get more bang per buck in the earlier stages of an RE rollout.
10

??
At factors of 2 and above the peaks in supply start to satisfy demand, anything over and above the immediate power requirement is available for export or storage.
Using the actual data it can be clearly seen that the increase is relatively linear with increasing RE infrastructure.
TWh
11
??
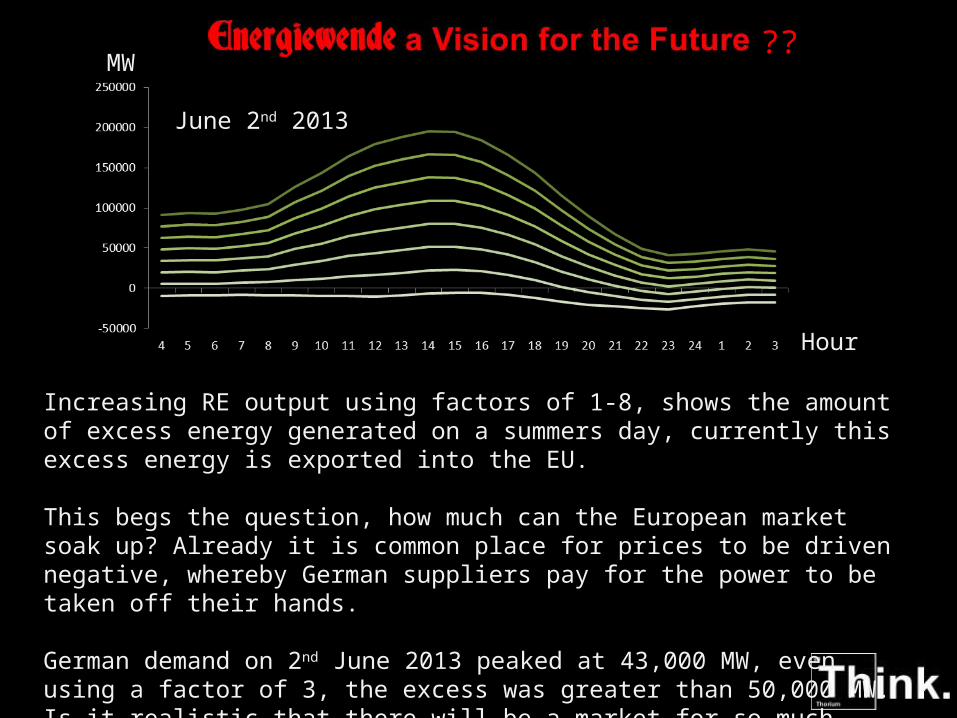
June 2nd 2013
Increasing RE output using factors of 1-8, shows the amount of excess energy generated on a summers day, currently this excess energy is exported into the EU.
This begs the question, how much can the European market soak up? Already it is common place for prices to be driven negative, whereby German suppliers pay for the power to be taken off their hands.
German demand on 2nd June 2013 peaked at 43,000 MW, even using a factor of 3, the excess was greater than 50,000 MW. Is it realistic that there will be a market for so much power or is storage an absolute necessity?
MW
Hour
??
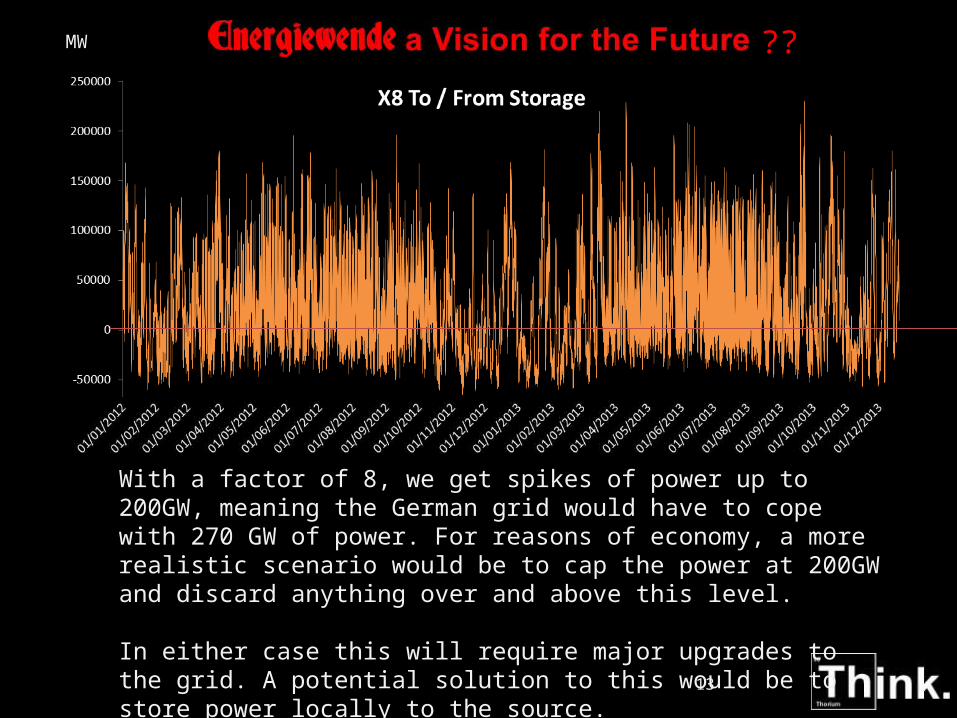
With a factor of 8, we get spikes of power up to 200GW, meaning the German grid would have to cope with 270 GW of power. For reasons of economy, a more realistic scenario would be to cap the power at 200GW and discard anything over and above this level.
In either case this will require major upgrades to the grid. A potential solution to this would be to store power locally to the source.
MW
13
??
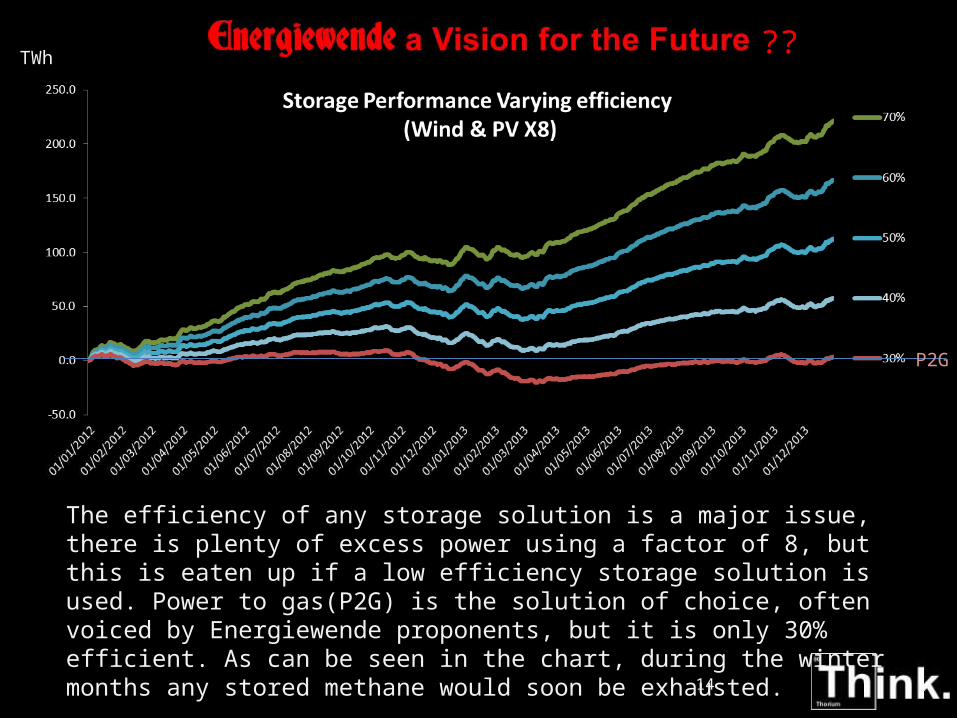
The efficiency of any storage solution is a major issue, there is plenty of excess power using a factor of 8, but this is eaten up if a low efficiency storage solution is used. Power to gas(P2G) is the solution of choice, often voiced by Energiewende proponents, but it is only 30% efficient. As can be seen in the chart, during the winter months any stored methane would soon be exhausted.
TWh
14
P2G
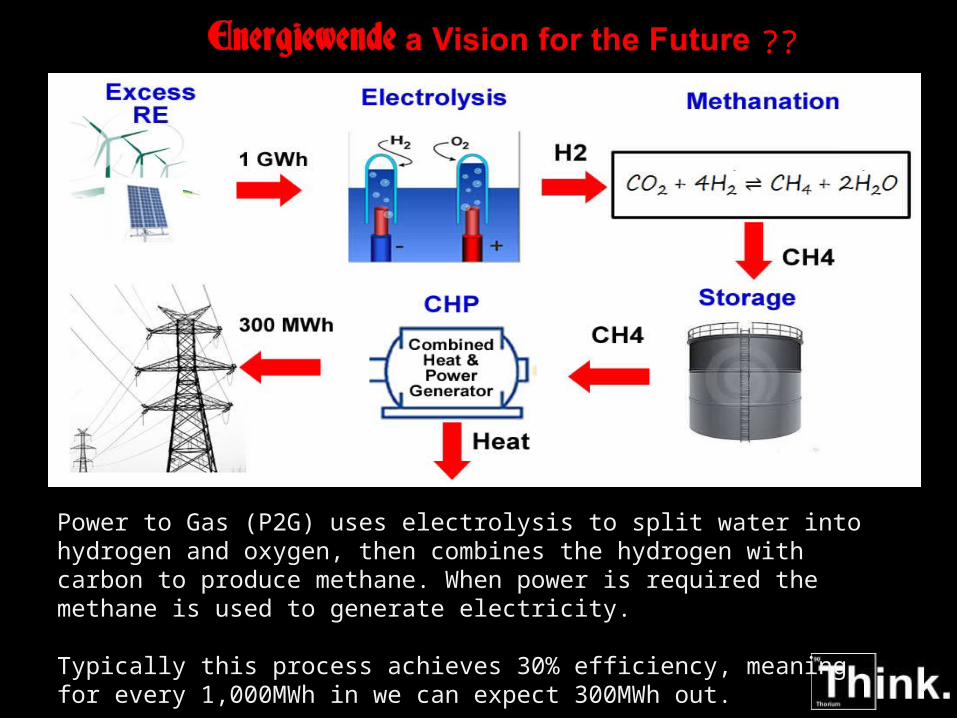
??
Power to Gas (P2G) uses electrolysis to split water into hydrogen and oxygen, then combines the hydrogen with carbon to produce methane. When power is required the methane is used to generate electricity.
Typically this process achieves 30% efficiency, meaning for every 1,000MWh in we can expect 300MWh out.
http://www.edgar-program.com/news/gas-to-power-on-the-go
??
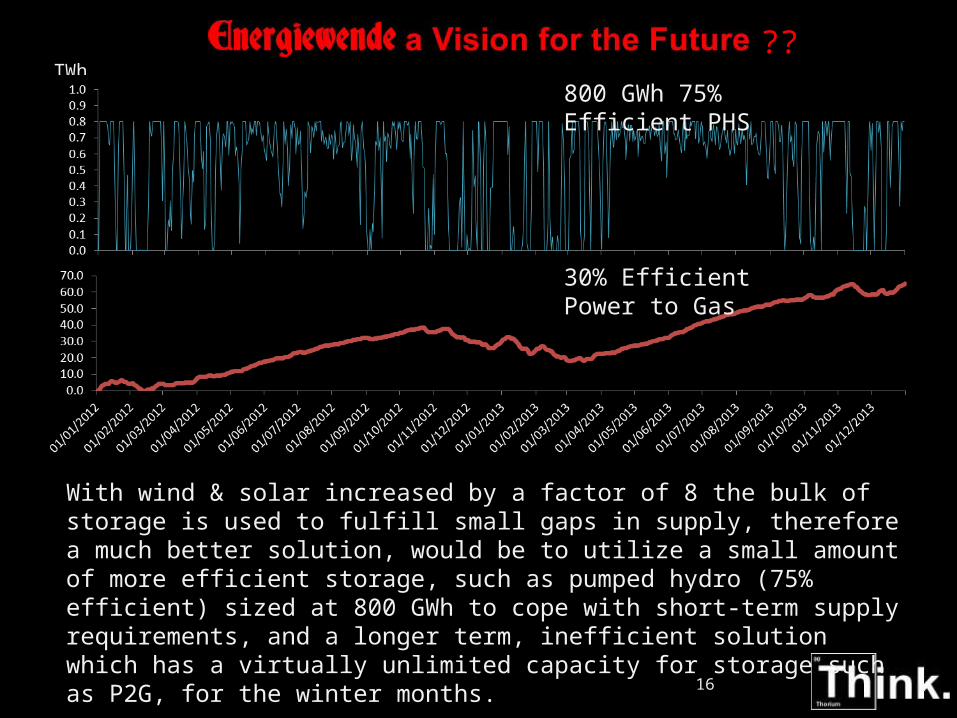
With wind & solar increased by a factor of 8 the bulk of storage is used to fulfill small gaps in supply, therefore a much better solution, would be to utilize a small amount of more efficient storage, such as pumped hydro (75% efficient) sized at 800 GWh to cope with short-term supply requirements, and a longer term, inefficient solution which has a virtually unlimited capacity for storage such as P2G, for the winter months.
TWh
16
800 GWh 75% Efficient PHS
30% Efficient Power to Gas
??
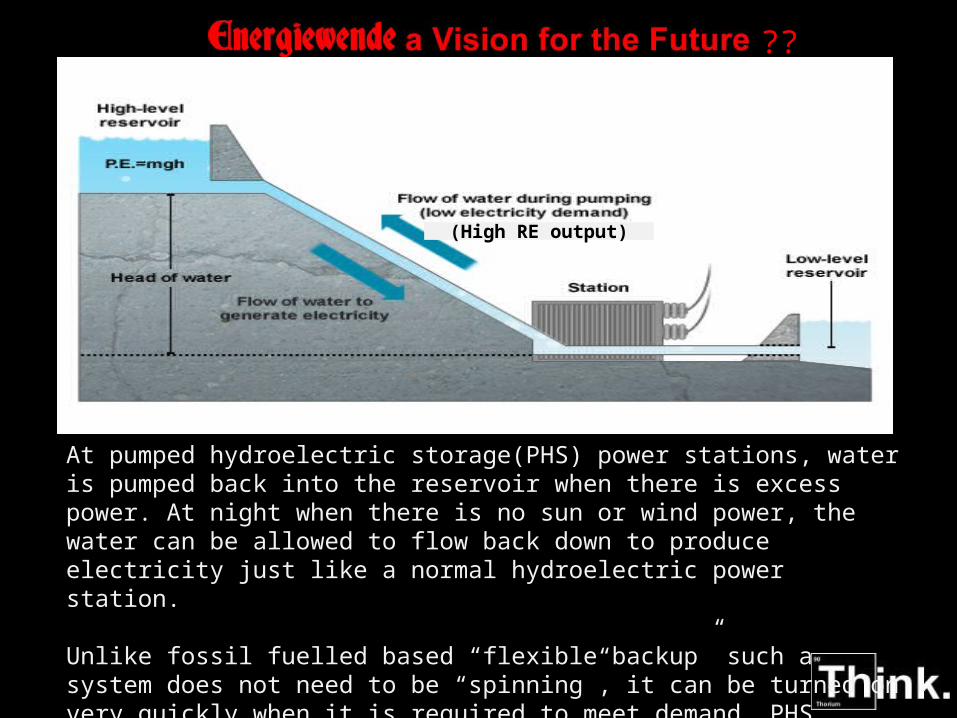
At pumped hydroelectric storage(PHS) power stations, water is pumped back into the reservoir when there is excess power. At night when there is no sun or wind power, the water can be allowed to flow back down to produce electricity just like a normal hydroelectric power station.
Unlike fossil fuelled based “flexible backup” such a system does not need to be “spinning”, it can be turned on very quickly when it is required to meet demand. PHS typically achieves 75% efficiency.
(High RE output)
??
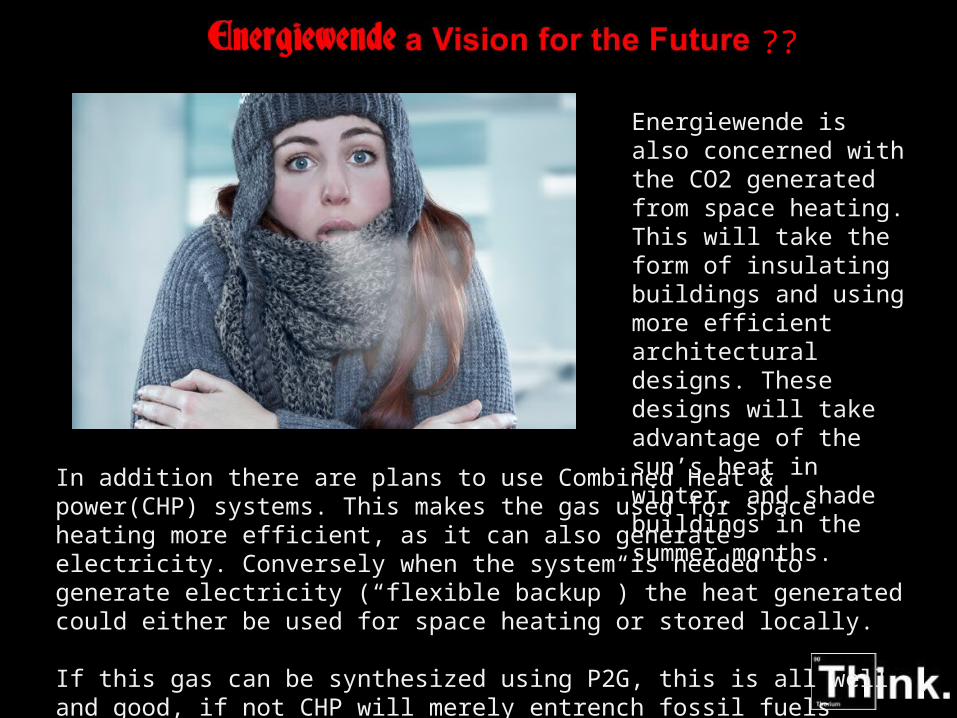
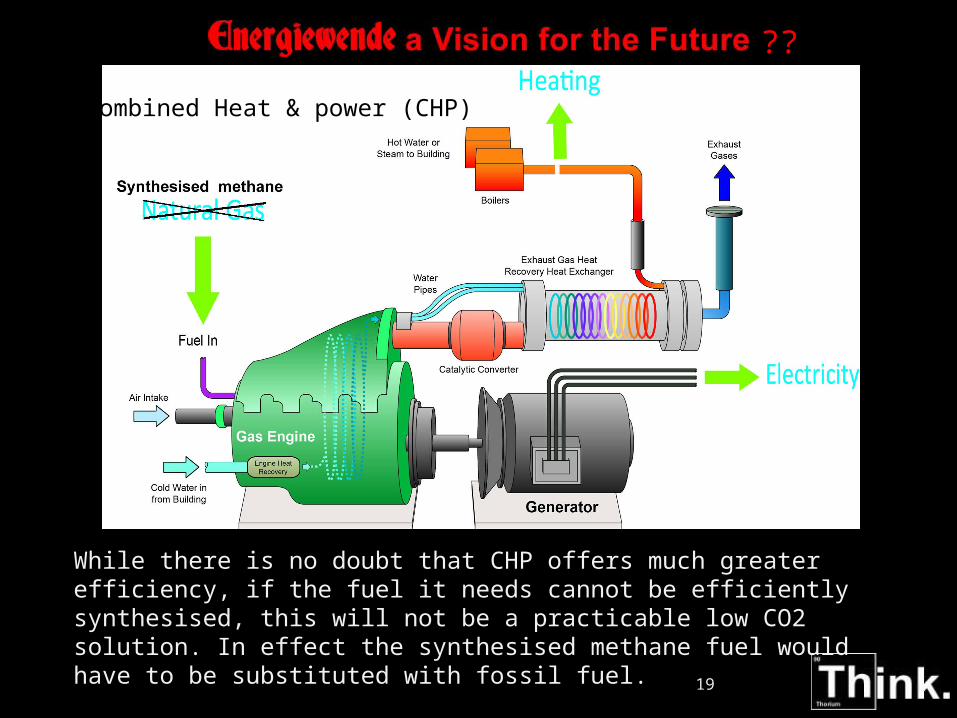
In addition there are plans to use Combined Heat & power(CHP) systems. This makes the gas used for space heating more efficient, as it can also generate electricity. Conversely when the system is needed to generate electricity (“flexible backup”) the heat generated could either be used for space heating or stored locally.
If this gas can be synthesized using P2G, this is all well and good, if not CHP will merely entrench fossil fuels
Energiewende is also concerned with the CO2 generated from space heating. This will take the form of insulating buildings and using more efficient architectural designs. These designs will take advantage of the sun’s heat in winter, and shade buildings in the summer months.
??
Combined Heat & power (CHP)
While there is no doubt that CHP offers much greater efficiency, if the fuel it needs cannot be efficiently synthesised, this will not be a practicable low CO2 solution. In effect the synthesised methane fuel would have to be substituted with fossil fuel.
19
??No conclusions will be drawn from this research that is up to the viewer.
However there are some questions that we should all be asking.
1.How much will it cost to increase the current RE by a factor of 8? 2.How much will it cost to upgrade the grid to cope with 4X or more the current power rating (Systems LCOE studies indicate that generation costs could more than double even for only a 2-3x factor)?3.With such a massive infrastructure and limited lifespan for each component, how much will it cost to maintain the system?4.If PHS is chosen as a storage solution will Germany’s topography be able to meet this requirement (in other words are there sufficient locations)?5.If batteries are chosen as the storage solution how much will this cost and is this even possible (All of the batteries in the world can meet world electricity demand for 10 minutes. Are there enough resources available to manufacture batteries capable of backing up the German grid?)6.The current plan is to use Combined Heat and Power(CHP) to cut CO2 emissions from heating, using gas synthesised using P2G, is this realistic? 7.Could the 30% efficiency of P2G be improved?8.Can the P2G process cope with the huge spikes in power, or will it need a constant supply?9.Assuming P2G can cope with the spikes, it will mean a process working part time, how does this impact on the costs? 20