the german energiewende
TRANSCRIPT

The German EnergiewendeChallenges and opportunities
E3G
Sabrina Schulz & Julian Schwartzkopff
January 2017
1

Structure
• Introduction
• Economic aspects of the Energiewende
– Cost and benefits
– Job effects– Job effects
– Local energy production
– Grids and security of supply
• Energy Efficiency as second pillar of the Energiewende
E3G 2

An introduction to the Energiewende
E3G 3

Anti-nuclear protests in Germany in the
1970s...
E3G 4
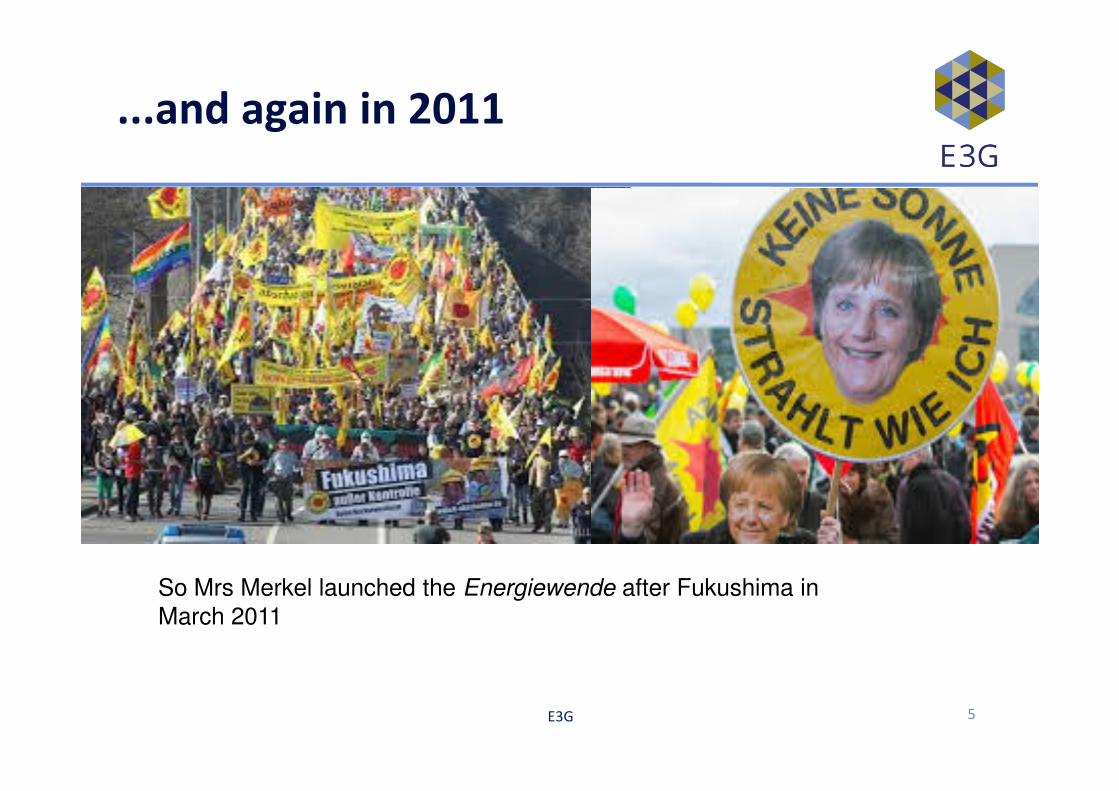
...and again in 2011
E3G 5
So Mrs Merkel launched the Energiewende after Fukushima in
March 2011

Nuclear Phase-Out
E3G 6
Source: Morris & Pehnt 2012: Energy Transition The German
Energiewende

Energiewende = energy transition
• 1980s: “How can we have economic growth without nuclear energy and fossil fuels?”
� Term Energiewende coined by a “green Avant-garde”
• 1991 Germany’s First Feed-In Tariff Law
• 2000 First nuclear phase-out by Red-Green government coalition• 2000 First nuclear phase-out by Red-Green government coalition
• 2000 Renewables Act (EEG)
• 2010 Phase out of the Phase Out by Merkel’s government coalition
• 2010 “Energy Concept”
• 2011 Nuclear Phase Out AND Energiewende after Fukushima
• 2014 and 2016 EEG reforms
E3G 7

Renewables expansion
20%
25%
30%
35%
400
500
600
700
Bill
ion
kW
h
Gross national electricity production (billion kWh)
E3G 8
0%
5%
10%
15%
0
100
200
300Bill
ion
kW
h
Coal Nuclear Natural Gas Oil & Petroleum Renewables Other Share of Renewables

Headline targets
E3G - Third Generation Environmentalism 9

EEG 2016 revision: End of Feed-in Tariff
• Main features of reformed Renewable Energy Law (EEG) (May 2016):
– RES growth corridor: 40-45% of electricity mix by 2025
– Quantity-based tendering model to replace feed-in tariff
– “Direct marketing” of RES power instead of FIT
• This is to limit the costs of the energy transition, integrate RES in to the
market, and prevent RES growth beyond what the grid can currently handlemarket, and prevent RES growth beyond what the grid can currently handle
• The unofficial motivation is to help the “Big 4” utilities catch up with RES as
they have an advantage over small-scale produces in tenders.
E3G 10

Renewable energy subsidies in context
E3G 11

It Works: Development of GHG Emissions vs.
GDP Growth
E3G 12
Costs and benefits
E3G 13

Who pays for the Energiewende?
Energy cost index (ECI) 6-month average ECI
Energy cost index for German industry
E3G 14
Even though consumers have to pay for it, the Energiewende
is supported by 90% of the population (2015 poll)

Total revenue from renewables
E3G 15

Renewable energy investment
E3G 16

RES costs fell much faster than expected
E3G 17

Falling power prices
German baseload power prices (EEX Phelix 1-year futures)
E3G 18

German utilities are in crisis
E3G - Third Generation Environmentalism 19

Job effects
E3G 20

Job creation through renewables
E3G 21

Effects on employment in other sectors
Employment trends in the conventional energy
industryNet employment effects of the Energiewende
E3G 22

Different kinds of RES employment
Renewable energy employment by activity (2014)
E3G 23

Future job creation potential of the
Energiewende
• 2015: 330,000 RES jobs; similar in energy efficiency
• New PwC study: climate policy measures under Climate Action Plan 2020 will
– create a total of 430,000 new jobs, – create a total of 430,000 new jobs,
– increase GDP by 1 per cent in 2020
– result in a net economic gain of €149 bn initial investments of (€125 bn initial investments vs long-term savings of €274 bn)
– Energy sector faces net burden of €10 bn; industry, transport, agriculture and trade & services will receive net gain of €84 bn
E3G 24

Local energy production
E3G 25

Citizens and communities were involved from the
start
Development of energy co-operatives in Germany Ownership in renewables in Germany (2012)
E3G 26

Local benefits in detail (1)
Value-added effects of typical renewable energy electricity generation plants
through 20 years operation time
E3G 27

Local benefits in detail (2)
Value-added of eight renewable energy facilities in a modelled sample
municipality (2009)
E3G 28

Renewables value chain: wind turbines
• Manufacturing: Wind turbines consist of various parts (e.g. rotor
blades, generator, tower etc.) which need to be manufactured in a
first step.
• Planning and Installation: In order to operate the wind turbines
they have to be planned and installed (e.g. connecting it to the they have to be planned and installed (e.g. connecting it to the
grid).
• Operation and Maintenance: The facilities need to be operated
and maintained (e.g. by training, and hiring additional personnel).
• Operator: The energy co-operative or the community which
operate the wind farm generates profit from the energy being
produced and sold, lease income for the community, taxes etc.).
E3G 29

Grids and security of supply
E3G 30

Grid expansion
E3G 31
Total costs: €18bn until 2024Underground power lines will costs additional €3-8bn and lead to delay of 2-3 years

Cross-border electricity trading
E3G - Third Generation Environmentalism 32

Power supply among the most stable in Europe
Electricity-grid (in)stability in the European Union – minutes of blackouts
E3G 33

Energy Efficiency
E3G 34

Energy efficiency as second pillar of the
Energiewende
• Significant demand reduction & flexibility
improvements necessary to deal with peak demand
• Additional benefits:
– avoided supply-side investment in conventional – avoided supply-side investment in conventional generation and distribution networks
– reduced energy costs for industry & consumers
– substantial & diverse job creation potential
– innovation & new business models
– additional tax revenue due to increased economic activity
in retrofitting and energy services contractingE3G 35

Energy efficiency: Progress so far
Energy intensity trendsGross energy consumption by sector (Mtoe)
E3G 36

Bottlenecks in delivery of energy
efficiency policies
• Buildings sector
– 40% of energy consumption, 1/3rd of GHG
emissions
– envisaged retrofitting rate of 2% far from – envisaged retrofitting rate of 2% far from
reached, decreasing investment
� lack of convincing incentives and appropriate
financial instruments
E3G 37

Bottlenecks in delivery of energy
efficiency policies
• Industrial sector:
– 45% of electricity used by industry
– Main driver for EE measures: traditional focus on
quality, innovation and excellencequality, innovation and excellence
– Industrial energy efficiency potential far from
reached, so government developed new
incentives
– 2014 National Action Plan on Energy Efficiency
(NAPE)
E3G 38

Key German energy efficiency policies (Art. 7 EED)
E3G 39

Energy efficiency targets and achievement
E3G 40
Thank you for your attention.
Any questions? Any questions?
E3G 41

Just Transition and Structural Change
E3G 42

Collapse of hard coal mining in NRW
Hard coal mining jobs Ruhr area Hard coal production Ruhr area (mn tons)
E3G 43

Collapse of lignite industry in Lusatia
150
200
250
60 000
80 000
100 000
Lignite mining jobs in Lusatia Lignite production in Lusatia (mn tons)
E3G 44
0
50
100
-
20 000
40 000

Political reaction: hard coal collapse after
1960
Aid for hard coal miners
• Anpassungsgeld (early retirement); 2015: € 116 mn, € 13.500 anually on avg
• Anpassungsbeihilfe (retraining and job market entry)
Successive structural policy programmes
• Development Programme Ruhr (1968-72), DM 17bn
• Technology Programmes Energy/Mining/Economy � Action Programme Ruhr
(1974-1984), DM 6.9 bn
• Zukunftsinitiative (“future initiative”) Montanregionen/ der Regionen Nordrhein-
Westfahlens (1984-1999)
• Cluster-oriented regional policy 2000-
Consensus-oriented framework agreements
• Successive “coal rounds” negotiated gradual reduction of hard coal mining
subsidies; 2007: agreement on 2018 phase-out, RAG foundation established
E3G 45

Political reaction: lignite collapse after 1990
Aid for lignite employees
• Severance package negotiated with companies; attractive early retirement package, retraining measures, short-time work arrangements
• LMBV established for land recultivation (initially 20,000 jobs)
Structural policy
• “Aufbau Ost”, e.g. Solidarpakt I + II (1995-2019), € 200 bn
Consultation/participation in phase-out process: missing
E3G 46

Instruments of structural policy
• Forums of Participation and Dialogue
– Top-down framework agreements or bottom-up
participatory planning
• Support and compensation schemes for workers in • Support and compensation schemes for workers in
affected sectors (short term)
• Regional support schemes to promote economic
diversification and reorientation (long term)
E3G 47

Additional slides
E3G 48

German GHG emissions by sector (1)
2014 German GHG emissionsAbsolute change in GHG emissions by sector (Mt
CO2, 1990/2014)
E3G - Third Generation Environmentalism 49

German GHG emissions by sector (2)
E3G - Third Generation Environmentalism 50

German power mix
400
500
600
700
German power production (TWh), by fuel
E3G - Third Generation Environmentalism 51
0
100
200
300
400
Lignite Hard coal Nuclear Natural gas Oil Renewables Other

Power sector emissions by fuel
32%
8%
2%0%
26%
0%
2014 GERMAN POWER SECTOR
Nuclear Other fossil Gas Hard coal Lignite
E3G 52
25%
54%
18%
32%
9%
5%
16%
G E N E R A T I O N ( T W H ) P O W E R S E C T O R C O 2 E M I S S I O N S ( M T )
Source: BNetzA, UBA

German power sector emissions and
reduction pathway
E3G 53

Political System of Germany
E3G - Third Generation Environmentalism 54

Comparing German lignite regions
Lignite area
Jobs (direct)
Jobs (indirect)
% of jobs Value added (€, %)*
Production (Mt, 2014)
PP capacity (GW)
Unempl. area**
Unempl. state**
Lusatia 8,316 7,158 3.69% <3.51 Mrd. €, <15%
61.8 6.7 9.8% BB: 9.2%SN: 8.5%
Rhenish 10,146 7,376 2.77% 3.3 Mrd. €, 11% 93.6 10 7.2% NRW:
E3G 55
Rhenishregion
10,146 7,376 2.77% 3.3 Mrd. €, 11% 93.6 10 7.2% NRW: 8%
CentralGerman
2,565 1,795 (gesch.)
1.05% 850 €m (est.) 21 3.2 9.2% SN: 8.5%ST: 10.3%
* Figures for 2009 in Central German are and 2010 for Lusatia/RR. Value added is currently much lower because of low power prices. ** As of March 2016
Sources: Statistik der Kohlenwirtschaft 2016, EEFA 2010, ifo-Institut 2013, Prognos 2010, Bundesagentur für Arbeit 2016

Age structure German coal mining
E3G 56

Average retirement age of coal power
plants
E3G 57
FÖS (2015) Factsheet Kohlekapazitäten im deutschen Kraftwerkspark

EU has other reasons to act e.g.
geopolitical risks of fuel supply
E3G 58

Merit order curve
E3G - Third Generation Environmentalism 59

Coal power plants too inflexible for high RES-share
power system
E3G 60
*) Read as current / state of the art / optimisation potential**) Combined Cycle Gas Turbine; Open Cycle Gas Turbine
Source: VDE (2012)
Source: AGORA Energiewende (2014)
Start-up times of different technologies*