the forestry reclamation approach: measuring …
TRANSCRIPT
University of Kentucky University of Kentucky
UKnowledge UKnowledge
Theses and Dissertations--Earth and Environmental Sciences Earth and Environmental Sciences
2019
THE FORESTRY RECLAMATION APPROACH: MEASURING THE FORESTRY RECLAMATION APPROACH: MEASURING
SEDIMENT MASS ACCUMULATION RATES IN RECLAIMED MINE SEDIMENT MASS ACCUMULATION RATES IN RECLAIMED MINE
LANDS AND NATURALLY REGENERATED LOGGED FORESTS OF LANDS AND NATURALLY REGENERATED LOGGED FORESTS OF
EASTERN KENTUCKY EASTERN KENTUCKY
William E. Bond University of Kentucky, [email protected] Digital Object Identifier: https://doi.org/10.13023/etd.2019.382
Right click to open a feedback form in a new tab to let us know how this document benefits you. Right click to open a feedback form in a new tab to let us know how this document benefits you.
Recommended Citation Recommended Citation Bond, William E., "THE FORESTRY RECLAMATION APPROACH: MEASURING SEDIMENT MASS ACCUMULATION RATES IN RECLAIMED MINE LANDS AND NATURALLY REGENERATED LOGGED FORESTS OF EASTERN KENTUCKY" (2019). Theses and Dissertations--Earth and Environmental Sciences. 75. https://uknowledge.uky.edu/ees_etds/75
This Master's Thesis is brought to you for free and open access by the Earth and Environmental Sciences at UKnowledge. It has been accepted for inclusion in Theses and Dissertations--Earth and Environmental Sciences by an authorized administrator of UKnowledge. For more information, please contact [email protected].

STUDENT AGREEMENT: STUDENT AGREEMENT:
I represent that my thesis or dissertation and abstract are my original work. Proper attribution
has been given to all outside sources. I understand that I am solely responsible for obtaining
any needed copyright permissions. I have obtained needed written permission statement(s)
from the owner(s) of each third-party copyrighted matter to be included in my work, allowing
electronic distribution (if such use is not permitted by the fair use doctrine) which will be
submitted to UKnowledge as Additional File.
I hereby grant to The University of Kentucky and its agents the irrevocable, non-exclusive, and
royalty-free license to archive and make accessible my work in whole or in part in all forms of
media, now or hereafter known. I agree that the document mentioned above may be made
available immediately for worldwide access unless an embargo applies.
I retain all other ownership rights to the copyright of my work. I also retain the right to use in
future works (such as articles or books) all or part of my work. I understand that I am free to
register the copyright to my work.
REVIEW, APPROVAL AND ACCEPTANCE REVIEW, APPROVAL AND ACCEPTANCE
The document mentioned above has been reviewed and accepted by the student’s advisor, on
behalf of the advisory committee, and by the Director of Graduate Studies (DGS), on behalf of
the program; we verify that this is the final, approved version of the student’s thesis including all
changes required by the advisory committee. The undersigned agree to abide by the statements
above.
William E. Bond, Student
Dr. Kevin M. Yeager, Major Professor
Dr. Edward W. Woolery, Director of Graduate Studies

THE FORESTRY RECLAMATION APPROACH: MEASURING SEDIMENT MASS
ACCUMULATION RATES IN RECLAIMED MINE LANDS AND NATURALLY
REGENERATED LOGGED FORESTS OF EASTERN KENTUCKY
THESIS
A thesis submitted in partial fulfillment of the requirements for the degree of Master of
Science in the College of Arts and Sciences at the University of Kentucky
By
William Edward Bond
Lexington, Kentucky
Director: Dr. Kevin M. Yeager, Associate Professor of Earth and Environmental Sciences
Lexington, Kentucky
2019
Copyright © William Edward Bond 2019

ABSTRACT OF THESIS
THE FORESTRY RECLAMATION APPROACH: MEASURING SEDIMENT MASS
ACCUMULATION RATES IN RECLAIMED MINE LANDS AND NATURALLY
REGENERATED LOGGED FORESTS OF EASTERN KENTUCKY
The spread of surface coal mining has resulted in loss of forests in the Appalachian
region. The Forestry Reclamation Approach (FRA) was developed to provide guidance
for restoring forests on reclaimed mined land. This study hypothesizes that the FRA will
result in larger magnitude of sediment accumulation rates in reclaimed mine sites
compared to those reclaimed using grassland reclamation. Three sediment cores and six
trenches were sampled within four reclaimed mined and three previously logged sites in
eastern Kentucky. Samples were processed for radionuclides, grain-size, stable isotopes
(δ13C), and POC. LIDAR data were used to identify valley fills, while historical aerial
photography was used to identify changes in vegetative cover from 1994 to 2016.
Radionuclide dating was used to determine sediment accumulation rates over the
previous 100 years. Results from logged sites are inconclusive. δ13C data for all sites fall
within the range expected for forested landscapes (C3), and do not show any transitions
from grassland to forests. POC data indicates that inventories and fluxes were the same
for mined and logged sites. Sediment accumulation rates for reclaimed mined lands show
elevated values after the implementation of the FRA, compared to grassland reclamation,
thus supporting the hypothesis for previously mined sites.
KEYWORDS: Forestry Reclamation Approach (FRA), Radionuclide Analysis
Sediments, Stable Isotope Analysis Sediment, Particulate Organic Carbon, Reclaimed
Mines
William Edward Bond
September 20, 2019

THE FORESTRY RECLAMATION APPROACH: MEASURING SEDIMENT MASS
ACCUMULATION RATES IN RECLAIMED MINE LANDS AND NATURALLY
REGENERATED LOGGED FORESTS OF EASTERN KENTUCKY
By
William Edward Bond
Dr. Kevin M. Yeager
Director of Thesis
Dr. Edward W. Woolery
Director of Graduate Studies
September 20, 2019

iii
ACKNOWLEDGEMENTS
I would like to thank my research advisor, Dr. Kevin M. Yeager, for providing me
with guidance and support throughout my time as a graduate student in the Department of
Earth and Environmental Sciences at the University of Kentucky. The high standards that
he set for myself and all of his graduate students have challenged me to expand my
studies beyond previous research efforts in environmental geology and geochemistry, as
well as my knowledge in studies outside of geology. These high expectations have
prepared me for my professional future as a scientist. I would also like to thank the other
two members of my research committee, Dr. Christopher Barton and Dr. Andrea Erhardt
for their guidance and support during my research.
Thank you to Dr. Jordan Munizzi at the Kentucky Stable Isotope Geochemistry
Laboratory (KSIGL). I truly appreciate all of his help in analyzing particulate organic
carbon and stable isotopes. In addition, I thank the Office of Surface Mining,
Reclamation and Enforcement (OSMRE) for their financial support from the Applied
Science Program, via a grant entitled, “Evaluating the Influence of the Forestry
Reclamation Approach on Water Quality and Hydrology on Appalachian Coal Mines”.
This study would not have been possible without the financial support provided by
OSMRE.
Next, I want to thank my family. My loving wife Christina Bond and my mother
Betty Bond have stood by me and supported me in every way possible as I furthered my
studies. My father Eddie Bond, who passed away in 2018, was a source of inspiration and

iv
guidance, and always supported my pursuit to further myself as a scientist. I know that
without him I would not have been able to achieve what I have.
Finally, I want to thank my fellow lab workers and graduate student at the
Sedimentary Environmental and Radiochemical Research Laboratory (SER2L) for their
help: Becky Smiley, Spencer Dixon, Jude Odomon, Daulton Hanes, Gabriella Evans, and
Kimberly Schindler. Without the continued support of all mentioned I would not have
been able to succeed while studying at the University of Kentucky. From the bottom of
my heart, I want to thank you for everything you have done to help me.

v
TABLE OF CONTENTS
ACKNOWLEDGEMENTS ............................................................................................... iii
LIST OF TABLES ............................................................................................................ vii
LIST OF FIGURES ......................................................................................................... viii
CHAPTER ONE: INTRODUCTION ..................................................................................1
1.1 History and Impacts of Mining and Logging in Eastern Kentucky ...........................1
1.2 Significance of Study .................................................................................................4
1.2.1 Surface Mining Control and Reclamation Act (SMCRA).................................. 5
1.3 Previous Studies in the Region ...................................................................................6
1.4 Present Study ..............................................................................................................6
1.4.1 Forestry Reclamation Approach (FRA) ............................................................. 6
1.4.2 Study Area .......................................................................................................... 8
CHAPTER TWO: METHODS ..........................................................................................11
2.1 Sediment Coring and Trenching ..............................................................................11
2.1.1 Core and Trench Sample Collection ................................................................. 11
2.1.2 Core and Trench Sample Processing ................................................................ 13
2.2 Grain Size .................................................................................................................14
2.3 Radiochemistry .........................................................................................................15
2.3.1 Alpha Spectrometry .......................................................................................... 18
2.3.2 Gamma Spectrometry ....................................................................................... 19
2.4 Particulate Organic Carbon and Stable Carbon Isotopes .........................................20
CHAPTER THREE: RESULTS ........................................................................................22
3.1 Reclaimed Mine Land Digital Elevation Models (DEM) ................................... 22
3.2 Robinson Forest Satellite Imagery and Sub-Basins ............................................ 24
3.3 Bent Mountain Satellite Imagery and Sub-Basins ............................................... 29
3.4 Grain Size Distributions ...........................................................................................32
3.5 Radiochemistry .........................................................................................................36
3.5.1 Gamma Spectroscopy ....................................................................................... 36
3.5.2 Alpha Spectroscopy and Sediment Accumulation Rates ................................. 43
3.6 Particulate Organic Carbon and Stable Isotopes ......................................................52
3.6.1 Particulate organic carbon and bulk density ..................................................... 52
3.6.2 Stable Carbon Isotopes ..................................................................................... 58

vi
CHAPTER FOUR: DISCUSSION ....................................................................................61
CHAPTER FIVE: CONCLUSIONS .................................................................................71
APPENDICES ...................................................................................................................73
Appendix A. Study Site Coordinates, Core Shortening, Calculated Mining Activity,
and Sediment Physical Properties ..................................................................................73
Appendix B. 7Be, 137Cs, 210Pb, and 210Pbxs Activities ....................................................84
Appendix C. Stable Isotope and POC Values ................................................................93
Appendix D. Sediment Accumulation Rates ................................................................102
Appendix E. Full Core and Trench Profiles .................................................................106
REFERENCES ................................................................................................................115
VITA ................................................................................................................................127

vii
LIST OF TABLES
Table 1. Study sites summary, including types of disturbances, when reclamation
occurred, reclamation methods, and when sites were sampled. ....................................... 10
Table 2. 137Cs and 7Be inventories for all trenches and cores. *Indicates incomplete 137Cs
profile. ............................................................................................................................... 37
Table 3. LARs and MARs from 1952 and 1963 for sites with 137Cs data. ....................... 38
Table 4. 210Pbex inventories for all cores compared against inventories expected from
atmospheric deposition alone, and sedimentation ratios. .................................................. 45
Table 5. Comparison of average 210Pbxs MARs and LARs for all sites. All uncertainties
reported at one sigma. ....................................................................................................... 45
Table 6. POC inventories (1-10 cm), and surface (0-2 cm for trenches; and mean value of
1-2 cm for push cores) POC fluxes for all cores and trenches. POC fluxes are calculated
using mean 210Pbex-derived sediment accumulation rates. ................................................ 53

viii
LIST OF FIGURES
Figure 1. Locations of all mined (red) and logged (green) study sites. The top map shows
site locations within the Johns Creek and Troublesome Creek drainage basins, and the
Kentucky counties within which each are located. The bottom map shows 2016 satellite
imagery (ArcGIS 10.5) for all sites. .................................................................................... 9
Figure 2. Typical sediment profile of reclaimed mine land with core extraction (top of
core in red). Example sediment layers include fine-grained sands (A), silt/clays (B),
silt/clays with larger erratic cobbles (C), and sand/silt with large cobbles (D). ............... 12
Figure 3. 238U decay series (University of Wisconsin, wisc.edu). .................................... 16
Figure 4. High resolution DEMs of reclaimed mine lands around study sites at Robinson
Forest Guy Cove (top left – RFGC), Star Fire Mine (top right – SFMC), Bent Mountain
Mine (lower left - BM), and Valley Fill Williams Branch (bottom right - VFWB). Valley
fills near VFWB and RFGC are shown by white arrows.................................................. 23
Figure 5. High resolution DEMs of logged areas around study sites at Robinson Forest
Millseat (top left - RFMS), Forestry control (top right - FCA), and Field branch (bottom
left - RFFB). ...................................................................................................................... 24
Figure 6. Satellite imagery (2016) showing the locations of previously logged sites (red)
and the sub-basins (blue) within which they are located. RFMS (top left) and RFFB (top
right) are both located within the Clemons Fork sub-basin. FCA (bottom left) is located
within the Coles Fork sub-basin. ...................................................................................... 25
Figure 7. Satellite imagery (2016) showing RFGC (red) and its location within the Laurel
Fork sub-basin (blue). Barren areas of the sub-basin (black) are shown for 1994, and
1998................................................................................................................................... 26
Figure 8. Changes in mining activity for the Laurel Fork sub-basin from 1994-2016. .... 27
Figure 9. Satellite imagery (2016) showing SFMC (red) and its location within the Long
Fork sub-basin (blue). Barren areas of the sub-basin (black) are shown for 1994, 1998,
2008, and 2016. ................................................................................................................. 28
Figure 10. Changes in mining activity for the Long Fork sub basin from 1994-2016. .... 29
Figure 11. Satellite imagery (2016) showing VFWB (red) and its location within the
Troublesome Creek sub-basin (blue). Barren areas of the sub-basin (black) are shown for
1998, 2008, and 2016. ....................................................................................................... 30
Figure 12. Changes in mining activity for the Troublesome Creek sub basin from 1994-
2016................................................................................................................................... 30
Figure 13. Satellite imagery (2016) showing BM (red) and its location within the Brush
Fork sub-basin (blue). Barren areas of the sub-basin (black) are shown for 1994, 1998,
2008, and 2016. ................................................................................................................. 31
Figure 14. Changes in mining activity for the Brush Fork sub-basin from 1994-2016. ... 32
Figure 15. Grain size distributions vs. depth for control site trenches RFMS_17T (left)
and FCA_15 (right). .......................................................................................................... 33

ix
Figure 16. Grain size distributions vs. depth for trenches RFGC_17T (left) and
RFFB_18T (right). ............................................................................................................ 34
Figure 17. Grain size distributions vs. depth for push cores RFGC_17PC_A (left) and
RFGC_17PC_B (right). .................................................................................................... 35
Figure 18. Grain size distributions vs. depth for trenches SFMC_15 (left) and BM_07_16
(right). ............................................................................................................................... 35
Figure 19. Grain size distribution vs. depth for push core VFWB_17PC_A. .................. 36
Figure 20. 7Be (left) and 137Cs (right) activity concentration profiles for trench
RFMS_17T. The dashed line denotes the year 1952. ....................................................... 39
Figure 21. 7Be (left) and 137Cs (right) activity concentration profiles for trench FCA_15.
The dashed line denotes the year 1952. ............................................................................ 40
Figure 22. 7Be (left) and 137Cs (right) activity profiles for trench RFGC_17T. ............... 41
Figure 23. 137Cs activity concentration profiles for push cores RFGC_17PC_A (left) and
RFGC_17PC_B (right). The dashed and solid lines denote the years 1952, and 1963,
respectively. ...................................................................................................................... 42
Figure 24. 7Be activity profile for trench SFMC_15. ....................................................... 42
Figure 25. 137Cs-based sediment accumulation rates based on the 1952 (top) and 1963
(bottom) time markers for RFMS, FCA, and RFGC. Values for RFGC are based on mean
values for the two push cores taken at the site. Uncertainties reported at one standard
deviation. ........................................................................................................................... 44
Figure 26. Sediment mass accumulation rates (left) and linear accumulation rates (right)
for trench RFMS_17T. ...................................................................................................... 46
Figure 27. Sediment mass accumulation rates for trench FCA_15. Exponential regression
is shown for data spanning 60 years BP to the present. .................................................... 47
Figure 28. Sediment mass accumulation rates (left) and linear accumulation rates (right)
for trench RFGC_17T. Shaded sections provide the timing of grassland reclamation (red)
and the FRA (blue)............................................................................................................ 48
Figure 29. Sediment mass accumulation rates (left) and linear accumulation rates (right)
for push core RFGC_17PC_A. Shaded sections provide the timing of grassland
reclamation (red) and the FRA (blue). .............................................................................. 49
Figure 30. Sediment mass accumulation rates (left) and linear accumulation rates (right)
for push core RFGC_17PC_B. Shaded sections provide the timing of grassland
reclamation (red) and the FRA (blue). Exponential regression fits for 40 years BP to
present are shown (left, both plots), as are fits from 40 to 100 years BP (right, both plots).
........................................................................................................................................... 50
Figure 31. Sediment mass accumulation rate for trench SFMC_15. The shaded section of
the graph provides the timing of the FRA (blue). ............................................................. 51
Figure 32. 210Pbex MARs and LARs for study sites. Uncertainties reported at one standard
deviation. ........................................................................................................................... 52
Figure 33. POC inventory (1-10 cm) (top), and POC flux (bottom) for all study sites. ... 53
Figure 34. Comparison of 210Pbex mass accumulation rates and POC inventories for all
sites. .................................................................................................................................. 54

x
Figure 35. Particulate organic carbon (POC) concentration profiles for trenches
RFMS_17T (left) and FCA_15 (right). ............................................................................. 55
Figure 36. Particulate organic carbon (POC) concentration profiles for trenches
RFFB_18T (left) and RFGC_17T (right). ........................................................................ 55
Figure 37. Particulate organic carbon (POC) concentration profiles for push core
RFGC_17PC_A (left) and RFGC_17PC_B (right). ......................................................... 56
Figure 38. Particulate organic carbon (POC) concentration profiles for trenches
SFMC_15 (left) and BM_07_16 (right). ........................................................................... 57
Figure 39. Particulate organic carbon (POC) concentration profile for push core
VFWB_17PC_A. .............................................................................................................. 57
Figure 40. δ13C profiles for trenches RFMS_17T (left) and FCA_15 (right). .................. 58
Figure 41. δ13C profiles for trench RFGC_17T (left) and push core VFWB_17PC_A
(right). ............................................................................................................................... 59
Figure 42. δ13C profiles for push cores RFGC_17PC_A (left) and RFGC_17PC_B (right).
........................................................................................................................................... 60
Figure 43. δ13C profiles for trenches SFMC_15 (left) and BM_07_16 (right). ................ 60

1
CHAPTER ONE: INTRODUCTION
1.1 History and Impacts of Mining and Logging in Eastern Kentucky
Since the arrival of Europeans, coal mining and timber production have continually
spread throughout Appalachia. Coal was discovered in Kentucky in 1750, and by 1774,
the first European settlement was established (Harrison and Klotter 2009). This also led
to the increased need for timber production to construct housing and provide fuel for
heating and cooking.
The first commercial coal mine was established in Kentucky in 1820, and from that
time until 1970 coal mining was a major source of economic prosperity throughout
Appalachia (Goldberg and Power 1972). In 1970, coal production saw a large increase
that lead to a major economic boom that lasted until the mid-1980’s (Black et al. 2005a).
From 1969 to 1974 the price of coal increased by roughly 44%. Coal production
continued to increase until 1977, at which point prices stabilized until 1982. After this
time, the price of coal drastically decreased until the late 1980’s (Black et al. 2005b).
With the growing availability of more efficient energy sources (including natural gas),
declining Appalachian coal reserves (Milici 2000), and increasing awareness of the
environmental impacts of mining, coal mining is today no longer a major economic force
in Appalachia.
In 1990, the Clean Air Act of 1963 (Public Law 88-206) was amended to address air
pollution and acid rain (Public Law 101-549). The coal found throughout Kentucky
contains a relatively high concentration of sulfur, which contributes to acid rain
(Huffman et al. 1991; Eble and Hower 1997). Natural gas was discovered in Kentucky in
1818, and its recovery and use has continued to increase over time with roughly 4,000

2
operating gas wells present by the mid-20th century (Hunter and Young 1953). By 1999,
~84% of the natural gas produced in the U.S. originated from the Antrim Shale
(Michigan basin) and Ohio Shale (Appalachian basin) since then, other basins
throughout the country have increased production (Curtis 2002).
Unfortunately, coal mining in its various forms has led to many detrimental impacts
on the environment, some of which persist for years, decades, or much longer after
mining activities have decreased or ceased entirely. Coal mining affects plant and animal
life, soils, sediments, water quality, and the atmosphere. The effects on plant life are seen
in areas where mountain top removal mining practices and accompanying valley fills
have led to decreased botanical biodiversity in the region (e.g., Meier et al. 1995; Schuler
and Gillespie 2000; Wyatt and Silman 2010; Sheoran et al. 2010; Ussiri and Lal 2005).
This decrease in plant diversity not only reduces viable habitats for wildlife, but also
decreases future timber production prospects due to the loss of commercially important
native hardwood trees. Mining has also been shown to increase sediment loading in
adjacent streams during storm flow events (e.g., Bonta 2007; Mangena and Brent 2006).
A study from the late 1960s showed that wildlife was heavily impacted by the
disturbance of over 800,000 acres of land, resulting in 5,000 miles of streams and some
13,800 acres of impoundments being contaminated by both sediment and acid mine water
due to mining in Appalachia (Boccardy and Spaulding 1968).
From 1992 to 2006, areas throughout Appalachia with the highest mining activity
were shown to have lost up to 7.6% of the total forest in the area, but the loss of interior
forests ranged from 7-20% (Wickham et al. 2007). The loss of interior forests is as
significant as the loss of total forests because it leads to habitat fragmentation for native

3
wildlife. The loss of interior forests was up to 5% greater than the loss of total forested
land where strip mining occurred (Wickham et al. 2013). Mining activities affect both
soils and sediments, primarily by erosion, including the loss of topsoil from mining
activity (Holl and Cairns 1994; Kozlowski 1999). Topsoil loss from mining inhibits the
regrowth of native hardwood tree species, in part due to losses of organic material and
seeds (Bradshaw and Chadwick 1980).
Runoff from mined areas often shows decreases in water quality, which can be further
degraded by valley fills, in part by the burial and/or capture of headwater streams (e.g.,
Ryan and Meiman 1996; Palmer et al. 2010). Adverse, generally local effects from
mining on water quality include: increases in electrical conductivity (EC), increased
dissolved concentrations of sulfate and various heavy metals, organic matter (OM)
enrichment, increased turbidity, lower invertebrate density, and decreased plant diversity
(e.g., Bernhardt et al. 2012; Fritz et al. 2010; Price and Wright 2016; Swer and Singh
2004).
Extensive logging occurred within the Robinson Forest of eastern Kentucky from
1908 to 1923 (Kalisz and Dotson 1989). During this period, logs were transported to
mills by floating them down river or by railroad. Logging can significantly affect soil
erosion, stream flow, and surface water quality (Arthur et al. 2007; Hatten et al. 2018), as
well as forest management (Foil and Ralston 1967; Shaw et al. 1987). Deforestation has
been shown to cause large changes in microbial communities in sandy soils (Crowther et
al. 2014). Regions that have been previously logged have shown a decline in soil nutrient
availability due to the removal of OM (Brais et al. 1995; Hamlett et al. 1990; Huang et al.

4
1996). Due to the demand for greater timber production, mechanized logging operations
are still prevalent within Appalachian hardwood forests (Wang et al. 2005).
Modern logging operations can adversely affect soils by increasing compaction and
decreasing water content (Reisinger et al. 1988). Increased soil compaction and
disturbances on steep slopes can lead to higher rates of erosion, which subsequently drive
higher sediment fluxes to nearby streams and increased sedimentation (Martin 1988;
Martin and Hornbeck 1994). Areas around streams can potentially be affected the most
by increased compaction due to a reduction in water content from increased bulk density
and reduced macropore spacing (Moehring and Rawls 1970; Greacen and Sands 1980).
1.2 Significance of Study
This study is significant to this region due to the loss of forestlands and their
degradation due to longstanding and spatially extensive mining and logging activities.
These disturbances have drastically altered regions of eastern Kentucky from their natural
state. This can lead to damaged topsoil, or topsoil that has been removed entirely,
especially in areas that have been previously mined (Mensah 2015). This study can aid in
comparing the effect of different reclamation techniques on sediment accumulation rates
in reclaimed mine lands. Erosion from logging activity can occur from the construction
and use of roads and the loss of sediment from tree roots (McCashion and Rice 1983;
Kochenderfer 1970). Logging operations have been shown to increase sediment yields
100-fold in affected watersheds (O’Loughlin et al. 1980, 1982; O’Loughlin and Pearce
1976). Areas that have been previously strip-mined show adverse changes in sediment
transport (i.e., high sedimentation of streams) due to elevated stream bank erosion (Fox
2009). In general, areas disturbed by current strip-mining operations show elevated

5
sediment loads within their respective watersheds (Wood and Armitage 1997). Reclaimed
mines show an initial increase in sediment loading due to reclamation disturbances,
followed by a drastic decrease in sediment loading (Bonta 2000). Efforts to stabilize
stream banks and reduce sediment loading in affected streams, due to mining and logging
disturbances, could be aided by this study.
1.2.1 Surface Mining Control and Reclamation Act (SMCRA)
The Surface Mining Control and Reclamation Act (SMCRA) (Public Law 95-87
Federal Register, 445-532) was introduced in 1977 by Morris K. Udall to mitigate the
detrimental effects of strip mining on land stability, erosion, and sedimentation.
Grassland reclamation is the primary technique used post SMCRA (e.g., Burger 2011;
Zipper et al. 2011). Grassland reclamation falls under SMCRA, but has led to higher rates
of soil compaction and the proliferation of widespread ground covers that slow the
natural encroachment of forests (e.g., Angel et al. 2009; Groninger et al. 2007). The
groundcover vegetation commonly used in grassland reclamation are often low diversity
and exotic cool season grasses and forbs, that tend to form denser biomass cover, are
shallow rooted, and aggressive (e.g., Cavender et al. 2014; Bauman et al. 2015; Swab et
al. 2017).
This use of groundcover commonly decreases water infiltration (Clark and Zipper
2016; Bohrer et al. 2017) and prevents the establishment of plant species with deep root
systems that can reduce soil compaction (Angel et al. 2006; Martin 2006). Soil
compaction has the potential to decrease the available nutrients and water that plants can
uptake, depending on the soil grain sizes present (Arvidsson 1999). The severity of soil
compaction can be heavily influenced by the grain size of soil (Hamza and Anderson

6
2005; Gomez et al. 2002). Coarse-grained materials (i.e., sands, gravels) are less
compactable, while fine-grained materials (i.e., silts, clays) are highly susceptible to
compaction (Schuler et al. 1986). Reclaimed mine lands with high soil compaction have
also been shown to experience increased frequency of flooding events, due to reduced
water infiltration (e.g., Phillips 2004; Ferrari et al. 2009).
1.3 Previous Studies in the Region
Previous studies in this region have focused heavily on the restoration of reclaimed
mine lands by utilizing different reclamation techniques. The grassland reclamation
approach emphasizes the use of aggressive ground cover species while maintaining low
grazing pressure from livestock. This method is commonly used in mid-western strip
mines to mitigate the cost of reclamation and stabilize the ecosystem (Ussiri et al. 2006).
The grassland reclamation approach can take decades to centuries or much longer before
natural reforestation returns these areas to pre-mining conditions (e.g., Holl 2002; Angel
et al. 2009; Lima et al. 2016). A study conducted in 2008 compared a mine reclaimed 15
years prior using grassland reclamation to an unmined watershed, and showed that annual
runoff volumes were similar in both watersheds. However, the reclaimed mining site
showed higher volumes of runoff during storm flow events due to high soil bulk density
and reduced infiltration rates (Simmons et al. 2008). A 2015 study conducted in West
Virginia showed that mined watersheds exhibited an increase in silt and sand deposition
compared to unmined watersheds (Jaeger 2015).
1.4 Present Study
1.4.1 Forestry Reclamation Approach (FRA)
This study focused on the Forestry Reclamation Approach (FRA), and grassland

7
reclamation, and their impacts on sediment accumulation rates. The FRA uses a five-step
approach to reforest mined lands and decrease overall recovery time for forest
establishment. The first step is the creation of suitable topsoil (4 ft.) to allow for the best
achievable conditions for tree seedling survival using weathered sandstones and existing
topsoil. In the second step, topsoil is loosely graded to limit soil compaction. This is done
by dumping and leveling soil in separate operations using the lightest available
equipment. The third step uses indigenous ground cover species that facilitate tree growth
such as foxtail millet (Setaria italica), red top (Agrotis palustris), perennial ryegrass
(Lolium perenne), rye (Secale cereal), orchardgrass (Dactylis glomerate), birdsfoot trefoil
(Lotus corniculatus), and Ladino clover (Trifolium repens). The fourth step is the
planting of two native tree species; one chosen to provide wildlife forage and to promote
soil stability, and the second selected primarily as a commercial crop. Species used to
promote wildlife forage and soil stability include redbud (Cercis canadensis), hawthorn
(Crataegus mollis), dogwood (Cornus florida), and black locust (Robinia pseudoacacia)
(Burger and Zipper 2002). Commonly utilized commercial hardwood species include red
oak (Quercus rubra), white oak (Quercus alba), green ash (Fraxinus pennsylvanica),
black cherry (Prunus serotina), sugar maple (Acer saccharum), and yellow-poplar
(Liriodendron tulipifera). The final step is to use proper planting techniques to reduce the
loss of new saplings (Adams 2017; Angel et al. 2009), including proper storage of
seedlings to prevent drying out, planting during the late winter and early spring to ensure
adequate soil moisture and higher soil temperature, and planting to a proper depth. Use of
the FRA method has been shown to increase the number of surviving seedlings of native
hardwood tree species (Groninger et al. 2007). This method is superior to grassland

8
reclamation because of its potential to minimize soil compaction while reestablishing
native forests.
1.4.2 Study Area
This study is mainly focused on four separate reclaimed coal mines (mountain top
removal), and three previously logged sites, for a total of seven research sites. The sites
include (1) Robinson Forest Mill Seat (RFMS_17T), (2) Robinson Forest Guy Cove
(RFGC_17T, RFGC_17PC_A, RFGC_17PC_B), (3) Valley Fill Williams Branch
(VFWB_17PC_A), (4) Robinson Forest Field Branch (RFFB_18T), (5) Star-Fire mines
(SFMC_15), (6) Bent Mountain mines (BM_07), and (7) Robinson Forest Control site
(FCA_15). The Bent Mountain mines are located within the Johns Creek drainage basin
that covers an area of 581 km2. All other research sites are found within the Troublesome
Creek drainage basin, which encompasses an area of 637 km2 (Figure 1). Sites RFGC,
VFWB, SFMC, and BM_07 were previously mined. Sites RFMS, RFFB, and FCA were
previously logged (Table 1). Mill Seat, Guy Cove, Field Branch, and Williams Branch
were sampled within riparian areas. Robinson Forest control was sampled from a
ridgetop, while Star Fire and Bent Mountain were sampled from upland areas.

9
Figure 1. Locations of all mined (red) and logged (green) study sites. The top map shows
site locations within the Johns Creek and Troublesome Creek drainage basins, and the
Kentucky counties within which each are located. The bottom map shows 2016 satellite
imagery (ArcGIS 10.5) for all sites.

10
Table 1. Study sites summary, including types of disturbances, when reclamation
occurred, reclamation methods, and when sites were sampled.
Site Disturbance
Year
regenerated or
reclaimed
Method Year
Sampled
RFMS Logged 1923 Natural Regeneration 2017
FCA Logged 1925 Natural Regeneration 2015
RFFB Logged 1982 Natural Regeneration 2018
RFGC Mined 1997 and 2007 Pasture and FRA 2017
VFWB Mined 2012 Pasture 2017
BM_07 Mined 2004 FRA 2016
SFMC Mined 1997 FRA 2015
The RFMS site was logged until 1923 ( 94 years prior to sampling) and naturally
regenerated from seed and stump sprouts (Gough 2013). The FCA site was logged until
1925 (90 years prior to sampling), and then naturally regenerated. The RFFB site was
logged up to 1982 (36 years before sampling), and then naturally regenerated. The RFGC
site was mined and initially reclaimed as pasture 20 years ago (1997), and was
subsequently disturbed and restored using the FRA in 2007. The VFWB site was mined
and reclaimed as pasture five years before sampling (2012). The SFMC and BM sites
were both mined, and both then reclaimed using the FRA 18 (1997), and 12 years (2004)
prior to sampling, respectively. SFMC was constructed using mine spoil to a depth up to
6 feet.
The RFMS, FCA, and RFFB sites have histories of logging and natural
regeneration, whereas the RFGC, SFMC, BM, and VFWB sites were mined using
mountain top removal that led to valley fills (Bernhardt and Palmer 2011). While valley
fills contribute to the loss of habitat for terrestrial species (elk, deer, black bears), they are
also known to lower the diversity of benthic organisms in streams (Pond et al. 2014).

11
These valley-fill areas can bury, capture, or decrease the flow of headwater streams, thus
negatively impacting stream and forest ecology downstream over considerable distances
(up to 300 km) (e.g., Price et al. 2016; Fritz et al. 2010; Tiwary 2001).
This study hypothesizes that the FRA will result in larger magnitude sediment
accumulation rates in reclaimed mine lands as compared to those reclaimed using
grassland reclamation. The analytical approaches used for this study are:
1. Sites mapped with ArcGIS software for high resolution DEMs with satellite
imagery to track changes in land affected by mining activity
2. Grain size analysis
3. Radiochemical analysis
4. Particulate organic carbon (POC) analysis
5. Stable isotope (δ13C) analysis of sedimentary OM
CHAPTER TWO: METHODS
2.1 Sediment Coring and Trenching
2.1.1 Core and Trench Sample Collection
At each site, sediment cores and trench samples were collected where possible. A
total of six trenches were sampled for all of the study sites. Trenches were excavated with
a shovel to a depth of 50 cm, or until the water table was reached, and sampled at 2 cm
intervals using two-meter sticks braced against the side of the trench wall. All samples
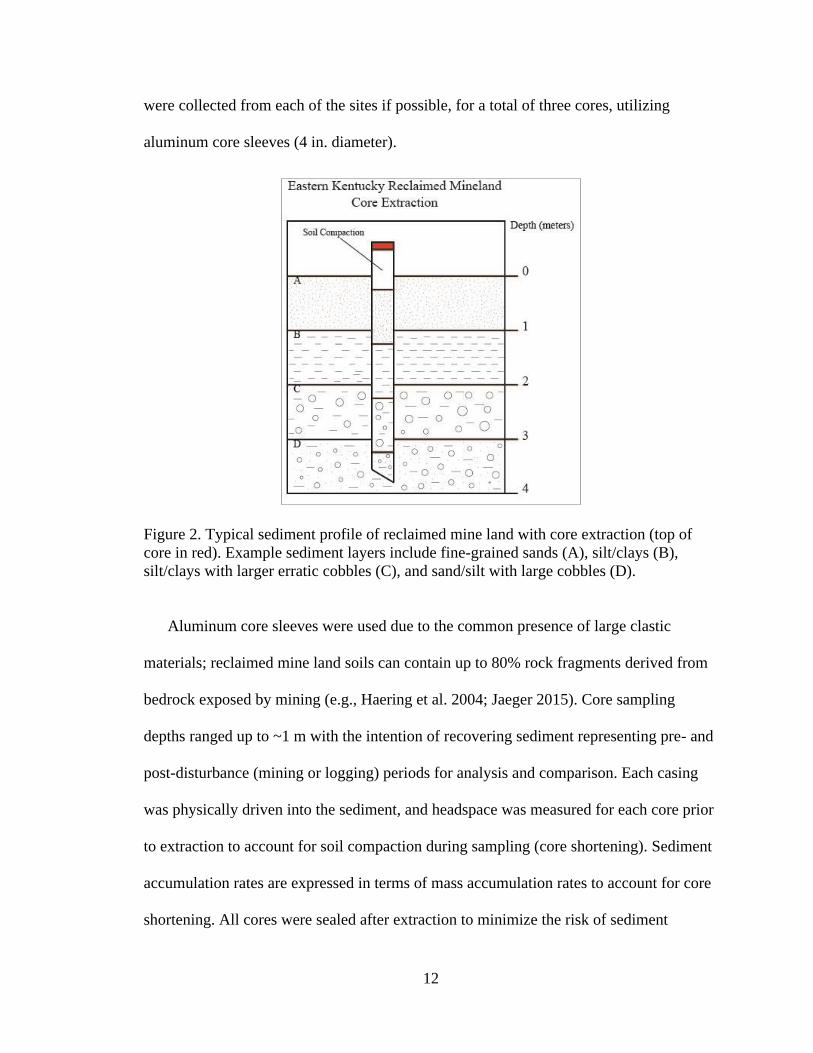
were bagged and held in cold storage until processing began. Sediment cores (Figure 2)
12
were collected from each of the sites if possible, for a total of three cores, utilizing
aluminum core sleeves (4 in. diameter).
Figure 2. Typical sediment profile of reclaimed mine land with core extraction (top of
core in red). Example sediment layers include fine-grained sands (A), silt/clays (B),
silt/clays with larger erratic cobbles (C), and sand/silt with large cobbles (D).
Aluminum core sleeves were used due to the common presence of large clastic
materials; reclaimed mine land soils can contain up to 80% rock fragments derived from
bedrock exposed by mining (e.g., Haering et al. 2004; Jaeger 2015). Core sampling
depths ranged up to ~1 m with the intention of recovering sediment representing pre- and
post-disturbance (mining or logging) periods for analysis and comparison. Each casing
was physically driven into the sediment, and headspace was measured for each core prior
to extraction to account for soil compaction during sampling (core shortening). Sediment
accumulation rates are expressed in terms of mass accumulation rates to account for core
shortening. All cores were sealed after extraction to minimize the risk of sediment

13
mixing. Finally, cores and trench materials were transported to and stored at the
Sedimentary and Environmental Radiochemistry Research Laboratory (SER2L),
Department of Earth and Environmental Sciences, at the University of Kentucky in
preparation for physical, geochemical, and radiochemical analyses.
2.1.2 Core and Trench Sample Processing
Core casings were cut longitudinally using a rotary saw, with care taken to minimize
disturbance of the sediment inside. After the casings were cut, medium gauge piano wire
was used to cut through the sediments inside, allowing the core to be split open
longitudinally. All cores were then photographed at a fixed distance of 1 m directly
above, and described noting changes in grain size, textures, facies and color based on
comparison to the USGS Munsell soil color chart.
All cores were sectioned at uniform intervals to provide sediment aliquots for various
analyses. The first step was the collection of bulk density plugs for RFMS, RFGC,
VFWB, and RFFB. Bulk density was not measured for SFMC, BM_07, and FCA. Bulk
density was calculated using:
𝐵𝑑 = 𝑀𝑠
𝑉𝑡
where Ms is the mass of dried soil, and Vt is the total volume. Each plug was collected at
2 cm intervals spanning the full length of each core. The bulk density data allow sediment
accumulation rates to be presented as linear accumulation rates. Each plug was placed
into a pre-weighed 40 ml aluminum tin, weighed, and dried at 70° C for 24 hours (or
longer as needed). All sample were then re-weighed and archived.
The first 50 cm of each core was divided into 1 cm sections, and the remainder was
sectioned at 2 cm intervals. All samples were placed into pre-weighed 250 ml aluminum

14
tins, weighed and dried at 70° C. After 48 hours, dried samples were re-weighed. All
samples were then wet sieved (as needed) to remove macro OM and coarse clastic
materials (larger than 500 μm), which was dried and weighed.
Trenches were excavated using shovels until bedrock or the water table was reached.
Meter sticks were used to sample trench walls at 2 cm intervals, with samples removed
using a hand spade and then bagged on site for transport. All core and trench samples
were separated into aliquots for physical, radiochemical, and stable carbon isotope
analyses. All radiochemical aliquots were homogenized using a Retsch RM200 mortar
grinder.
2.2 Grain Size
Grain size analysis was utilized to assess changes in sedimentary environments over
the period of record for each set of samples (cores, trenches), and between sites. Changes
in particle size can reflect changes in transport energy and deposition (Robinson and
Slingerland 1998; Koestner et al. 2011). Sample aliquots for grain size were weighed at
5-10 g and placed into 250 ml clear Pyrex beakers. Samples were then treated with 10 ml
each of sodium hexametaphosphate, acetone, de-ionized water, and concentrated
hydrogen peroxide (H2O2). Micro organic material was oxidized using H2O2, preventing
it from acting as a binding agent that can potentially skew mineral grain size data (Hillier
2001; Yeager et al. 2005). Sodium hexametaphosphate is a common dispersion agent that
increases the surface area of the sample to facilitate OM oxidation by H2O2 (Plouffe et al.
2001). Samples were treated with H2O2 at room temperature for ~24 hours, and then
heated at 100° C on hotplates while receiving 5-10 ml additions of H2O2 until obvious
reactions ceased.

15
After removal of micro organic material, samples were rinsed into 50 ml centrifuge
tubes and treated with magnesium chloride (MgCl; if needed) to flocculate any fine
suspended sediment. Each sample was then centrifuged using an Allegra 14-X centrifuge
at 2,000 rpm, and treated with additional MgCl until the water in the sample was clear,
and decanted. This process was repeated three times to remove excess H2O2. Samples
were placed into pre-weighed tins, dried in an oven at 70° C for 24 hours, and sieved to
remove particles larger than 2 mm in diameter. Material larger than 2 mm (gravel) was
weighed and bagged separately to be included in the grain size determinations. Gravels
were removed from samples due to particle size constraints of the Malvern Mastersizer.
Once dried and re-weighed, samples were analyzed using a Malvern Mastersizer S2000
to obtain grain size measurements for particles ranging from 0.02 to 2,000 μm. Grain size
data for each sample is presented as fractions of clay (< 4 μm), silt (63-4 μm), and sand
(2 mm-63 μm) according to the Wentworth scale (Wentworth, 1922).
2.3 Radiochemistry
Radionuclide data have been used to estimate short-term sediment mixing depths, to
establish a time frame for sediment deposition, and to determine sediment accumulation
rates at these sites, whenever possible (e.g., Al Hamarneh et al. 2003; Rice 1986). This
was accomplished by analyzing samples to determine activity concentrations of the
fallout radionuclides Cesium-137 (137Cs), Lead-210 (210Pb), and Beryllium-7 (7Be). 7Be,
given its short half-life (t1/2 = 53 d), was used to provide information on short-term (~1
year) sediment mixing depths (Krishnaswami et al. 1980; Sharma et al. 1987).
The radionuclides 137Cs and 210Pb were used to determine sediment accumulation
rates (Baskaran 2011; Matisoff et al. 2002). 137Cs has a half-life of 30.2 years (Ritchie

16
and McHenry 1990). Large activity concentrations of 137Cs appear in soils and sediments
beginning in 1952, due to increases in the number and magnitudes of above-ground
thermo-nuclear weapon tests, which reached their maxima in 1963 (e.g., Yeager et al.
2007; Ritchie and McHenry 1990). The largest activity concentration peaks typically
represent 1963, due to the onset of the Partial Nuclear Test Ban Treaty in 1964. Sediment
accumulation rates are calculated using 137Cs here by:
𝑆 = 𝑅𝑝𝑒𝑎𝑘
𝑇
where S = sediment accumulation rate, Rpeak = the depth (or cumulative mass depth) at
which the 137Cs peak activity concentration appears, and T = time since 1963.
The radionuclide 210Pb has a half-life of 22.3 years and is part of the Uranium-238
decay series (Figure 3).
Figure 3. 238U decay series (University of Wisconsin, wisc.edu).

17
Excess 210Pb (210Pbex) is that fraction of total 210Pb delivered to soils through
atmospheric fallout (principally bound to accumulating sediments), where it is combined
with the supported fraction (210Pbsup) of total 210Pb (210Pbtot), which is
produced by the in-situ decay of 238U series isotopes in rocks, sediments, and soils
(Walling et al. 2011; Benmansour et al. 2011). Supported 210Pb is determined using the
mean value of the lowermost 3-5 samples at depth in the 210Pbtot profile. 210Pbex is
calculated using:
𝑃𝑏𝑒𝑥 = 𝑃𝑏𝑡𝑜𝑡210 − 𝑃𝑏𝑠𝑢𝑝
210210
Sediment chronologies are calculated using the constant rate of supply model (Lubis
2013):
𝑡 =1
𝜆× 𝑙𝑛(𝐴𝑜 𝐴⁄ )
where λ = the decay constant of 210Pb (0.031 yr-1), Ao = 210Pbex inventory of the entire
sediment section, and A = 210Pbex inventory below the sample being dated. Sediment
mass accumulation rates are determined using the equation:
𝑆𝑎 = Δ𝑚
Δ𝑡
where Δm is the change in mass depth, and Δt is the change in time (Yeager et al. 2005,
2007). The three assumptions used for this model are: (1) 210Pbex is delivered to
sediments at a constant rate through time, (2) the initial concentration of 210Pb in the
sediment is variable, and (3) rates of sediment accumulation are variable. Sediment linear
accumulation rates are calculated by dividing Sa by the mean bulk density of the sediment
section.

18
The expected 210Pbex inventory from atmospheric deposition alone (537.42 mBq cm-2;
Santschi et al. 1999; Baskaran et al. 1993) is used to compare against measured values at
all sites to estimate net deposition or erosion over the last ~100 years. The expected
210Pbex inventory was calculated by dividing the expected flux of 210Pbex (16.66 mBq cm-2
yr-1; Turekian et al. 1977) by the 210Pb decay constant (0.031 yr-1). The expected 137Cs
inventory from atmospheric deposition alone has also been calculated (135.20 mBq cm-2;
Walling 1998; Larsen 1984). This was calculated using 90Sr as a proxy for 137Cs with the
value decay corrected for 2016 using the equation:
𝐴𝑡 = 𝐴0 × 𝑒𝜆𝑡
Where At is the activity at 2016, A0 is the original activity, λ is the decay constant for
137Cs (0.023 yr-1) and t is the time elapsed (from 1983 to 2016, see Larsen 1984).
Calculated radionuclide inventories can be compared to those expected from atmospheric
deposition alone to assess if study sites are net depositional or erosional. All of the
radionuclides considered here (7Be, 137Cs, 210Pb) readily adsorb onto fine-grained
sediments at Earth’s surface (210Pb also adsorbs onto POC; e.g., Ab Razak et al. 1996;
Wan et al. 2005; Vaaramaa et al. 2010) due to their low solubility and geochemistry (e.g.,
Baskaran 2011; Matisoff et al. 2002).
2.3.1 Alpha Spectrometry
Alpha spectrometry was used to determine activity concentrations of total 210Pb in
samples. This was accomplished using acid digestion with concentrated hydrochloric
(HCl), nitric (HNO3), and hydrofluoric acids (HF). Sample material (~1 g) was placed
into pre-weighed Teflon beakers and spiked with 500 μL of 209Po tracer (National
Institute of Standards and Technology (NIST), SRM-4326A) that allows for the

19
quantification of 210Po. The tracer 209Po was used because it does not occur in nature and
has a half-life of 102 years. Polonium-210 is a naturally occurring, alpha emitting
radionuclide (Rani et al. 2014). A major assumption of this method is that 210Po and 210Pb
are in equilibrium with one another (Persson and Holm 2011). Samples received multiple
treatments with the three concentrated acids (HF, HNO3, HCl) under heat (~110-135° C)
until the sediment was completely dissolved. Samples were then brought up in 50 ml of
1.5 normal HCl, heated to 100° C, and stirred for 15 minutes. Ascorbic acid was then
added to bind free Fe in the solution (e.g., Narita et al., 1989; Miura et al., 1999;
Vesterbacka and Ikaheimonen, 2005). Silver plates (1 cm2) were added to each sample
and allowed to set at 100° C for 2.5 hours as the sample was stirred. Polonium in solution
was bound to the silver plates (e.g., Santschi et al., 1999; Poet et al., 1972), which were
then analyzed using a Canberra 7200 Integrated Alpha spectrometer.
2.3.2 Gamma Spectrometry
Gamma spectrometry was used to determine activity concentrations of 137Cs and 7Be.
Homogenized samples were placed into 10 ml test tubes and packed at a ratio of 1 g : 1
ml to match all standards used. The sediment standards used included Ocean Sediment
Powder (NIST, SRM-4357) and Rocky Flats Soil Number 2 (NIST, SRM-4353A). To
ensure that equal geometries were obtained, samples received small additions of silica gel
(if needed) as filler. Samples were then sealed with epoxy and allowed to grow into
equilibrium for 21 days to prevent radon (222Rn) from escaping the sample. Samples were
then analyzed using Canberra High Purity Germanium well detectors and multi-channel
analyzers (DSA-1000).

20
2.4 Particulate Organic Carbon and Stable Carbon Isotopes
POC concentrations were determined, and used to derive POC inventories within, and
fluxes to these sediments. Stable carbon isotope analysis of organic carbon was used to
characterize the source of plant material at each site (Hobbie and Werner 2004). All
aliquots for POC and stable isotopes were analyzed at the Kentucky Stable Isotope
Geochemistry Laboratory (KSIGL), Department of Earth and Environmental Sciences, at
the University of Kentucky. Carbon isotope data were compared with radionuclide data
to identify and constrain, if possible, the timeframe when the dominant vegetation at
study sites shifted from C4- to C3-dominated. C4 pathway plants are predominately
grasses, while all trees utilize the C3 pathway. While C4 pathway plants are usually
grasses, there are some grasses that are C3 plants. All of the sites originally had drainage
basins that were originally forests (C3). Some sites were cleared of vegetation and
reclaimed using different grasses (C4) and afterwards trees were planted, or allowed to
naturally regenerate. This change in isotopic values was used to determine if OC stored in
these sediments recorded the transitions.
Stable isotopic values of carbon derived from OM present in soils and sediments are
commonly coupled with geochronology to infer past climatic shifts as reflected by major
changes in vegetation, including changes from cooler climate C3 pathway plants, to
warmer climate C4 pathways plants (e.g., Phillips and Gregg, 2001; Stevenson et al.,
2005; Kohn, 2010). Plant matter acts as a reservoir for atmospheric carbon (Bernoux et
al., 1998; Peterson and Fry 1987), which is isotopically fractionated depending on plant
type. Values of δ13C from organic sources (i.e., plant matter in soil) were compared with
known value ranges of differing photosynthetic pathways; δ13C values for C3 pathway

21
plants (forests) range from -20‰ to -35‰, and C4 pathways (grassland) have a range of -
11‰ to -15‰ (Dawson et al., 2002; Kohn, 2010). Isotopic ratios of carbon are expressed
in the form:
𝑋 = (𝑅𝑆𝑎𝑚𝑝𝑙𝑒 − 𝑅𝑆𝑡𝑎𝑛𝑑𝑎𝑟𝑑
𝑅𝑆𝑡𝑎𝑛𝑑𝑎𝑟𝑑) × 1000
where X represents δ13C, and R represents 13C/12C.
The supplies of organic carbon and nitrogen to soils in eastern Kentucky are primarily
controlled by atmospheric inputs, OM decay, microbial processes, and the types and
densities of in situ vegetation (e.g., Compton et al., 2007; Updegraff et al., 1995; Fornara
and Tilman, 2008). POC inventories have been calculated for the upper 10 cm of all
study sites, and POC fluxes were calculated for all sites where sediment accumulation
rates could be determined. For trenched sites, the surface is represented by the first
measurement taken from 0-2 cm. In push cores, the surface is represented by the mean of
the POC measurements taken at the 0-1 and 1-2 cm intervals.
Sample aliquots for stable carbon isotope and POC analyses were bathed in dilute
HCl (10%) and heated in an oven for 1 hour at 100° C to remove inorganic carbon. Then
samples were filtered, dried, weighed, and rolled into tin capsules (~5 mg). Each sample
was then run through an elemental analyzer (Costech ECS 4010 EA), and from there into
an isotope ratio mass spectrometer (Thermo Finnigan Delta Plus XP, Thermo Fisher
Scientific, Inc.) by continuous flow through (Conflo IV, Thermo Fisher Scientific, Inc.).
All POC and stable isotope samples have been compared against certified standards,
including Acetanilide (SRM-141D), USGS 40 (SRM-8573), USGS 41 (SRM-8574), and
NIST (SRM-1515). All data collected were corrected for drift and linearity. Calculated

22
carbon isotope values were compared to the international Vienna PeeDee Belemnite (V-
PDB) standard (O’Leary 1988).
CHAPTER THREE: RESULTS
3.1 Reclaimed Mine Land Digital Elevation Models (DEM)
High resolution DEMs have been acquired for all sites using ArcGIS to aid in the
identification of valley fills near study sites RFGC, VFWB, BM_07, and SFMC (Figure
4) and logging sites RFMS, RFFB, and FCA (Figure 5). No valley fills were found within
the sub-basins of any of the logging sites. The Star Fire (SFMC) and Bent Mountain
(BM_07) are located on top of valley fills unlike RFGC and VFWB that are below valley
fills. Five separate valley fills are located within the sub-basin including the study site at
Guy Cove (RFGC).

23
Figure 4. High resolution DEMs of reclaimed mine lands around study sites at Robinson
Forest Guy Cove (top left – RFGC), Star Fire Mine (top right – SFMC), Bent Mountain
Mine (lower left - BM), and Valley Fill Williams Branch (bottom right - VFWB). Valley
fills near VFWB and RFGC are shown by white arrows.
These valley fills can be identified by terraced topographic areas. The study site VFWB
lives up to its name with the presence of a large valley fill located to the north of the
sampling site and four additional valley fills near the site for a total of five, all within the
sub-basin that includes this site. The valley fills located at RFGC are all downstream of
the site where cores and trenches were collected and do not affect the site. The five valley
fills around VFWB do not affect the sampling site is in an isolated tributary.

24
Figure 5. High resolution DEMs of logged areas around study sites at Robinson Forest
Millseat (top left - RFMS), Forestry control (top right - FCA), and Field branch (bottom
left - RFFB).
3.2 Robinson Forest Satellite Imagery and Sub-Basins
Satellite images from 2016 (Google Earth) were used to outline sub-basins for all
sites. Satellite images from 1994 to 2016, taken at an altitude of approximately 15 miles,
have been used to identify land scarring due to mining activity and overlaid on sub-basins
to show how much of each was mined. Changes in mining activity are listed in Appendix
A. The logged sites RFMS, RFFB, and FCA (Figure 6) are located within two separate

25
sub-basins. RFMS and RFFB are located in the Clemons Fork sub-basin that
encompasses an area of 4.20 km2. One trench was excavated at each of the sites for a
total of two sampling trenches within the Clemons Fork sub-basin (RFMS_17T,
RFFB_18T). FCA is located in the Coles Fork sub-basin with an area of 17.20 km2. A
single trench was excavated at FCA for the Coles Fork sub-basin (FCA_15)
Figure 6. Satellite imagery (2016) showing the locations of previously logged sites (red)
and the sub-basins (blue) within which they are located. RFMS (top left) and RFFB (top
right) are both located within the Clemons Fork sub-basin. FCA (bottom left) is located
within the Coles Fork sub-basin.
The mined site RFGC (Figure 7) is located within the Laurel Fork sub-basin that
covers an area of 6.56 km2. In 1994, ~4.28 km2 of the Laurel Fork sub-basin (65%)

26
showed land scarring due to mining activity. By 1998, mining activity decreased slightly
to an area of 4.21 km2 (64%). In 1998, RFGC was reclaimed as pastureland. RFGC was
disturbed in 2008, and then reclaimed using the FRA. In images examined from 2008,
and from 2016, no land scarring from mining was evident within the Laurel Fork sub-
basin. Changes in mined area for the Laurel Fork sub-basin are shown in Figure 8. Once
trench and two push cores were collected from the Laurel Fork sub-basin from RFGC
(RFGC_17T, RFGC_17PC_A, RFGC_17PC_B).
Figure 7. Satellite imagery (2016) showing RFGC (red) and its location within the Laurel
Fork sub-basin (blue). Barren areas of the sub-basin (black) are shown for 1994, and 1998.

27
Figure 8. Changes in mining activity for the Laurel Fork sub-basin from 1994-2016.
The mined site SFMC (Figure 9) is located within the Long Fork sub-basin that
covers an area of 10.80 km2. In 1994, 1.10 km2 of the Long Fork sub-basin (10%) had
been mined. In 1997, SFMC was reclaimed using the FRA, but mining within the Long
Fork sub-basin continued. By 1998, mining had increased to cover an area of 3.34 km2
(31%). In 2008, mining decreased to an area of 3.13 km2 (29%), and by 2016, it had
increased to its maximum extent, covering 4.34 km2 (40%). Changes in land scarring
from mining are shown in Figure 10. A single sampling trench was excavated from
SFMC within the Long Fork sub-basin (SFMC_15).
0
1
2
3
4
5
6
1994 1998 2008 2016
Min
ed A
rea
(km
2)
Year
Laurel Fork

28
Figure 9. Satellite imagery (2016) showing SFMC (red) and its location within the Long
Fork sub-basin (blue). Barren areas of the sub-basin (black) are shown for 1994, 1998,
2008, and 2016.

29
Figure 10. Changes in mining activity for the Long Fork sub basin from 1994-2016.
VFWB (Figure 11) is located in the Troublesome Creek sub-basin that encompasses
an area of 8.17 km2. In 1994, there was no land scarring from mining within the sub-
basin. In 1998, 0.11 km2 of the Troublesome Creek sub-basin (1%) had been mined, and
this increased to its maximum extent of 2.51 km2 (31%) in 2008. In 2013, VFWB was
reclaimed as pastureland, and by 2016, mining activity decreased to an area of 0.88 km2
(11%). Changes in mining activity for VFWB are shown in Figure 12. One push core was
sampled from VFWB within the Troublesome Creek sub-basin (VFWB_17PC_A).
3.3 Bent Mountain Satellite Imagery and Sub-Basins
The mined site at BM (Figure 13) is located in the Brush Fork sub-basin that covers
an area of 28.40 km2. In 1994, mining covered ~1.92 km2 of the sub-basin (7%). In 1998,
land scarring decreased to 1.22 km2 (4%). In 2004, the site was reclaimed using the FRA,
but mining within the sub-basin continued. By 2008, the mining area increased to its
maximum extent at 3.79 km2 (13%). By 2016, land scarring decreased to an area of 1.74
km2 (6%). Changes in land scarring from mining activity for BM are shown in Figure 14.
One sampling trench was excavated from the Bent Mountain mines within the Brush
Fork sub-basin (BM_07).
0
1
2
3
4
5
6
1994 1998 2008 2016
Min
ed A
rea
(km
2)
Year
Long Fork

30
Figure 11. Satellite imagery (2016) showing VFWB (red) and its location within the
Troublesome Creek sub-basin (blue). Barren areas of the sub-basin (black) are shown for
1998, 2008, and 2016.
Figure 12. Changes in mining activity for the Troublesome Creek sub basin from 1994-
2016.
0
0.5
1
1.5
2
2.5
3
1994 1998 2008 2016
Min
ed A
rea
(km
2)
Year
Troublesome Creek

31
Figure 13. Satellite imagery (2016) showing BM (red) and its location within the Brush
Fork sub-basin (blue). Barren areas of the sub-basin (black) are shown for 1994, 1998,
2008, and 2016.

32
Figure 14. Changes in mining activity for the Brush Fork sub-basin from 1994-2016.
3.4 Grain Size Distributions
Grain size distribution data were compiled for all cores and trenches sampled.
Analysis of push cores was completed at 1 cm intervals from 0-50 cm, and at 2 cm
intervals from 50 cm to the end of the core. Trenches were quantified at 2 cm intervals.
All grain size results are summarized in Appendix A.
The control site trenches RFMS _17T and FCA_15 (Figure 15) were analyzed to a
depth of 50 cm. RFMS _17T was sampled at 2 cm intervals over its entire depth, whereas
FCA _15 was sampled at 2 cm intervals to 20 cm depth, and then at 5 cm intervals over
the remaining depth. RFMS_17T sediments are predominantly sands (43-69%), then silts
(20-46%), gravels (4-22%), and minor amounts of clay sized particles (0.9-5%). This
trench does have a fining upward sequence from 0-16 cm. Data below 16 cm are more
erratic, with a large spike in gravel at 36 cm (33%). FCA _15 is dominated by silts from
10-50 cm (39-57%), and contains a low percentage of clay-sized particles (2-14%). The
upper 10 cm of the trench shows a noticeably higher amount of gravels (36-75%). There
is an overall fining downward sequence at FCA_15.
0
1
2
3
4
5
6
1994 1998 2008 2016
Min
ed A
rea
(km
2)
Year
Brush Fork

33
RFGC_17T and RFFB_18T were sampled to depths of 26 cm and 22 cm, respectively
(Figure 16), and both were sampled at 2 cm intervals over these depths. RFGC_17T
sediments are predominantly silts (50-63%), and then sands (25-44%) from 0-10 cm.
From 10-26 cm sands become dominant (50-60%), while silts decrease (31-43%). Small
Figure 15. Grain size distributions vs. depth for control site trenches RFMS_17T (left)
and FCA_15 (right).
amounts of clay-sized particles (5-11%), and minor gravels (0.5-4%) are present
throughout the entire sampled depth and show a fining upward sequence. The dominant
particle size throughout all of RFFB_18T is sand (40-63%). Gravels and silts show
similar values (~20-30%) over the entire sampled depth, with minor amounts of clay-
sized particles (1-2%).

34
Figure 16. Grain size distributions vs. depth for trenches RFGC_17T (left) and
RFFB_18T (right).
The two push cores RFGC_17PC_A and RFGC_17PC_B (Figure 17) were collected
within 0.5 m of one another and reached depths of 96 cm and 98 cm, respectively. The
top 18 cm of both cores fine upward, with increasing amounts of silts and clay-sized
particles towards the surface. Below 18 cm, both cores exhibit a dominant mixture of
sands and silts over the remaining section (with RFGC_17PC_B having more sand at
depth), and both show an increase in gravels after ~70 cm.
Trenches SFMC_15 and BM_07_16 (Figure 18) were both sampled to depths of 50
cm and sectioned at 2 cm intervals for 20 cm, and then at 5 cm intervals over the
remainder of the sections. These two sites show large differences in particle size
distributions. SFMC_15 is the only site with gravel as the dominant particle size
throughout the entire profile, with values ranging from 40-90%. After gravel, silts (8-
40%), and sands (4-15%) make up the dominant size classes, with little clay sized

35
Figure 17. Grain size distributions vs. depth for push cores RFGC_17PC_A (left) and
RFGC_17PC_B (right).
Figure 18. Grain size distributions vs. depth for trenches SFMC_15 (left) and BM_07_16
(right).

36
particles present (0.5-3.7%). BM_07_16 is dominated by sands and gravel over the whole
section, with some silts (~20%), and minor clay-sized particles (< 5%).
The VFWB_17PC_A core (Figure 19) was sampled to a depth of 68 cm. The top 6
cm are dominated by silts (44-70%) with smaller amounts of sand (20-28%). Gravels
Figure 19. Grain size distribution vs. depth for push core VFWB_17PC_A.
(0.4-27%) and clay-sized particle (5-12%) fractions are low thoughout the core. From 6-
68 cm, the particle size distribution becomes more erratic, with sands and silts
dominating, with appreciable gravel over many depth intervals, and lesser amounts
(typically ~10% or less) of clay-sized particles.
3.5 Radiochemistry
3.5.1 Gamma Spectroscopy
7Be was resolved at four of the six trenches sampled, but was not detected in the three
push cores. 137Cs activity concentration profiles were constructed for three trenches and

37
two push cores. All radiochemical data are provided in Appendix B. Inventories of 137Cs
and 7Be are compared in Table 2, along with the expected 137Cs inventory from
atmospheric deposition alone. By comparing actual 137Cs inventories to those expected
from atmospheric deposition alone, a sedimentation ratio can be calculated.
Sedimentation ratio values < 1 indicate that the site is net erosional, values > 1 indicate
that net deposition has occurred, while values ~1 indicates that erosion and deposition
have been roughly equal to one another, or that no deposition (hiatus) has occurred at that
site during the period of record. Based on 137Cs sedimentation ratios, all sites with
measurable 137Cs are net depositional with the exception of RFGC_17T. This site appears
to be a depositional environment, but the 137Cs profile is incomplete. 137Cs linear (LAR)
and mass (MAR) accumulation rates for 1952 and 1963 are compared in Table 3.
Table 2. 137Cs and 7Be inventories for all trenches and cores. *Indicates incomplete 137Cs
profile.
Core/Trench 137Cs Inventory
(mBq cm-2)
7Be Inventory
(mBq cm-2)
Sedimentation
Ratio
Atmospheric 135.20 N/A --
RFFB_18T 0 N.D. --
RFMS_17T 288.23 13.12 2.13
FCA_15 472.01 28.30 3.49
RFGC_17T* 155.84 5.04 1.15
RFGC_17PC_A 336.64 N.D. 2.49
RFGC_17PC_B 393.36 N.D. 2.91
VFWB_17PC_A 0 N.D. --
SFMC_15 0 18.72 --
BM_07_16 0 N.D. --

38
Table 3. LARs and MARs from 1952 and 1963 for sites with 137Cs data.
Core/Trench
137Cs
LAR
(1963)
(cm yr-1)
137Cs
LAR
(1952)
(cm yr-1)
137Cs
MAR
(1963)
(g cm-2
yr-1)
137Cs
MAR
(1952)
(g cm-2
yr-1)
Mean
LAR
(cm yr-1)
Mean
MAR (g
cm-2 yr-1)
RFMS_17T N.D. 0.23 ±
0.03 N.D.
0.36 ±
0.07 -- --
FCA_15 N.D. 0.37 ±
0.03 N.D.
0.51 ±
0.10 -- --
RFGC_17T N.D. N.D. N.D. N.D. -- --
RFGC_17PC_A 0.55 ±
0.02
0.68 ±
0.02
0.73 ±
0.15
0.95 ±
0.19
0.62 +
0.02
0.79 +
0.17
RFGC_17PC_B 0.55 ±
0.02
0.65 ±
0.02
0.76 ±
0.15
0.96 ±
0.19
0.60 +
0.02
0.86 +
0.17
7Be is present in the uppermost interval (0-2 cm) at site RFMS_17T (Figure 20),
indicating that some limited physical or biological mixing has taken place here recently
(< 1 year). 137Cs appears at 17 cm and its activity concentration increases moving towards
the surface, however there is no clear peak in 137Cs activity. This could be due to flooding
that occurred within the watershed in 2009. This led to a change in the stream bed and
multiple landslides. The first appearance of 137Cs can be taken to represent the year 1952,
from which mass and linear accumulation rates of 0.36 (g cm-2 yr-1) and 0.23 (cm yr-1)
were derived.
7Be and 137Cs activity concentration profiles at FCA_15 (Figure 21) were similar to
those at RFMS_17T. 7Be is present in the uppermost interval (0-2 cm) at this site,
indicating that some limited physical or biological mixing has taken place here recently
(< 1 year). 137Cs appears at 19 cm and its activity concentration generally increases
moving towards the surface; however, there is no clear peak in 137Cs activity. The first

39
appearance of 137Cs can be taken to represent the year 1952, from which mass and linear
accumulations rates of 0.51 (g cm-2 yr-1) and 0.37 (cm yr-1) were derived.
Figure 20. 7Be (left) and 137Cs (right) activity concentration profiles for trench
RFMS_17T. The dashed line denotes the year 1952.

40
Figure 21. 7Be (left) and 137Cs (right) activity concentration profiles for trench FCA_15.
The dashed line denotes the year 1952.
7Be is present in the uppermost interval (0-2 cm) at site RFGC_17T (Figure 22),
indicating that some limited physical or biological mixing has taken place here recently
(< 1 year). The 137Cs activity concentration profile appears to be truncated, and does not
include the first appearance of 137Cs, nor a clear peak in activity (both likely due to the
shallow depth of this section), making the determination of sediment accumulation rates
using 137Cs impossible. The two cores taken from this area, RFGC_17PC_A and
RFGC_17PC_B (Figure 23), show no 7Be activity, but do provide much more complete
137Cs profiles. The absence of 7Be indicates no recent mixing (< 1 year). In both of these
cores, 137Cs activity begins around 45 cm (1952) and maximum activity occurs around 30
cm (1963). From 1952, RFGC_17PC_A has a mass accumulation rate of 0.95 (g cm-2 yr-
1), and a linear accumulation rate of 0.68 (cm yr-1). From 1963, both the mass and linear
accumulation rates decrease to 0.73 (g cm-2 yr-1) and 0.55 (cm yr-1), respectively. The

41
mean mass and linear accumulation rates based on 137Cs for RFGC_17PC_A are 0.79 (g
cm-2 yr-1) and 0.62 (cm yr-1), respectively. From 1952, RFGC_17PC_B has a mass
accumulation rate of 0.96 (g cm-2 yr-1) and a linear accumulation rate of 0.65 (cm yr-1).
From 1963, these rates decreased to 0.76 (g cm-2 yr-1) and 0.55 (cm yr-1), respectively.
The mean mass and linear accumulation rates based on 137Cs for RFGC_17PC_B are 0.86
(g cm-2 yr-1) and 0.60 (cm yr-1), respectively.
SFMC_15 shows no 137Cs activity, but 7Be is present within the upper 2 cm at this
site, indicating that some limited physical or biological mixing has taken place here
recently (< 1 year) (Figure 24). The absence of 137Cs is likely due to the mining activity
that has taken place at the Star Fire mines and the young age of the site post reclamation
(18 yr.).
Figure 22. 7Be (left) and 137Cs (right) activity profiles for trench RFGC_17T.

42
Figure 23. 137Cs activity concentration profiles for push cores RFGC_17PC_A (left) and
RFGC_17PC_B (right). The dashed and solid lines denote the years 1952, and 1963,
respectively.
Figure 24. 7Be activity profile for trench SFMC_15.

43
137Cs and 7Be are also absent from sites VFWB_17PC_A, RFFB_18T, and BM_07_16.
The lack of these radionuclides at sites VFWB_17PC_A and BM_07_16 is due the young
age of these sites post reclamation (5, and 12 yrs., respectively). A lack of these
radionuclides at RFFB_18T may be due to large amounts of sand sized particles at the
site (see Figure 16). 137Cs-based sediment accumulation rates for all sites are presented in
Figure 25.
3.5.2 Alpha Spectroscopy and Sediment Accumulation Rates
Alpha spectrometry was performed on five of the six trenches and all three push cores
sampled. Activities of 210Pb and 210Pbex for all sites are listed in Appendix B. Mass
accumulation rates spanning ~100 years BP have been summarized in Appendix D. The
only site that did not yield 210Pbex or 137Cs was RFFB_18T. The mined sites SFMC and
BM did not contain 137Cs, but do show 210Pbex. Grain size is similar for these three sites
with very little clay present, but higher amounts of sands and gravel. Radionuclides
readily absorb onto smaller grain size particles like clay and silt, but not sands or gravel
(Mabit et al. 2008; He and Walling 1996; Matisoff et al. 2002). However, RFFB shows
very low amounts of POC compared to SFMC and BM. The higher amounts of POC
could explain the presence of 210Pbex within the mined sites, but not at RFFB.

44
Figure 25. 137Cs-based sediment accumulation rates based on the 1952 (top) and 1963
(bottom) time markers for RFMS, FCA, and RFGC. Values for RFGC are based on mean
values for the two push cores taken at the site. Uncertainties reported at one standard
deviation.
The inventories of 210Pbex are listed in Table 4, along with the 210Pbex inventory
expected from atmospheric deposition alone, and sedimentation ratios based on 210Pbex.
Sedimentation ratios indicate that RFGC_17T, VFWB, SFMC, and BM_07 show net
erosion over the last century. RFMS, FCA, and both RFGC cores all show net deposition
over the last century. MARs and LARs are listed in Table 5.
0
0.2
0.4
0.6
0.8
1
1.2
1.4
RFMS FCA RFGC13
7C
s R
ates
(g c
m-2
yr-1
, cm
yr-1
)Study Site
1952 MAR
1952 LAR
0
0.1
0.2
0.3
0.4
0.5
0.6
0.7
0.8
0.9
1
RFMS FCA RFGC
13
7C
s R
ates
(g
cm
-2yr-1
, cm
yr-1
)
Study Site
1963 MAR
1963 LAR

45
Table 4. 210Pbex inventories for all cores compared against inventories expected from
atmospheric deposition alone, and sedimentation ratios.
Trench/Core 210Pbex Inventory (mBq cm-2) Sedimentation
Ratio
Atmospheric 537.42 -
RFMS_17T 711.98 1.32
FCA_15 1,393.15 2.59
RFGC_17T 306.66 0.57
RFGC_17PC_A 1,032.33 1.92
RFGC_17PC_B 2,094.61 3.89
VFWB_17PC_A 52.92 0.09
SFMC_15 410.43 0.76
BM_07_16 9.55 0.02
Table 5. Comparison of average 210Pbxs MARs and LARs for all sites. All uncertainties
reported at one sigma.
Trench/Core 210Pbex MAR (g cm-2 y-1) 210Pbex LAR (cm y-1)
RFMS_17T 0.20 ± 0.05 0.14 ± 0.04
FCA_15 0.58 ± 0.63 N.D.
RFGC_17T 0.14 ± 0.09 0.13 ± 0.08
RFGC_17PC_A 0.22 ± 0.15 0.23 ± 0.15
RFGC_17PC_B 1.11 ± 1.00 0.85 ± 0.76
SFMC_15 0.60 ± 0.33 N.D.
BM_07_16 N.D. N.D.
Analysis of RFMS_17T (Figure 26) provides mass and linear accumulation rates
determined using 210Pbex. Accumulation rates are the lowest around 80 years BP with
values at 0.11 (g cm-2 yr-1) and 0.08 (cm yr-1). From 80 to 50 years BP rates increase to
0.23 (g cm-2 yr-1) and 0.17 (cm yr-1). After this, rates remain between 0.20 to 0.24 (g cm-2
yr-1) and 0.15 to 0.17 (cm yr-1). The relatively strong linear regression fit for linear and
mass accumulation rates (R2 = 0.72; p = 0.03) indicates that sediment accumulation
rates have steadily increased over time at this site.

46
Figure 26. Sediment mass accumulation rates (left) and linear accumulation rates (right)
for trench RFMS_17T.
Analysis of FCA_15 provides MAR data determined using 210Pbex (Figure 27), spanning
the last ~120 years BP. There is no LAR data for this site due to a lack of measured bulk
density. The highest rates are seen at 101 years BP at 2.40 (g cm-2 yr-1). This very high
rate is likely due to logging activity that occurred up until 90 years BP around this site.
Rates show a sharp decline from 100 to 80 years BP. A strong exponential regression fit
(R2 = 0.77; p = 0.01) from 60 years BP to the present shows that accumulation rates have
rapidly decreased within that 60-yr. time period.

47
Figure 27. Sediment mass accumulation rates for trench FCA_15. Exponential regression
is shown for data spanning 60 years BP to the present.
Analysis of RFGC_17T (Figure 28) begins to provide a clearer picture of the effects
of the FRA as opposed to grassland reclamation. Sediment MAR and LAR are measured
up to 50 years BP, and the strong exponential regression fits (R2 = 0.98; p = 0.01)
indicate rapid and progressively increasing rates between 50- and 20-years BP, when the
site was initially reclaimed as pastureland. During this period (red in Figure 28),
accumulation rates were at 0.15 (g cm-2 yr-1) and 0.14 (cm yr-1). At 10 years BP, the FRA
was implemented, and rates are shown to continue increasing to their maximum values, at
0.27 (g cm-2 yr-1) and 0.24 (cm yr-1).

48
Figure 28. Sediment mass accumulation rates (left) and linear accumulation rates (right)
for trench RFGC_17T. Shaded sections provide the timing of grassland reclamation (red)
and the FRA (blue).
210Pbxs data from the two push cores collected in RFGC provide better resolution than
the trench site at RFGC_17T. RFGC_17PC_A (Figure 29) and RFGC_17PC_B (Figure
30) exhibit large differences in both sediment MARs and LARs. Sediment accumulation
rates for RFGC_17PC_A are measured up to 110 years BP. Twenty years ago, when the
site was reclaimed using grassland reclamation, the rates were 0.13 (g cm-2 yr-1, and cm
yr-1). At 10 years BP, the FRA was implemented. At this time both MARs and LARs
increased significantly to the highest values since the site was reclaimed, at 0.18 (g cm-2
yr-1, and cm yr-1).
The average rates for RFGC_17PC_B are abnormally high when compared with all
other sampling trenches and push cores. This push core did show the most robust 210Pbex

49
profile of all sampled sites. These highly elevated results are likely due to heterogeneity
over small spatial scales; i.e., processes captured in the record at one core site were not
captured at a second core site.
Figure 29. Sediment mass accumulation rates (left) and linear accumulation rates (right)
for push core RFGC_17PC_A. Shaded sections provide the timing of grassland
reclamation (red) and the FRA (blue).

50
Figure 30. Sediment mass accumulation rates (left) and linear accumulation rates (right)
for push core RFGC_17PC_B. Shaded sections provide the timing of grassland
reclamation (red) and the FRA (blue). Exponential regression fits for 40 years BP to
present are shown (left, both plots), as are fits from 40 to 100 years BP (right, both plots).
There are strong exponential regression fits (R2 = 0.85, P < 0.01) for both sediment
LAR and MAR from 100 to 40 years BP, indicating that sediment accumulation rates
rapidly increased during this period. From 40 years BP to the present, there is another set
of strong exponential regression fits (R2 = 0.72, P < 0.01) for both sediment LAR and
MAR, indicating that sediment accumulation rates rapidly decreased during this period.
At 20 years BP the site was reclaimed as pasture, and MAR and LAR both increase due
to reclamation disturbances to 0.55 (g cm-2 yr-1) and 0.43 (cm yr-1), respectively. After
this, soils likely stabilized due to reclamation, and then sediment accumulation rates
decreased to 0.48 (g cm-2 yr-1) and 0.37 (cm yr-1). The site was again disturbed 10 years
BP using the FRA, and sediment accumulation rates increased again to 0.67 (g cm-2 yr-1)
and 0.51 (cm yr-1).

51
VFWB and BM_07 did not yield any useful 210Pb data. This is likely due to the
relatively young age of these reclaimed mine sites (5, and 12 yrs., respectively). Analysis
of the reclaimed mining site SFMC_15 (Figure 31) does not provide LAR data due to a
lack of measured bulk density at the site. This trench provided evidence of increased
MAR associated with the timing of the FRA. Sediment MARs for the site were
determined to 82 years BP. At SFMC_15, a strong exponential regression fit (R2 = 0.78,
P < 0.01) shows that rates have increased rapidly over this period. At 18 years BP, the
FRA was implemented when the MAR was ~0.61 (g cm-2 yr-1), and similar to MARs
determined in push cores taken from site RFGC, there is a slight decrease in MAR from
reclamation disturbance, followed by an increase to its maximum value at 1.12 (g cm-2 yr-
1). Figure 32 compares the mean 210Pbex MAR and LAR rates.
Figure 31. Sediment mass accumulation rate for trench SFMC_15. The shaded section of
the graph provides the timing of the FRA (blue).

52
Figure 32. 210Pbex MARs and LARs for study sites. Uncertainties reported at one standard
deviation.
3.6 Particulate Organic Carbon and Stable Isotopes
3.6.1 Particulate organic carbon and bulk density
POC concentrations were determined for samples from all six trenches and the three
push cores. Bulk density was calculated for all sampling sites with the exceptions of
SFMC_15, FCA_15, and BM_07_16. All cores and trench data show, as expected, an
inverse relationship between POC and bulk density, with bulk density increasing with
depth while POC concentrations decrease. At all sites, POC is enriched at the surface (as
expected). POC inventories over the top 10 cm, and POC fluxes (determined using
210Pbex-based rates) are listed in Table 6. Inventory and flux values are depicted in Figure
33. POC inventories are also compared with 210Pbex based mass accumulation rates in
Figure 34.
0
0.5
1
1.5
2
2.5
21
0P
bex
Rat
es (
g c
m-2
yr-1
, cm
yr-1
)
Study Site
MAR
LAR

53
Table 6. POC inventories (1-10 cm), and surface (0-2 cm for trenches; and mean value of
1-2 cm for push cores) POC fluxes for all cores and trenches. POC fluxes are calculated
using mean 210Pbex-derived sediment accumulation rates.
Trench/Core POC Inventories (g cm-2) POC Flux (g cm-2 y-1)
RFMS_17T 0.157 0.004
FCA_15 0.831 0.120
RFFB_18T 0.032 N.D.
RFGC_17T 0.204 0.003
RFGC_17PC_A 0.251 0.018
RFGC_17PC_B 0.772 0.203
VFWB_17PC_A 0.229 N.D.
SFMC_15 0.369 0.019
BM_07_16 0.369 N.D.
Figure 33. POC inventory (1-10 cm) (top), and POC flux (bottom) for all study sites.
00.10.20.30.40.50.60.70.80.9
PO
C I
nv
ento
ries
(g
cm
-2)
Study site
POC Inventory
0
0.05
0.1
0.15
0.2
0.25
PO
C F
lux
(g
cm
-2yr-1
)
Study site
POC Flux

54
Figure 34. Comparison of 210Pbex mass accumulation rates and POC inventories for all
sites.
The two control sites RFMS_17T and FCA_15 (Figure 35) both show similar trends in
POC concentrations with depth. In both trenches, POC concentrations are highest near
the surface and decreases with depth with the exception of concentrations at 14 and 32
cm for RFMS_17T, where there is a slight increase in POC. RFFB_18T and RFGC_17T
(Figure 36) show similar trends as RFMS_17T. RFFB_18T shows small increases in
POC concentrations at 8, 14, 16, and 18 cm. RFGC_17T shows a decrease in POC
concentrations from 2-4 cm, after which an increase occurs at 6 cm for the highest value
at 2.9%. Values continually drop until 12 cm, at which point they remain constant
between 0.1-0.5% to the bottom of the trench.
y = 1.0523x1.0853
R² = 0.738
P= 0.02
0
0.2
0.4
0.6
0.8
1
1.2
0 0.2 0.4 0.6 0.8 1
21
0P
bex
MA
R (
g c
m-2
yr-1
)POC Inventory (g cm-2)

55
Figure 35. Particulate organic carbon (POC) concentration profiles for trenches
RFMS_17T (left) and FCA_15 (right).
Figure 36. Particulate organic carbon (POC) concentration profiles for trenches
RFFB_18T (left) and RFGC_17T (right).

56
The two push cores RFGC_17PC_A and RFGC_17PC_B (Figure 37) show the same
trends as the previous sites. RFGC_17PC_A and RFGC_17PC_B show almost identical
POC concentration profiles. However, RFGC_17PC_B is shown to have much higher
maximum POC concentrations.
Figure 37. Particulate organic carbon (POC) concentration profiles for push core
RFGC_17PC_A (left) and RFGC_17PC_B (right).
The trenches from the reclaimed mine lands at SFMC_15 and BM_07_16 are depicted in
Figure 38. BM_07_16 follows the general trend seen for POC concentration profiles,
with small spikes in POC concentrations at 18, 30, and 40 cm. SFMC_15 shows
fluctuations from 5 to 15 cm with a spike in values between 20 and 25 cm. The final push
core VFWB_17PC_A (Figure 39) shows the same trend as seen throughout the previous
study sites.

57
Figure 38. Particulate organic carbon (POC) concentration profiles for trenches
SFMC_15 (left) and BM_07_16 (right).
Figure 39. Particulate organic carbon (POC) concentration profile for push core
VFWB_17PC_A.

58
3.6.2 Stable Carbon Isotopes
Stable carbon isotope data were compiled for five trenches and the three push cores.
Gaps in δ13C profiles are due to carbon isotope values that did not fall within acceptable
detection limits. All δ13C profiles fall within values associated with forested landscapes (-
20‰ to -35‰). Trenches RFMS_17T and FCA_15 are depicted in Figure 40. The values
at RFMS_17T fall between -25‰ to -29‰. δ13C data for FCA_15 range from -28‰ to -
26.1‰, and show an enrichment in 13C as depth increases.
Figure 40. δ13C profiles for trenches RFMS_17T (left) and FCA_15 (right).
δ13C profiles for trench RFGC_17T and push core VFWB_17PC_A are depicted in
Figure 41. δ13C values for RFGC_17T range from -26.8‰ to -29‰. The values for
VFWB_17PC_A range from -28‰ to -25.5‰ with an overall enrichment in 13C with
increasing depth, with the exception of a depletion of 13C at 23 cm. The push cores
RFGC_17PC_A and RFGC_17PC_B are depicted in Figure 42. RFGC_17PC_A exhibits

59
enrichment in 13C with depth. δ13C values range from -31‰ to -25.5‰. RFGC_17PC_B
shows a depletion in 13C as depth increases, with values ranging from -25‰ to -28‰.
BM_07_16 and SFMC_15 (Figure 43) both show a slight shift to more positive δ13C
values as depth increases. SFMC_15 values range from -26.9‰ to -25.2‰ and shift to
more positive values with increasing depth. BM_07_16 shows a slight enrichment with
increased depth with values ranging from -27.6‰ to -25‰.
Figure 41. δ13C profiles for trench RFGC_17T (left) and push core VFWB_17PC_A
(right).

60
Figure 42. δ13C profiles for push cores RFGC_17PC_A (left) and RFGC_17PC_B (right).
Figure 43. δ13C profiles for trenches SFMC_15 (left) and BM_07_16 (right).

61
CHAPTER FOUR: DISCUSSION
Little work has been done to measure sediment accumulation rates, and bulk changes
in sedimentary organic matter δ13C in reclaimed mine lands and formerly logged areas.
The findings of this study could potentially aid in the recovery of native hardwood forests
that have been adversely impacted by the effects of strip mining and logging, in
Kentucky and elsewhere. Results of this study are summarized by full core and trench
profiles for all sites in Appendix E to aid in addressing the hypothesis.
RFFB_18T yielded the least amount of data for all study sites and only shows grain
size and POC concentrations. As expected, the grain size profile in Figure 16 for this
stream bank site shows that this site is dominated by sands, with appreciable gravel
(~20% throughout) and little variability in evidence over the section. The larger amount
of gravel at the base of the trench (~40%) could indicate a change in the energy of the
depositional system. The presence of more sand at this site is likely the reason that
radionuclides are absent. However, the site is adjacent to a stream and sediments with
radionuclides could have also been removed during scouring events from floods that
occurred within the watershed in 2009. POC concentrations and inventory for this site
(Figures 33, 36) are the lowest of all study sites. These low quantities of POC could also
be an indicator of scouring at the study site. Logging ceased in this area over 36 years
ago, but the site shows less organic carbon than the other two logging sites and the most
recently reclaimed mining sites at VFWB and BM_07.
As expected, the control site at RFMS_17T shows that the site is dominated by sand
size particles (Figure 15; ~50% over the whole section), with no erratic variations in
particle size distribution within the fining upward sequence of the top 16 cm. These

62
results are similar to the grain size data at RFFB, which was also located adjacent to a
small perennial stream. The changes in grain size from 20 cm to the end of the core may
indicate an increase in the energy of the depositional environment. Due to this site’s close
proximity to a stream, this could be a result of flooding events in 2009, since mining did
not occur at this site. Radionuclide data (see below) suggests that sediments deeper than
~20 cm likely represent the period during or immediately following active logging in this
sub-basin, which is in congruence with the presence of appreciable gravel (20-40%) and
less silt between 20 cm and the end of the section. POC concentrations and inventory for
the site (Figures 33, 35) do not show any irregularities, but there is less organic carbon at
this site compared to the other control site at FCA (POC inventories are lower than FCA
by more than a factor of 4). This is likely due to the location where sampling occurred
(virtually no surface vegetation) and the potential for removal of organic matter from
scouring events.
Neither 137Cs (Figure 20) nor 210Pbex are found below 15 cm in the section, suggesting
that sediments below this depth represent ~100 years BP or more (during or immediately
following active logging). The relatively strong linear regression fit for 210Pbex sediment
accumulation rates (Figure 26) show a gradual increase over the last century. These
results were unexpected because logging within watersheds corresponds to increased
magnitudes of sediment transport and deposition (Brown and Krygier 1971). Watersheds
that have been logged show an increase in sedimentation by a factor of 0.6 to 5.0
(Megahan and Kidd 1972; Beschta 1978). This continuous increase in accumulation rates
is likely not due to landslide activity in the area. Satellite imagery does not show any
evidence of recent landslides (Figure 6). If landslides had occurred in the area,

63
radionuclides would likely not be present due to deep burial of sediments. There were,
however, multiple flooding events including a large event in 2009.
The increase in sedimentation could also be due to an overall increase in stream
power. Both logged and undisturbed watersheds have shown increases in sedimentation
with higher stream power (Rice et al. 1979). Periods with decreased streamflow could
have been caused by large influxes of woody debris to streams from logging activity.
Typically, undisturbed logged watersheds do not transport large amounts of woody debris
(Benda 2005), so higher amounts of woody material could create dams that slow stream
flow. The 137Cs-based sediment accumulation rates from 1952 are a bit higher than the
average 210Pbex accumulation rates (Tables 3 and 5), but compare reasonably well. Both
radionuclides do indicate that over the last century the site has shown net deposition
(Tables 2 and 4).
The trench grain size profile at the second control site FCA_15 (Figure 15) shows a
coarsening upwards sequence from ~20 cm to the surface (increasing gravel and
decreasing silt) with no erratic changes in particle size distribution over the section. This
does not appear to be out of the ordinary due to the site’s location at a ridgetop. In this
setting, very fine-grained sediments are either not deposited, or can be winnowed by
wind and rain, or localized events (Foufoula-Georgiou et al. 2010). The upper 10 cm of
this site are dominated by gravel likely from colluvium, with the rest dominated by silt-
sized particles (20-40%) with some sand (5-30%) and minor clay (5-10%). The POC
concentrations, inventory and flux for this site are all much higher than the other two
logged sites in the study (Figure 35), unsurprisingly. This is very likely due to the site’s
location on a forested ridgetop, where both trees and ground cover vegetation are

64
relatively abundant; and its distance from any streams that could periodically remove
organic-rich sediments.
137Cs extends to 19 cm (Figure 21) and 210Pbex to 27 cm in the section, suggesting that
sediments below this depth (27 cm) represent more than 100 years BP, and so one or both
of these radionuclides record the period during which this area was logged. 210Pbex based
sediment accumulation rates from ~120-70 years BP are erratic (Figure 27), but capture
the highest resolved sediment accumulation rate (~2.49 g cm-2 y-1) of any site, at ~100
years BP, when this area was actively logged. A strong exponential regression fit for
210Pbex (Figure 27) shows that rates sharply declined from 60 BP to the present. This is
likely due to the regrowth of forests in the area. Both radionuclides indicate that the site
has been net depositional over the period of record (Tables 2 and 4). The average 210Pbex-
based and 137Cs-based sediment mass accumulation rates are very similar (Tables 3 and
5).
Results for RFGC_17T grain size (Figure 16) shows a fining upward sequence from
~12 cm to the surface, without any erratic changes to particle size distribution over the
section. The upper 10 cm is dominated by silts (50-70%), with the lower section of the
trench dominated by sands (~60%). The high amount of silt in the upper part of this
trench is not unexpected, as the site is located in the floodplain of a small stream. The
sandier sediments lower in the profile were likely deposited during periods of elevated
mining activity that would have led to elevated sediment loading and deposition. The
presence of these coarser sediments could also indicate an increase in the energy of the
environment, which would explain why this site is shown as net erosional. POC
concentrations, inventory and flux for this site follows the same general trend seen at all

65
other sampling sites, but shows less organic carbon than the two cores collected at this
site (Figure 36).
The erratic and truncated nature of the 137Cs profile is unsurprising, given the shallow
depth of this trench (26 cm). 210Pbex penetrates to ~11 cm, resolving ~50 years of record.
A strong exponential regression fit to 210Pbex-based sediment accumulation rates indicates
a rapid increase in rates over this period (Figure 28). This should be expected due to
mining activity. Although the site was reclaimed as pasture 20 year ago (1997), in 1998
there was still a large amount (64%) of land scarring within the watershed due to mining
activity (Figure 7). This exposed sediment would still be unstable and lead to increased
sediment loading at the study site. The 210Pbex sedimentation ratio indicates the site has
been net erosional over the period of record (Table 4), which is expected given the
shallow penetration depth and reduced temporal range resolved using this isotope. After
the site was disturbed and reclaimed using the FRA (2007), accumulation rates continued
to increase, but does not necessarily support the hypothesis due to a lack of captured
time.
The two push cores collected from Guy Cove, RFGC_17PC_A and RFGC_17PC_B,
show many similarities to one another, as expected. Both grain size profiles (Figure 17)
exhibit fining upward sequences from ~20 cm to the surface. This same trend (from ~12
cm to the surface) is seen within the trench collected from this site. In both cores, the
sections below 20 cm are dominated by sands (50-80%), with appreciable gravel
appearing below 70 cm in core A (up to ~20%). These coarser sediments could reflect a
higher energy setting and a different, and dominantly coarser, supply of sediment than in
recent time, both certainly due to mining here. Another explanation for the courser

66
sediments is that it represents and older stream bed that was buried. POC concentrations,
inventories and fluxes for both sites show the same trends, but RFGC_17PC_B shows the
highest POC flux, and second highest POC inventory (after control site FCA) of all
stations (Figure 37). The differences observed between the two cores and one trench
sampled at this site reflect heterogeneities over small spatial scales.
The 137Cs-based sediment accumulation rates for RFGC_17PC_A and
RFGC_17PC_B are similar to one another, as expected. Both cores show that rates
decreased from 1952 to 1963 (Table 3). Strong exponential regression fits to 210Pbex
derived sediment accumulation rates from RFGC_17PC_B (Figure 30) show that
accumulation rates rapidly increased from ~100 years to ~40 years BP, and then rapidly
decreased from ~40 years BP to the present, with some fluctuations over the last ~30
years BP. These large changes are not evident at RFGC_17PC_A (Figure 29), but this is
likely be due to a less robust 210Pbex profile for this core.
This large spike in accumulation rates at RFGC_17PC_B occurred before mining
began around this site in the late 1980s. The increase in accumulation rates around 30
years BP are likely from the strip mining that occurred within the watershed, there should
have been a large increase in sediment loading around this site due to the large amount of
mine spoil produced (Ramani 2012). This should show that the site has been net
depositional, which is supported by both 137Cs and 210Pbex sedimentation ratios (Tables 2
and 4). The site was reclaimed using grassland reclamation 20 years BP, and was then re-
disturbed 10 years later to implement the FRA. After implementation of the FRA,
accumulation rates in both cores increased, which supports the hypothesis. The results

67
from the trench and two cores from RFGC not only support the hypothesis, but also
contain the most robust record of what occurred at any of the study sites.
The grain size distribution for trench SFMC_15 (Figure 18) shows that this is the only
site dominated by gravel sized particles over the entire section, with the highest value at
90%, and average value at ~60%. This is to be expected due to mining activity that
occurred 18 years ago at this site and the disturbance of bedrock from strip mining
(Haering et al. 2004; Jaeger 2015) and the reconstruction of the site using large amounts
of mine spoil. The POC concentration profile for this area does not show any major
irregularities (Figure 38). POC inventories and fluxes are similar to the other mined sites
(Figure 33, Table 6).
There was no detectable 137Cs present at this site. 210Pbex-based sediment
accumulation rates (Figure 31) over time have increased exponentially at this site over
the period of record (~80 years), with the highest values seen after the FRA was
implemented 18 years BP, which supports the hypothesis. Values prior to 30 years BP
may be inaccurate due to how the site is constructed. The thick layers of mine spoil used
to reconstruct the site would have covered radionuclides present before the site was
reclaimed. The rapid rise in sediment accumulation rates over the period of record is not
likely attributable to mining activity in this area, but the presence of vegetation on the
site. As these plants grow their root systems will continually break down the thick layers
of mine spoil present. The 210Pbex sedimentation ratio indicates that the site has been net
erosional over the period of record (Table 4), which is likely due to a combination of
some episodic erosion and the coarse-grained nature of the sediments here, which are
poor adsorption surfaces for 210Pb.

68
The grain size profile for BM_07_16 (Figure 18) shows high quantities of sands and
gravels, with moderate amounts of silt (~20-30%) and little clay (~5%). The POC
concentration profile does not show an irregular trend, but shows the lowest POC
concentrations of all the reclaimed mining sites (Figure 38). POC inventories are similar
to the other previously mined sites (except for RFGC_17PC _B, which was much
higher), and POC fluxes could not be determined for this site. There was no 137Cs present
at BM_07_16 and there was also insufficient 210Pbex to determine sediment accumulation
rates, both likely due to the prevalence of sand and gravel and the young age of the
reclaimed site (12 yr.).
The grain size distribution for VFWB_17PC_A (Figure 19) is dominated by silts and
sands, and appears fairly consistent over the entire section. Gravels are present
throughout much of the section, comprising as much as 20% in places, with lesser
amounts of clay-sized particles (~<10%). These results should be expected due to the
very young age (5 years) of this reclaimed mining site. This explains the lack of 137Cs,
and very limited 210Pbex data. Any sediments deposited here prior to mining were likely
either eroded, or deeply buried during mining due to subsequent valley fill operations
with sediments lacking either of these radionuclides. POC concentration data for this site
follows the normal trend seen with other sites but is slightly irregular at the surface
(Figure 39). The site is a wetland and should show higher amounts of organic carbon
similar to what is seen at RFGC.
The grain size and radionuclide data from this study are valuable tools for
understanding the complex erosion, sediment transport and depositional processes
following coal mine reclamation in eastern Kentucky and other parts of the world. The

69
results for RFGC are a good indicator of increased sediment loading due to valley fill
operations, as seen by the increase and decrease in accumulation rates 0 to 40 years BP.
The results showing a large spike in sediment accumulation is typical of areas that have
valley fills from previous strip mining (Bovis et al. 1998; Bernhardt and Palmer 2011). If
reclamation techniques based on the FRA are widely implemented, both ridgetop and
watersheds within mine lands could show increases in sediment loading and transport.
The 7Be data present in this study could be a potential tool for observing short
term bioturbation (Sharma et al. 1987) at reclaimed mines and logged watersheds. 7Be is
only present at older sites (RFMS, FCA, RFGC_17T, and SFMC) with the exception of
the stream site RFFB. The lack of 7Be at RFFB should be expected due to no other radio
nuclides being present at the site and low POC concentrations and inventories. The
presence of 7Be at the older sites could indicate that bioturbation is occurring which
would be beneficial in soil development. At this time, it is difficult to infer the effects of
bioturbation because there is no data pertaining to invertebrate organisms in the sampled
sediment. Another possible explanation for 7Be present at these sites could be from short
term surface erosion (Yang et al. 2006).
POC concentration profiles represented by figures 35-39 show that all sites follow the
typical and expected trends, with the largest amount of POC near the surface, where it is
sourced from decaying plant matter. Organic carbon typically decreases with depth
(Jobbágy and Jackson 2000). A site by site comparison of POC (1-10 cm) inventories and
fluxes (Figure 33) appears to show that reclaimed mine lands tend to have higher POC
inventories and lower fluxes than reclaimed logging sites. However, comparing the mean
values of POC inventories and fluxes between the two populations (logged vs. mined)

70
yields values for both that are not different when considering their uncertainties. These
results were unexpected due to the different site histories. It was believed that the POC
inventories and fluxes of mined sites would be much lower than previously logged sites.
Naturally regenerated logging sites in this study have had more recovery time than all
mined sites and would likely have more organic carbon. Mined areas such as SFMC and
BM_07 would likely have had a large portion of the topsoil damaged or completely
removed (Mensah 2015) and should have showed low amounts of organic carbon in the
top 10 cm. Figure 34 plots the relationship between mean 210Pbex mass accumulation rates
and POC inventories for all sites. There is a strong relationship (R2= 0.74, P=0.02)
indicating that as MARs increase more POC is delivered to the site.
Figures 40-43 show that all sites have no stable isotope values to indicate a transition
from C3 to C4 to C3 plants, all values are within the ranges of forested lands. Reclaimed
mine lands, however, show that δ13C becomes more depleted over time. Reclaimed mines
show values ranging from -22‰ to -27‰ in sites that range from 0 to 80 years old
(Maharaj et al. 2007). Stable isotope values for all sites did not show enrichments near -
22‰ .There may not have been an adequate amount of organic matter or too much time
had passed to show a transition from grasses (C4) to trees (C3). Another possible
explanation for this lack of transition could be caused the respiration of CO2 from
decaying organic matter. CO2 from decomposition is shown to be depleted in Carbon-13
(Wynn et al. 2006) implying that Carbon-12 is removed from the soil with the gas. The
steady removal of Carbon-12 from organic decomposition would likely prevent stable
isotope values from reflecting the actual source of the organic material.

71
CHAPTER FIVE: CONCLUSIONS
The results of this study successfully addressed the hypothesis. Sites that have been
reclaimed from mining have yielded adequate data to form a conclusion. There is
insufficient evidence to link changes in sediment accumulation rates with the size of site
sub-basins, or the areas of these sub-basins that were mined since the 1990’s. VFWB and
BM_07 do not contain enough 210Pbex data to provide adequate sediment accumulation
rates up to the timing of reclamation. This study concludes that the FRA does show
increased sediment accumulation rates compared to grassland reclamation in reclaimed
mine lands and leads to increased accumulation rates in mine lands that were not
previously reclaimed as pasture.
These findings show that areas reclaimed with the FRA would see an increase in
sediment transport, loading, and erosion. While the FRA shows increases in the
previously listed sedimentary processes, they are likely not severe enough to be
detrimental to the recovery of these disturbed sites. A major benefit from the FRA could
be seen with the restoration of forest soils. The strong relationship between 210Pbex MARs
and POC inventories show that even in sites with extensive strip mining and topsoil loss
(SFMC, BM_07), increased accumulation rates are delivering organic carbon to the upper
10 cm of soil.
The results of this study agree with the finding of previous work on sediment
transport and loading within reclaimed mine watersheds, but future work is needed to
study the effects of the FRA. Future studies should include an in-depth look at
sedimentation ponds constructed to trap eroded sediment within watersheds. These ponds
will likely show a more accurate representation of sediment transport and loading. The

72
results of 7Be show that in the future, invertebrate organisms should be taken into account
when sampling to help determine if short term surface mixing is due to bioturbation or
erosional processes. More logged sites are needed to provide a clearer picture of the
recovery time and changes in sediment transport before and after reclamation. Overall,
the objectives of this study were completed, and the hypothesis is supported by the
radionuclide accumulation rates.

73
APPENDICES
Appendix A. Study Site Coordinates, Core Shortening, Calculated Mining Activity, and
Sediment Physical Properties
Table A1. Study Site Coordinates
Study Site Latitude Longitude
RFMS 37.47425 -83.15474
RFFB 37.47160 -83.15600
FCA 37.46400 -83.14100
RFGC 37.41930 -83.17088
VFWB 37.38360 -83.15010
SFMC 37.41151 -83.12571
BM_07 37.60211 -82.41103
Table A2. Core Shortening
Study Site Inner Core (cm) Outer Core (cm) Core Shortening (cm)
RFGC_17PC_A 55.5 36.0 19.5
RFGC_17PC_B 53.5 34.0 19.5
VFWB N.D. N.D. N.D.
Table A3. Sub Basin Mining Extent 1994-2008
Sub Basin Mined Area
1994 (km2)
Mined Area
1998 (km2)
Mined Area
2008 (km2)
Mined Area
2016 (km2)
Laurel Fork 4.28 4.21 0.00 0.00
Long Fork 1.10 3.34 3.13 4.34
Troublesome
Creek
0.00 0.11 2.51 0.88

74
Table A3. Continued
Brush Fork 1.92 1.22 3.79 1.74
Table A4. Areal Extent of Mining
Sub Basin Basin Area (km2) Maximum Areal Extent of Mining (%)
Clemons Fork 4.20 0
Coles Fork 17.20 0
Laurel Fork 6.56 65
Long Fork 10.80 40
Troublesome Creek 8.17 31
Brush Fork 28.40 13
Table A5. RFMS_17T Sediment Physical Properties
Sample
Interval
(cm)
Organic
Carbon
(%)
Bulk density
(g/cm3)
Cumulative
Mass depth
(g/cm2)
Gravel
(%)
Sand
(%)
Silt
(%)
Clay
(%)
0-2 2.68 0.58 2.46 ± 0.25 0.87 49.22 46.14 3.77
2-4 1.37 0.61 5.04 ± 0.50 1.09 43.20 45.59 10.11
4-6 0.98 0.63 7.57 ± 0.76 4.06 52.07 38.47 5.40
6-8 0.63 0.63 10.09 ± 1.01 4.79 53.81 36.68 4.73
8-10 0.55 0.71 12.85 ± 1.29 4.36 54.48 35.53 5.63
10-12 0.35 0.73 15.84 ± 1.58 5.76 54.19 34.70 5.35
12-14 0.58 0.81 19.47 ± 1.95 6.55 58.20 30.51 4.74
14-16 0.29 0.82 23.09 ± 2.31 2.69 56.36 36.20 4.75
16-18 0.15 0.75 27.02 ± 2.70 4.21 68.74 23.58 3.47
18-20 0.25 0.71 30.98 ± 3.10 1.76 68.13 26.26 3.84
20-22 0.17 0.78 34.82 ± 3.48 15.54 60.55 21.03 2.89
22-24 0.21 0.73 38.80 ± 3.88 6.22 63.01 26.60 4.16
24-26 0.22 0.78 42.58 ± 4.26 11.75 58.83 25.42 4.01
26-28 0.25 0.82 46.4 ± 4.64 20.32 54.23 22.50 2.95
28-30 0.32 0.77 50.71 ± 5.07 8.35 59.66 28.48 3.51
30-32 0.73 0.75 55.10 ± 5.51 3.74 63.46 28.99 3.81
32-34 0.23 0.81 59.47 ± 5.95 16.14 59.13 21.94 2.80
34-36 0.13 0.86 63.56 ± 6.36 33.21 43.80 20.30 2.69
36-38 0.18 0.82 67.73 ± 6.77 17.80 51.32 27.49 3.39
38-40 0.20 0.83 72.01 ± 7.20 22.29 51.09 23.62 2.99
40-42 0.16 0.77 76.29 ± 7.63 20.17 54.22 22.65 2.95
42-44 0.14 0.85 80.25 ± 8.03 13.66 46.92 35.10 4.32
44-46 0.12 0.78 83.97 ± 8.40 18.53 45.75 31.47 4.25

75
Table A5. Continued
46-48 0.15 0.76 87.99 ± 8.80 7.14 48.79 38.88 5.18
48-50 0.33 0.87 91.72 ± 9.17 17.35 45.94 32.98 3.73
Table A6. FCA_15 Sediment Physical Properties
Sample
Interval
(cm)
Organic
Carbon
(%)
Bulk density
(g/cm3)
Cumulative
Mass depth
(g/cm2)
Gravel
(%)
Sand
(%)
Silt
(%)
Clay
(%)
0-2 21.12 ND 2.15 ± 0.22 75.05 5.51 16.85 2.59
2-4 4.95 ND 5.12 ± 0.51 66.78 13.48 17.31 2.43
4-6 3.62 ND 8.36 ± 0.84 51.01 16.16 28.10 4.73
6-8 2.39 ND 11.67 ± 1.17 50.50 17.25 27.66 4.60
8-10 2.03 ND 15.02 ± 1.50 36.30 21.15 35.99 6.55
10-12 1.72 ND 18.39 ± 1.84 23.90 17.34 48.84 9.92
12-14 1.51 ND 21.79 ± 2.18 20.51 24.72 45.32 9.46
14-16 1.18 ND 25.24 ± 2.52 32.14 19.41 40.08 8.37
16-18 1.03 ND 28.76 ± 2.88 17.27 37.28 39.37 6.08
18-20 0.85 ND 32.32 ± 3.23 15.88 30.31 44.76 9.05
20-25 0.90 ND 41.35 ± 4.13 15.67 26.65 48.69 8.99
25-30 0.80 ND 50.52 ± 5.05 13.56 21.94 51.67 12.84
30-35 0.60 ND 59.77 ± 5.98 8.40 23.43 57.39 10.77
35-40 0.40 ND 69.01 ± 6.90 10.41 19.06 56.52 14.01
40-45 0.40 ND 78.22 ± 7.82 24.58 17.60 47.15 10.67
45-50 0.40 ND 87.40 ± 8.74 10.84 23.83 54.02 11.31
Table A7. RFFB_18T Sediment Physical Properties
Sample
Interval
(cm)
Organic
Carbon
(%)
Bulk density
(g/cm3)
Cumulative
Mass depth
(g/cm2)
Gravel
(%)
Sand
(%)
Silt
(%)
Clay
(%)
0-2 0.44 0.55 2.49 ± 0.25 17.58 58.68 20.95 2.80
2-4 0.18 0.76 5.98 ± 0.60 13.08 67.94 16.61 2.36
4-6 0.11 0.76 9.86 ± 0.99 17.15 59.63 20.54 2.69
6-8 0.16 0.79 13.49 ± 1.35 15.99 67.39 14.54 2.08
8-10 0.13 0.73 17.33 ± 1.73 16.21 60.84 20.48 2.47
10-12 0.11 0.83 20.81 ± 2.08 25.78 51.03 20.84 2.35
12-14 0.18 0.77 24.22 ± 2.42 17.77 55.18 23.99 3.07
14-16 0.18 0.78 27.65 ± 2.76 12.33 62.60 22.44 2.63
16-18 0.18 0.75 30.95 ± 3.09 22.50 55.73 19.48 2.29
18-20 0.12 0.88 34.26 ± 3.43 25.41 46.36 25.35 2.88

76
Table A7. Continued
20-22 0.14 0.83 37.50 ± 3.75 38.01 39.45 19.73 2.81
Table A8. RFGC_17T Sediment Physical Properties
Sample
Interval
(cm)
Organic
Carbon
(%)
Bulk density
(g/cm3)
Cumulative
Mass depth
(g/cm2)
Gravel
(%)
Sand
(%)
Silt
(%)
Clay
(%)
0-2 2.36 0.26 1.12 ± 0.11 2.99 26.76 62.30 7.95
2-4 1.81 0.64 3.56 ± 0.36 0.18 37.37 55.56 6.89
4-6 2.82 0.60 5.94 ± 0.59 0.10 25.51 63.51 10.88
6-8 1.98 0.51 7.97 ± 0.80 0.91 30.31 62.08 6.71
8-10 1.15 0.57 10.21 ± 1.02 0.64 43.96 50.01 5.38
10-12 0.30 0.81 13.50 ± 1.35 0.28 56.20 38.88 4.64
12-14 0.30 0.76 16.72 ± 1.67 1.46 58.99 35.53 4.02
14-16 0.20 0.79 20.22 ± 2.02 4.17 60.20 31.89 3.75
16-18 0.10 0.76 23.41 ± 2.34 4.24 57.53 34.57 3.66
18-20 0.22 0.67 26.27 ± 2.63 0.67 58.11 36.96 4.26
20-22 0.44 0.75 29.39 ± 2.94 1.26 60.32 34.37 4.05
22-24 0.37 0.80 32.48 ± 3.25 0.48 52.04 43.17 4.31
24-26 0.39 0.73 35.35 ± 3.53 2.46 54.84 38.52 4.18
Table A9. RFGC_17PC_A Sediment Physical Properties
Sample
Interval
(cm)
Organic
Carbon
(%)
Bulk density
(g/cm3)
Cumulative
Mass depth
(g/cm2)
Gravel
(%)
Sand
(%)
Silt
(%)
Clay
(%)
0-1 10.10 0.35 0.42 ± 0.04 0.00 7.11 79.12 13.78
1-2 6.00 0.35 0.83 ± 0.08 0.00 12.60 75.32 12.08
2-3 4.20 0.68 1.53 ± 0.15 0.00 10.08 77.59 12.32
3-4 4.60 0.68 2.22 ± 0.22 0.00 4.87 83.09 12.04
4-5 5.00 0.68 2.89 ± 0.29 0.00 5.59 82.40 12.02
5-6 2.70 0.68 3.56 ± 0.36 0.00 17.94 73.10 8.96
6-7 2.90 0.91 4.61 ± 0.46 0.00 20.61 70.53 8.86
7-8 1.70 0.91 5.66 ± 0.57 0.00 28.67 64.95 6.39
8-9 1.80 0.91 6.76 ± 0.68 0.00 27.98 65.40 6.62
9-10 1.00 0.91 7.86 ± 0.79 0.00 31.19 61.54 7.27
10-11 0.70 1.23 9.28 ± 0.93 0.00 36.09 56.67 7.24
11-12 0.90 1.23 10.71 ± 1.07 0.00 33.01 59.08 7.90
12-13 1.10 1.27 12.21 ± 1.22 0.00 30.69 61.27 8.04
13-14 0.50 1.27 13.71 ± 1.37 0.00 36.45 56.22 7.33

77
Table A9. Continued
14-15 0.50 1.35 15.31 ± 1.53 0.00 45.42 48.21 6.37
15-16 0.50 1.35 16.91 ± 1.69 1.14 51.70 40.79 6.38
16-17 0.50 1.51 18.54 ± 1.85 0.00 51.89 42.06 6.05
17-18 0.20 1.51 20.17 ± 2.02 0.00 56.00 38.56 5.44
18-19 0.17 1.62 21.78 ± 2.18 0.00 51.99 42.31 5.70
19-20 0.22 1.62 23.40 ± 2.34 0.00 54.23 40.21 5.56
20-21 0.30 1.45 24.97 ± 2.50 0.00 56.95 37.70 5.34
21-22 0.30 1.45 26.54 ± 2.65 0.00 56.97 38.22 4.81
22-23 0.30 1.36 28.13 ± 2.81 0.00 53.91 39.79 6.30
23-24 0.30 1.36 29.73 ± 2.97 0.00 54.31 40.19 5.50
24-25 0.30 1.44 31.29 ± 3.13 0.00 51.13 42.70 6.17
25-26 0.30 1.44 32.86 ± 3.29 0.00 55.26 39.36 5.38
26-27 0.30 1.48 34.47 ± 3.45 0.00 62.13 33.43 4.43
27-28 0.30 1.48 36.08 ± 3.61 0.00 59.75 35.05 5.21
28-29 0.20 1.57 37.63 ± 3.76 0.00 57.16 37.94 4.90
29-30 0.30 1.57 39.18 ± 3.92 0.00 56.50 38.60 4.89
30-31 0.40 1.54 40.74 ± 4.07 2.99 46.01 45.40 5.60
31-32 0.30 1.54 42.29 ± 4.23 1.45 52.35 40.03 6.17
32-33 0.30 1.67 43.86 ± 4.39 0.88 52.67 41.04 5.41
33-34 0.40 1.67 45.44 ± 4.54 1.39 50.40 42.07 6.14
34-35 0.30 1.64 46.9 ± 4.69 5.17 57.03 33.30 4.50
35-36 0.50 1.64 48.37 ± 4.84 0.00 50.65 43.79 5.54
36-37 0.30 1.47 49.82 ± 4.98 1.70 51.18 41.57 5.54
37-38 0.40 1.47 51.27 ± 5.13 3.70 57.53 34.96 3.82
38-39 0.40 1.35 52.70 ± 5.27 1.82 52.20 40.76 5.22
39-40 0.40 1.35 54.12 ± 5.41 0.85 41.17 51.94 6.04
40-41 0.30 1.35 55.56 ± 5.56 0.16 56.03 38.52 5.29
41-42 0.80 1.35 57.01 ± 5.70 3.35 42.60 48.24 5.81
42-43 0.40 1.51 58.53 ± 5.85 0.00 48.57 46.34 5.09
43-44 0.70 1.51 60.06 ± 6.01 0.00 53.23 41.73 5.03
44-45 0.60 1.56 61.62 ± 6.16 0.32 37.26 54.71 7.72
45-46 0.50 1.56 63.18 ± 6.32 0.73 49.64 42.99 6.64
46-47 0.40 1.31 64.81 ± 6.48 0.33 46.99 45.97 6.71
47-48 0.40 1.31 66.43 ± 6.64 4.84 44.55 44.55 6.06
48-49 0.30 1.61 68.10 ± 6.81 0.15 45.05 48.03 6.77
49-50 0.30 1.61 69.78 ± 6.98 2.03 53.52 38.57 5.88
50-52 0.50 0.78 ND 5.81 49.58 39.00 5.61
52-54 0.30 0.88 ND 0.64 58.88 35.52 4.98
54-56 0.30 0.98 ND 1.00 47.90 44.33 6.77

78
Table A9. Continued
56-58 0.30 0.75 ND 0.70 52.16 41.36 5.78
58-60 ND 0.84 ND 0.81 43.99 49.41 5.79
60-62 ND 0.85 ND 5.82 49.62 39.26 5.29
62-64 ND 0.91 ND 2.71 48.10 43.62 5.58
64-66 ND 0.81 ND 6.80 48.78 39.76 4.66
66-68 ND 0.88 ND 0.55 52.46 41.91 5.09
68-70 ND 0.81 ND 22.72 42.93 30.89 3.46
70-72 ND 0.72 ND 16.31 44.16 35.22 4.31
72-74 ND 0.75 ND 11.38 35.96 47.25 5.42
74-76 ND 0.79 ND 15.29 39.03 41.06 4.62
76-78 ND 0.81 ND 4.35 51.17 40.45 4.03
78-80 ND 0.81 ND 7.60 50.41 38.06 3.93
80-82 ND 0.82 ND 9.85 42.37 43.14 4.65
82-84 ND 0.72 ND 13.50 34.74 46.50 5.27
84-86 0.30 0.80 ND 2.33 49.73 42.46 5.47
86-88 ND 0.73 ND 10.73 38.72 45.58 4.96
88-90 0.30 0.78 ND 5.00 50.84 39.37 4.79
90-92 ND 0.81 ND 4.15 66.52 25.79 3.53
92-94 ND 0.85 ND 6.14 52.89 35.97 5.00
94-96 ND 0.75 ND 5.16 58.74 31.73 4.37
Table A10. RFGC_17PC_B Sediment Physical Properties
Sample
Interval
(cm)
Organic
Carbon
(%)
Bulk density
(g/cm3)
Cumulative
Mass depth
(g/cm2)
Gravel
(%)
Sand
(%)
Silt
(%)
Clay
(%)
0-1 26.80 0.49 0.53 ± 0.05 0.00 2.30 90.11 7.59
1-2 9.84 0.49 1.67 ± 0.17 0.00 10.34 83.70 5.96
2-3 11.23 1.08 2.16 ± 0.22 0.00 17.35 76.38 6.27
3-4 5.43 1.08 2.93 ± 0.29 0.00 26.07 68.83 5.09
4-5 5.69 0.50 4.01 ± 0.40 0.00 17.16 70.22 12.62
5-6 6.08 0.50 5.11 ± 0.51 0.00 28.86 64.04 7.10
6-7 8.65 0.75 6.53 ± 0.65 0.00 10.15 80.98 8.88
7-8 6.67 0.75 8.02 ± 0.80 1.92 23.41 69.92 4.76
8-9 2.92 1.16 9.65 ± 0.97 0.00 29.08 63.62 7.31
9-10 2.67 1.16 11.29 ± 1.13 0.00 31.42 62.09 6.48
10-11 2.65 1.12 12.91 ± 1.29 0.00 30.22 65.26 4.53
11-12 2.11 1.12 14.48 ± 1.45 1.54 38.19 54.30 5.96
12-13 0.69 1.46 15.98 ± 1.60 0.00 45.74 48.89 5.37
13-14 0.51 1.46 17.47 ± 1.75 0.00 33.48 58.70 7.82

79
Table A10. Continued
14-15 0.50 1.52 18.91 ± 1.89 1.80 48.46 45.42 4.32
15-16 0.61 1.52 20.35 ± 2.03 2.39 41.99 51.28 4.33
16-17 0.41 1.54 21.68 ± 2.17 0.00 49.74 43.88 6.37
17-18 0.89 1.54 22.91 ± 2.29 0.89 54.60 39.48 5.03
18-19 0.47 1.45 24.25 ± 2.42 3.96 57.53 34.49 4.02
19-20 0.53 1.45 25.61 ± 2.56 8.80 53.35 33.88 3.96
20-21 0.55 1.74 27.02 ± 2.70 2.39 54.86 38.54 4.20
21-22 0.44 1.74 28.42 ± 2.84 0.88 55.85 38.67 4.59
22-23 0.66 1.46 29.90 ± 2.99 1.50 54.61 39.35 4.52
23-24 0.41 1.46 31.39 ± 3.14 7.55 50.16 37.96 4.32
24-25 0.41 1.58 32.98 ± 3.30 0.92 55.81 39.26 4.02
25-26 0.53 1.58 34.57 ± 3.46 0.86 54.76 40.49 3.89
26-27 0.43 1.48 36.08 ± 3.61 0.94 54.72 39.44 4.91
27-28 0.45 1.48 37.64 ± 3.76 0.55 54.87 39.35 5.22
28-29 0.55 1.41 39.24 ± 3.92 0.00 61.03 34.43 4.54
29-30 0.58 1.41 40.87 ± 4.09 0.71 51.54 42.26 5.49
30-31 ND 1.54 42.39 ± 4.24 1.38 53.05 40.73 4.83
31-32 ND 1.54 43.99 ± 4.40 0.44 50.76 43.10 5.70
32-33 ND 1.26 45.78 ± 4.58 0.42 50.28 44.35 4.96
33-34 ND 1.26 47.45 ± 4.75 0.00 50.50 43.97 5.54
34-35 ND 1.19 49.16 ± 4.92 0.00 53.97 40.67 5.36
35-36 ND 1.19 50.75 ± 5.07 0.89 47.44 45.63 6.03
36-37 ND 1.33 52.43 ± 5.24 0.00 47.78 46.42 5.80
37-38 ND 1.33 54.09 ± 5.41 0.00 50.66 43.79 5.55
38-39 ND 1.29 55.76 ± 5.58 0.00 56.07 39.08 4.85
39-40 ND 1.29 57.44 ± 5.74 0.00 44.32 50.66 4.82
40-41 ND 1.44 59.18 ± 5.92 0.00 49.45 45.57 4.99
41-42 ND 1.44 60.87 ± 6.09 0.45 49.74 44.15 5.65
42-43 ND 1.34 62.51 ± 6.25 1.06 44.84 48.39 5.71
43-44 ND 1.34 64.13 ± 6.41 3.15 44.59 46.82 5.45
44-45 ND 1.47 65.87 ± 6.59 0.00 44.96 49.32 5.72
45-46 ND 1.47 67.57 ± 6.76 0.00 46.21 48.27 5.52
46-47 ND 1.49 69.22 ± 6.92 0.00 43.63 50.42 5.94
47-48 ND 1.49 70.80 ± 7.08 0.89 42.61 50.67 5.83
48-49 ND 1.60 72.26 ± 7.23 0.00 48.01 45.71 6.28
49-50 ND 1.60 ND 0.00 48.32 45.35 6.34
50-52 ND 0.92 ND 0.00 48.41 45.92 5.66
52-54 ND 0.81 ND 0.17 50.41 43.37 6.04
54-56 ND 0.85 ND 0.00 58.90 35.76 5.33

80
Table A10. Continued
56-58 ND 0.83 ND 0.67 57.73 36.08 5.51
58-60 ND 0.82 ND 0.17 61.66 33.46 4.71
60-62 ND 0.78 ND 0.00 61.84 33.57 4.59
62-64 ND 0.72 ND 0.00 72.67 23.54 3.78
64-66 ND 0.70 ND 0.00 68.97 27.29 3.75
66-68 ND 0.67 ND 0.96 62.43 32.35 4.26
68-70 ND 0.82 ND 0.80 62.25 33.07 3.87
70-72 ND 0.76 ND 1.35 62.06 32.33 4.26
72-74 ND 0.85 ND 1.58 60.71 33.51 4.21
74-76 ND 0.75 ND 4.36 62.65 30.01 2.99
76-78 ND 0.76 ND 5.38 51.56 38.62 4.43
78-80 ND 0.71 ND 3.80 59.15 33.29 3.77
80-82 ND 0.84 ND 5.55 54.76 36.20 3.49
82-84 ND 0.74 ND 1.82 58.30 35.51 4.37
84-86 ND 0.63 ND 3.22 60.72 32.66 3.39
86-88 ND 0.76 ND 7.52 55.79 33.61 3.07
88-90 ND 0.73 ND 1.32 62.70 32.28 3.70
90-92 ND 0.74 ND 1.85 61.77 32.45 3.92
92-94 ND 0.75 ND 1.07 56.49 38.44 4.00
94-96 ND 0.76 ND 4.10 57.32 34.89 3.70
96-98 ND 0.75 ND 0.52 61.94 33.87 3.66
Table A11. VFWB_17PC_A Sediment Physical Properties
Sample
Interval
(cm)
Organic
Carbon
(%)
Bulk density
(g/cm3)
Cumulative
Mass depth
(g/cm2)
Gravel
(%)
Sand
(%)
Silt
(%)
Clay
(%)
0-1 4.50 1.05 1.07 ± 0.11 0.00 22.54 70.73 6.73
1-2 4.00 1.05 2.14 ± 0.21 0.00 26.09 62.04 11.86
2-3 1.73 1.74 3.80 ± 0.38 3.05 35.41 53.42 8.12
3-4 1.35 1.74 5.45 ± 0.55 7.55 29.56 56.12 6.75
4-5 1.03 1.74 7.08 ± 0.71 4.28 39.96 49.92 5.83
5-6 0.91 1.74 8.71 ± 0.87 9.02 33.18 50.92 6.88
6-7 0.98 1.61 10.36 ± 1.04 1.20 48.98 44.21 5.61
7-8 0.97 1.61 12.01 ± 1.20 12.53 32.72 48.14 6.62
8-9 0.60 1.58 13.71 ± 1.37 2.80 32.73 56.49 7.98
9-10 0.64 1.58 15.41 ± 1.54 26.77 22.57 44.22 6.45
10-11 0.37 1.71 17.13 ± 1.71 7.41 40.06 45.80 6.73
11-12 0.65 1.71 18.84 ± 1.88 6.84 35.67 51.50 5.99
12-13 0.68 1.70 20.49 ± 2.05 1.29 34.02 57.99 6.70
13-14 1.03 1.70 22.14 ± 2.21 14.35 29.67 48.92 7.06

81
Table A11. Continued
14-15 0.62 1.75 23.85 ± 2.39 11.51 37.47 44.15 6.87
15-16 1.15 1.75 25.56 ± 2.56 3.91 43.25 44.47 8.37
16-17 0.83 1.93 27.29 ± 2.73 3.66 37.47 49.97 8.90
17-18 0.77 1.93 29.01 ± 2.90 7.16 40.38 46.35 6.11
18-19 1.20 1.69 30.76 ± 3.08 8.25 45.23 40.56 5.96
19-20 0.81 1.69 32.51 ± 3.25 6.10 35.81 51.64 6.44
20-21 0.90 1.62 34.18 ± 3.42 15.05 30.28 47.19 7.47
21-22 1.02 1.62 35.86 ± 3.59 5.26 46.79 41.50 6.44
22-23 1.29 1.76 37.53 ± 3.75 9.68 39.35 42.37 8.60
23-24 0.73 1.76 39.20 ± 3.92 2.48 35.87 51.33 10.32
24-25 0.73 1.66 40.86 ± 4.09 23.18 28.21 40.70 7.92
25-26 0.68 1.66 42.52 ± 4.25 3.31 33.39 54.94 8.36
26-27 0.77 1.71 44.20 ± 4.42 1.47 35.77 52.45 10.32
27-28 0.60 1.71 45.89 ± 4.59 27.04 24.85 40.27 7.85
28-29 0.75 1.84 47.64 ± 4.76 12.81 40.50 40.16 6.53
29-30 0.84 1.84 49.39 ± 4.94 2.92 41.38 48.25 7.45
30-31 0.85 1.78 51.10 ± 5.11 5.36 42.89 43.79 7.97
31-32 0.15 1.78 52.82 ± 5.28 13.01 49.50 33.14 4.36
32-33 0.77 1.87 54.55 ± 5.46 0.58 47.76 44.08 7.57
33-34 0.56 1.87 56.29 ± 5.63 2.26 63.24 30.18 4.32
34-35 0.76 1.84 57.98 ± 5.80 2.12 65.70 28.25 3.93
35-36 0.85 1.84 59.68 ± 5.97 10.83 38.93 42.17 6.50
36-37 0.62 1.88 61.39 ± 6.14 17.38 38.99 39.15 4.49
37-38 0.91 1.88 63.10 ± 6.31 17.13 36.31 40.77 5.79
38-39 1.10 1.66 64.78 ± 6.48 0.86 72.18 23.16 3.80
39-40 0.90 1.66 66.46 ± 6.65 7.13 33.82 52.93 6.12
40-41 1.48 1.66 68.11 ± 6.81 6.14 39.71 46.88 7.27
41-42 1.47 1.66 69.77 ± 6.98 3.74 39.28 48.41 8.57
42-43 0.98 1.47 71.44 ± 7.14 27.20 24.17 41.27 7.36
43-44 1.01 1.47 73.12 ± 7.31 6.84 34.10 52.07 7.00
44-45 0.93 1.69 74.78 ± 7.48 4.22 31.86 55.36 8.55
45-46 0.86 1.69 76.44 ± 7.64 7.92 41.84 43.48 6.75
46-47 0.79 1.72 78.20 ± 7.82 13.34 32.23 47.29 7.13
47-48 0.93 1.72 79.96 ± 8.00 4.51 42.45 47.13 5.90
48-49 0.84 1.64 81.63 ± 8.16 2.23 44.56 46.32 6.87
49-50 0.88 1.64 83.31 ± 8.33 6.40 34.97 51.25 7.38
50-52 ND 0.74 86.65 ± 8.67 14.63 33.89 44.00 7.48
52-54 ND 0.82 90.16 ± 9.02 8.29 37.97 46.21 7.51
54-56 ND 0.81 92.97 ± 9.30 5.81 39.81 47.23 7.14
56-58 ND 0.95 96.29 ± 9.63 22.42 34.05 37.50 6.03
58-60 ND 0.90 99.84 ± 9.98 6.22 34.53 50.46 8.80
60-62 ND 0.87 ND 19.56 36.42 37.95 6.08

82
Table A11. Continued
62-64 ND 0.85 ND 28.84 27.23 38.49 5.44
64-66 ND 0.74 ND 10.00 38.57 44.21 7.22
66-68 ND 0.80 ND 10.09 35.21 48.04 6.66
Table A12. SFMC_15 Sediment Physical Properties
Sample
Interval
(cm)
Organic
Carbon
(%)
Bulk density
(g/cm3)
Cumulative
Mass depth
(g/cm2)
Gravel
(%)
Sand
(%)
Silt
(%)
Clay
(%)
0-2 3.11 ND 1.58 ± 0.16 40.97 15.78 40.75 2.49
2-4 1.87 ND 3.46 ± 0.35 55.16 11.48 30.80 2.56
4-6 1.93 ND 5.68 ± 0.57 72.52 7.92 17.32 2.24
6-8 1.72 ND 8.18 ± 0.82 47.70 10.85 38.10 3.35
8-10 2.59 ND 10.75 ± 1.08 47.38 13.14 34.66 4.83
10-12 1.77 ND 13.35 ± 1.34 40.59 20.10 34.60 4.71
12-14 2.33 ND 15.97 ± 1.60 55.89 13.45 27.63 3.03
14-16 1.89 ND 18.63 ± 1.86 87.01 4.36 7.75 0.88
16-18 2.38 ND 21.22 ± 2.12 78.83 7.37 11.97 1.82
18-20 2.67 ND 23.80 ± 2.38 65.74 11.04 20.45 2.78
20-25 2.82 ND 30.12 ± 3.01 71.08 10.93 15.84 2.15
25-30 2.50 ND 36.12 ± 3.61 58.52 15.33 23.71 2.45
30-35 2.00 ND 42.20 ± 4.22 66.92 9.99 20.56 2.53
35-40 2.10 ND 48.24 ± 4.82 59.39 14.71 22.95 2.94
40-45 2.60 ND 54.10 ± 5.41 58.80 12.38 25.45 3.37
45-50 ND ND ND ND ND ND ND
Table A13. BM_07_16 Sediment Physical Properties
Sample
Interval
(cm)
Organic
Carbon
(%)
Bulk density
(g/cm3)
Cumulative
Mass depth
(g/cm2)
Gravel
(%)
Sand
(%)
Silt
(%)
Clay
(%)
0-2 0.70 ND 1.58 ± 0.16 30.58 40.80 26.16 2.46
2-4 0.30 ND 3.46 ± 0.35 34.50 37.13 25.13 3.25
4-6 0.30 ND 5.68 ± 0.57 27.30 45.04 25.15 2.51
6-8 0.30 ND 8.18 ± 0.82 25.27 49.48 22.82 2.43
8-10 0.20 ND 10.75 ± 1.08 20.38 46.99 29.16 3.47
10-12 0.20 ND 13.35 ± 1.34 28.74 43.82 24.48 2.96
12-14 0.20 ND 15.97 ± 1.60 37.00 38.77 21.26 2.97
14-16 0.30 ND 18.63 ± 1.86 32.18 43.31 21.74 2.77
16-18 0.40 ND 21.22 ± 2.12 39.26 40.18 18.46 2.10
18-20 0.20 ND 23.80 ± 2.38 31.93 35.92 29.16 2.99

83
Table A13. Continued
20-25 0.15 ND 30.12 ± 3.01 45.64 37.63 15.39 1.34
25-30 0.30 ND 36.12 ± 3.61 38.52 35.92 22.67 2.88
30-35 0.20 ND 42.20 ± 4.22 32.64 42.69 22.20 2.48
35-40 0.30 ND 48.24 ± 4.82 32.31 33.57 30.23 3.89
40-45 0.20 ND 54.10 ± 5.41 30.48 38.08 27.68 3.76
45-50 0.20 ND 59.87 ± 5.99 35.79 38.91 21.89 3.41

84
Appendix B. 7Be, 137Cs, 210Pb, and 210Pbxs Activities
Table B1. RFMS_17T 7Be, 137Cs, 210Pb, and 210Pbxs Activities
Sample Interval
(cm)
7Be (Bq/kg) 137Cs
(Bq/kg)
210Pb (Bq/kg) 210Pbxs
(Bq/kg)
0-2 5.33 ± 0.62 29.01 ± 1.78 119.35 ± 5.86 106.23 ± 5.07
2-4 0.00 ± 0.00 26.04 ± 1.37 65.71 ± 3.81 52.59 ± 3.02
4-6 0.00 ± 0.00 20.88 ± 1.50 47.93 ± 2.88 34.82 ± 2.09
6-8 0.00 ± 0.00 12.86 ± 0.88 41.77 ± 2.63 28.65 ± 1.84
8-10 0.00 ± 0.00 9.19 ± 0.96 30.36 ± 2.00 17.24 ± 1.21
10-12 0.00 ± 0.00 6.33 ± 0.41 28.66 ± 1.66 15.55 ± 0.87
12-14 0.00 ± 0.00 3.92 ± 0.40 23.75 ± 1.36 10.64 ± 0.57
14-16 0.00 ± 0.00 1.64 ± 0.10 19.15 ± 1.12 6.03 ± 0.33
16-18 ND 0.00 ± 0.00 11.69 ± 0.73 ND
18-20 ND 0.00 ± 0.00 12.04 ± 0.79 ND
20-22 ND 0.00 ± 0.00 9.40 ± 0.58 ND
22-24 ND 0.00 ± 0.00 14.65 ± 0.84 ND
24-26 ND 0.00 ± 0.00 12.04 ± 0.73 ND
26-28 ND 0.00 ± 0.00 10.76 ± 0.66 ND
28-30 ND 0.00 ± 0.00 10.26 ± 0.70 ND
30-32 ND 0.00 ± 0.00 10.11 ± 0.67 ND
32-34 ND 0.00 ± 0.00 10.20 ± 0.62 ND
34-36 ND 0.00 ± 0.00 10.41 ± 0.66 ND
36-38 ND 0.00 ± 0.00 10.83 ± 0.59 ND
38-40 ND 0.00 ± 0.00 12.56 ± 0.80 ND
40-42 ND 0.00 ± 0.00 12.14 ± 0.83 ND
42-44 ND 0.00 ± 0.00 13.23 ± 0.88 ND
44-46 ND 0.00 ± 0.00 12.99 ± 0.81 ND
46-48 ND 0.00 ± 0.00 13.22 ± 0.80 ND
48-50 ND 0.00 ± 0.00 13.14 ± 0.76 ND
Table B2. FCA_15 7Be, 137Cs, 210Pb, and 210Pbxs Activities
Sample Interval
(cm)
7Be (Bq/kg) 137Cs (Bq/kg) 210Pb (Bq/kg) 210Pbxs (Bq/kg)
0-2 14.02 ± 0.82 28.09 ± 1.72 303.61 ± 16.63 285.08 ± 15.54
2-4 0.00 ± 0.00 12.64 ± 0.77 98.02 ± 7.33 79.49 ± 6.23
4-6 0.00 ± 0.00 29.35 ± 1.82 78.80 ± 5.36 60.27 ± 4.26
6-8 0.00 ± 0.00 27.14 ± 1.65 50.12 ± 2.64 31.59 ± 1.55

85
Table B2. Continued
8-10 0.00 ± 0.00 20.11 ± 1.29 36.07 ± 2.40 17.54 ± 1.31
10-12 0.00 ± 0.00 18.34 ± 1.23 37.14 ± 2.59 18.61 ± 1.50
12-14 0.00 ± 0.00 11.56 ± 0.71 25.93 ± 1.58 7.40 ± 0.49
14-16 0.00 ± 0.00 2.93 ± 0.18 43.15 ± 2.69 24.62 ± 1.60
16-18 0.00 ± 0.00 3.97 ± 0.20 31.13 ± 2.10 12.60 ± 1.01
18-20 0.00 ± 0.00 1.36 ± 0.10 20.62 ± 1.27 2.09 ± 0.17
20-25 0.00 ± 0.00 0.00 ± 0.00 21.42 ± 1.40 2.89 ± 0.30
25-30 0.00 ± 0.00 0.00 ± 0.00 22.21 ± 1.38 3.68 ± 0.28
30-35 0.00 ± 0.00 0.00 ± 0.00 18.04 ± 1.00 ND
35-40 0.00 ± 0.00 0.00 ± 0.00 17.02 ± 0.91 ND
40-45 0.00 ± 0.00 0.00 ± 0.00 22.13 ± 1.37 ND
45-50 0.00 ± 0.00 0.00 ± 0.00 16.44 ± 1.01 ND
Table B3. RFFB_18T 7Be, 137Cs, 210Pb, and 210Pbxs Activities
Sample Interval (cm) 7Be
(Bq/kg)
137Cs (Bq/kg) 210Pb (Bq/kg) 210Pbxs (Bq/kg)
0-2 ND 0.00 ± 0.00 46.89 ± 2.33 23.08 ± 0.92
2-4 ND 0.00 ± 0.00 22.60 ± 1.45 0.00 ± 0.00
4-6 ND 0.00 ± 0.00 16.45 ± 1.05 0.00 ± 0.00
6-8 ND 0.00 ± 0.00 24.12 ± 1.50 0.00 ± 0.00
8-10 ND 0.00 ± 0.00 20.39 ± 1.27 0.00 ± 0.00
10-12 ND 0.00 ± 0.00 19.44 ± 1.24 0.00 ± 0.00
12-14 ND 0.00 ± 0.00 24.98 ± 1.61 1.17 ± 0.20
14-16 ND 0.00 ± 0.00 20.93 ± 1.29 ND
16-18 ND 0.00 ± 0.00 24.75 ± 1.51 ND
18-20 ND 0.00 ± 0.00 24.73 ± 1.43 ND
20-22 ND 0.00 ± 0.00 21.95 ± 1.29 ND
Table B4. RFGC_17T 7Be, 137Cs, 210Pb, and 210Pbxs Activities
Sample Interval (cm) 7Be (Bq/kg) 137Cs (Bq/kg) 210Pb (Bq/kg) 210Pbxs (Bq/kg)
0-2 4.48 ± 0.27 0.00 ± 0.00 67.89 ± 4.89 42.77 ± 3.33
2-4 0.00 ± 0.00 0.00 ± 0.00 51.39 ± 3.36 26.26 ± 1.80
4-6 0.00 ± 0.00 0.00 ± 0.00 55.92 ± 3.90 30.80 ± 2.34
6-8 0.00 ± 0.00 1.89 ± 0.14 52.94 ± 3.10 27.81 ± 1.54
8-10 0.00 ± 0.00 4.45 ± 0.37 46.99 ± 3.01 21.87 ± 1.46
10-12 0.00 ± 0.00 3.71 ± 0.20 29.90 ± 1.87 4.78 ± 0.31
12-14 0.00 ± 0.00 3.33 ± 0.41 23.78 ± 1.53 ND
14-16 0.00 ± 0.00 2.87 ± 0.19 22.07 ± 1.40 ND

86
Table B4. Continued
16-18 0.00 ± 0.00 3.51 ± 0.38 25.23 ± 1.65 ND
18-20 0.00 ± 0.00 4.35 ± 0.26 25.93 ± 1.53 ND
20-22 0.00 ± 0.00 5.81 ± 0.70 23.47 ± 1.48 ND
22-24 0.00 ± 0.00 11.01 ± 0.76 25.70 ± 1.53 ND
24-26 0.00 ± 0.00 11.60 ± 1.01 26.20 ± 1.66 ND
Table B5. RFGC_17PC_A 7Be, 137Cs, 210Pb, and 210Pbxs Activities
Sample Interval
(cm)
7Be (Bq/kg) 137Cs (Bq/kg) 210Pb (Bq/kg) 210Pbxs (Bq/kg)
0-1 0.00 ± 0.00 0.00 ± 0.00 434.87 ± 26.05 410.27 ± 24.67
1-2 ND 0.00 ± 0.00 210.05 ± 10.50 185.45 ± 9.12
2-3 ND 0.00 ± 0.00 158.66 ± 7.88 134.06 ± 6.51
3-4 ND 0.00 ± 0.00 205.78 ± 13.38 181.18 ± 12.01
4-5 ND 0.00 ± 0.00 162.10 ± 7.70 137.50 ± 6.33
5-6 ND 0.00 ± 0.00 105.74 ± 4.81 81.14 ± 3.43
6-7 ND 0.00 ± 0.00 62.90 ± 4.07 38.30 ± 2.69
7-8 ND 0.00 ± 0.00 80.99 ± 3.82 56.39 ± 2.45
8-9 ND 3.07 ± 0.21 92.58 ± 6.02 67.98 ± 4.65
9-10 ND 1.95 ± 0.18 68.21 ± 3.83 43.61 ± 2.46
10-11 ND 3.22 ± 0.21 45.00 ± 3.09 20.40 ± 1.72
11-12 ND 2.62 ± 0.17 41.98 ± 2.72 17.38 ± 1.34
12-13 ND 3.94 ± 0.34 39.67 ± 2.28 15.07 ± 0.90
13-14 ND 5.09 ± 0.32 41.69 ± 2.78 17.09 ± 1.41
14-15 ND 5.12 ± 0.32 37.75 ± 2.48 13.15 ± 1.10
15-16 ND 3.48 ± 0.26 28.85 ± 1.84 4.25 ± 0.46
16-17 ND 4.32 ± 0.29 33.44 ± 1.88 8.84 ± 0.50
17-18 ND 3.84 ± 0.32 23.96 ± 1.43 ND
18-19 ND 3.15 ± 0.18 19.78 ± 1.16 ND
19-20 ND 4.03 ± 0.27 19.64 ± 1.26 ND
20-21 ND 5.82 ± 0.31 19.01 ± 1.19 ND
21-22 ND 5.16 ± 0.41 23.79 ± 1.57 ND
22-23 ND 5.64 ± 0.52 25.56 ± 1.68 ND
23-24 ND 7.11 ± 0.52 24.82 ± 1.47 ND
24-25 ND 7.81 ± 0.55 24.58 ± 1.51 ND
25-26 ND 10.17 ± 0.71 25.74 ± 1.65 1.14 ± 0.28
26-27 ND 7.16 ± 0.48 20.33 ± 1.29 ND
27-28 ND 8.85 ± 0.70 22.86 ± 1.38 ND
28-29 ND 8.75 ± 0.82 20.16 ± 1.25 ND
29-30 ND 14.00 ± 0.93 22.48 ± 1.38 ND

87
Table B5. Continued
30-31 ND 12.37 ± 0.79 23.59 ± 1.49 ND
31-32 ND 13.08 ± 0.88 24.15 ± 1.37 ND
32-33 ND 12.10 ± 0.82 25.17 ± 1.31 ND
33-34 ND 8.54 ± 0.58 24.32 ± 1.68 ND
34-35 ND 7.42 ± 0.65 25.45 ± 1.32 ND
35-36 ND 8.26 ± 0.62 24.42 ± 1.26 ND
36-37 ND 7.16 ± 0.38 27.18 ± 1.70 2.58 ± 0.33
37-38 ND 5.10 ± 0.42 30.92 ± 1.64 6.32 ± 0.27
38-39 ND 4.54 ± 0.31 31.06 ± 1.62 6.46 ± 0.24
39-40 ND 5.05 ± 0.32 29.08 ± 1.81 4.48 ± 0.43
40-41 ND 5.39 ± 0.32 33.41 ± 1.61 8.81 ± 0.24
41-42 ND 2.67 ± 0.20 32.40 ± 1.72 7.80 ± 0.34
42-43 ND 1.77 ± 0.14 30.45 ± 1.88 5.85 ± 0.51
43-44 ND 1.42 ± 0.13 28.00 ± 1.78 3.40 ± 0.41
44-45 ND 1.03 ± 0.09 28.21 ± 1.45 3.61 ± 0.08
45-46 ND ND 26.08 ± 1.52 1.48 ± 0.14
46-47 ND ND 24.64 ± 1.61 ND
47-48 ND ND 26.16 ± 1.27 1.56 ± 0.10
48-49 ND ND 23.57 ± 1.33 ND
49-50 ND ND 24.07 ± 1.52 ND
50-52 ND ND ND ND
52-54 ND ND ND ND
54-56 ND ND ND ND
56-58 ND ND ND ND
58-60 ND ND ND ND
60-62 ND ND ND ND
62-64 ND ND ND ND
64-66 ND ND ND ND
66-68 ND ND ND ND
68-70 ND ND ND ND
70-72 ND ND ND ND
72-74 ND ND ND ND
74-76 ND ND ND ND
76-78 ND ND ND ND
78-80 ND ND ND ND
80-82 ND ND ND ND
82-84 ND ND ND ND
84-86 ND ND ND ND
86-88 ND ND ND ND

88
Table B5. Continued
88-90 ND ND ND ND
90-92 ND ND ND ND
92-94 ND ND ND ND
94-96 ND ND ND ND
Table B6. RFGC_17PC_B 7Be, 137Cs, 210Pb, and 210Pbxs Activities
Sample Interval
(cm)
7Be
(Bq/kg)
137Cs (Bq/kg) 210Pb (Bq/kg) 210Pbxs (Bq/kg)
0-1 ND 0.00 ± 0.00 450.73 ± 21.10 427.02 ± 19.94
1-2 ND 0.00 ± 0.00 363.77 ± 16.73 340.06 ± 15.57
2-3 ND 0.00 ± 0.00 165.01 ± 7.24 141.30 ± 6.09
3-4 ND 0.00 ± 0.00 128.29 ± 5.87 104.58 ± 4.71
4-5 ND 0.00 ± 0.00 120.44 ± 4.41 96.73 ± 3.25
5-6 ND 0.00 ± 0.00 151.03 ± 6.12 127.31 ± 4.96
6-7 ND 0.00 ± 0.00 171.40 ± 7.24 147.68 ± 6.08
7-8 ND 0.00 ± 0.00 113.85 ± 4.15 90.14 ± 2.99
8-9 ND 0.00 ± 0.00 61.93 ± 2.60 38.22 ± 1.44
9-10 ND 0.00 ± 0.00 73.07 ± 2.75 49.36 ± 1.59
10-11 ND 0.00 ± 0.00 99.27 ± 6.44 75.56 ± 5.28
11-12 ND 1.95 ± 0.20 93.20 ± 6.49 69.49 ± 5.33
12-13 ND 4.85 ± 0.47 63.05 ± 3.18 39.33 ± 2.02
13-14 ND 6.49 ± 0.61 71.39 ± 4.37 47.68 ± 3.21
14-15 ND 6.98 ± 0.73 54.49 ± 2.86 30.78 ± 1.70
15-16 ND 6.17 ± 0.57 43.41 ± 1.98 19.70 ± 0.82
16-17 ND 5.43 ± 0.49 48.76 ± 2.85 25.05 ± 1.69
17-18 ND 3.41 ± 0.21 35.06 ± 2.25 11.35 ± 1.09
18-19 ND 4.17 ± 0.46 21.77 ± 1.26 ND
19-20 ND 4.90 ± 0.32 33.52 ± 2.16 9.8 ± 1.00
20-21 ND 5.47 ± 0.33 36.83 ± 2.28 13.12 ± 1.12
21-22 ND 5.93 ± 0.49 37.22 ± 1.97 13.50 ± 0.81
22-23 ND 4.72 ± 0.33 35.56 ± 1.98 11.85 ± 0.82
23-24 ND 7.13 ± 0.53 28.35 ± 1.78 4.64 ± 0.62
24-25 ND 8.15 ± 0.67 33.00 ± 2.16 9.29 ± 1.00
25-26 ND 8.20 ± 0.71 39.15 ± 2.63 15.43 ± 1.47
26-27 ND 7.62 ± 0.56 48.86 ± 3.27 25.15 ± 2.11
27-28 ND 9.28 ± 0.66 40.11 ± 2.61 16.39 ± 1.45
28-29 ND 9.80 ± 0.66 39.02 ± 2.41 15.31 ± 1.25
29-30 ND 17.38 ± 1.06 36.45 ± 2.20 12.74 ± 1.04
30-31 ND 15.25 ± 1.14 53.49 ± 3.37 29.78 ± 2.21

89
Table B6. Continued
31-32 ND 13.21 ± 0.95 42.65 ± 2.80 18.93 ± 1.64
32-33 ND 15.72 ± 1.05 45.91 ± 3.15 22.20 ± 1.99
33-34 ND 13.21 ± 0.88 45.82 ± 2.74 22.10 ± 1.58
34-35 ND 14.15 ± 1.00 41.03 ± 2.84 17.31 ± 1.68
35-36 ND 13.52 ± 1.11 55.77 ± 3.95 32.06 ± 2.79
36-37 ND 11.17 ± 0.88 44.58 ± 2.56 20.87 ± 1.40
37-38 ND 6.77 ± 0.49 45.31 ± 2.93 21.59 ± 1.77
38-39 ND 6.19 ± 0.45 45.43 ± 2.75 21.71 ± 1.59
39-40 ND 4.82 ± 0.38 37.56 ± 2.24 13.84 ± 1.09
40-41 ND 4.20 ± 0.38 48.39 ± 3.32 24.67 ± 2.16
41-42 ND 2.08 ± 0.15 43.50 ± 2.60 19.78 ± 1.44
42-43 ND 1.03 ± 0.08 43.79 ± 2.64 20.07 ± 1.48
43-44 ND 0.00 ± 0.00 45.02 ± 2.52 21.30 ± 1.36
44-45 ND 0.00 ± 0.00 49.07 ± 3.09 25.35 ± 1.93
45-46 ND 0.00 ± 0.00 48.20 ± 3.00 24.49 ± 1.84
46-47 ND 0.00 ± 0.00 47.57 ± 3.07 23.86 ± 1.91
47-48 ND ND 44.53 ± 2.86 20.82 ± 1.70
48-49 ND ND 47.17 ± 2.64 23.45 ± 1.48
49-50 ND ND 40.02 ± 2.50 16.30 ± 1.34
50-52 ND ND 34.84 ± 2.23 11.13 ± 1.07
52-54 ND ND 42.53 ± 2.77 18.82 ± 1.61
54-56 ND ND 41.42 ± 2.76 17.70 ± 1.60
56-58 ND ND 24.62 ± 1.56 0.90 ± 0.40
58-60 ND ND 30.78 ± 1.55 7.07 ± 0.39
60-62 ND ND 21.28 ± 1.34 ND
62-64 ND ND 18.62 ± 1.20 ND
64-66 ND ND 13.42 ± 0.99 ND
66-68 ND ND 22.51 ± 1.37 ND
68-70 ND ND 21.50 ± 1.42 ND
70-72 ND ND 24.93 ± 1.30 1.22 ± 0.14
72-74 ND ND 31.70 ± 1.36 7.99 ± 0.20
74-76 ND ND 36.87 ± 1.58 13.16 ± 0.42
76-78 ND ND 37.26 ± 1.61 13.55 ± 0.45
78-80 ND ND 34.63 ± 1.62 10.92 ± 0.46
80-82 ND ND 33.16 ± 1.44 9.45 ± 0.28
82-84 ND ND 23.92 ± 1.13 ND
84-86 ND ND 30.37 ± 1.21 6.66 ± 0.05
86-88 ND ND 23.70 ± 1.16 ND
88-90 ND ND 17.07 ± 1.11 ND

90
Table B6. Continued
90-92 ND ND ND ND
92-94 ND ND ND ND
94-96 ND ND ND ND
96-98 ND ND ND ND
Table B7. VFWB_17PC_A 7Be, 137Cs, 210Pb, and 210Pbxs Activities
Sample Interval (cm) 7Be
(Bq/kg)
137Cs (Bq/kg) 210Pb (Bq/kg) 210Pbxs (Bq/kg)
0-1 ND ND 55.41 ± 2.42 24.91 ± 0.84
1-2 ND ND 50.47 ± 2.80 19.97 ± 1.22
2-3 ND ND 28.48 ± 1.77 ND
3-4 ND ND 31.80 ± 1.89 1.29 ± 0.31
4-5 ND ND 30.35 ± 1.78 ND
5-6 ND ND 32.83 ± 1.93 2.33 ± 0.35
6-7 ND ND 27.42 ± 1.41 ND
7-8 ND ND 27.42 ± 1.32 ND
8-9 ND ND 25.31 ± 1.26 ND
9-10 ND ND 25.70 ± 1.36 ND
10-11 ND ND 28.52 ± 1.47 ND
11-12 ND ND 27.22 ± 1.76 ND
12-13 ND ND 26.52 ± 1.29 ND
13-14 ND ND 23.84 ± 1.54 ND
14-15 ND ND 27.23 ± 1.55 ND
15-16 ND ND 28.50 ± 1.79 ND
16-17 ND ND 26.98 ± 1.63 ND
17-18 ND ND 31.10 ± 1.91 ND
18-19 ND ND 28.76 ± 1.80 ND
19-20 ND ND 28.38 ± 1.67 ND
20-21 ND ND 29.38 ± 1.51 ND
21-22 ND ND 27.70 ± 1.66 ND
22-23 ND ND 27.62 ± 1.52 ND
23-24 ND ND 33.45 ± 2.08 ND
24-25 ND ND 27.67 ± 1.62 ND
25-26 ND ND 27.49 ± 1.52 ND
26-27 ND ND 30.08 ± 1.63 ND
27-28 ND ND 27.15 ± 1.45 ND
28-29 ND ND 23.29 ± 1.34 ND
29-30 ND ND 28.06 ± 1.29 ND
30-31 ND ND ND ND

91
Table B7. Continued
31-32 ND ND ND ND
32-33 ND ND ND ND
33-34 ND ND ND ND
34-35 ND ND 29.94 ± 1.62 ND
35-36 ND ND ND ND
36-37 ND ND ND ND
37-38 ND ND ND ND
38-39 ND ND ND ND
39-40 ND ND 29.85 ± 1.63 ND
40-41 ND ND ND ND
41-42 ND ND ND ND
42-43 ND ND ND ND
43-44 ND ND ND ND
44-45 ND ND 29.68 ± 1.45 ND
45-46 ND ND ND ND
46-47 ND ND ND ND
47-48 ND ND ND ND
48-49 ND ND ND ND
49-50 ND ND 31.97 ± 1.66 ND
50-52 ND ND ND ND
52-54 ND ND ND ND
54-56 ND ND ND ND
56-58 ND ND ND ND
58-60 ND ND ND ND
60-62 ND ND ND ND
62-64 ND ND ND ND
64-66 ND ND ND ND
66-68 ND ND ND ND
Table B8. SFMC_15 7Be, 137Cs, 210Pb, and 210Pbxs Activities
Sample Interval
(cm)
7Be (Bq/kg) 137Cs (Bq/kg) 210Pb (Bq/kg) 210Pbxs (Bq/kg)
0-2 7.49 ± 0.37 ND 43.83 ± 2.78 33.19 ± 2.14
2-4 0.00 ± 0.00 ND 18.44 ± 1.20 7.80 ± 0.56
4-6 0.00 ± 0.00 ND 21.94 ± 1.33 11.29 ± 0.69
6-8 0.00 ± 0.00 ND 20.98 ± 1.22 10.33 ± 0.58
8-10 0.00 ± 0.00 ND 19.83 ± 1.48 9.18 ± 0.84
10-12 0.00 ± 0.00 ND 24.87 ± 1.37 14.22 ± 0.73
12-14 0.00 ± 0.00 ND 18.32 ± 1.14 7.67 ± 0.49

92
Table B8. Continued
14-16 0.00 ± 0.00 ND 20.90 ± 1.25 10.25 ± 0.61
16-18 0.00 ± 0.00 ND 14.67 ± 1.10 4.03 ± 0.46
18-20 0.00 ± 0.00 ND ND ND
20-25 0.00 ± 0.00 ND 11.07 ± 0.71 ND
25-30 0.00 ± 0.00 ND ND ND
30-35 0.00 ± 0.00 ND 12.36 ± 0.71 ND
35-40 0.00 ± 0.00 ND 8.52 ± 0.50 ND
40-45 0.00 ± 0.00 ND ND ND
45-50 ND ND ND ND
Table B9. BM_07_16 7Be, 137Cs, 210Pb, and 210Pbxs Activities
Sample Interval (cm) 7Be
(Bq/kg)
137Cs (Bq/kg) 210Pb (Bq/kg) 210Pbxs (Bq/kg)
0-2 ND ND 6.65 ± 0.46 4.42 ± 0.14 2-4 ND ND 2.66 ± 0.25 ND
4-6 ND ND 2.42 ± 0.19 ND
6-8 ND ND 2.17 ± 0.20 ND
8-10 ND ND 1.73 ± 0.21 ND
10-12 ND ND 2.02 ± 0.26 ND
12-14 ND ND 1.98 ± 0.27 ND
14-16 ND ND 2.66 ± 0.32 ND
16-18 ND ND 2.25 ± 0.28 ND
18-20 ND ND 2.32 ± 0.28 ND
20-25 ND ND 2.20 ± 0.36 ND
25-30 ND ND 2.19 ± 0.28 ND
30-35 ND ND 1.84 ± 0.30 ND
35-40 ND ND 2.06 ± 0.33 ND
40-45 ND ND 2.78 ± 0.34 ND
45-50 ND ND 1.87 ± 0.29 ND

93
Appendix C. Stable Isotope and POC Values
Table C1. RFMS_17T d13C and POC
Sample Interval (cm) d13C
(‰)
Organic Carbon (%)
0-2 -27.75 2.68
2-4 -26.35 1.37
4-6 -26.16 0.98
6-8 -26.04 0.63
8-10 -25.95 0.55
10-12 -24.99 0.35
12-14 -25.62 0.58
14-16 -25.60 0.29
16-18 ND 0.15
18-20 -27.29 0.25
20-22 ND 0.17
22-24 -27.55 0.21
24-26 -27.42 0.22
26-28 -25.06 0.25
28-30 -26.44 0.32
30-32 -28.75 0.73
32-34 -27.39 0.23
34-36 ND 0.13
36-38 ND 0.18
38-40 -27.97 0.20
40-42 ND 0.16
42-44 ND 0.14
44-46 ND 0.12
46-48 ND 0.15
48-50 -27.72 0.33
Table C2. FCA_15 d13C and POC
Sample Interval (cm) d13C
(‰)
Organic Carbon (%)
0-2 -27.99 21.12
2-4 -27.64 4.95
4-6 -27.47 3.62
6-8 -27.12 2.39
8-10 -27.26 2.03
10-12 -27.31 1.72
12-14 -27.10 1.51

94
Table C2. Continued
14-16 -27.25 1.18
16-18 -27.07 1.03
18-20 -26.99 0.85
20-25 -26.90 0.90
25-30 -26.74 0.80
30-35 -26.13 0.60
35-40 -26.33 0.40
40-45 -26.09 0.40
45-50 -26.67 0.40
Table C3. RFFB_18T d13C and POC
Sample Interval (cm) d13C
(‰)
Organic Carbon (%)
0-2 -29.17 0.44
2-4 ND 0.18
4-6 ND 0.11
6-8 ND 0.16
8-10 ND 0.13
10-12 ND 0.11
12-14 ND 0.18
14-16 ND 0.18
16-18 ND 0.18
18-20 ND 0.12
20-22 ND 0.14
Table C4. RFGC_17T d13C and POC
Sample Interval (cm) d13C
(‰)
Organic Carbon (%)
0-2 -28.04 2.36
2-4 -27.12 1.81
4-6 -27.92 2.82
6-8 -27.13 1.98
8-10 -28.93 1.15
10-12 -28.11 0.30
12-14 -27.50 0.30
14-16 -28.38 0.20
16-18 ND 0.10
18-20 -26.84 0.22
20-22 -27.62 0.44
22-24 -27.32 0.37
24-26 -26.81 0.39

95
Table C5. RFGC_17PC_A d13C and POC
Sample Interval (cm) d13C
(‰)
Organic Carbon (%)
0-1 -31.00 10.10
1-2 -29.70 6.00
2-3 -28.70 4.20
3-4 -29.60 4.60
4-5 -29.30 5.00
5-6 -27.00 2.70
6-7 -25.80 2.90
7-8 -26.20 1.70
8-9 -27.40 1.80
9-10 -26.40 1.00
10-11 -27.90 0.70
11-12 -26.10 0.90
12-13 -26.50 1.10
13-14 -27.30 0.50
14-15 -28.30 0.50
15-16 -27.80 0.50
16-17 -27.60 0.50
17-18 -27.30 0.20
18-19 ND 0.17
19-20 -28.28 0.22
20-21 -27.40 0.30
21-22 -27.40 0.30
22-23 -27.30 0.30
23-24 -27.30 0.30
24-25 -27.50 0.30
25-26 -27.00 0.30
26-27 -26.90 0.30
27-28 -27.10 0.30
28-29 -27.10 0.20
29-30 -27.40 0.30
30-31 -26.60 0.40
31-32 -26.90 0.30
32-33 -27.10 0.30
33-34 -26.70 0.40
34-35 -27.30 0.30
35-36 -27.40 0.50
36-37 -27.70 0.30
37-38 -27.80 0.40
38-39 -27.10 0.40
39-40 -27.30 0.40

96
Table C5. Continued
40-41 -27.30 0.30
41-42 -27.70 0.80
42-43 -27.10 0.40
43-44 -26.80 0.70
44-45 -26.70 0.60
45-46 -26.10 0.50
46-47 -26.10 0.40
47-48 -25.80 0.40
48-49 -25.60 0.30
49-50 -25.50 0.30
50-52 -25.60 0.50
52-54 -26.40 0.30
54-56 -26.20 0.30
56-58 -26.00 0.30
58-60 ND ND
60-62 ND ND
62-64 ND ND
64-66 ND ND
66-68 ND ND
68-70 ND ND
70-72 ND ND
72-74 ND ND
74-76 ND ND
76-78 ND ND
78-80 ND ND
80-82 ND ND
82-84 ND ND
84-86 -25.90 0.30
86-88 ND ND
88-90 -27.00 0.30
90-92 ND ND
92-94 ND ND
94-96 ND ND

97
Table C6. RFGC_17PC_B d13C and POC
Sample Interval (cm) d13C
(‰)
Organic Carbon (%)
0-1 ND 26.80
1-2 ND 9.84
2-3 ND 11.23
3-4 ND 5.43
4-5 ND 5.69
5-6 ND 6.08
6-7 ND 8.65
7-8 ND 6.67
8-9 -24.85 2.92
9-10 -25.34 2.67
10-11 -25.77 2.65
11-12 -26.98 2.11
12-13 -28.19 0.69
13-14 -28.15 0.51
14-15 -28.51 0.50
15-16 -28.98 0.61
16-17 -28.60 0.41
17-18 -28.48 0.89
18-19 -28.11 0.47
19-20 -28.17 0.53
20-21 -27.70 0.55
21-22 -28.06 0.44
22-23 -26.72 0.66
23-24 -28.06 0.41
24-25 -27.82 0.41
25-26 -28.06 0.53
26-27 -27.64 0.43
27-28 -28.26 0.45
28-29 -28.08 0.55
29-30 -27.92 0.58
30-31 ND ND
31-32 ND ND
32-33 ND ND
33-34 ND ND
34-35 ND ND
35-36 ND ND
36-37 ND ND
37-38 ND ND
38-39 ND ND
39-40 ND ND

98
Table C6. Continued
40-41 ND ND
41-42 ND ND
42-43 ND ND
43-44 ND ND
44-45 ND ND
45-46 ND ND
46-47 ND ND
47-48 ND ND
48-49 ND ND
49-50 ND ND
50-52 ND ND
52-54 ND ND
54-56 ND ND
56-58 ND ND
58-60 ND ND
60-62 ND ND
62-64 ND ND
64-66 ND ND
66-68 ND ND
68-70 ND ND
70-72 ND ND
72-74 ND ND
74-76 ND ND
76-78 ND ND
78-80 ND ND
80-82 ND ND
82-84 ND ND
84-86 ND ND
86-88 ND ND
88-90 ND ND
90-92 ND ND
92-94 ND ND
94-96 ND ND
96-98 ND ND

99
Table C7. VFWB_17PC_A d13C and POC
Sample Interval (cm) d13C
(‰)
Organic Carbon (%)
0-1 -27.42 4.50
1-2 -27.77 4.00
2-3 -25.86 1.73
3-4 -26.33 1.35
4-5 -26.29 1.03
5-6 -26.04 0.91
6-7 -25.96 0.98
7-8 -25.57 0.97
8-9 -26.06 0.60
9-10 -25.95 0.64
10-11 -26.54 0.37
11-12 -26.19 0.65
12-13 -26.75 0.68
13-14 -25.57 1.03
14-15 -25.76 0.62
15-16 -25.99 1.15
16-17 -26.55 0.83
17-18 -26.52 0.77
18-19 -25.96 1.20
19-20 -25.58 0.81
20-21 -26.62 0.90
21-22 -26.38 1.02
22-23 -28.02 1.29
23-24 -26.36 0.73
24-25 -26.39 0.73
25-26 -26.11 0.68
26-27 -26.03 0.77
27-28 -26.21 0.60
28-29 -26.45 0.75
29-30 -26.43 0.84
30-31 -26.80 0.85
31-32 ND 0.15
32-33 -26.98 0.77
33-34 -26.35 0.56
34-35 -26.37 0.76
35-36 -26.22 0.85
36-37 -26.21 0.62
37-38 -25.86 0.91
38-39 -25.44 1.10
39-40 -26.35 0.90

100
Table C7. Continued
40-41 -25.93 1.48
41-42 -25.62 1.47
42-43 -26.00 0.98
43-44 -26.15 1.01
44-45 -26.10 0.93
45-46 -26.47 0.86
46-47 -26.59 0.79
47-48 -26.12 0.93
48-49 -26.08 0.84
49-50 -25.56 0.88
50-52 ND ND
52-54 ND ND
54-56 ND ND
56-58 ND ND
58-60 ND ND
60-62 ND ND
62-64 ND ND
64-66 ND ND
66-68 ND ND
Table C8. SFMC_15 d13C and POC
Sample Interval (cm) d13C
(‰)
Organic Carbon (%)
0-2 -26.87 3.11
2-4 -25.59 1.87
4-6 -25.56 1.93
6-8 -25.51 1.72
8-10 -26.05 2.59
10-12 -25.74 1.77
12-14 -25.55 2.33
14-16 -25.12 1.89
16-18 -24.99 2.38
18-20 -25.11 2.67
20-25 -25.11 2.82
25-30 -25.10 2.50
30-35 -25.02 2.00
35-40 -24.99 2.10
40-45 -25.15 2.60
45-50 ND ND

101
Table C9. BM_07_16 d13C and POC
Sample Interval (cm) d13C
(‰)
Organic Carbon (%)
0-2 -27.65 0.70
2-4 -26.69 0.30
4-6 -26.31 0.30
6-8 -26.75 0.30
8-10 -26.89 0.20
10-12 -27.10 0.20
12-14 -27.24 0.20
14-16 -25.75 0.30
16-18 -24.93 0.40
18-20 -26.26 0.20
20-25 -26.43 0.15
25-30 -26.80 0.30
30-35 -26.17 0.20
35-40 -25.86 0.30
40-45 -26.09 0.20
45-50 -26.49 0.20

102
Appendix D. Sediment Accumulation Rates
Table D1. RFMS_17T Accumulation Rates
Time (Yr.) SMARs (g cm-2yr-1) LARs (cm yr-1)
14.61 0.22 0.16
26.18 0.24 0.17
36.80 0.20 0.15
49.18 0.23 0.17
61.09 0.16 0.12
79.48 0.11 0.08
112.31 ND ND
Table D2. FCA_15 Accumulation Rates
Time (yr.) SMARs (g cm-2yr-1) LARs (cm yr-1)
15.48 0.19 ND
25.39 0.33 ND
36.94 0.29 ND
45.46 0.39 ND
51.50 0.56 ND
59.50 0.42 ND
63.37 0.89 ND
81.62 0.19 ND
97.91 0.22 ND
101.69 2.39 ND
120.18 0.50 ND
Table D3. RFFB_18T Accumulation Rates
Time (yr.) SMARs (g cm-2yr-1) LARs (cm yr-1)
ND ND ND
ND ND ND
ND ND ND
ND ND ND
ND ND ND
ND ND ND
ND ND ND
ND ND ND
ND ND ND
ND ND ND

103
Table D4. RFGC_17T Accumulation Rates
Time (yr.) SMARs (g cm-2yr-1) LARs (cm yr-1)
5.10 0.27 0.24
14.25 0.15 0.14
29.66 0.10 0.09
49.97 0.05 0.04
95.79 ND ND
Table D5. RFGC_17PC_A Accumulation Rates
Time (yr.) SMARs (g cm-2yr-1) LARs (cm yr-1)
5.50 0.15 0.15
8.35 0.18 0.19
12.23 0.11 0.12
18.35 0.13 0.13
23.72 0.18 0.19
27.39 0.35 0.36
30.42 0.21 0.22
35.48 0.14 0.15
43.29 0.18 0.18
49.54 0.32 0.33
54.03 0.32 0.34
58.43 0.33 0.34
63.04 0.24 0.25
69.23 0.26 0.27
75.40 0.71 0.74
77.68 0.30 0.31
85.429 0.336 0.35
89.743 0.285 0.30
94.738 0.357 0.37
98.721 0.15 0.15
108.533 0.12 0.12
Table D6. RFGC_17PC_B Accumulation Rates
Time (yr.) SMARs (g cm-2yr-1) LARs (cm yr-1)
2.60 0.23 0.17
7.67 0.49 0.38
8.66 0.64 0.50
9.85 0.67 0.51
11.47 0.48 0.37
13.79 0.37 0.29

104
Table D6. Continued
17.56 0.55 0.43
20.26 1.23 0.94
21.58 0.91 0.70
23.39 0.55 0.42
26.34 0.55 0.42
29.20 0.90 0.69
30.86 0.70 0.54
32.99 1.03 0.79
34.39 1.55 1.19
35.32 1.18 0.91
36.45 2.54 1.95
36.93 ND ND
36.93 2.90 2.22
37.41 2.13 1.63
38.07 2.02 1.55
38.76 2.26 1.73
39.42 5.69 4.37
39.68 2.80 2.15
40.24 1.65 1.27
41.21 0.97 0.75
42.76 1.43 1.10
43.85 1.48 1.14
44.93 1.73 1.33
45.88 0.70 0.54
48.03 1.05 0.80
49.56 0.84 0.65
51.68 0.79 0.61
53.80 0.95 0.73
55.58 0.48 0.37
58.93 0.67 0.51
61.46 0.59 0.46
64.25 0.54 0.41
67.35 0.78 0.60
69.51 0.39 0.30
73.91 0.43 0.33
77.82 0.38 0.29
82.19 0.30 0.23
87.51 0.21 0.16
95.94 0.16 0.12
106.59 ND ND

105
Table D7. VFWB_17PC_A Accumulation Rates
Time (yr.) SMARs (g cm-2yr-1) LARs (cm yr-1)
21.30 0.02 0.01
70.59 ND ND
70.59 0.11 0.07
85.02 ND ND
85.02 ND ND
Table D9. SFMC_15 Accumulation Rates
Time (yr.) SMARs (g cm-2yr-1) LARs (cm yr-1)
9.99 0.86 ND
13.38 0.66 ND
19.03 0.62 ND
25.29 ND ND
31.79 0.45 ND
45.43 0.52 ND
56.55 0.38 ND
82.53 0.53 ND
103.67 ND ND
Table D9. BM_07_16 Accumulation Rates
Time (yr.) SMARs (gcm-2yr-1) LARs (cm yr-1)
ND ND ND
ND ND ND
ND ND ND
ND ND ND
ND ND ND
ND ND ND
ND ND ND
ND ND ND
ND ND ND
ND ND ND
ND ND ND
ND ND ND
ND ND ND
ND ND ND
ND ND ND

106
Appen
dix
E. F
ull C
ore an
d T
rench
Pro
files

107

108

109

110

111

112

113

114

115
REFERENCES
Ab Razak, I. A., Li, A., Christensen, E. R. (1996). Association of PAHs, PCBs, 137Cs,
and 210Pb with clay, silt, and organic carbon in sediments. Water Science and
Technology, 34(7-8), 29-35.
Adams, M. B. (2017). The forestry reclamation approach: Guide to successful
reforestation of mined lands. Gen. Tech. Rep. NRS-169. Newtown Square, PA: U.S.
Department of Agriculture, Forest Service, Northern Research Station: Volume 169, 128.
Al Hamarneh, I., Wreikat, A., Toukan, K. (2003). Radioactivity concentrations of 40K, 134Cs, 137Cs, 90Sr, 241Am, 238Pu and 239,240Pu radionuclides in Jordanian soil samples. J. of
Environmental Radioactivity, 67(1), 53-67.
Angel, P. N., Burger, J. A., Davis, V. M., Barton, C. D., Bower, M., Eggerud, S. D.,
Rothman, P. (2009). The forestry reclamation approach and the measure of its success in
Appalachia. In 26th Annual National Conference of the American Society of Mining and
Reclamation, Lexington, KY (pp. 18-36).
Angel, P. N., Graves, D. H., Barton, C., Warner, R. C., Conrad, P. W., Sweigard, R. J.,
Agouridis, C. (2006). Surface mine reforestation research: Evaluation of tree response to
low compaction reclamation techniques. In Proceedings, American Society of Mining and
Reclamation (pp. 45-58).
Arthur, M. A., Coltharp, G. B., Brown, D. L. (2007). Effects of best management
practices on forest stream water quality in eastern Kentucky 1. JAWRA J. of the American
Water Resources Association, 34(3), 481-495.
Arvidsson, J. (1999). Nutrient uptake and growth of barley as affected by soil
compaction. Plant and Soil, 208(1), 9-19.
Baskaran, M. (Ed.). (2011). Handbook of Environmental Isotope Geochemistry. Springer
Science and Business Media. pp 305-331.
Baskaran, M., Coleman, C. H., Santschi, P. H. (1993). Atmospheric depositional fluxes
of 7Be and 210Pb at Galveston and College Station, Texas. J. of Geophysical Research:
Atmospheres, 98(D11), 20,555-20,571.
Bauman, J. M., Cochran, C., Chapman, J., Gilland, K. (2015). Plant community
development following restoration treatments on a legacy reclaimed mine site. Ecological
Engineering, 83, 521-528.
Benmansour, M., Nouira, A., Benkdad, A., MAJAH, M., Bouksirat, H., Oumri, M.,
Mossadek, R., Duchemin, M. (2011). Estimates of long- and short-term soil erosion rates
on farmland in semi-arid West Morocco using caesium-137, excess lead-210 and

116
beryllium-7 measurements. Impact of Soil Conservation Measures on Erosion Control
and Soil
Quality, IAEA-TECDOC-1665, IAEA, Vienna, 159-174.
Bernhardt, E. S., Palmer, M. A. (2011). The environmental costs of mountaintop mining
valley fill operations for aquatic ecosystems of the Central Appalachians. Annals of the
New York Academy of Sciences, 1223(1), 39-57.
Bernhardt, E. S., Lutz, B. D., King, R. S., Fay, J. P., Carter, C. E., Helton, A., Campagna,
D., Amos, J. (2012). How many mountains can we mine? Assessing the regional
degradation of central Appalachian rivers by surface coal mining. Environmental Science
and Technology, 46(15), 8,115-8,122.
Bernoux, M., Cerri, C. C., Neill, C., de Moraes, J. F. (1998). The use of stable carbon
isotopes for estimating soil organic matter turnover rates. Geoderma, 82(1-3), 43-58.
Beschta, R. L. (1978). Long‐term patterns of sediment production following road
construction and logging in the Oregon Coast Range. Water Resources Research, 14(6),
1011-1016.
Black, D., McKinnish, T., Sanders, S. (2005a). The economic impact of the coal boom
and bust. The Economic Journal, 115(503), 449-476.
Black, D. A., McKinnish, T. G., Sanders, S. G. (2005b). Tight labor markets and the
demand for education: Evidence from the coal boom and bust. ILR Review, 59(1), 3-16.
Boccardy, J. A., Spaulding Jr, W. M. (1968). Effects of surface mining on fish and
wildlife in Appalachia (No. 65). U.S. Fish and Wildlife Service.
Bohrer, S. L., Limb, R. F., Daigh, A. L. M., Volk, J. M. (2017). Below ground attributes
on reclaimed surface mine lands over a 40-year chronosequence. Land Degradation and
Development, 28(7), 2,290-2,297.
Bonta, J. V. (2000). Impact of coal surface mining and reclamation on suspended
sediment in three Ohio watersheds. JAWRA Journal of the American Water Resources
Association, 36(4), 869-887.
Bovis, M. J., Millard, T. H., Oden, M. E. (1998). Gully processes in coastal British
Columbia: the role of woody debris. In Carnation Creek and Queen Charlotte Islands
Fish/Forestry Workshop: Applying (Vol. 20, pp. 49-76).
Bradshaw, A. D., Chadwick, M. J. (1980). The restoration of land: The ecology and
reclamation of derelict and degraded land. University of California Press.

117
Brais, S., Camiré, C., Paré, D. (1995). Impacts of whole-tree harvesting and winter
windrowing on soil pH and base status of clayey sites of northwestern Quebec. Canadian
J. of Forest Research, 25(6), 997-1,007.
Brown, G. W., Krygier, J. T. (1971). Clear‐cut logging and sediment production in the
Oregon Coast Range. Water Resources Research, 7(5), 1189-1198.
Burger, J. A. (2011). Sustainable mined land reclamation in the eastern U.S. coalfields: A
case for an ecosystem reclamation approach. In Proceedings of the National Meeting of
the American Society of Mining and Reclamation, Bismark, ND, USA (Vol. 15, pp. 113-
141).
Burger, J. A., Zipper, C. E. (2002). How to restore forests on surface-mined land.
Publication 460-123. Virginia Cooperative Extension, Virginia Polytechnic Institute and
State University.
Cavender, N., Byrd, S., Bechtoldt, C. L., Bauman, J. M. (2014). Vegetation communities
of a coal reclamation site in southeastern Ohio. Northeastern Naturalist, 21(1), 31-46.
Clark, E. V., Zipper, C. E. (2016). Vegetation influences near-surface hydrological
characteristics on a surface coal mine in eastern USA. Catena, 139, 241-249.
Compton, J. E., Hooker, T. D., Perakis, S. S. (2007). Ecosystem N distribution and δ15N
during a century of forest regrowth after agricultural abandonment. Ecosystems, 10(7),
1,197-1,208.
Crowther, T. W., Maynard, D. S., Leff, J. W., Oldfield, E. E., McCulley, R. L., Fierer, N.,
Bradford, M. A. (2014). Predicting the responsiveness of soil biodiversity to
deforestation: A cross‐biome study. Global Change Biology, 20(9), 2,983-2,994.
Curtis, J. B. (2002). Fractured shale-gas systems. AAPG bulletin, 86(11), 1921-1938.
Dawson, T. E., Mambelli, S., Plamboeck, A. H., Templer, P. H., Tu, K. P. (2002). Stable
isotopes in plant ecology. Annual Review of Ecology and Systematics, 33(1), 507-559.
Eble, C. F., Hower, J. C. (1997). Coal quality trends and distribution of potentially
hazardous trace elements in Eastern Kentucky coals. Fuel, 76(8), 711-715.
Feng, Y., Wang, J., Bai, Z., Reading, L. (2019). Effects of surface coal mining and land
reclamation on soil properties: A review. Earth-Science Reviews.
Ferrari, J. R., Lookingbill, T. R., McCormick, B., Townsend, P. A., Eshleman, K. N.
(2009). Surface mining and reclamation effects on flood response of watersheds in the
central Appalachian Plateau region. Water Resources Research, 45(4), W04407,
doi:10.1029/ 2008WR007109.

118
Foil, R. R., Ralston, C. W. (1967). The establishment and growth of Loblolly Pine
seedlings on compacted soils 1. Soil Science Society of America J., 31(4), 565-568.
Fornara, D. A., Tilman, D. (2008). Plant functional composition influences rates of soil
carbon and nitrogen accumulation. J. of Ecology, 96(2), 314-322.
Fox, J. F. (2009). Identification of sediment sources in forested watersheds with surface
coal mining disturbance using Carbon and Nitrogen isotopes 1. JAWRA J. of the
American Water Resources Association, 45(5), 1,273-1,289.
Foufoula‐Georgiou, E., Ganti, V., & Dietrich, W. E. (2010). A nonlocal theory of
sediment transport on hillslopes. J. of Geophysical Research: Earth Surface, 115(F2).
Fritz, K. M., Fulton, S., Johnson, B. R., Barton, C. D., Jack, J. D., Word, D. A., Burke, R.
A. (2010). Structural and functional characteristics of natural and constructed channels
draining a reclaimed mountaintop removal and valley fill coal mine. J. of the North
American Benthological Society, 29(2), 673-689.
Goldberg, E. F., Power, G. (1972). Legal problems of coal mine reclamation: A study in
Maryland, Ohio, Pennsylvania, and West Virginia. College Park, MD.
Gomez, A., Powers, R. F., Singer, M. J., Horwath, W. R. (2002). Soil compaction effects
on growth of young ponderosa pine following litter removal in California's Sierra
Nevada. Soil Science Society of America J., 66(4), 1,334-1,343.
Gough, D. B. (2013). The value of the commonwealth: An ecocritical history of Robinson
Forest. Ph.D. Dissertation, The University of Iowa.
Greacen, E. L., Sands, R. (1980). Compaction of forest soils. A review. Soil
Research, 18(2), 163-189.
Groninger, J., Skousen, J., Angel, P., Barton, C., Burger, J., Zipper, C. (2007). Mine
reclamation practices to enhance forest development through natural succession. In:
Adams, Mary Beth, ed. The Forestry Reclamation Approach: Guide to Successful
Reforestation of Mined Lands. Gen. Tech. Rep. NRS-169. Newtown Square, PA: U.S.
Department of Agriculture, Forest Service, Northern Research Station: 1-7.
Haering, K. C., Daniels, W. L., Galbraith, J. M. (2004). Appalachian mine soil
morphology and properties. Soil Science Society of America J., 68(4), 1,315-1,325.
Hamlett, J. M., Melvin, S. W., Horton, R. (1990). Traffic and soil amendment effects on
infiltration and compaction. Transactions of the ASAE, 33(3), 821-826.
Hamza, M. A., Anderson, W. K. (2005). Soil compaction in cropping systems: A review
of the nature, causes and possible solutions. Soil and Tillage Research, 82(2), 121-145.

119
Harrison, L. H., Klotter, J. C. (2009). A new history of Kentucky. University Press of
Kentucky.
Hatten, J. A., Segura, C., Bladon, K. D., Hale, V. C., Ice, G. G., Stednick, J. D. (2018).
Effects of contemporary forest harvesting on suspended sediment in the Oregon Coast
Range: Alsea Watershed Study Revisited. Forest Ecology and Management, 408, 238-
248.
He, Q., Walling, D. E. (1996). Interpreting particle size effects in the adsorption of 137Cs
and unsupported 210Pb by mineral soils and sediments. J. of Environmental
Radioactivity, 30(2), 117-137.
Hillier, S. (2001). Particulate composition and origin of suspended sediment in the R.
Don, Aberdeenshire, UK. Science of the Total Environment, 265(1-3), 281-293.
Hobbie, E. A., Werner, R. A. (2004). Intramolecular, compound‐specific, and bulk
carbon isotope patterns in C3 and C4 plants: A review and synthesis. New
Phytologist, 161(2), 371-385.
Holl, K. D. (2002). Long-term vegetation recovery on reclaimed coal surface mines in the
eastern USA. J. Applied Ecology, 39(6), 960-970.
Holl, K. D., Cairns Jr, J. (1994). Vegetational community development on reclaimed coal
surface mines in Virginia. Bulletin of the Torrey Botanical Club, 327-337.
Huang, J., Lacey, S. T., Ryan, P. J. (1996). Impact of forest harvesting on the hydraulic
properties of surface soil. Soil Science, 161(2), 79-86.
Huffman, G. P., Mitra, S., Huggins, F. E., Shah, N., Vaidya, S., Lu, F. (1991).
Quantitative analysis of all major forms of sulfur in coal by X-ray absorption fine
structure spectroscopy. Energy and Fuels, 5(4), 574-581.
Hunter, C. D., Young, D. M. (1953). Relationship of natural gas occurrence and
production in eastern Kentucky (Big Sandy gas field) to joints and fractures in Devonian
bituminous shale. AAPG Bulletin, 37(2), 282-299.
Jaeger, K. L. (2015). Reach-scale geomorphic differences between headwater streams
draining mountaintop mined and unmined catchments. Geomorphology, 236, 25-33.
Jobbágy, E. G., Jackson, R. B. (2000). The vertical distribution of soil organic carbon and
its relation to climate and vegetation. Ecological applications, 10(2), 423-436.
Kalisz, P. J., Dotson, D. B. (1989). Land-use history and the occurrence of exotic
earthworms in the mountains of eastern Kentucky. American Midland Naturalist, 122(2),
288-297.

120
Kohn, M. J. (2010). Carbon isotope compositions of terrestrial C3 plants as indicators of
(paleo) ecology and (paleo) climate. Proceedings of the National Academy of
Sciences, 107(46), 19,691-19,695.
Krishnaswami, S., Benninger, L. K., Aller, R. C., Von Damm, K. L. (1980).
Atmospherically-derived radionuclides as tracers of sediment mixing and accumulation
in near-shore marine and lake sediments: Evidence from 7Be, 210Pb, and 239,240Pu. Earth
and Planetary Science Letters, 47(3), 307-318.
Kochenderfer, J. N. (1970). Erosion control on logging roads in the Appalachians. Res.
Pap. NE-158. Upper Darby, PA: US Department of Agriculture, Forest Service,
Northeastern Forest Experiment Station. 28 p., 158.
Koestner, K. A., Carroll, M. D., Neary, D. G., Koestner, P. E., Youberg, A. (2011).
Depositional characteristics and sediment availability resulting from the post-Schultz Fire
floods of 2010. 24th Annual Symposium of the Arizona Hydrological Society; Watersheds
Near and Far: Response to Changes in Climate and Landscape; September 18-20, 2010;
Flagstaff, AZ. 5 p.
Kozlowski, T. T. (1999). Soil compaction and growth of woody plants. Scandinavian J.
of Forest Research, 14(6), 596-619.
Larsen, R. J. (1984). Worldwide deposition of 90 Sr through 1982 (No. EML--430).
Department of Energy.
Lima, A. T., Mitchell, K., O’Connell, D. W., Verhoeven, J., Van Cappellen, P. (2016).
The legacy of surface mining: Remediation, restoration, reclamation and rehabilitation.
Environmental Science and Policy, 66, 227-233.
Lubis, A. A. (2013). Constant rate of supply (CRS) model for determining the sediment
accumulation rates in the coastal area using 210Pb. J. of Coastal Development, 10(1), 9-
18.
Mabit, L., Benmansour, M., Walling, D. E. (2008). Comparative advantages and
limitations of the fallout radionuclides 137Cs, 210Pbex and 7Be for assessing soil erosion
and sedimentation. J. of Environmental Radioactivity, 99(12), 1,799-1,807.
Maharaj, S., Barton, C. D., Karathanasis, T. A., Rowe, H. D., Rimmer, S. M. (2007).
Distinguishing" new" from" old" organic carbon in reclaimed coal mine sites using
thermogravimetry: II. Field validation. Soil science, 172(4), 302-312.
Mangena, S. J., Brent, A. C. (2006). Application of a life cycle impact assessment
framework to evaluate and compare environmental performances with economic values
of supplied coal products. Journal of Cleaner Production, 14(12-13), 1,071-1,084.

121
Martin, C. W. (1988). Soil disturbance by logging in New England, review and
management recommendations. Northern J. of Applied Forestry, 5(1), 30-34.
Martin, C. W., Hornbeck, J. W. (1994). Logging in New England need not cause
sedimentation of streams. Northern J. of Applied Forestry, 11(1), 17-23.
Martin, L. L. (2006). Effects of Forest and Grass Vegetation on Fluviokarst Hillslope
Hydrology. Bowman's Bend, Kentucky (Ph.D. dissertation) University of Kentucky,
Lexington (Available at: http://uknowledge.uky. edu/gradschool_diss/362/).
Matisoff, G., Bonniwell, E. C., Whiting, P. J. (2002). Soil erosion and sediment sources
in an Ohio watershed using beryllium-7, cesium-137, and lead-210. J. of Environmental
Quality, 31(1), 54-61.
Megahan, W. F., & Kidd, W. J. (1972). Effects of logging and logging roads on erosion
and sediment deposition from steep terrain. Journal of Forestry, 70(3), 136-141.
McCashion, J. D., & Rice, R. M. (1983). Erosion on logging roads in northwestern
California: How much is avoidable?. Journal of Forestry, 81(1), 23-26.
Meier, A. J., Bratton, S. P., Duffy, D. C. (1995). Possible ecological mechanisms for loss
of vernal-herb diversity in logged eastern deciduous forests. Ecological Applications,
5(4), 935-946.
Mensah, A. K. (2015). Role of revegetation in restoring fertility of degraded mined soils
in Ghana: A review. International J. of Biodiversity and Conservation, 7(2), 57-80.
Milici, R. C. (2000). Depletion of Appalachian coal reserves—how soon? International
Journal of Coal Geology, 44(3-4), 251-266.
Miura, T., Hayano, K., Nakayama, K. (1999). Determination of 210Pb and 210Po in
environmental samples by alpha ray spectrometry using an extraction chromatographic
resin. Analytical Sciences, 15(1), 23-28.
Moehring, D. M., Rawls, I. W. (1970). Detrimental effects of wet weather logging. J. of
Forestry, 68(3), 166-167.
Narita, H., Harada, K., Burnett, W. C., Tsunogai, S., McCabe, W. J. (1989).
Determination of 210Pb, 210Bi and 210Po in natural waters and other materials by
electrochemical separation. Talanta, 36(9), 925-929.
O'Leary, M. H. (1988). Carbon isotopes in photosynthesis. Bioscience, 38(5), 328-336.
O’loughlin, C. L., Pearce, A. J. (1976). Influence of Cenozoic geology on mass
movement and sediment yield response to forest removal, North Westland, New
Zealand. Bulletin of the International Association of Engineering Geology 13(1), 41-46.

122
O'Loughlin, C. L., Rowe, L. K., Pearce, A. J. (1980). Sediment yield and water quality
responses to clear felling of evergreen mixed forests in western New Zealand. IAHS-
AISH Publication (IAHS). no. 130.
O'Loughlin, C. L., Rowe, L. K., Pearce, A. J. (1982). Exceptional storm influences on
slope erosion and sediment yield in small forest catchments, North Westland, New
Zealand. Institution of Engineers, Australia.
Palmer, M. A., Bernhardt, E. S., Schlesinger, W. H., Eshleman, K. N., Foufoula-
Georgiou, E., Hendryx, M., Lemly, A., Likens, G., Loucks, O., Power, M., White, P.,
Wilcock, P. (2010). Mountaintop mining consequences. Science, 327(5962), 148-149.
Persson, B. R., Holm, E. (2011). Polonium-210 and lead-210 in the terrestrial
environment: A historical review. J. of Environmental Radioactivity, 102(5), 420-429.
Peterson, B. J., Fry, B. (1987). Stable isotopes in ecosystem studies. Annual Review of
Ecology and Systematics, 18(1), 293-320.
Phillips, J. D. (2004). Impacts of surface mine valley fills on headwater floods in eastern
Kentucky. Environmental Geology, 45(3), 367-380.
Phillips, D. L., Gregg, J. W. (2001). Uncertainty in source partitioning using stable
isotopes. Oecologia, 127(2), 171-179.
Plouffe, A., Hall, G. E., Pelchat, P. (2001). Leaching of loosely bound elements during
wet grain size separation with sodium hexametaphosphate: Implications for selective
extraction analysis. Geochemistry: Exploration, Environment, Analysis, 1(2), 157-162.
Poet, S. E., Moore, H. E., Martell, E. A. (1972). Lead 210, bismuth 210, and polonium
210 in the atmosphere: Accurate ratio measurement and application to aerosol residence
time determination. J. of Geophysical Research, 77(33), 6,515-6,527.
Pond, G. J. (2010). Patterns of Ephemeroptera taxa loss in Appalachian headwater
streams (Kentucky, USA). Hydrobiologia, 641(1), 185-201.
Pond, G. J., Passmore, M. E., Pointon, N. D., Felbinger, J. K., Walker, C. A., Krock, K.
J., Fulton, J. B., Nash, W. L. (2014). Long-term impacts on macroinvertebrates
downstream of reclaimed mountaintop mining valley fills in central
Appalachia. Environmental Management, 54(4), 919-933.
Price, P., Wright, I. A. (2016). Water quality impact from the discharge of coal mine
wastes to receiving streams: Comparison of impacts from an active mine with a closed
mine. Water, Air, and Soil Pollution, 227(5), 155
.
Price, S. J., Muncy, B. L., Bonner, S. J., Drayer, A. N., Barton, C. D. (2016). Effects of

123
mountaintop removal mining and valley filling on the occupancy and abundance of
stream salamanders. J. of Applied Ecology, 53(2), 459-468.
Ramani, R. V. (2012). Surface mining technology: progress and prospects. Procedia
Engineering, 46, 9-21.
Rani, L. M., Jeevanram, R. K., Kannan, V., Govindaraju, M. (2014). Estimation of
Polonium-210 activity in marine and terrestrial samples and computation of ingestion
dose to the public in and around Kanyakumari coast, India. J. of Radiation Research and
Applied Sciences, 7(2), 207-213.
Reisinger, T. W., Simmons, G. L., Pope, P. E. (1988). The impact of timber harvesting on
soil properties and seedling growth in the south. Southern J. of Applied Forestry, 12(1),
58-67.
Rice, D. L. (1986). Early diagenesis in bioadvective sediments: Relationships between
the diagenesis of beryllium-7, sediment reworking rates, and the abundance of conveyor-
belt deposit-feeders. J. of Marine Research, 44(1), 149-184.
Rice, R. M., Tilley, F. B., Datzman, P. A. (1979). A watershed's response to logging and
roads: South Fork of Caspar Creek, California, 1967-1976. Res. Paper PSW-RP-146.
Berkeley, CA: US Department of Agriculture, Forest Service, Pacific Southwest Forest
and Range Experiment Station. 12 p, 146.
Ritchie, J. C., McHenry, J. R. (1990). Application of radioactive fallout cesium-137 for
measuring soil erosion and sediment accumulation rates and patterns: A review. J. of
Environmental Quality, 19(2), 215-233.
Robinson, R. A., Slingerland, R. L. (1998). Origin of fluvial grain-size trends in a
foreland basin: The Pocono Formation on the central Appalachian basin. J. of
Sedimentary Research, 68(3), 473-486.
Ryan, M., Meiman, J. (1996). An examination of short‐term variations in water quality at
a karst spring in Kentucky. Groundwater, 34(1), 23-30.
Santschi, P. H., Guo, L., Walsh, I. D., Quigley, M. S., Baskaran, M. (1999). Boundary
exchange and scavenging of radionuclides in continental margin waters of the Middle
Atlantic Bight: Implications for organic carbon fluxes. Continental Shelf Research, 19(5),
609-636.
Santschi, P. H., Allison, M. A., Asbill, S., Perlet, A. B., Cappellino, S., Dobbs, C.,
McShea, L. (1999). Sediment transport and Hg recovery in Lavaca Bay, as evaluated
from radionuclide and Hg distributions. Environmental Science and Technology, 33(3),
378-391.

124
Schuler, R., Lowery, B., Wolkowski, R., Bundy, L. (1986). Soil Compaction: Causes,
Concerns, and Cures. University of Wisconsin-Extension Report A3367.
Schuler, T. M., Gillespie, A. R. (2000). Temporal patterns of woody species diversity in a
central Appalachian forest from 1856 to 1997. J. of the Torrey Botanical Society, 127(2),
149-161.
Sharma, P., Gardner, L. R., Moore, W. S., Bollinger, M. S. (1987). Sedimentation and
bioturbation in a salt marsh as revealed by 210Pb, 137Cs, and 7Be studies. Limnology and
Oceanography, 32(2), 313-326.
Shaw III, C. G., Sidle, R. C., Harris, A. S. (1987). Evaluation of planting sites common to
a southeast Alaska clear-cut. III. Effects of microsite type and ectomycorrhizal
inoculation on growth and survival of Sitka spruce seedlings. Canadian J. of Forest
Research, 17(4), 334-339.
Sheoran, V., Sheoran, A. S., Poonia, P. (2010). Soil reclamation of abandoned mine land
by revegetation: A review. International J. of Soil, Sediment and Water, 3(2), art. 13.
Simmons, J. A., Currie, W. S., Eshleman, K. N., Kuers, K., Monteleone, S., Negley, T.
L., Pohlad, B.R, Thomas, C. L. (2008). Forest to reclaimed mine land use change leads to
altered ecosystem structure and function. Ecological Applications, 18(1), 104-118.
Stevenson, B. A., Kelly, E. F., McDonald, E. V., Busacca, A. J. (2005). The stable carbon
isotope composition of soil organic carbon and pedogenic carbonates along a bioclimatic
gradient in the Palouse region, Washington State, USA. Geoderma, 124(1-2), 37-47.
Swab, R. M., Lorenz, N., Byrd, S., Dick, R. (2017). Native vegetation in reclamation:
Improving habitat and ecosystem function through using prairie species in mine land
reclamation. Ecological Engineering, 108, 525-536.
Swer, S., Singh, O. P. (2004). Status of water quality in coal mining areas of Meghalaya,
India. In Proceedings of the national seminar on environmental engineering with special
emphasis on mining environment (pp. 19-20). NSEEME-2004.
Tiwary, R. K. (2001). Environmental impact of coal mining on water regime and its
management. Water, Air, and Soil Pollution, 132(1-2), 185-199.
Turekian, K. K., Nozaki, Y., Benninger, L. K. (1977). Geochemistry of atmospheric
radon and radon products. Annual Review of Earth and Planetary Sciences, 5(1), 227-
255.
Updegraff, K., Pastor, J., Bridgham, S. D., Johnston, C. A. (1995). Environmental and
substrate controls over carbon and nitrogen mineralization in northern
wetlands. Ecological Applications, 5(1), 151-163.

125
Ussiri, D. A., Lal, R. (2005). Carbon sequestration in reclaimed minesoils. Critical
Reviews in Plant Sciences, 24(3), 151-165.
Ussiri, D. A., Lal, R., Jacinthe, P. A. (2006). Post-reclamation land use effects
onproperties and carbon sequestration in minesoils of southeastern Ohio. Soil
Science, 171(3), 261-271.
Vaaramaa, K., Aro, L., Solatie, D., Lehto, J. (2010). Distribution of 210Pb and 210Po in
boreal forest soil. Science of the Total Environment, 408(24), 6,165-6,171.
Vesterbacka, P., Ikäheimonen, T. K. (2005). Optimization of 210Pb determination via
spontaneous deposition of 210Po on a silver disk. Analytica Chimica Acta, 545(2), 252-
261.
Walling, D. E. (1998). Use of 137 Cs and other fallout radionuclide in soil erosion
investigations: progress, problems and prospects (No. IAEA-TECDOC--1028).
Walling, D. E., Zhang, Y., He, Q. (2011). Models for deriving estimates of erosion and
deposition rates from fallout radionuclide (caesium-137, excess lead-210, and beryllium-
7) measurements and the development of user-friendly software for model
implementation. Impact of soil conservation measures on erosion control and soil
quality. IAEA-TECDOC-1665, 11-33.
Wan, G. J., Chen, J. A., Wu, F. C., Xu, S. Q., Bai, Z. G., Wan, E. Y. Wang, C. S., Huang,
R. G., Yeager, K. M. Santschi, P. H. (2005). Coupling between 210Pbex and organic matter
in sediments of a nutrient-enriched lake: An example from Lake Chenghai,
China. Chemical Geology, 224(4), 223-236.
Wang, J., LeDoux, C. B., Edwards, P., Jones, M. (2005). Soil bulk density changes
caused by mechanized harvesting: A case study in central Appalachia. Forest Products
J., 55 (11):
37-40.
Wentworth, C. K. (1922). A scale of grade and class terms for clastic sediments. The J. of
Geology, 30(5), 377-392.
Wickham, J. D., Riitters, K. H., Wade, T. G., Coan, M., Homer, C. (2007). The effect of
Appalachian mountaintop mining on interior forest. Landscape Ecology, 22(2), 179-187.
Wickham, J., Wood, P. B., Nicholson, M. C., Jenkins, W., Druckenbrod, D., Suter, G.,
Strager, M., Mazzarella, C., Galloway, W., Amos, J. (2013). The overlooked terrestrial
impacts of mountaintop mining. BioScience, 63(5), 335-348.
Wood, P. J., & Armitage, P. D. (1997). Biological effects of fine sediment in the lotic
environment. Environmental management, 21(2), 203-217.

126
Wyatt, J. L., Silman, M. R. (2010). Centuries-old logging legacy on spatial and temporal
patterns in understory herb communities. Forest Ecology and Management, 260(1), 116-
124.
Wynn, J. G., Harden, J. W., Fries, T. L. (2006). Stable carbon isotope depth profiles and
soil organic carbon dynamics in the lower Mississippi Basin. Geoderma, 131(1-2), 89-
109.
Yang, M. Y., Walling, D. E., Tian, J. L., Liu, P. L. (2006). Partitioning the contributions
of sheet and rill erosion using beryllium-7 and cesium-137. Soil Science Society of
America Journal, 70(5), 1579-1590.
Yeager, K. M., Santschi, P. H., Phillips, J. D., Herbert, B. E. (2005). Suspended sediment
sources and tributary effects in the lower reaches of a coastal plain stream as
indicated by radionuclides, Loco Bayou, Texas. Environmental Geology, 47(3), 382-395.
Yeager, K. M., Santschi, P. H., Rifai, H. S., Suarez, M. P., Brinkmeyer, R., Hung, C.,
Schindler, K., Andres, M., Weaver, E. (2007). Dioxin chronology and fluxes in sediments
of the Houston Ship Channel, Texas: Influences of non-steady-state sediment transport
and total organic carbon. Environmental Science and Technology, 41(15), 5,291-5,298.
Zipper, C. E., Burger, J. A., Skousen, J. G., Angel, P. N., Barton, C. D., Davis, V.,
Franklin, J. A. (2011). Restoring forests and associated ecosystem services on
Appalachian coal surface mines. Environmental Management, 47(5), 751-765.

127
VITA
William Edward Bond
Education
B.S. Natural Resource Management (2014)
Angelo State University
B.S. Geology (2016)
Angelo State University
Experience
Shale Oil Research Fellow
Angelo State University
Graduate Teaching Assistant
Department of Earth and Environmental Sciences
Research Assistant
Department of Earth and Environmental Sciences