forestry commission technical paper: the potentialfor ...file/fctp029.pdf · the prospects for...
TRANSCRIPT

Forestry Commission
The Potential for Woodland on Urban and Industrial Wasteland in England
and WalesWith a review of the dynamics of urban and industrial wasteland
Duncan Perry and John Handley
Technical V a p e r^ ^
Forestry Commission
ARCHIVE

I

FORESTRY COMMISSION TECHNICAL PAPER 29
The Potential for Woodland on Urban and Industrial Wasteland in England and WalesWith a review of the dynamics of urban and industrial wasteland
Duncan Perry and John Handley
Manchester University School of Planning and LandscapeSupported by the Forestry Commission and the National Urban Forestry Unit with the Groundwork Foundation
FORESTRY COMMISSION, EDINBURGH

© Crown copyright 2000 First published 2000
ISBN 0 85538 409 3 FDC 414:441:236.1:307
KEYWORDS: Forestry, Land regeneration, Reclamation, Woodland creation
ACKNOWLEDGEMENTS
This report was undertaken with support from the Forestry Commission and the National Urban Forestry Unit, working in partnership with the University of Manchester. The authors are grateful to the Project Manager, Marcus Sangster, for his support and encouragement and to the project Steering Group who gave freely of their time and knowledge. Dr Robert Wood gave invaluable assistance with the final edit and report preparation.
The Steering Group members were:
Dr Baron Isherwood Mr Tony HothersallDirector of Regeneration DirectorGovernment Office North West Red Rose Forest
Mr Gwyn Griffiths Ms Nerys JonesDirector of Land Reclamation Chief ExecutiveWelsh Development Agency National Urban Forestry Unit
Mr John Rouse Mr David FootPolicy Planning Manager Head of the Forestry AuthorityEnglish Partnerships Forestry Commission
Dr Andy Moffat Mr Huw DaviesHead of Environmental Research Branch Policy OfficerForest Research Forestry Commission Wales
Mr Tim Rollinson Mr Mark PritchardChief Conservator Forestry PolicyForestry Commission England Forestry Commission England
Ms Marion HeadicarHead of Environmental Regeneration BranchDepartment of the Environment, Transport and the Regions
Enquiries relating to this publication Photocreditsshould be addressed to: Front Cover: Dunraven Lake,
restored opencast coal workings,The Research Communications Officer West Glamorgan (Forest ResearchForest Research Alice Holt Lodge
photo library, 39801).
Wrecclesham, Farnham Back Cover: Photographs courtesySurrey GU10 4LH of Professor John Handley, Manchester
University and the Groundwork Trust.

CONTENTS
Acknowledgments
Page
ii
Figures V
Tables vi
Boxes vi
Introduction 1
Forestry as a multiple-objective land-use 1A Forestry Strategy for England 3
The nature and extent of urban and industrial wasteland 4
Introduction 4Operational land 5Under-used (vacant) land 11Derelict land 12Contaminated land 14Conclusion 16
Land-use dynamics and the changing stock of derelict and neglected land 18
Introduction 18The pattern of land-use change 18Operational land 22Vacant land 27Derelict land 28Contaminated land 32Conclusion 33
The effectiveness of land reclamation to woodland 34
Introduction 34The physical environment 34The social environment 35The multiple benefits of afforestation 37The cost-effectiveness of woodland 41Short rotation forestry 42The importance of natural succession 44Conclusion 46
The current extent of land reclamation to woodland 47
Introduction 47Operational land 47
Mineral working 47Landfill 51Large industrial sites 51
Vacant land 51Derelict land 51Contaminated land 53Overall conclusions 53
iii
5. The prospects for woodland on urban and industrial wasteland 55
Introduction 55The policy context 55Woodland creation: consultation on needs and opportunities 55Competing land uses and the appropriateness of woodland creation 56The dynamics of urban and industrial wastelend 56The alternative land resource 57Land capability for forestry 57Overcoming social and economic constraints 59The need for practical guidance and a proactive approach 59Priorities for research and development 60The importance of advocacy 60Conclusion 61
References 62
iv

Figures
Figure 1.1 Area and nature of provisions for reclamation of surface mineral workingsPage
in England in 1994 5Figure 1.2 Area and nature of provisions for reclamation of land permitted for the
surface disposal of mineral working deposits in England and Wales 6Figure 1.3 Area of surface mineral workings by standard region in 1994 and extent of
provisions for site reclamation 6Figure 1.4 Area of land permitted for the surface disposal of mineral working deposits,
and nature of provisions for reclamation, by standard region, in 1994 7Figure 1.5 Surface mineral workings 1988 by mineral (All Wales) 7Figure 1.6 Surface disposal of mineral working deposits 1988 by mineral (All Wales) 8Figure 1.7 Surface mineral workings 1988 by county (All Wales) 8Figure 1.8 Surface disposal of mineral working deposits 1988 by county (All Wales) 9Figure 1.9 Enhancement of the landscape spectrum of a large industrial site by active
management 10Figure 1.10 Origins of dereliction - All Wales 14Figure 1.11 Derelict and reclaimed land by county - All Wales 15Figure 2.1 Land-use change (km2) in Merseyside county from the 1960s to 1982 19Figure 2.2 Total area of surface worked minerals in England, in 1982/88/94 22Figure 2.3 Total permitted area for the surface disposal of mineral working deposits in
England in 1982/88/94 23Figure 2.4 Cumulative area of mineral working reclaimed in England since 1974 -
main mineral types 23Figure 2.5 Surface mineral workings 1982-88 by county (Wales) 25Figure 2.6 Surface disposal of mineral working deposits 1982-88 by county (Wales) 25Figure 2.7 Land damaged by surface mineral working and reclaimed under planning
conditions by county (Wales) 26Figure 2.8 Land damaged by surface mineral working and reclaimed under
subsequent planning conditions by county (Wales) 26Figure 2.9 Amount of derelict land reclaimed per annum by standard region, 1982-88
and 1988-93 (annualised data) 30Figure 2.10 Stock of derelict land and the components of change 1988-93 30Figure 3.1 Modes of community involvement 36Figure 3.2 Monthly call-outs to vegetation fires in Merseyside, 1985 38Figure 3.3 Monthly call-outs to vegetation fires in all England and Wales, 1985 38Figure 3.4 Factors contributing to the risk of fire damage, restriction of burning and
subsequent recovery 39Figure 3.5 Capital costs and performance of restoration options 43Figure 3.6 New Uses for Vacant Industrial Land (NUVIL) - a biomass plantation
before and after development 43Figure 3.7 Comparison of gross maintenance costs and capital cost for various after-uses 45Figure 4.1 After-uses of land reclaimed from 1982-88 and 1988-94 47Figure 4.2 Comparison between after-uses of land reclaimed by mineral planning
permissions and other means 48Figure 4.3 Comparison between proposed after-uses of surface mineral workings and
spoil disposal area with aftercare conditions in 1994 48Figure 4.4 After-uses of land reclaimed between 1988-94 - main mineral types 49Figure 4.5 After-uses of land reclaimed satisfactorily under planning conditions by
county (Wales) 50Figure 4.6 After-use of land reclaimed satisfactorily under subsequent planning
conditions, by county (Wales) 50Figure 4.7 Amount of derelict land reclaimed and brought back into soft end-use
1988-93, by standard region 52Figure 4.8 Potential after-uses of derelict land - All Wales 52Figure 5.1 Stock dynamics and availability to forestry 57

Tables
PageTable 1.1 Type of vacant urban land by standard region (ha) 12Table 1.2 Amount of derelict land and the area justifying reclamation by type of
dereliction - 1 April 1993 13Table 1.3 Amount of derelict land and the area justifying reclamation by standard
region - 1 April 1993 13Table 1.4 Principal hazards and contaminants 16Table 2.1 Land-use change (ha) in 1989 in England (new rural uses) 20Table 2.2 Land-use change (ha) in 1989 in England (new urban uses) 21Table 2.3 Area of mineral workings reclaimed through mineral planning permissions,
by standard region between 1988 and 1994 24Table 2.4 Previous and after-uses of vacant land - England 1985-89 27Table 2.5 Changes in the amount of derelict land by type of dereliction -
1974/82/88/93 28Table 2.6 Changes in the amount of derelict land by standard region - 1974/82/88/93 29Table 2.7 Stock of derelict land 1988/93 by type and components of change 31Table 2.8 Stock of derelict land 1988/93 by region and components of change 31Table 2.9 Welsh derelict and reclaimed land 1972/88/93 32Table 3.1 Efficiency of landscape management operations on land reclamation
schemes in St Helens and Knowsley, Merseyside 35Table 3.2 Summary of resource costs and benefits of the Mersey Community Forest 40Table 3.3 Comparisons of tree growth by site and species in South Wales 40Table 3.4 Average annual maintenance costs of urban vegetation 41Table 3.5 Assessment of use and performance of sites - mean scores for after-uses 42Table 3.6 Black Country Open Space Survey 44Table 3.7 Proportion of seed types by intensity of urbanisation in naturally colonising
woodland 45Table 4.1 Amount of derelict land reclaimed and in use by end-use and rural/urban
location - 1 April 1993 51Table 5.1 Urban and industrial wasteland in England and Wales 58
Boxes
Box 1.1 Land excluded from the derelict land surveyBox 3.1 The Wasteland to Woodland project, St HelensBox 3.2 Engineering effects of trees
43741
Introduction
This report considers the use of woodlands as a means of rehabilitating urban and industrial wastelands, and the availability of such land as a resource for new woodlands in England and Wales.
The key to achieving multi-purpose amenity woodlands in lowland urban and urban-fringe areas is to make land available for new planting. This report addresses this question by exploring whether the forces of urbanisation and industrialisation that, in the past, have been a significant consumer of woodland can in the future provide new planting opportunities. It investigates the potential of urban and industrial wastelands as a resource for achieving planting targets. We propose that such lands are, in the main, ideally located to meet the needs of community access woodlands. Changes in government policy towards the reclamation of derelict and other wastelands are now encouraging 'soft' after-uses (including forestry) where appropriate. In addition to this there has been considerable natural succession towards woodland on many urban and industrial wasteland sites.
There is thus a clear tie-in between the needs of woodland/amenity expansion and the continuing need to recycle and rehabilitate considerable areas of derelict and neglected land.
The report first explores the nature and current stock of derelict and neglected land, before considering land-use dynamics - in particular the changing stock of wastelands and the influence of land-use processes within and around urban areas. Then it looks at the effectiveness of formal reclamation to forestry followed by the potential for natural regeneration of woodlands through succession or minimal intervention. The last two sections review the current extent of land reclamation to forestry, the constraints to the use of wastelands for afforestation, together with a discussion of current policy processes and the key players and agencies involved.
Forestry as a multiple-objective land-useEngland has the second lowest cover of woodland in Europe with just over 7% of its land under trees (DoE, 1995a). Wales is slightly better off with 11.5%
(DoE, 1996a) but this is still much less than the European average of approximately 28%. Although Great Britain has doubled its woodland cover from 5% in 1920, there is a broad consensus that our area of woodland is still insufficient. This view stems from an understanding of the many benefits that trees and woodlands provide.
These benefits are economic, environmental and social (in particular woodlands within easy reach of urban areas are highly valued as places for leisure activities). At the international scale this trend was encapsulated in the 'Statement of Forest Principles' drawn up and ratified at the 1992 United Nations Conference on the Environment and Development (UNCED) in Rio de Janeiro. Although largely focused on the need for the sustainable management of forests and their importance in maintaining climate balance, emphasis was also placed on the environmental and social benefits of multi-purpose forestry. This work was reinforced at the European scale in 1993 by the Helsinki conference guidelines entitled 'The sustainable management of European Forests'; the UK government in 1994 published Sustainable forestry - the UK programme as part of its strategy for sustainable development (HMG, 1994a).
Most recently, as part of a continuing process initiated by the United Nations Commission on Sustainable Development in 1995, the UK has been working with partner countries in the Intergovernmental Panel on Forests and its successor - the Intergovernmental Forum on Forests - to promote a global approach to sustainable forestry.
UK forestry policy has two principal objectives:
• sustainable management of our existing woods and forests; and
• steady expansion of tree cover to increase the many diverse benefits that forests provide.
Broadly speaking there has been a policy shift away from large-scale afforestation of upland areas towards the development of woodlands in lowland areas, and also towards a more balanced share of broadleaves and native species. Government policy
1

recognises that woodlands can be managed for many purposes in addition to timber production. The benefits of woodlands are noted in the policy documents of both the Forestry Commission - Our forests - the way ahead (Scottish Office Environment Department, 1994) - and the Countryside Commission - England's trees and woods (Countryside Commission, 1993a); these are briefly outlined below:
LandscapeWoodlands provide a means of creating a green matrix within towns and the urban fringe. They can bring coherence to the fragmented landscapes that are often characteristic of such areas; and they have the potential both to soften the urban landscape and to help define urban and green-belt boundaries. Trees also make an important contribution to landscape quality within the urban area (DoE, 1996b) and urban forestry is an important component of the Government's 'Greening the City' initiative.
RecreationWoodlands provide excellent opportunities for formal and informal leisure activities and are capable of absorbing very large numbers of people - 50 million visits to Forestry Commission land in 1993 (Scottish Office, 1994). Amenity woodlands are clearly being projected as a principal leisure activity into the future. Planned woodlands can cater for both passive and more formal activities such as mountain biking or orienteering provided uses are compatible and environmental constraints are respected. They can also provide an attractive setting for commercial leisure development.
Environmental/mechanicalWoods have some local influence on microclimate and pollution, especially in reducing dust and in particular S 0 2 levels by up to 50% daily output (CER Research and Consultancy, 1995). On damaged substrates, trees can act to improve physical and chemical soil qualities as well as aiding the development of diverse habitats.
EducationWoodlands have a wide range of school uses from arts to practical woodland management and nature conservation. Wider community education towards the benefits of trees can be generated, aimed at encouraging local involvement in the planning and management process.
ScreeningWithin towns trees can provide cost-effective and attractive development screens. These can be planned over the short, medium or long term. Use
can be made of short rotation coppice and long rotation broadleaves providing a natural development framework. Evergreen conifers provide screening throughout the year.
Timber productionOpportunities for high quality saleable timber are probably limited but semi-urban woodlands are capable of yielding a variety of products, such as fence screens and posts, together with wood chips and the potential for energy coppicing. In this way wood products can contribute towards long-term management costs.
In the past, direct planting by the Forestry Commission was the principal means of afforestation. With support from the Forestry Commission's Woodland Grant Scheme the impetus has moved to the private sector, local government and the voluntary sector who together planted 6707 ha in 1992 (91% England, 9% Wales) compared with 1885 ha in 1984 in England and Wales (Forestry Commission, 1994). There are, however, important opportunities for Forest Enterprise to bring their expertise and resources to bear in creating new woodlands on damaged and neglected land in the urban fringe, working as a key player in the urban regeneration process.
In March 1998 the Forestry Minister for England, Elliot Morley, announced the establishment by the Forestry Commission of a 'Land Regeneration Unit' specifically to tackle, through partnership and direct action, the practical challenge of planting new woods on former coal sites and other damaged land across England.
Bodies such as the Countryside Agency and Countryside Council for Wales are also concerned that the levels of new planting are still too low, and are concentrated in rural areas. Programmes - such as the National Forest and twelve Community Forests, and the Aman Gwendraeth initiative in the Welsh valleys - have been developed with the Forestry Commission to promote forestry in populated areas. These initiatives aim to improve the urban and urban-fringe environment through increased tree planting accessible to large populations, along transport corridors and through the establishment of green networks within towns. They are intended as specifically multi-purpose recreation and amenity woodlands located within easy access distance of urban populations. In 1992 a Community Woodland Supplement (CWS) to the Woodland Grant Scheme was introduced to encourage planting in urban-fringe areas where free public access could be guaranteed, thereby strengthening the wider community forest initiative.
2

A Forestry Strategy for EnglandFollowing consultation in 1997 on opportunities for new woodland in England, the Government asked the Forestry Commission to prepare a strategy, setting out the priorities and programmes for forestry in England. The consultation highlighted the opportunity for forestry to transform damaged and vacant land. The Government's forestry strategy for England was published in December 1998. It identified four key programmes:
• forestry for rural development;• forestry for recreation, access and tourism;• forestry and for economic regeneration; and• forestry for environment and conservation.
These programmes are the product of extensive consultation. They and attracted broad support not only within central and local government but also within the business community and environmental bodies. Voluntary sector organisations such as the Woodland Trust and the Groundwork Trusts are also actively encouraging the use of new woodland as a means of reclaiming areas of derelict or vacant land to beneficial use.
With devolution, the new administrations are responsible for forestry, allowing Scotland, Wales and Northern Ireland to set their own priorities.
3

Chapter 1
The nature and extent of urban and industrial wasteland
IntroductionThe land resource under investigation comprises several distinct categories that together amount to the 'urban and industrial wastelands' alluded to in the title. They are all considered to be environmentally and economically degraded, so contributing to the blight of large areas; whether due to their hazard to health, deterrence of new economic activity, poor landscape value or obvious waste of a scarce land resource (Civic Trust, 1988). As a starting point, this chapter defines the four major categories of land under consideration, briefly summarises their characteristics and outlines their current extent in England and Wales. The extent of land is obviously only a potential resource and more practical consideration of land capability for forestry is attempted in the subsequent chapters.
Looking at derelict land alone is insufficient for our purposes, since large areas of land that are similarly blighting or unproductive are excluded from the Derelict Land Survey. Box 1.1 illustrates these exclusions and it has been noted (Handley, 1996) that they are largely based on the strict definition
Box 1.1 Land excluded from the derelict land survey
applied to derelict land for the purposes ofallocating Derelict Land Grant.
The four categories under consideration are thus:
• Operational land - land in active working (especially for mineral working, waste disposal and large scale industry) that may not be realising its full potential and be detrimental to the environment.
• Vacant land - land on which some previous productive use has ceased for a significant period of time.
• Derelict land - land so damaged by industrial or other development that it is incapable of beneficial use without treatment.
• Contaminated land - land which represents an actual or potential hazard to health or the environment as a result of current or previous use (further defined later).
The following categories of land are not within the definition of derelict land:
• land that may be regarded as derelict from natural causes, such as neglected woodland and farmland, marshes, mudflats, saltings, sand dunes, naturally unstable land such as land subject to landslides and wasteland generally;
• land damaged by development, either past or current, which is subject to enforceable planning conditions or other arrangements providing for restoration;
• land still in industrial or other recognised use (such as an active tip that is being continued under the general provisions of the Town and Country Planning General Development Order) even though it is not subject to planning conditions or other arrangements providing for restoration;
• land damaged by development which has blended into the landscape in the process of time to the extent that it can reasonably be considered as part of the natural surroundings or has been put to some form of acceptable use and no longer constitutes a problem, e.g. a well vegetated spoil heap, quarry or pit that no longer constitutes an eyesore and is possibly used as a nature reserve or for informal recreation;
• vacant sites awaiting development and urban sites cleared with a view to redevelopment as part of a programme of urban renewal;
• abandoned buildings that are awaiting demolition as part of a redevelopment scheme;
• neglected or unsightly land such as that eligible for the Department's small clearance scheme.
Source: Department of the Environment, 1995b
4

Operational landOperational land in the form of mineral working, waste disposal and large-scale industry is an important component of urban and industrial wasteland. It is, by definition, excluded from derelict land although, if not effectively managed, it can have a significant blighting effect on landscape quality. Furthermore, land uses of this kind that sometimes persist over several decades may have historic planning conditions that are ineffective, inappropriate or non-existent. Consequently operational land in general, and mineral working in particular, has until recently been a significant source of new dereliction. Some 50% of the land in the Derelict Land Survey (DLS) 1993 originates from mineral working (DoE, 1995b). However, severely disturbed land, waste disposal sites and peripheral land around large industrial complexes or public utilities can all provide opportunities for new woodland planting.
Mineral workingThe Survey of Land for Mineral Workings 1994 (DoE, 1996c) provides us excellent thematic coverage of this land category. The total area covered by permissions for surface mineral working in 1994 was 94 025 ha, just one half of which (50149 ha) was worked but not restored (Figure 1.1). Of this area some 76% (71 802 ha) is covered by reclamation conditions but 24% had none; aftercare conditions that require land to be brought up to standard for agriculture, forestry or amenity uses covered 37 957 ha.
A further 14 480 ha have permissions for surface disposal, 68% of this area had not been tipped yet. Deep-mined coal (40.9%) and china clay (32.1%) are
dominant (Figure 1.2). Only 42% (6080 ha) of this area is covered by reclamation conditions, of which aftercare conditions only apply to 52% (3175 ha).
Regional variations in the extent of mineral workings are high, with the East Midlands holding 25% of area (23 518 ha), although 47% of this is permissions for ironstone of which only 6% has been used since 1979. The South East is also prominent with 21% of total area of which 63% is sand and gravel (Figure 1.3). The South West holds 39.5% of the area with permissions for surface disposal, of which only 18.2% have reclamation conditions. Yorkshire and Humberside and the East Midlands also have high concentrations at 22.7% and 24.2% respectively, largely associated with colliery spoil disposal (Figure 1.4).
The Mineral Survey of Wales 1988 (Welsh Office, 1991) shows that the total area covered by permissions for surface mineral workings was 10781 ha. Of this, 78% (8467 ha) had been worked but not reclaimed. The survey indicates that 42% (3554 ha) is unlikely to be reclaimed to a satisfactory standard. Opencast coal is the dominant mineral type and 97% of permissions are covered by reclamation conditions; this drops to 50% for the second most important mineral category - limestone dolomite (Figure 1.5). A further 3366 ha are covered by surface disposal permissions of which only 31% (1043 ha) have satisfactory reclamation conditions. Slate wastes account for 43% (1451 ha) of surface disposal permissions with only 4 ha having satisfactory reclamation conditions; deep-mined coal also accounts for 43% (1451 ha) with 58% under satisfactory reclamation conditions (Figure 1.6).
Figure 1.1 Area and nature of provisions for reclamation of surface mineral workings in England in 1994
35
■ with reclamation conditions □ no provision for reclamation
\ 'e -'o %
%>/
Mineral type
Source: Department of the Environment, 1996c
5

Figure 1.2 Area and nature of provisions for reclamation of land permitted for the surface disposal of mineral working deposits in England and Wales
CO*ocCOCO13o
CO
COCD
■ with reclamation conditions □ no provision for reclamation
Mineral typeSource: Department of the Environment, 1996c
At the county level, Mid Glamorgan with 24% (2600 ha) and Dyfed 21% (2270 ha) are the major surface mineral working areas; Gwynedd has the lowest percentage of permissions covered by reclamation conditions (Figure 1.7). Gwynedd also has 49% (1650 ha) of the surface disposal land of which almost none is covered by reclamation conditions, Mid Glamorgan is second highest with 24% (820 ha) (Figure 1.8).
Despite the intensity of disturbance, land used for
mineral working and surface disposal can, with proper ground preparation, be very suitable for growing trees (Bradshaw, 1984; Wilson, 1985; Moffat and McNeill, 1994). There is a strong case for reviewing historic planning consents that, even in urban-fringe areas, often specify reclamation to agriculture, with a view to substituting forestry as a cost-effective alternative. The new provisions within the Environment Act (1995) provide an ideal opportunity to establish more appropriate reclamation conditions.
Figure 1.3 Area of surface mineral workings by standard region in 1994 and extent of provisions for site reclamation
30 t
■ with reclamation conditions
□ no provisions for reclamation
%O/, Ox ty Ox
'''O '/ ^ 'H r 0<!> O '/ ^°Q / 'h sV > X \ % XIP
RegionSource: Department of the Environment, 1996c
6

Figure 1.4 Area of land permitted for the surface disposal of mineral working deposits, and nature of provisions for reclamation, by standard region, in 1994
CO~occdcoDo
03
030
■ with reclamation conditions □ no provision for reclamation
O'
Region
' % XO f'% % %
Source: Department of the Environment, 1996c
Figure 1.5 Surface mineral workings 1988 by mineral (All Wales)
4.0■ total area permitted / authorised
□ satisfactory reclamation conditions
MineralSource: Welsh Office, 1991
7

Figure 1.6 Surface disposal of mineral working deposits 1988 by mineral (All Wales)
w■ocCCV)3o
1.6
1.4
1.2
1.0
to 0.8
CO0) 0.6
0.4
0.2
■ total area permitted / authorised
□ satisfactory reclamation conditions
'X ) %
Mineral
Source: Welsh Office, 1991
Figure 1.7 Surface mineral workings 1988 by county (all Wales)
CO“OccoCOdo
coJZ
coo
■ total area permitted / authorised
□ satisfactory reclamation conditions
County
Source: Welsh Office, 1991

Figure 1.8 Surface disposal of mineral working deposits 1988 by county (all Wales)
w■occow3O
COx:COCD
1.8
1.6
1.4
1.2
1.0
8.0
6.0
4.0
2.0
0
■ total area permitted / authorised □ satisfactory reclamation conditions
County
1n2u
Source: Welsh Office, 1991
Waste disposalLand in use for landfilling of waste may also represent a significant resource for woodland planting. Research work conducted by ForestResearch (Dobson and Moffat, 1993; Bending and Moffat, 1997) has indicated that tree planting on containment sites can occur without compromising pollution control, providing the sites are well engineered and minimum depths of soil-forming materials are adhered to (more detail in later section). This represents a substantial shift in policy that may lead to the redrafting of Landfilling wastes (DoE, 1986) which had recommended that trees were not a suitable after-use. In 1994 there were approximately 4200 licensed landfill sites and up to 6000 that had already been filled (Royal Commission on Environmental Pollution, 1996) a previous estimate was around 50 000 ha of land resource (Knox, 1989).
With effect from 1 October 1996, landfill operators have been required to pay a landfill tax with estimated revenue to Customs and Excise of £500 million per annum. As an option, landfill operators may contribute up to 20% of their tax liability to one or more Environmental Bodies for approved purposes. In return, the operators receive a tax credit. Such purposes include:
• reclamation, remediation, restoration or any other operation intended to facilitate the economic, social or environmental use of land where its use has been prevented or restricted
because of previous use, unless a benefit accrues to any person who carried out or knowingly permitted the previous use;
any operation intended to prevent or reduce any potential for pollution or to mitigate the effects of any pollution on land polluted by a previous activity, unless a benefit accrues to any person who carried out or knowingly permitted the pollution;
research and development, education or collection and dissemination of information about waste management practices for the purpose of encouraging the use of more sustainable waste management practices (including waste reduction, reuse, recycling, composting and energy recovery);
where it is for the protection of the environment, the provision, maintenance or improvement of a public park or other amenity in the vicinity of a landfill site, provided that the park or amenity is not to be operated with a view to profit;
where it is for the protection of the environment, the maintenance, repair or restoration of a building or other structure that is a place of religious worship or of historic or architectural interest, that is open to the public and within the vicinity of a landfill site and is not operated with a view to profit; and

Figure 1.9 Enhancement of the landscape spectrum of a large industrial site by active management
Landscape spectrum by area 1992
Woodland
Farmland
Buildings & hard surface
Gravel
Grassland Flower beds
31%I [Managed land
69%| | Unmanaged land
Farmland
Lagoons
Woodland
Proposed landscape spectrum (by area) 1992
Marsh (salt & freshwater) Coal stockRough grassland
Buildings yhard surface
Gravel Lawns
Flower beds Meadow
88%| I Managed land
1 27c j | Unmanaged land
Source: Groundwork Trust and Mersey Valley Partnership, 1988
10

• the provision of financial, administration and other similar services by a central organisation to bodies eligible for enrolment under this scheme.
This scheme, which has been endorsed by the waste management industry, provides a potential mechanism for promoting woodland planting on and around waste disposal sites.
Under-used land around large industrial complexes and public utilitiesA second category of land that is available for afforestation is vacant or under-used land in and around large industrial complexes and public utilities. Typically only a part of the site will be in active use, providing opportunities elsewhere for creative conservation including woodland establishment. This will often provide additional benefits in the form of screening and may indeed be a requirement of planning consent. The original and revised landscape spectrum following systematic assessment of a large coal-fired power station site at Fiddler's Ferry, Warrington is shown in Figure 1.9. At a national level it is difficult to quantify the potential land area available for forestry within this category but taking the energy sector alone there are currently 62 generating plants in England and Wales of various types above 100 MW (National Grid Company, 1995).
Vacant landVacant land occurs where some previous productive use has ceased for a significant period of time. Such land may in some cases be derelict, damaged or contaminated. Criticisms of such land generally increase with the length of time it is left vacant, where the land becomes an eyesore and more importantly appears to be a waste of resources, particularly in and around urban areas. The Sample Survey of England in 1990 (VLS 90) estimated the area of vacant land in urban areas with populations greater than 10 000 and extrapolated for towns less than 10 000 (DoE, 1992b). Vacant land is divided in the survey into four distinct categories that are outlined below:
• P - despoiled land with individual buildings that are in an advanced state of disrepair but with the roof intact;
• V - land that was previously developed and is now vacant that could be developed without further demolition or treatment;
• X - land in built-up areas that has not been previously developed and is not used for agriculture;
• Z - land previously developed and currently unused that requires demolition work or other treatment before it can be used for development
Total vacant land in 1990 was 49 080 ha (± 3070 ha) or 5.2% (±0.3%) for areas with greater than 10 000 population, rising to an estimated 59 800 ha when the survey is extrapolated to include settlements less than 10 000 and the urban fringe. Regional variations of total vacant land as a percentage of urban area are high. The North has 10.9% (6800 ha ± 1340) of urban areas vacant, followed by Yorkshire and Flumberside, the North West and East Midlands. The South East had the lowest vacant land tally, at 3.3% of urban area, although it had the highest absolute area of vacant land - 11 830 ha (± 1680) (Table 1.1). There is no comparable survey for Wales.
Categories Z + P equate to derelict land and amount to approximately 17.7% (8690 ha ± 1310) of total vacant area. Category V amounts to 25.4% (12 470 ha ± 1860) and is best considered as interim land having already been previously developed and awaiting reuse. Temporary uses may be accommodated on this land. These are dependent upon vacancy periods, which are closely tied to variations in land recycling rates, as will be seen in the next chapter. Where re-use rates are low and slow, part of this land may be in a natural succession towards woodlands or some other form of semi-natural vegetation (Gilbert, 1984; Ash, 1991).
The majority of vacant land is in category X - 56.9% nationally (27 930 ha ± 2170). This 'neglected land' represents an extremely flexible resource. Such land originates from:
• low demand;
• deliberately neglected so that it can be recategorised in development plans;
• zoned but awaiting funds for project completion;
• land being held by companies in expectation of expanding operations.
This land is often potentially more productive due to the lack of development activity that has taken place but its suitability for forest use depends once again on the vacancy periods envisaged.
Some indication of land capability for forestry is given by an appraisal of 48 parcels of vacant land on the Knowsley Industrial Park at Kirkby, Merseyside that together amounted to 258 ha. An assessment of
11

Table 1.1 Type of vacant urban land by standard region (ha)
Standardregion
Urban area (ha) Estimated total vacant land by category Total
Derelict land (Z&P)
Vacant land previously developed and cleared (V)
Vacant land not previously developed (X)
North 62 100 (1300) 980 (480) 2 070 (140) 3 750 (800) 6 800 (1340)
North West 140 500 (1900) 1 860 (520) 2 060 (480) 5 540 (830) 9 460 (1080)
Yorks & Humber 96 900 (1500) 1 180 (700) 1 780 (470) 3 590 (730) 6 550 (1070)
E. Midlands 68 000 (1600) 570 (260) 1 210 (520) 2 430 (600) 4 200 (780)
W. Midlands 112 000 (2000) 1 760 (610) 1 970 (650) 2 460 (500) 6 200 (1040)
South West 74 800(1600) 510 (290) 390 (330) 1 850 (600) 2 750 (750)
East Anglia 28 900 (1200) 280 (170) 310 (160) 710 (440) 1 300 (520)
South East 353 600 (3600) 1 550 (420) 2 680 (950) 7 610 (1310) 11 830 (1680)
Total 936 700 (5600) 8 690 (1310) 12 470 (1860) 27 930 (2170) 49 080 (3070)
The survey estimates relate to urban areas with population greater than 10 000 at April 1981.
Figures are rounded to the nearest ten or hundred hectares and may not sum to the rounded totals. The 95% confidence intervals are shown in parentheses.
land suitability for forestry was made using the scheme developed by the Soil Survey of England and Wales (Bibby, Heslop and Hartnup, 1988). Here climate, soil moisture status and soil features allow an allocation into classes FI (most suited) to F7 (unsuitable). A high proportion of the land is in categories F l-3 and therefore well suited to forestry, at least in terms of land capability, and much has never been developed and would therefore fall into category X of VLS 90.
Derelict landDerelict land is a special category of vacant land. It has been damaged by some previous use, normally industry, so that it is incapable of beneficial use without treatment. Derelict land is perhaps the best known and most obvious manifestation of urban and industrial wasteland. It is also one of the larger potential resources for afforestation. Policy changes to be discussed in Chapter 4 indicate that the reclamation of such lands to soft end-uses is becoming more acceptable once again, with afforestation to multi-purpose amenity woodlands being one of the prime alternatives. Extensive derelict land surveys have been conducted since 1974 by local authorities on behalf of the Department of the Environment. These surveys provide a wealth of
Source: Department of the Environment, 1992b
information. The results of the 1993 Derelict Land Survey (DoE, 1995b) are used here to identify current stocks and principal sources of dereliction. Comparable surveys have also taken place in Wales (Welsh Office and Welsh Development Agency, 1995).
The total derelict land area in England was recorded as 39 600 ha of which 87% (5034 ha) was considered to justify reclamation. There are big differences between the percentages for the various types of dereliction thought to justify reclamation - lowest are metalliferous spoil heaps at 58%. This can be taken as an indication of natural revegetation and marks out the potential suitability of such sites for low-cost natural reclamation. General industrial dereliction and assorted spoil heaps are the most important categories of derelict land nationally, accounting for 25% (9749 ha) and 23% (9191 ha) respectively (Table 1.2). Overall, derelict land is split evenly between urban and rural areas, although inner-city and urban areas contain the bulk of 'general industrial/other' which is the fastest growing category (see Chapter 2). The private sector owns 48% - highest in inner-city areas, with the remainder split evenly between local authority and other public sector; 16% all derelict land is of unknown ownership.
12

Table 1.2 Amount of derelict land and the area justifying reclamation by type of dereliction - 1 April 1993
Type of dereliction Derelict land Area justifying reclamation
%justifying
reclamation
Hectares % Hectares %
Spoil heaps 9 191 23% 7 382 21% 80%
Colliery 4 109 10% 3 904 11% 95%
Metalliferous 3 003 8% 1 738 5% 58%
Other 2 079 5% 1 740 5% 84%
Excavations & pits 5 807 15% 4 599 13% 79%
Military dereliction 3 275 8% 3 060 9% 93%
Derelict railway land 5 615 14% 4 749 14% 85%
Mining subsidence 674 2% 653 2% 97%
General industrial dereliction 9 749 25% 9 313 27% 96%
Other forms of dereliction 5 289 13% 4 809 14% 91%
Total 39 600 100% 34 566 100% 87%
Source: Department of the Environment, 1995b
Table 1.3 Amount of derelict land and the area justifying reclamation by standard region - 1 April 1993
Standard region Derelict land Area justifying reclamation
%justifying
reclamation
Hectares % Hectares %
North 5 073 13% 4 434 13% 87%
North West 8 653 22% 7 874 23% 91%
Yorks & Humber 5 466 14% 4 917 14% 90%
West Midlands 4 941 12% 4 541 13% 92%
East Midlands 4 385 11% 3 830 11% 87%
East Anglia 1 022 3% 944 35% 92%
South West 5 542 14% 3 764 11% 68%
South East 2 895 7% 2 669 8% 92%
Greater London 1 625 4% 1 591 5% 98%
England 39 600 100% 34 566 100% 87%
Source: Department of the Environment, 1995b
13

There are significant variations in the regional distribution of derelict land with the three most northerly regions holding almost 50% of total area. The North West alone contains 22% (8653 ha) whereas Greater London and East Anglia account for only 4% and 3% respectively (Table 1.3). Such variations carry through to the rates at which derelict land is being created and reclaimed, as will be seen in Chapter 2. This means that the current size and likely future extent of derelict land needs to be assessed on a regional basis with respect to its potential as a resource for afforestation. The focus on derelict land for this purpose is best illustrated by its inclusion in the resource plans of all the community forests and as an intentional core heartland of the National Forest (Countryside Commission, 1993b).
The Welsh Derelict Land Survey of 1988 (and limited 1993 review) indicates that Wales contained 8256 ha of derelict land in 1993 (estimated). Of this area, 4352 ha is within the Welsh Development Agency (WDA) rolling programme, with an estimated 1355 ha of newer dereliction in need of reclamation but not currently within the programme. A further 2549 ha has been identified as derelict land that is undergoing natural revegetation and should be reclaimed through minimal intervention (WDA, 1994). Colliery spoil heaps and pit-heads constitute the great majority of dereliction in Wales, followed by other forms of spoil heaps and general industrial dereliction (Figure 1.10)
By region, Mid Glamorgan is highest with 34% (2841 ha) followed by Gwent with 24% (1954 ha) of derelict land (Figure 1.11). It is here that
deep mining for coal was formerly concentrated. The naturally revegetating sites are heavily concentrated in Gwynedd with 46% (1170 ha), then Dyfed with 17% (436 ha). The scale of derelict land revegetating in Gwynedd can be associated with its history of quarrying and lead mining - this has created a patchwork of varying site characteristics that has encouraged diverse natural colonisation. A proportion of this land should regenerate towards semi-natural woodland; a process that can be aided by low intervention strategies to encourage woodland development (but which should not be implemented at the expense of extremely valuable nature conservation sites).
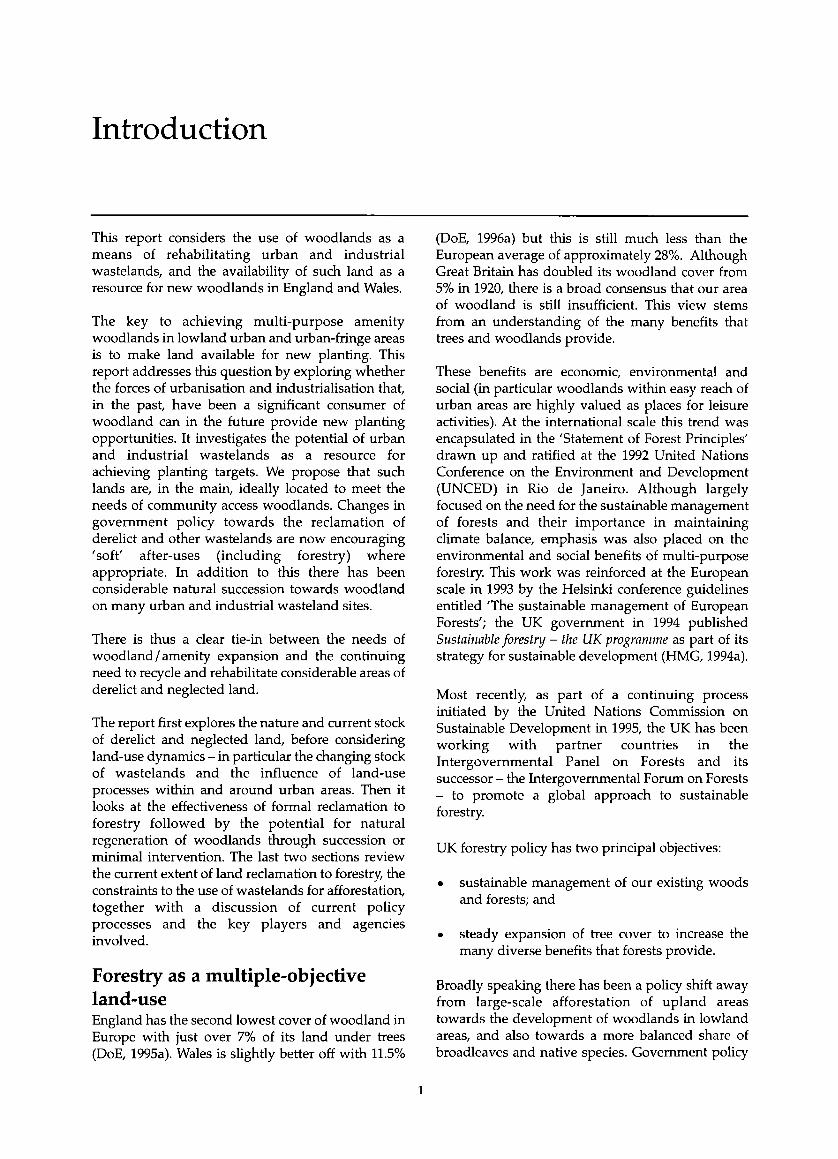
Contaminated landContaminated land differs from derelict land in that it represents an actual or potential hazard to health or the environment as a result of some previous use. The land may also be physically damaged. The Royal Commission on Environmental Pollution estimated that 27 000 ha of land in the 1988 Derelict Land Survey of England (65%) was also contaminated. However, it is possible for land to become contaminated - by air pollution or groundwater movement, for example - without obvious signs of damage. The type of hazard associated with particular contaminants depends very much on the current or proposed land use (Table 1.4).
The perceived scale of the problem with contaminated land in England and Wales is influenced by the definition employed. The Royal
Figure 1.10 Origins of dereliction - All Wales
co-*—>o"qCDT3H—oc'O)
Other forms
General industrial
Docklands
Railways
Military
Other spoil
Slate
Metalifferous
Colliery spoil
Reclaimed by Welsh OfficeReclaimed by Welsh Development AgencyReclaimed without grantIn progressNot in programme
Colliery surface j
0 1000 2000 3000 4000 5000 6000 7000 8000 9000
Area of dereliction (ha)
Source: Welsh Office/Welsh Development Agency, 1995
14

Figure 1.11 Derelict and reclaimed land by county - All Wales
6000
cd-C■O0E
JOo0
5000
4000
Reclaimed with grant Reclaimed without grant In progress Not in programme Low cost sites
45 3000
o 2000
1000
County
Commission on Environmental Pollution quotes estimates for Britain ranging from 50 000 to 200 000 ha (RCEP, 1996). A 1988 Welsh Office survey identified 949 contaminated sites, covering 4100 ha, excluding sites in active use or sites of less than 0.5 ha (Welsh Office, 1992). Only a small percentage of sites are thought to constitute an actual danger to humans or the environment. Experience abroad shows that typically 1-4% of sites on the original list required priority treatment due to immediate hazard.
The 1995 Environment Act provides for the first time a statutory definition of contaminated land: ....any land that appears to the local authority in whose area it is situated to be in such a condition, by reason of substances in, on or under the land, that:
• significant harm is being caused or there is a significant possibility of such harm being caused; or
• pollution of controlled waters is being, or is likely to be caused.
'H arm ' includes harm to the health of living organisms (including people), ecological systems and property. 'Controlled waters' includes groundwater, inland freshwaters and coastal waters (DoE, 1995c).
The Royal Commission notes that this is rather a 'narrow' definition and emphasises the importance of assessing the potential hazard associated with
Source: Welsh Office/Welsh Development Agency, 1995
contaminants when new land uses are considered. The Interdepartmental Committee on the Redevelopment of Contaminated Land (ICRCL) is the government body charged with dealing with contaminated land reclamation policy. They have set out a 'guidelines' and 'standards' based approach supported by a series of guidance notes that define tentative trigger concentrations for various soil contaminants for planned after-uses of differing sensitivity, for example, car parks versus private gardens.
Two trigger levels are defined:
• 'threshold', above which risk of hazard could be significant and some remedial action may be required prior to development and;
• 'action', above which remedial action is required or the form of development must be changed. (ICRCL, 1987).
Woodland is a much less sensitive use than, for example, domestic gardens and therefore the trigger levels are higher, reducing or even eliminating the need for remediation.
In addition the Department of the Environment published a series of Contaminated Land Reports (CLRs) in 1994—95 giving detailed advice on various issues concerning land reclamation. The current government policy statement is Framework for contaminated land (DoE, 1994a), which is now enshrined in the Environment Act 95 Section 57
15
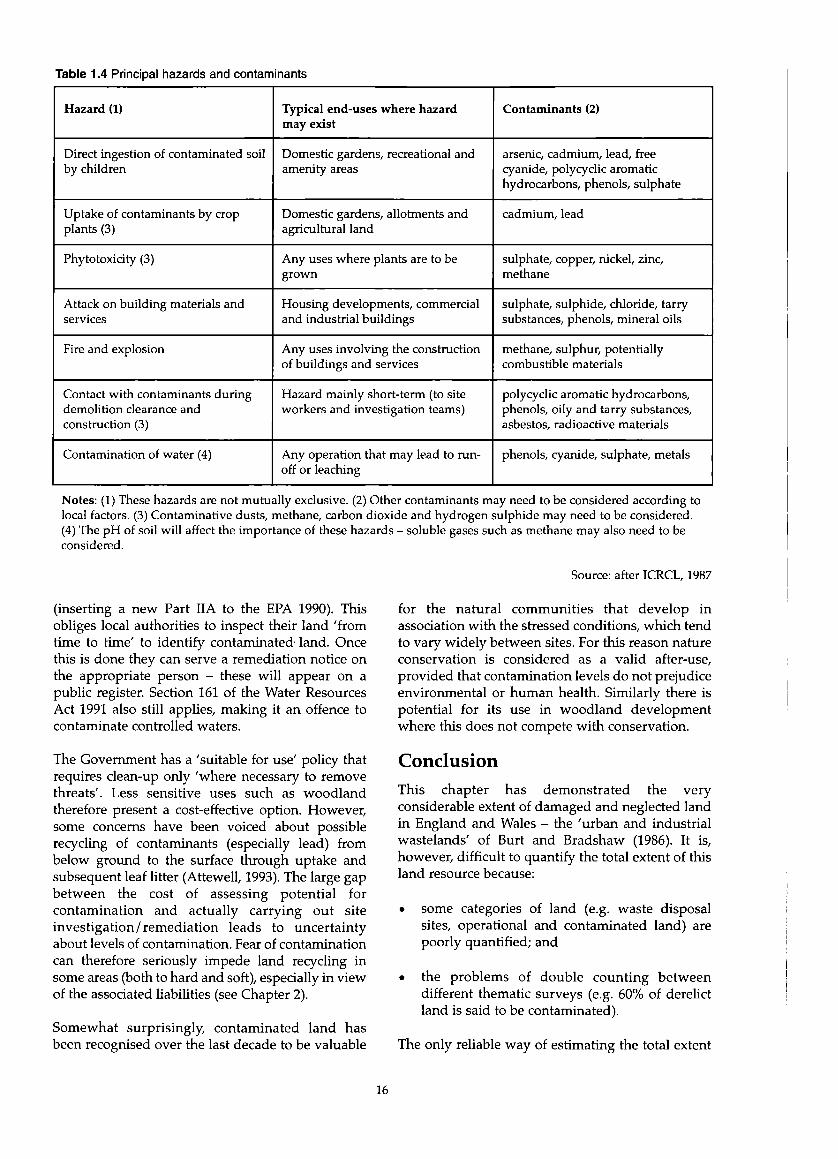
Table 1.4 Principal hazards and contaminants
Hazard (1) Typical end-uses where hazard may exist
Contaminants (2)
Direct ingestion of contaminated soil by children
Domestic gardens, recreational and amenity areas
arsenic, cadmium, lead, free cyanide, polycyclic aromatic hydrocarbons, phenols, sulphate
Uptake of contaminants by crop plants (3)
Domestic gardens, allotments and agricultural land
cadmium, lead
Phytotoxicity (3) Any uses where plants are to be grown
sulphate, copper, nickel, zinc, methane
Attack on building materials and services
Housing developments, commercial and industrial buildings
sulphate, sulphide, chloride, tarry substances, phenols, mineral oils
Fire and explosion Any uses involving the construction of buildings and services
methane, sulphur, potentially combustible materials
Contact with contaminants during demolition clearance and construction (3)
Hazard mainly short-term (to site workers and investigation teams)
polycyclic aromatic hydrocarbons, phenols, oily and tarry substances, asbestos, radioactive materials
Contamination of water (4) Any operation that may lead to runoff or leaching
phenols, cyanide, sulphate, metals
Notes: (1) These hazards are not mutually exclusive. (2) Other contaminants may need to be considered according to local factors. (3) Contaminative dusts, methane, carbon dioxide and hydrogen sulphide may need to be considered. (4) The pH of soil will affect the importance of these hazards - soluble gases such as methane may also need to be considered.
(inserting a new Part IIA to the EPA 1990). This obliges local authorities to inspect their land 'from time to time' to identify contaminated- land. Once this is done they can serve a remediation notice on the appropriate person - these will appear on a public register. Section 161 of the Water Resources Act 1991 also still applies, making it an offence to contaminate controlled waters.
The Government has a 'suitable for use' policy that requires clean-up only 'where necessary to remove threats'. Less sensitive uses such as woodland therefore present a cost-effective option. However, some concerns have been voiced about possible recycling of contaminants (especially lead) from below ground to the surface through uptake and subsequent leaf litter (Attewell, 1993). The large gap between the cost of assessing potential for contamination and actually carrying out site investigation /remediation leads to uncertainty about levels of contamination. Fear of contamination can therefore seriously impede land recycling in some areas (both to hard and soft), especially in view of the associated liabilities (see Chapter 2).
Somewhat surprisingly, contaminated land has been recognised over the last decade to be valuable
Source: after ICRCL, 1987
for the natural communities that develop in association with the stressed conditions, which tend to vary widely between sites. For this reason nature conservation is considered as a valid after-use, provided that contamination levels do not prejudice environmental or human health. Similarly there is potential for its use in woodland development where this does not compete with conservation.
ConclusionThis chapter has demonstrated the very considerable extent of damaged and neglected land in England and Wales - the 'urban and industrial wastelands' of Burt and Bradshaw (1986). It is, however, difficult to quantify the total extent of this land resource because:
• some categories of land (e.g. waste disposal sites, operational and contaminated land) are poorly quantified; and
• the problems of double counting between different thematic surveys (e.g. 60% of derelict land is said to be contaminated).
The only reliable way of estimating the total extent
16

of urban and industrial wasteland would be through a synoptic survey of land use/condition of the type pioneered in the past by the Land Utilisation Survey of England and Wales.
M odern survey techniques, such as remote sensing, may in time provide the basis for a synoptic survey. For the present the most functional method is to add total derelict land in England and Wales (39 600 ha + 8 256 ha, DLS and WDLS 93) to vacant land in categories X and V from the vacant land survey (40 400 ha). This gives a figure of 88 256 ha of derelict land for England and Wales, with no account taken of Welsh vacant
land. This is a considerable land resource that is either physically blighted or under-used which, when mineral and waste disposal sites (c.100 000 ha of operational land) are included, represents a notable land resource of the order of 200 000 hectares. There are many competing claims on this land but, given its condition and location, it clearly represents a potentially important opportunity for lowland afforestation. The following chapter will seek to explore land-use dynamics and how they influence the stocks of urban and industrial wastelands, and will attempt to get closer to the actual land resource that may be considered suitable.
17

Chapter 2
Land-use dynamics and the changing stock of derelict and neglected land
IntroductionThis chapter examines the changing nature of stocks of urban and industrial wasteland. It is important for us to establish the processes that act upon land resources so that we can gain a better understanding of their availability and suitability for woodland. We are interested in the rate at which land is transferred into and out of the stocks of urban and industrial wasteland and also the residence time within the stocks. If land is vacant for only a short time then it may be considered of limited use owing to the considerable time-spans required to generate woodland uses. Even in the case of short rotation coppice on interim industrial land, a minimum period of 5 -7 years should be stipulated in order to generate significant beneficial use and returns.
It is a natural consequence of the economic and development system that not all land will be in use at a given time. Movement will also occur between land-use categories depending on a range of external factors that influence and shape the process of change. Forces involved in change are: people, capital, technological change, transport systems, planning and general business relocation, etc. We tend to think of the problems of dereliction as being attributable to the Industrial Revolution, but this chapter will illustrate the importance of new urban and industrial wastelands being created by the forces of urban and economic restructuring into the post-industrial era.
The pattern of land-use changeNational information on land-use change throughout modern times is extremely limited. Until recently the only data available were those collected by the Land Utilisation Survey of England and Wales (an NGO). Detailed land utilisation surveys are therefore only available in fragmented form for the UK. They tend to become dated, and are commissioned on an ad hoc basis by local authorities and other interested parties. In this chapter we make use of survey data gathered from Merseyside covering the 1960s to 1982 that illustrates relevant patterns of land-use change; notably the uptake of land into the development cycle and its subsequent redistribution (Figure 2.1).
The Merseyside data show us that the key land-use transfer during urbanisation is the uptake of farmland into the development cycle (which includes industry, transport and mixed commercial / residential uses) of some 34.8 km2. A lesser but still significant uptake to amenity land occurs (13.6 km2) and there is a more indirect uptake of farmland that has first moved through a neglected phase. Although land does flow back out of the development cycle into amenity and neglected categories, the overall net flow is towards urban development. As development comes to the end of its functional life, it is normally recycled. Land that has been damaged falls out of the development cycle and accumulates as derelict land.
Land reclamation reverses this process, but in this example there was twice the outflow of land into dereliction from the development cycle as reclamation, a net transfer of 2 km2 formed between 1960 and 1982. There has also been a slight positive flow from dereliction into neglected land that represents at least some natural revegetation of such sites. The large net flow from agriculture to neglected land reflects the ineffective take-up of land where farming is no longer viable into the development cycle. This data is historic and peculiar to Merseyside; it reflects the final unsustainable expansion of that conurbation, but even so it nicely illustrates the land-use patterns associated with urbanisation.
More recent national land-use change data are now available from the Department of the Environment, using data recorded for the Department by Ordnance Survey (OS) as part of its ongoing map revision work throughout Great Britain. Two points to note are that as a result of OS map revision policy physical development tends to be recorded relatively sooner than changes between other uses, and that five years' data collection is considered necessary to provide reliable estimates of actual change.
The most recent data available for 1989 are illustrated in Tables 2.1 and 2.2 (DoE, 1994b). Although it is fairly broad brush, these data illustrate the general processes of urbanisation and
18

Figure 2.1 Land-use change (km2) in Merseyside county from the 1960s to 1982
Neglected Land < r Amenity Land
0.5Derelict Land « Farmland
0.5
indicate the uptake of vacant land into and out of the development cycle. On average from 1985-89 some 37.8% of new urban land has come from agriculture, an average of 5345 ha per annum nationally (an extra 10% coming from other rural uses). Reuse of previously developed vacant land accounted for 12%, and vacant land not previously developed 8% (DoE, 1992c). These figures illustrate continuing urban expansion on to greenfield sites incorporating large areas of potentially valuable agricultural land, with associated permanent loss of productive soil quality (RGEP, 1996).
The UK Strategy for Sustainable Development, due for revision in 1999, emphasises the importance of reusing vacant and derelict land in urban areas
Source: Joint Countryside Advisory Service, 1988
(HMG, 1994b). In 1993 the Government set up a new body - English Partnerships - to promote the reclamation and development of vacant land and buildings throughout England, particularly in urban areas. In Wales, the Welsh Development Agency continues to make significant progress in terms of land reclamation and urban development, especially in areas affected by the run-down traditional industries such as coal and steel. While land recycling for urban and industrial use is a top priority, on many sites this is either too expensive or inappropriate. Here, woodland may offer a cost- effective alternative. The following sections examine the nature of land-use dynamics in each component of urban and industrial wasteland and their potential for woodland expansion.
19

Tabl
e 2.1
La
nd-u
se
chan
ge
(ha)
in
1989
in
Engl
and
(new
rura
l us
es)
o o in in in in in O o O in o O Oon NO c > CM rH 0 0 NO CM CM CO NO O n ©o0 0
CMCM
CMT—< NO rH CO
CMrH
rHtN o
CMm o
CMrHrH
ONIN
COoCM
S" wJQJCA
— 3 <
o o O O in in O O in o in O in O inON O n O in CO NO CM 0 0 0 0 rH rH 0 0 ON NO inCO NO o rH CM CM inCO rH rH VO NO in
in o o o oCM
inCM
o o o o o o o in cn oneQJVMQJ
Q
»X g
° .2 O X
- o 03 *-* o> 3 »hO q>
in in in o oCD r - I 00 NO ON H
OoCM
o in o in o inH CD O CO
in00 in o 00 00 CO tN.
4(A Z x
"m 5IHC
o o in o o co cm in cm
rH rH
inCMco
o o in o in ini—< rH
o00 o in O corf H
*■§ *F ™ a(A — r t
K c St? Qi £ o
o o in in inNO NO O ^ tN IN CO
in00
in in inCM
o in in ^ co
oCM
in inON T *ON CM
o in o o oNO ON NO (M H NO NO ^
inoo
m in o o o oCO ^ CM
ino
o o in coON NO
*coo<
qjCA3CA30’>01 3
Di
cd
£«3T3 =3m ^ *2 "0C C§ J2O h y O ®3
^13ix cd-H Ix
q j C
0)XX3
13 01 CL
13 O QJ 'q j
>O 01
t> s
J i i 'O01 66 _ _ „O (/) > ̂u K QJ ̂x» s o
.a ■« £ §
3P o5<
c S F 3 ~B " g-ts I C•2 ^ 1 -2 E 5JiJ 1) 2 ? ° <5D PC £ £ U >
Ccd
X
3
.5QJ00c<dXu4->QJ
2
■ 6
IS£
CAQJoocc3-5
QJCCo
c n
ON0 0O nrH
cQJQJ
XQJ>cd
X
o
13QJoo133^(A
QJtoccdXu
<HHo i2tx ocd 4XQJ> , c
cQJ cX
4->^3oX u
u2$
QJX
Ix Go o
M x IxMh
CO !ON cdONrH O13 sC ?cd O
ON0 0 _QJON
2r™1 *cC D hQJ oQJ£
IhD h
JxQJ
D hcdS iQJ
XQJ 4H>1x3
tocCD uQJ cdU Ix3cd
•4XX
c 313 CAIxo X
13X QJ
13 MQJ QJ13Ix 13o QJu IxQJ cdIx
w V*QJ QJt o Vc
txotoQJ
cdXuuQJIx
cduD h c QJ
CAcdc
QJQJ 3
c X Xo-tx QJ
>ucdQJ
cd
c XIxO
oCA
-XIoc
M xQJtAQJ 3
Id 13" qjIx > C
J9c O n
oX0 0ONI- H
G3C
CAG OJ
3 0 0Ixo
MX13QJ
Gcd
G Ix XIx uQJ
XH
3uuO
QJ2
rn (N
cd(XQJ
Q
3Ocn
20

Tabl
e 2.2
La
nd-u
se
chan
ge
(ha)
in
1989
in
Engl
and
(new
urba
n us
es)
eCflX > <aU OJd g
c
£
3O S > ^ a g■s *z
►.73* ?! 3 9* o O> £ S ICU 73 ■
c3
ssoU
=0 gfc 's 2 SIINH w
=0+4 tA
o .a ^ 25 3its
m•J3C012wOJOn
3CA
001
0 0 in in in in in O O O in O O OCt) NO 0 CN rH 00 NO CM rM m NO Os O000
CNCN
CNr H
NO rH COCMrH
rHIN O
CNm 0
CNr Hr H
OstN
CO0CN
O O in in 0 0 i n O LH O 0 in in O in(7s in NO in ON in NO on cO rH rM 00 ON inNO in CM 0 s© ON in on 0 in in
V© rH rH rH IN COrH
m
in o o o oCN rH
LOCO
in o o o o o
inIN 0 in 0 0 m 0 O m m O O O in inon rH LO 0 in rH rH CN O in on
CN CN rH in rH OrH
CNrH
IN
o m o o orH CO CN 0 0 CO CN
o00CO
o o m o in o c o CN c o o o sO nD
in00CO
in in in in in 0 O in O in in O 0 O Oon NO CO 00 IN IN CO CO CN O
00 rH rHrH
rH ON tN CO CNCN CO rH
in O in in in in in 0 0 0 0 0 in O OIN CN Os CO CO ON CN 0 00 00rH rH CO CO CN tN rH COrH rH CN rH
in o m o m i n o o ^ cnCO rH CN CN
O O O in 0 in i n in inrH CO NO NO NO ON 0 rH CNCO rH CO rH IN NO rH OsCN rH CO in
=073§
S C^ -S -5 c «c
ojD-. y OCA
CD
01
9&S Ph
O O QJ T3
S o
9cm
X»
3 3 P 03i 8 2 2 O a£ (VJ £ £ U >
in ov©tx CN
Q\00On
TJQJ
33QJ 00
CA £3flj <0CA * 33 u. 4-*“ QJ < 2
ONON
x>
3QJ
63ou,*>3wQJ
- 3
cQJ
64-*LhCOD hQJ
Q
3Ocn
21

Operational landMineral workingWith regard to mineral working, good quality information is available from thematic surveys in England and Wales. Using data from the 1982, 1988 and 1994 minerals surveys we can see an overall decrease of around 10% in the area with permission for surface mineral working (Figure 2.2). Similarly the area with permission for surface disposal fell by 21%, largely due to a recent decline in provision for the disposal of colliery spoil (Figure 2.3). The area of mineral workings with no provision for reclamation grew from 17 419 ha to 22 223 ha in 1994, thought to be due to the inclusion of new Interim Development Order (IDO) projects in the survey. Conversely, the area of surface disposal without reclamation provisions fell from 9596 to 8400 ha.
The area of land reclaimed has slipped back slightly from 28 388 ha in 1974-82 to 20 588 in 1982-88 and 19 133 in 1988-94; a reduction in the annual rate from 3549 ha per annum in 1974—82 to 3188 ha per annum in 1988-94. This is largely due to a reduction in the area of land reclaimed by 'other means' (meaning the amount of land reclaimed under Derelict Land Grant); the area reclaimed under mineral permissions has remained steady. Figure2.4 illustrates the area of mineral working reclaimed by mineral type since 1974; sand and gravel
continues to be the most extensive with 45.1% (8629 ha) in 1988-94, opencast coal accounting for 27.4% (5241 ha) in 1988-94 (DoE, 1996c). This is encouraging from the point of view of afforestation because both mineral types are reclaimed in strips adjacent to current extraction. Reclamation to woodland of exhausted strips can therefore make a high contribution to the screening of ongoing activity, and both land types generally suffer from relatively low post-mining damage.
Regional variations in the area reclaimed as a percentage of the area worked are shown in Table 2.3, the South West (10%) and Yorkshire/ Flumberside (14.6%) having the lowest reclaimed areas compared with total worked area; these areas therefore have the greatest backlog of reclamation work. The highest absolute amounts of reclamation carried out between 1988 and 1994 were located in the East Midlands - 21.5% (3614 ha), South East - 20.2% (3394 ha), and Northern - 17.6% (2972 ha) regions.
For Wales, the total area with permission for surface mineral working rose by 15% (1324 ha) between 1982 and 1988. Mid Glamorgan showed the greatest increase of 48% (865 ha), together with more modest increases in Dyfed and West Glamorgan (Figure 2.5). Conversely the area with permission for surface disposal fell by 20% (842 ha)
Figure 2.2 Total area of surface worked minerals in England in 1982/88/94
03T3cCDCO3o
CD
CD03
■ 1 9 8 2
□ 1 9 8 8
□ 1 9 9 4
Mineral type
Source: Department of the Environment, 1996d

Figure 2.3 Total permitted area for the surface disposal of mineral working deposits in England in 1982/88/94
14
12 —
□ 1988
□ 1994cn
o .£=
-C
CO 0
deep coal china clay sand / gravel limestone
Mineral type
remainder
Source: Department of the Environment, 1996d
Figure 2.4 Cumulative area of mineral working reclaimed in England since 1974 - main mineral types
■ 1 9 7 4 - 8 2
□ 1 9 8 2 - 8 8
□ 1 9 8 8 - 9 4
Mineral type
Source: Department of the Environment, 1996d
23

Table 2.3 Area of mineral workings reclaimed through mineral planning permissions, by standard region between 1988 and 1994
Region Reclamation by mineralpermissions (ha)
Reclamation by 'other means' (ha)
Total area reclaimed (ha)
% of total area reclaimed by mineral permissions
Reclaimed area as % of total area worked
Northern 2972 377 3349 88.8 33.3
North West 811 233 1044 77.7 23.5
Yorks & Humber 1592 330 1922 82.8 14.6
West Midlands 2431 158 2589 93.9 34.9
East Midlands 3614 807 4421 81.7 30.8
East Anglia 1121 6 1127 99.5 31.9
South West 904 237 1141 79.2 10.0
South East 3394 146 3540 95.9 23.8
Total 16 839 2294 19133 88.3 24.2
from 1982 to 1988. These reductions concentrated in the coal-mining areas of Mid Glamorgan and Gwent; the reductions in those areas were, however, offset by an increase of 72% (710 ha) in Gwynedd (Figure 2.6).
The Welsh survey records 1575 ha of land reclaimed under planning conditions between 1982 and 1988, 67% of which was concentrated in the three counties of Dyfed, Mid and West Glamorgan (Figure 2.7); opencast coal was by far the dominant category accounting for 72.4% (1141 ha). A further 823 ha was recorded as being reclaimed under subsequent planning permissions for other development or the Derelict Land Grant programme (Figure 2.8). Note that this represents 72% of all reclamation work in Gwynedd, 43% in Clwyd and 40% in Mid Glamorgan. Opencast coal is still dominant but other mineral types, especially slate wastes, are more significantly represented.
The new Minerals Planning Guidance (MPG 14 The Environment Act 1995: review o f mineral planning permissions, DoE, 1996e) represents a major step-up in the challenge of reclaiming mineral land. The guidance details provisions for voluntary restoration agreements for mines and quarries established from 1948 to 1982 with insufficient reclamation conditions (DoE, 1996e). This represents a considerable opportunity for local authorities to include forestry interests in their negotiation of new reclamation conditions and voluntary Section 106 agreements. This is felt to be
Source: Department of the Environment, 1996e
compatible with the development of a strategic approach to woodland expansion.
LandfillThe situation with regard to landfill sites is less well documented. The Government's Waste Management Strategy for England and Wales (HMG, 1995) seeks to move the emphasis in current practice up the waste management hierarchy from disposal to reduction. The Landfill Tax is one policy instrument which, it is hoped, will secure a reduction in the proportion of controlled waste going to landfill from 70% today to 60% by 2005. Nevertheless landfill will continue to be a significant land use in and around urban areas and there were over 3500 licensed landfills in the UK in 1992/3 (HMG, 1995). Although the rate at which land is allocated to landfill may decrease, the amount of land 'in the stock' is likely to continue to increase because it will not be easy for landfill operators to obtain a completion certificate, as required by the Environment Protection Act, 1990. Completion certificates will only be issued when sites are fully stable and this may take many decades; woodland therefore has potential as both an interim and long-term land use on closed landfill sites. The main challenge for the Forestry Commission is to underline the suitability of forestry as a long-term after-use on closed landfill sites, promoting this through government guidance and other means. The Landfill Tax rebate scheme is just one of a number of opportunities that could be pursued.
24

Figure 2.5 Surface mineral workings 1982-88 by county (Wales)
C/3"OcCOC/33o
CO
CO0
■ 1982 area permitted / authorised □ 1988 area permitted / authorised
County
Source: Welsh Office, 1991
Figure 2.6 Surface disposal of mineral working deposits 1982-88 by county (Wales)
co■ocCOCO
o
CO
CO0
1.8
1.6
1.4
1.2
1.0
0.8
0.6
0.4
0.2
0
■ 1982 area permitted / authorised D 1988 area permitted / authorised
County
Source: Welsh Office, 1991
25
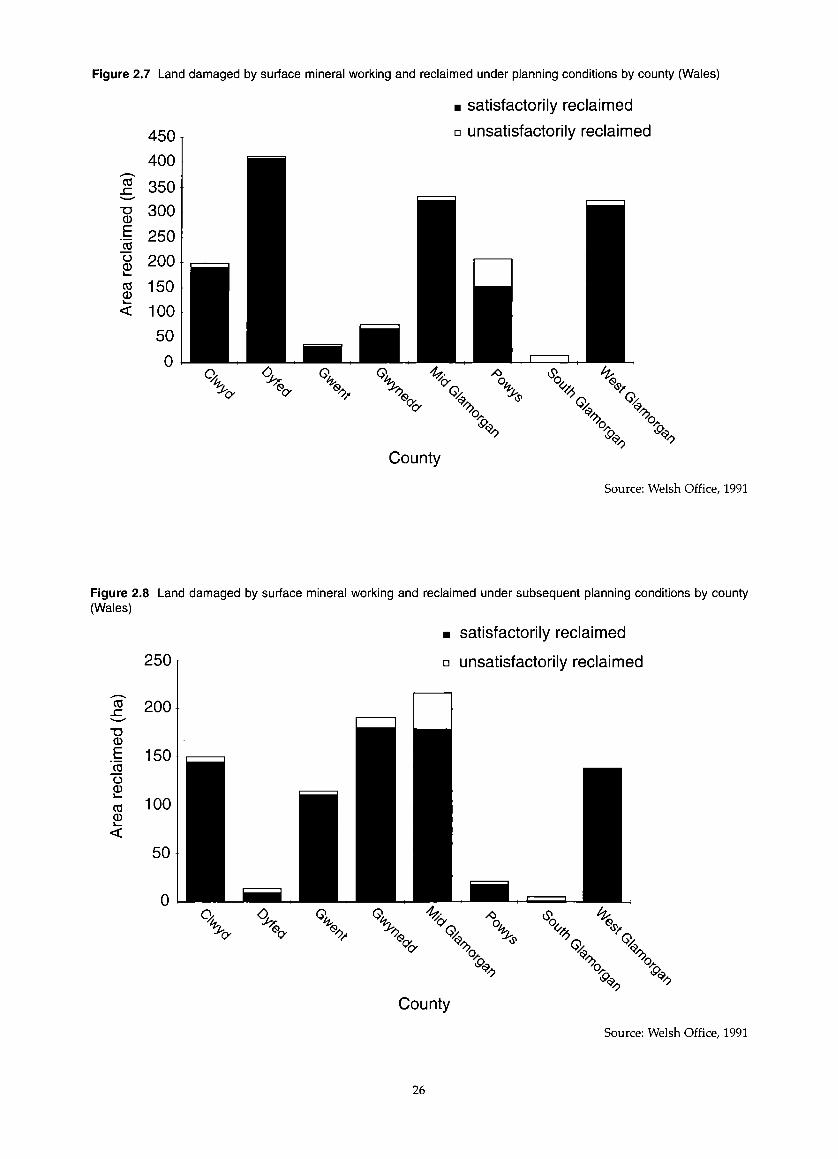
Figure 2.7 Land damaged by surface mineral working and reclaimed under planning conditions by county (Wales)
co
4 5 0
4 0 0
3 5 0
■ satisfactorily reclaimed
□ unsatisfactorily reclaimed
- o 3 0 0o| 2 5 0
| 200SS 1 5 0 <d< 100
County
Source: Welsh Office, 1991
Figure 2.8 Land damaged by surface mineral working and reclaimed under subsequent planning conditions by county (Wales)
CO
2 5 0
200
■ satisfactorily reclaimed
□ unsatisfactorily reclaimed
. i 1 5 0_coo0i—
00
1 0 0
County
Source: Welsh Office, 1991
26

Large industrial sitesStructural change within the wider economy, especially within the energy sector, is reinforcing a trend away from large industrial complexes towards smaller, shorter-life installations. There will be opportunities for limited woodland establishment in association with such development, but the principal challenge is to ensure that the maximum opportunity for afforestation is realised on the earlier generation of larger installations that have an operating life well into the twenty-first century.
In summary: the increasing standards required of mineral developers and waste disposal operators means that new dereliction on mineral working and landfill sites will be reduced. Planning conditions or agreements are likely to be more effective and should be backed up by good enforcement. There will, however, continue to be land released for restoration that is a potential resource for afforestation; this is particularly so with regard to the decreasing demand for agricultural production on reclaimed sites. The extent to which woodland is being created from operational land will be taken up in Chapter 3.
Vacant landLooking first at the DoE land-use change data, we can establish that in 1989 30% of all changes were rural-urban and 37% urban-urban. In all, 5555 ha was transferred from rural-urban uses in 1989. The data show a reduction in previously developed vacant land (V) of -785 ha in 1989, marking an upward trend in the annual reduction of this land nationally. The figure of -1125 ha for previously
undeveloped vacant land (X) is unreliable due to under-recording of change into this category by the OS (DoE, 1994b). Overall this appears to signify a reduction in vacant land areas in England towards the end of the 1980s. Data are unavailable to establish whether this national trend is continuing, but it seems likely that the stock of vacant land will be progressively reduced by urban infill while careful control of new development will restrict the creation of vacant land as 'space left over after planning'.
Changes out of the vacant land categories (V and X) are characterised by emphasis on hard end-uses: 89.4% (1820 ha) of category V and 93.5% (1085 ha) of category X. Only 215 ha of developed or undeveloped vacant land were recorded as changing to forestry/woodland/open space/ outdoor recreation. The key sources and after-uses of vacant land are illustrated in Table 2.4. This shows a cycling of land from industrial and commercial activities and transport/utilities into the residential sector (Bibby and Coppin, 1994). Underlying the cycles are a number of issues, such as privatisation, advances in technology making old plant redundant, and the decline of the railway network. Particularly interesting is the proportion of vacant land (both undeveloped and previously developed) coming into and out of residential and other urban uses. In 1989,8% of land going to new urban use was category X, 13% category V. In 1988 for residential use the figures were 12% and 9% respectively. Similarly, 44% of all new housing development was on land previously developed for urban purposes in 1991 (up from 38% in 1985 and 40% in 1988) (DoE, 1992c). Vacant urban land is thus being recycled
Table 2.4 Previous and after-uses of vacant land - England 1985-89
Use % all land becoming vacant (V,X)
% all land ceasing to be vacant (V,X)
% all land becoming despoiled (Z)
% all despoiled land ceasing to be vacant (Z)
Residential 14.1 54.7 1.3 21.8
Transport/utilities 15.5 8.4 13.3 9.4
Industrial/commercial 37.0 22.0 46.2 18.1
Community/related 5.1 3.6 2.7 2.3
Outdoor recreation 11.0 4.3 19.0 12.6
Minerals 2.4 1.1 1.4 11.8
Vacant 14.9 5.9 16.1 24.0
Other uses
Source: Department of the Environment, 1994b
27

more and more effectively for hard development and as such it will be difficult for woodland to compete. There is, however, growing concern in some quarters about the inevitability of development on vacant land and the long-term consequences for environmental quality.
What we see though is a great regional variation in the overall amount and speed of recycling. In 1988 there was 83% reuse of previously developed land in Greater London, 61% in the North West and only 41% in Yorkshire and Humberside. In this way we see that, in regions of the country with more depressed land markets and sluggish or dependent economies, the uptake of vacant land back into productive use will be considerably lower and slower than in more dynamic regions.
These findings point towards two alternative strategies with regard to woodland creation on vacant land.
• In more prosperous areas where recycling is fast, the resource is of limited value for woodland creation - even for short rotation coppice. However, in an area where urban density is increasing, there is a strong case for the preservation and encouragement of secondary woodland succession on identified sites. These might include railway sidings or individual plots where the process is suitably advanced. This is complementary to the priority now being given to sites of nature conservation that have developed on vacant land within urban areas.
• Conversely, in less prosperous and often less compact urban areas - such as former mining communities - with a highly fragmented
landscape and low recycling of vacant and other wastelands, there is potential for developing extensive multi-purpose woodlands. These will contribute to urban regeneration by providing an attractive setting for inward investment and creating good quality living and working conditions for the resident population.
Derelict landLooking at derelict land in England over time we see only a small reduction in stock levels since 1974, from 43 273 ha down to 39 600 ha (Table 2.5) and derelict land justifying treatment has actually increased from 33 068 ha to 34 566 ha. Despite significant investment through Derelict Land Grant (around £100 million per annum) during the most recent survey period (1988-93), the rate of land reclamation only just exceeded the rate at which new dereliction was being created (see below). Traditional forms of dereliction such as pit heaps and quarries have declined over the period 1974-93, but the category including 'general industrial' and 'other' dereliction almost doubled from 1974-93 (DoE, 1995b).
At the regional level there is strong localised variation in derelict land stock (Table 2.6) over the period 1974-93. In the South West, the East Midlands and the Northern regions there has been a systematic downward trend in derelict land (-14%, - 15% and -56% respectively). By contrast, in the North West, Yorkshire and Humberside and the West Midlands, the total amount of derelict land is today much as it was 20 years ago (although the nature and distribution of the problem has changed within each area). In East Anglia, the South East and Greater London, the total extent of dereliction is smaller and therefore subject to greater variation.
Table 2.5 Changes in the amount of derelict land by type of dereliction - 1974/82/88/93
Derelict land type 1974 1982 1988 1993 % change 1974-82
% change 1982-88
% change 1988-93
hectares hectares hectares hectares % % %
Spoil heaps 13 100 13 300 11 900 9 191 2% -11% -23%
Excavations & pits 8 700 8 600 6 000 5 807 -1% -30% -3%
Military dereliction 3 800 3 000 2 600 3 275 -21% -13% 26%
Other (1) 9100 8 200 6 400 5 615 -10% -22% -12%
8 600 12 500 13 600 15 713 45% 9% 16%
Total 43 300 45 600 40 500 39 600 5% -11% -2%
Note(1) Includes mining subsidence, general industrial dereliction and 'other' forms of dereliction
Source: Department of the Environment, 1995b
28
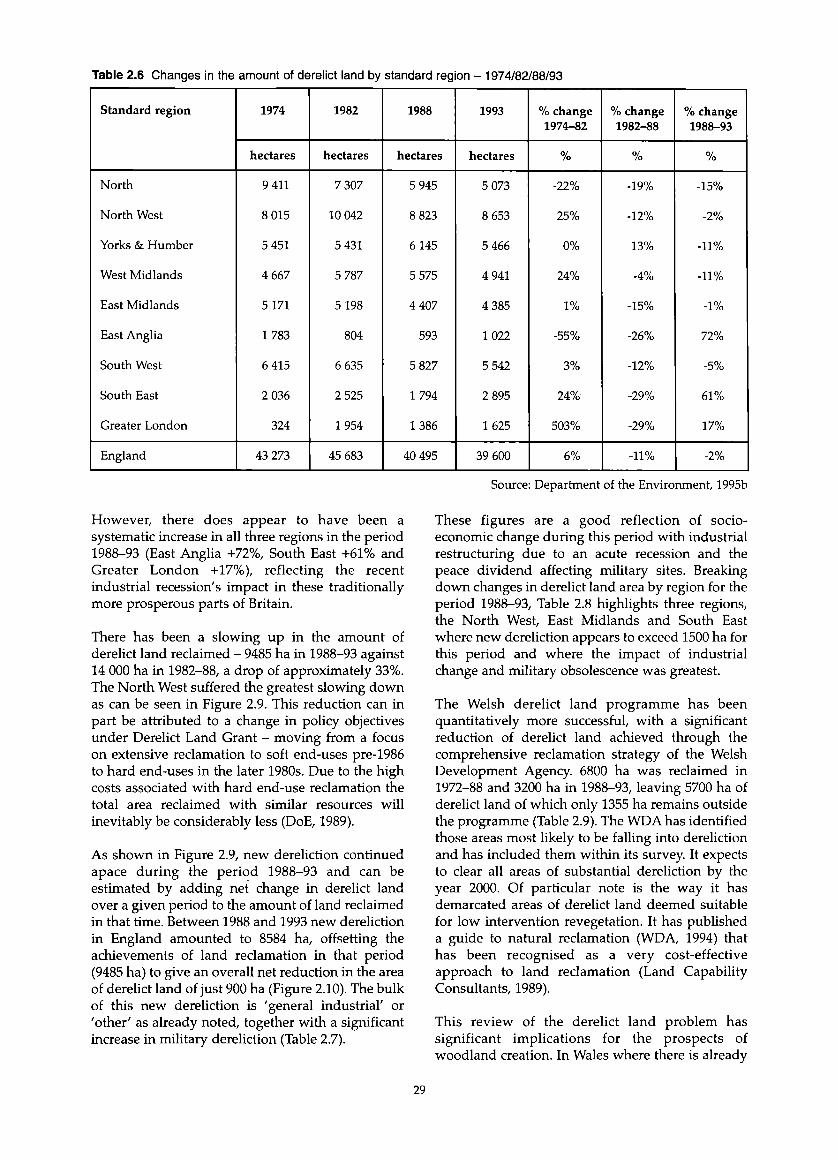
Table 2.6 Changes in the amount of derelict land by standard region - 1974/82/88/93
Standard region 1974 1982 1988 1993 % change 1974-82
% change 1982-88
% change 1988-93
hectares hectares hectares hectares % % %
North 9 411 7 307 5 945 5 073 -22% -19% -15%
North West 8 015 10 042 8 823 8 653 25% -12% -2%
Yorks & Humber 5 451 5 431 6 145 5 466 0% 13% -11%
West Midlands 4 667 5 787 5 575 4 941 24% -4% -11%
East Midlands 5171 5 198 4 407 4 385 1% -15% -1%
East Anglia 1 783 804 593 1 022 -55% -26% 72%
South West 6 415 6 635 5 827 5 542 3% -12% -5%
South East 2 036 2 525 1 794 2 895 24% -29% 61%
Greater London 324 1 954 1 386 1 625 503% -29% 17%
England 43 273 45 683 40 495 39 600 6% -11% -2%
However, there does appear to have been a systematic increase in all three regions in the period 1988-93 (East Anglia +72%, South East +61% and Greater London +17%), reflecting the recent industrial recession's impact in these traditionally more prosperous parts of Britain.
There has been a slowing up in the amount of derelict land reclaimed - 9485 ha in 1988-93 against 14 000 ha in 1982-88, a drop of approximately 33%. The North West suffered the greatest slowing down as can be seen in Figure 2.9. This reduction can in part be attributed to a change in policy objectives under Derelict Land Grant - moving from a focus on extensive reclamation to soft end-uses pre-1986 to hard end-uses in the later 1980s. Due to the high costs associated with hard end-use reclamation the total area reclaimed with similar resources will inevitably be considerably less (DoE, 1989).
As shown in Figure 2.9, new dereliction continued apace during the period 1988-93 and can be estimated by adding net change in derelict land over a given period to the amount of land reclaimed in that time. Between 1988 and 1993 new dereliction in England amounted to 8584 ha, offsetting the achievements of land reclamation in that period (9485 ha) to give an overall net reduction in the area of derelict land of just 900 ha (Figure 2.10). The bulk of this new dereliction is 'general industrial' or 'other' as already noted, together with a significant increase in military dereliction (Table 2.7).
Source: Department of the Environment, 1995b
These figures are a good reflection of socioeconomic change during this period with industrial restructuring due to an acute recession and the peace dividend affecting military sites. Breaking down changes in derelict land area by region for the period 1988-93, Table 2.8 highlights three regions, the North West, East Midlands and South East where new dereliction appears to exceed 1500 ha for this period and where the impact of industrial change and military obsolescence was greatest.
The Welsh derelict land programme has been quantitatively more successful, with a significant reduction of derelict land achieved through the comprehensive reclamation strategy of the Welsh Development Agency. 6800 ha was reclaimed in 1972-88 and 3200 ha in 1988-93, leaving 5700 ha of derelict land of which only 1355 ha remains outside the programme (Table 2.9). The WDA has identified those areas most likely to be falling into dereliction and has included them within its survey. It expects to clear all areas of substantial dereliction by the year 2000. Of particular note is the way it has demarcated areas of derelict land deemed suitable for low intervention revegetation. It has published a guide to natural reclamation (WDA, 1994) that has been recognised as a very cost-effective approach to land reclamation (Land Capability Consultants, 1989).
This review of the derelict land problem has significant implications for the prospects of woodland creation. In Wales where there is already
29

Figure 2.9 Amount of derelict land reclaimed per annum by standard region, 1982-88 and 1988-93 (annualised data)
cd
cc<D
700
600
500
400
300
200
100
average annual land reclaimed 1982-88 average annual land reclaimed 1988-93
■ I n
Standard region
Source: Department of the Environment, 1996d
Figure 2.10 Stock of derelict land and components of change (ha) 1988-93
’New’ dereliction
40 500 Stock of derelict land
Land reclaimed 1988
39 600
1993Source: Department of the Environment, 1991 ,1995b
30

Table 2.7 Stock of derelict land 1988/1993 by type and components of change
Derelict land type Stock 1988 Stock 1993 Change1988-93
Landreclaimed
1988-93
'New ' dereliction
hectares % hectares %
Spoil heaps 11 900 29% 9 191 23% -2 709 2 146 -563
Excavations/pits 6 000 15% 5 807 15% -193 945 752
Military 2 600 6% 3 275 8% +675 497 1 172
Railway 6 400 16% 5 615 14% -785 1 709 924
Other dereliction 13 600 34% 15 712 40% +2 112 4 187 6 299
Mining subsidence 1000 3% 674 2% -326 165 -161
General industrial 8 500 21% 9 749 25% +1249 2 811 4 060
'Other' forms 4100 10% 5 289 13% +1 189 1 211 2 400
Total 40 500 100% 39 600 100% -900 9 485 8 584
Source: Department of the Environment, 1995b
Table 2.8 Stock of derelict land 1988/93 by region and components of change
Standard region Stock 1988 Stock 1993 Change1988-93
Reclamation1988-93
'New'dereliction
hectares hectares hectares hectares hectares
North 5 495 5 073 -872 1 559 687
North West 8 823 8 653 -170 1 717 1 547
Yorks & Humber 6 145 5 466 -679 1 456 777
West Midlands 5 575 4 941 -634 1 467 833
East Midlands 4 470 4 385 -22 1 828 1 806
East Anglia 593 1 022 +429 147 576
South West 5 827 5 542 -285 575 290
South East 1 794 1 794 +1 101 485 1 586
Greater London 1 386 1 625 +239 252 491
England 40 500 39 600 -900 9 485 8 584
Source: Department of the Environment, 1995b
31

Table 2.9 Welsh derelict and reclaimed land (hectares) 1972/88/93
1972 1/4/88 1/4/93
Not in programme 13 765 4 201.21 1 355.11 (estimated)
In programme 4 155.4 4 352
Reclaimed without grant 978.6 1 478.6 (estimated)
Reclaimed with WDA grant 2 655.73 5 397.79
Reclaimed with WO grant 800 (estimated) 3 196.57 3 196.57
Sub-total 14 565 15 187.51 15 780 (estimated)
Low cost sites 2 549.33 2 549.33
Total 14 565 17 736.84 18 830 (estimated)
an established tradition of land reclamation to forestry (Lavender, 1981; Farmer, 1993), the programme is well advanced and the scope beyond the year 2000 may be somewhat limited. In England, by contrast, new dereliction has been created at a rate that matches the rate of reclamation. Consequently the total area of derelict land justifying treatment has increased slightly over the period from 33 068 ha in 1974 to 34 566 ha in 1993.
There is still, in principle, considerable scope for reclamation to forestry within the land reclamation programme in England. However, the 'new dereliction' that is dominated by the clearance of former factory sites and military installations may be rather less suitable than 'traditional dereliction' associated with mineral workings and railway land. Furthermore this may represent an historic legacy rather than a continuing process, and the emphasis in policy terms has very much moved towards preventing dereliction at source by, for example, more effective use of the planning system. Just as with vacant land there are marked and sometimes surprising differences in the regional pattern of dereliction. As Kivell has pointed out there is often a mismatch between areas of derelict land and areas of high demand for commercial and residential development (Kivell, 1987 and 1993), this reinforces the need for strategic consideration of reclamation to forestry and environmental after-uses.
Contaminated landThere is virtually no information in the public domain with which to assess the extent of contaminated land, and therefore the nature and rates of change are impossible to quantify. What we can consider are the changing definitions of contaminated land leading to the Environment Act
Source: Welsh Office/Welsh Development Agency, 1995
1995, and how these influence the probable extent of land included. The 1990 Environment Act (section 143) proposed the introduction of registers of land that had been put to contaminating uses; for this purpose a list of 40 potentially contaminating industries/uses was drawn up (DoE, 1990). Following widespread protests from landowners and businesses, these proposals were dropped and the provisions repealed in the Environment Act 1995. The main causes of concern were the potential for blighting land by its inclusion on the register (which was considered to be unreflective of the actual levels of contamination present), problems of establishing liability and the high costs of remediation. When the Government changed the number of potentially contaminating uses from 40 to 8 after consultation, the size of land area under consideration shrank to between 10-15% of the original coverage.
The definition adopted by the Government in the Environment Act 1995, focuses on actual or possible 'harm' and is far narrower than the previous definition. 'Harm' is taken to include harm to the health of living organisms, ecological systems, property and controlled waters. As already noted in Chapter 1, the Environment Act 1995 puts an obligation on local authorities to investigate their areas for such land 'from time to time'; where it is found they may designate special sites and require remediation.
While the Environment Act 1995 sought to narrow the definition of contaminated land, the 1990 Act had sensitised landowners and the business community to the problem. Market perceptions about the extent of contaminated land are now very different from the official position. The market's interest in the extent and levels of contamination will probably lead to it
32

distancing itself from land with even partial contamination; this would be a reflection of worries over the tightening of future liabilities and definitions as well as the high costs of establishing precise contamination levels. The 'suitable for use' policy indicates that action to clean up contaminated land need only take place where 'there are appropriate and cost-effective means to do so'. What this means in practice is that large areas of land identified by desk study as potentially contaminated may in effect become isolated from parts of the development cycle, due to the substantial increase in survey costs required to fully evaluate contamination and the complexity of establishing historical liability.
The Parliamentary Office of Science and Technology evaluated the costs of various investigative stages of contaminated land related to the scheme for contaminated land registers that was contained in Section 143 of the EPA 1990, since repealed under the Environment Act 1995. The results showed that an initial survey to ascertain all potentially contaminated land through desk study (100-2000 ha) was approximately £15 million. However, to categorise these sites into high/medium/low risk through site audit would cost a further £250-500 million (@ £2500/ha). It is feared that these costs would be prohibitive in many cases, thereby condemning much land identified as potentially contaminated to be 'blighted' (POST, 1993).
This analysis suggests that concern about land contamination will significantly inhibit recycling of 'brown land' sites for development. While this may have undesirable consequences for sustainable development (pushing the emphasis towards greenfield sites), it brings new opportunity for woodland creation. Such 'dysfunctional' land would represent excellent long-term forestry opportunities. Of course, one would need to establish that the general levels of contamination were below levels likely to prejudice use as amenity woodland or to prevent tree growth.
ConclusionThis chapter has gone some way to clarify the dynamics of urban and industrial wasteland. It is clear that on certain categories of land, in more prosperous areas, turnover rates are such as to rule out forestry as an extensive end-use. There is, however, a case even here for conserving emerging woodland on vacant land as part of a wider strategy to maintain environmental quality and to conserve biodiversity. In more depressed areas where development land is not at such a premium (as in former coal-mining districts), woodland creation can be an important tool in the wider process of urban regeneration, creating an attractive setting for both local residents and inward investment.
In Wales the land reclamation programmes of the Welsh Development Agency and their local authority partners have reduced the stock of derelict land significantly. In England the total stock of derelict land is much as it was 25 years ago because the land reclamation programmes have been matched by new dereliction. However, the type of land within the stock has changed - there are fewer spoil heaps and more industrial and military dereliction.
In the future it seems likely that the economy will continue to deliver significant areas of new land through mineral working, waste disposal and structural change within industry. The derelict land associated with former industry is likely to be contaminated by past use. Concern about land contamination will inhibit recycling of 'brown field' sites even in the most prosperpous areas, so opening up the alternative of forestry as a long-term after-use. The next chapter examines the suitability of the urban and industrial wastelands for forestry and the effectiveness of current reclamation practice.
33

Chapter 3
The effectiveness of land reclamation to woodland
IntroductionAt first sight urban and industrial wastelands present an unpromising environment for woodland. The substrates available for plant growth range from relatively unmodified former agricultural soils on neglected land to wastes and overburden materials with physical and chemical properties which may severely inhibit plant growth. It follows that the chemical definition of soil as 'the unconsolidated mineral and organic material at the Earth's surface that is capable of supporting plant growth' needs to be broadened here to include materials that have 'the potential to support plant growth' (Hollis, 1991). This chapter explores the extent to which that potential is being realised with regard to woodland.
The physical environmentLand reclamation of damaged and disturbed lands to forestry has a long and distinguished history in England and Wales. In the early years of the twentieth century, experimental plantings on derelict land were carried out quite extensively in the Black Country. Afforestation continued between the wars and was given a substantial boost in the 1960s by the publication of an influential Civic Trust report, Derelict land - a study o f industrial dereliction and how it may be redeemed (1964). This brought together the research findings of the Forestry Commission with successful practical forestry initiatives on a range of substrates. In advocating the case for forestry the Civic Trust stated:
"It used to be thought that trees could not be successfully established on spoil heaps or hill-and- dale unless the ground was first levelled and consolidated, or given years to settle, and a hole was dug and filled with soil fo r each individual tree. All this has gone by the board in the last
fifteen years. It is now known that levelling and consolidation, so fa r from being indispensable, is a positive hindrance to the establishment o f tree growth in raw shale or heavy overburden. Crude mattock planting straight into the raw mineral, in holes just big enough to accommodate the roots o f small saplings, gives results no worse (and fa r cheaper) than elaborate spadework and imported soil. Failures once regarded as evidence that
climatic conditions or the nature o f the ground were hopelessly unfavourable are now attributed to easily remediable errors in technique and choice o f species."
Pioneering work by R.F. Wood and J.V. Thirgood, of the Forestry Commission, had shown that the general environment is often of far greater importance to tree growth than any special attributes of the spoil heap. Of the factors that make up this general environment the most important was said to be exposure and such biotic factors as 'rabbits and small boys with penknives' (1955).
The Lower Swansea Valley is one area where these principles were put to the test in forbidding circumstances. This area was massively devastated by metal smelting throughout the nineteenth and early twentieth centuries; when the bulk of production finally ceased in the 1930s, the valley represented one of the most substantial and serious concentrations of dereliction in England and Wales. Following partially successful experiments at tree planting on spoil tips, efforts were concentrated on re-establishing woodlands outside of site boundaries that had been devastated by airborne pollutants (Banwell, 1967). After initial vandalism, it was realised that the projects would not be successful without the aid of schools and children to develop community involvement. Otherwise 'the work undertaken would almost certainly be wasted' (Banwell, 1967). By 1980 some 450 000 trees had been planted (including 250 000 by the Forestry Commission), dramatically improving both landscape and amenity throughout the valley (Lavender, 1981).
Subsequently, progress in land reclamation to forestry has been underpinned by well-focused research programmes sponsored by the Research Councils (especially NERC), the Department of the Environment and the Forestry Commission. Moffat and McNeill (1994) provide an excellent review of research findings by the Forestry Commission and others, which is distilled into good practice guidance for reclaiming disturbed land to forestry. Their report spells out what needs to be done before, during and after reclamation in order to ensure successful afforestation. While the focus is
34

very much on land restoration from mineral working, covering the full range of industries and their substrates, due attention is also paid to the problems and opportunities presented by waste disposal to landfill, derelict land and contaminated land. It is clear that while further research is needed in a number of areas, especially older landfill sites and contaminated land, there is the technical knowledge on hand to support land restoration to forestry on almost all categories of substrate. The three decades since the 1964 Civic Trust report on derelict land have also brought a significant improvement in air quality, with smoke and sulphur dioxide pollution being reduced to a fraction of historic levels in urban areas (Royal Commission on Environmental Pollution, 1995).
The social environmentThe early researchers emphasised that the general environment, rather than specific attributes of the site, is likely to be critical for successful tree growth on derelict land (Wood and Thirgood, 1955). The most recent guidance on the creation and management of woodlands around towns recognises the crucial importance of working with local people (Hodge, 1995). It is at least as important to match the new woodlands to the needs and aspirations of local communities as it is to match them to the requirements of the physical environment.
The Lower Swansea Valley project had to grapple with burning and vandalism, and demonstrated that community involvement is the only effective
Table 3.1 Effectiveness of landscape management operations on land reclamation schemes in St Helens and Knowsley, Merseyside
Operation Average %
GrassPedestrian flail 67%Ride on 56%Gang mowing 50%Rotovation 50%Raking up 40%Tractor flail 38%Litter pick 33%
TreesStake replacement 25%Plant replacement 25%Weedkilling 23%Tie adjustment 19%Pruning 12%Fertiliser application 10%
Totals 28%
Source: Groundwork Trust, 1986
solution. That pioneering work has been taken forward on many fronts, not least by the Groundwork Trusts and Community Forest projects where energy is focused on urban regeneration through community involvement in environmental improvement.
The process of establishment is a critical one on the demanding substrates of urban and industrial wastelands, and forest transplants are therefore best suited to these conditions. These plantings are also less conspicuous and thus less prone to vandalism; on very difficult sites they may be coppiced immediately after planting. By contrast larger trees, such as heavy standards with their inevitable stake, almost seem to invite vandalism. In fact, even here, it seems that damage due to vandalism is much exaggerated and that tree losses due to ineffective management are much more severe (Bradshaw and Walmsley, 1995). This is borne out by a survey of after-management on land reclamation schemes in St Helens and Knowsley (Merseyside), where maintenance operations on trees and woodlands were much less effective than, for example, grass cutting (Groundwork Trust, 1986) (Table 3.1). A systematic review of the factors influencing the aftercare of landscape restoration projects in the Borough of Sefton showed that, for projects carried out under contract, it is at hand-over on practical completion that projects are most vulnerable (Groundwork Trust, 1989).
On derelict and neglected land, the chances of successful establishment are further enhanced if the local community is involved in the process of land restoration. There are various modes of community involvement (Figure 3.1) and the results on the ground improve as we move up the hierarchy from consultation towards empowerment. Where local people are fully involved in the planning, design and implementation of landscape restoration projects, successful results can be obtained even in the most unpromising circumstances. Furthermore, the project itself will bring benefits to those involved through enhanced social cohesion and the sense of achievement that comes through real involvement. It is not surprising that survey work has established that tree planting by properly trained and well- motivated volunteers, accompanied by well- planned aftercare, supports the highest levels of establishment. It should also be recognised that community involvement has significant costs associated with it, through the employment of skilled project officers, and these costs need to be built into project budgets.
These techniques have been employed to particularly good effect in the Wasteland to Woodland project in St Helens (Box 3.1). However, even here, in a well- managed programme with a high level of
35
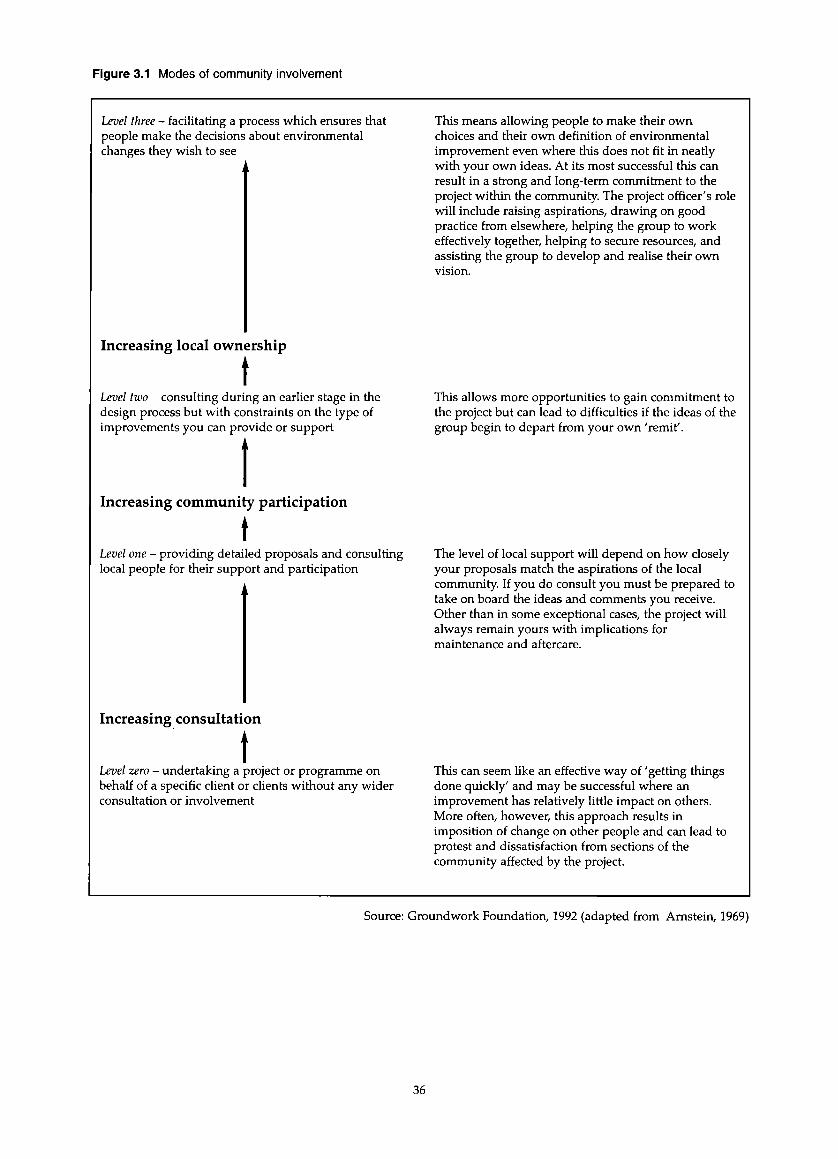
Figure 3.1 Modes of community involvement
Level three - facilitating a process which ensures that people make the decisions about environmental changes they wish to see
This means allowing people to make their own choices and their own definition of environmental improvement even where this does not fit in neatly with your own ideas. At its most successful this can result in a strong and long-term commitment to the project within the community. The project officer's role will include raising aspirations, drawing on good practice from elsewhere, helping the group to work effectively together, helping to secure resources, and assisting the group to develop and realise their own vision.
Increasing local ownershiptLevel two - consulting during an earlier stage in the This allows more opportunities to gain commitment todesign process but with constraints on the type of the project but can lead to difficulties if the ideas of theimprovements you can provide or support group begin to depart from your own 'remit'.
Increasing community participation
Level one - providing detailed proposals and consulting local people for their support and participation
The level of local support will depend on how closely your proposals match the aspirations of the local community. If you do consult you must be prepared to take on board the ideas and comments you receive. Other than in some exceptional cases, the project will always remain yours with implications for maintenance and aftercare.
Increasing consultation
tLevel zero - undertaking a project or programme on This can seem like an effective way of 'getting thingsbehalf of a specific client or clients without any wider done quickly' and may be successful where anconsultation or involvement improvement has relatively little impact on others.
More often, however, this approach results in imposition of change on other people and can lead to protest and dissatisfaction from sections of the community affected by the project.
Source: Groundwork Foundation, 1992 (adapted from Amstein, 1969)
36

Box 3.1 The Wasteland to Woodland project, St Helens
'Wasteland to Woodland' is a strategic approach to the restoration of damaged and neglected land in the Borough of St Helens, Merseyside. Here, landowners, industrialists and the local planning authority are working together on a long-term restoration programme with woodland as the preferred end-use.
In 1989, more than a quarter of the land to the south and east of St Helens was either damaged or neglected, much of it operational land associated with mining, industry and waste disposal.
In the first four years of the project:• 270 000 trees were planted on 20 sites;• over 7000 people (especially school children) were involved in the project;• £2.5 million was invested by project partners of which £1.6 million was private sector money;• 404 ha of land were identified for action;• 109 ha were treated and 66 ha of woodland were created.
Key elements of this project were:• co-operative working through a steering group bringing together major landowners and operators;• a responsive local authority prepared to renegotiate historically arcane planning consents;• appointment of a project officer within a supportive working environment (the local Groundwork
Trust)• full support of the Mersey Community Forest.
community involvement, losses through burning and interference from unconstrained motorcycle scrambling present a severe challenge. The rough grasslands which often provide the most suitable planting opportunities are prone to burning, especially in the late summer and early spring when high levels of biomass are present under dry conditions (Figures 3.2 and 3.3). Guidelines suggesting ways in which fire damage can be minimised have been drawn up by the Wasteland to Woodland project team in consultation with the Forestry Commission (Figure 3.4). Off-road motorcycle scrambling is a more intractable problem and here new solutions are urgently required.
The multiple benefits of afforestationWoodland on urban and industrial wastelands brings a variety of benefits in addition to that of timber production, the traditional justification for forestry. The National Urban Forestry Unit (NUFU) is researching the non-timber benefits of urban woodland. At a seminar to define the research agenda (NUFU, 1992) it identified a variety of benefits of potential importance in the urban environment:
• Pollution amelioration: the air-conditioning effect of trees in towns has long been recognised but not fully monitored in the UK. These effects could have a significant impact on improving public health in British towns and cities.
• Land and property values and the stimulation o f inward investment: a green wooded environment
is seen as a prosperous environment and this inspires confidence.
• Shelter, and energy conservation: shelter effects that reduce heating and cooling bills could be of significant financial value.
• Community environmental perceptions: urban woodlands can enhance community perceptions of local environments and can yield a wide variety of social, physical, intellectual and psychological benefits.
• Landscape management savings: urban landscapes continue to be managed in a very expensive style. As resources become more restricted, urban forestry may offer one of the lowest-cost options for landscape management in urban areas.
The wider economic benefits of establishing community forests in the urban fringe have been assessed by the Forestry Commission (Table 3.2). The net present value of woodlands in the Mersey Community Forest, one of the largest projects of its type in England, ranges from £7.8 to £88.5 million, depending on the underlying assumptions.
As this demonstrates, in addition to their contribution to landscape and amenity, woodlands on urban and industrial wastelands can bring more tangible benefits. Moffat and McNeill (1994) nicely summarised the benefit of trees on the environmental management and engineering of disturbed land (Box 3.2). Furthermore, these sites
37
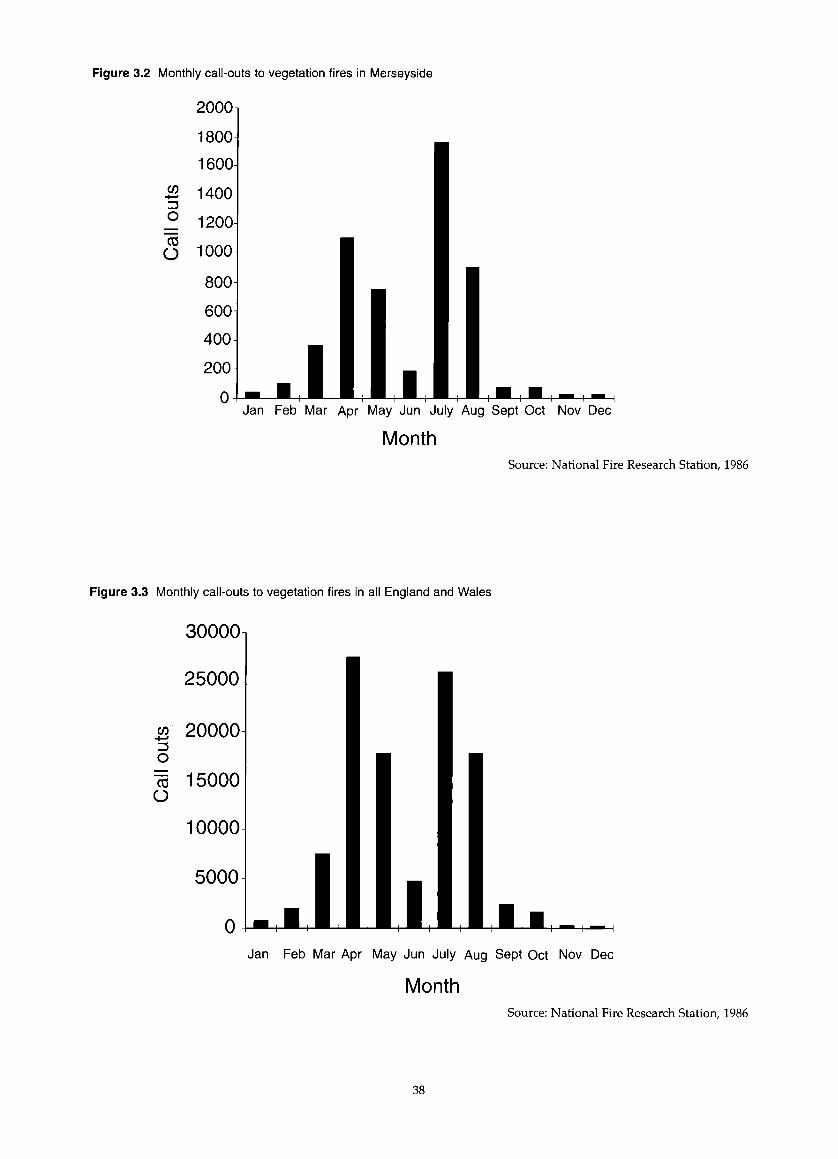
Figure 3.2 Monthly call-outs to vegetation fires in Merseyside
CO-*—>13O
"coO
MonthSource: National Fire Research Station, 1986
Figure 3.3 Monthly call-outs to vegetation fires in all England and Wales
3O
O
MonthSource: National Fire Research Station, 1986
38

Figure 3.4 Factors contributing to the risk of fire damage, restriction of burning and subsequent recovery
PREVENTION
Source: Wasteland to Woodland/Forestry Commission
39

Table 3.2 Summary of resource costs and benefits of the Mersey Community Forest
Low Medium High Type Time
Costs Land £14 828 601 £18 751 356 £25 961 820 Financial Infinite
Forestry costs £20 231 006 £41 977 906 £43 228 838 Financial 1 rotation
Recreationcosts
£873 375 £1 872 704 £2 340 880 Financial Infinite
Project team costs
£1 689 099 £2 345 971 £2 345 971 Financial Infinite
Grantadministration
£1 681 724 £1 681 724 £1 681 724 Financial 1 rotation
Total costs £39 303 805 £66 629 661 £75 559 233
Benefits Timber revenue £4 710 769 £5 542 081 £6 151 710 Financial 1 rotation
Carbon fixing £0 £3 279 240 £4 922 829 Non-market 1 rotation
Recreation £38 028 100 £78 772 494 £146 408 136 Non-market Infinite
Donations £4 386 983 £5 524 815 £6 537 603 Financial Infinite
Job creation (1) 107 149 196 Non-market Infinite
Education (2) 336 716 336 716 336 716 Non-market Infinite
Total benefits £47 125 852 £93 118 630 £164 020 328
Net Present Value £7 822 047 £26 438 969 £88 461 095
Notes(1) Sustained full-time jobs arising from the project (2) School children provided for (age 5-10)
Source: Forestry Commission, 1992
Table 3.3 Comparisons of tree growth by site and species in South Wales
Sites Performance (average yield class)
Scots pine Corsican pine Lodgepole pine Japanese larch
Opencast sites 6 9 6 5
Colliery tips in situ 9 12 10 8
Normal soil in area 12 14 11 (est.) 11
can produce timber, and the colliery spoil tips planted in the 1960s are now yielding useful timber products. The infertile substrates are often quite well suited to conifers such as Corsican Pine (Jobling and Carnell, 1985). In South Wales trees on colliery spoil performed better than trees on opencast sites (Table 3.3), emphasising the problems
Source: Broad, 1979
such as compaction associated with regrading and soil spreading (Broad, 1979). The development of deep ripping techniques to relieve compaction and of preventive methods of soil placement - for example, loose tipping - has been an important focus for research in recent years (Moffat and McNeill, 1994).
40

Box 3.2 Engineering effects of trees
Rainfall interception - The degree of rainfall interception is somewhat determined by annual rainfall and its seasonal distribution. However, measured interception rates of conifers in upland Britain vary from 0.19-0.62; for broadleaved crops interception rates are generally smaller, ranging from 0.1-0.36. It is now generally accepted that conifers act to reduce water supply to the ground compared with grass or agricultural crops, and in certain parts of the UK broadleaves may also act in this way. In turn, a smaller water supply will lead to a reduction in water leaving the reclaimed site. This may be important where, for example, soil or spoil materials are susceptible to water erosion, or on landfill sites where the quantity of leachate production is directly related to the amount of effective rainfall.
Storm hydrograph - Because of the canopy structure, the storm run-off hydrograph of streams issuing from woodland cover is much less peaked, and run-off velocity is also reduced.
Soil erosion - Woodland management is preferable to arable farming on substrates prone to water and wind erosion, because the tree cover generally acts to protect the soil. Care must be taken in the early years of establishment on sensitive materials such as pulverised fuel ash (PFA).
Soil restraint - Roots of 1-12 mm diameter physically restrain the soil particles from movement caused by gravity, water and wind. Trees are able to prop otherwise unstable or loose boulders and stones, preventing them from rolling down slopes.
Soil moisture depletion - Vegetation, including trees, can modify soil moisture content markedly, generally by reducing moisture content relative to unvegetated soil. The result is a reduction in pore-water pressure in saturated soils, and an increase in soil-suction in unsaturated soil.
Soil shear strength - Tree roots can markedly increase soil shear strength.
Source: Moffat and McNeill, 1994
Table 3.4 Average annual maintenance costs of urban vegetation
Regime Average annual costs (£/ha)
years 1 - 9 years 10 - 50
Amenity grassland 50% mown by hand £2200 £2200
Amenity grassland 10% mown by hand £1690 £1690
'New Town' style woodland £1040 £1220
Woodland in urban parks £980 £720
Meadow grassland £760 £760
Rough grassland £620 £620
Naturally colonising woodland £360 £530
Pioneer style woodland £300 £550
Source: Land Use Consultants, 1996a
The cost-effectiveness of woodlandNUFU undertook a comparative study of the relative cost of maintaining different types of urban vegetation. It showed that informal woodlands (naturally colonising and pioneer style) that have provision for casual public access can be consistently cheaper to manage than any of the various types of urban amenity grassland (Land
Use Consultants, 1996a). Only around half the cost of urban woodland maintenance is tree-related. The other half is accounted for by path and signboard maintenance, litter collection and wardening. Consequently as the degree of public access increases so does the maintenance cost, but even in public parks the cost of woodland maintenance compares favourably with that of managed grassland and meadows (Table 3.4).
41

Table 3.5 Assessment of use and performance of sites - mean scores for after-uses
Public open space (POS)
Agr
icul
ture
Woo
dlan
d
Nat
ure
cons
erva
tion
Rec
reat
ion
Mix
ed
<0.5 ha 1-2 ha 5-10 ha >10 ha Temporary
Safety 19.5 19.5 17.9 20.0 20.0 18.6 18.8 18.9 16.5 18.1
Land-use compatibility 20.0 20.0 20.0 20.0 15.0 20.0 20.0 20.0 20.0 20.0
Visual benefit 13.7 12.0 15.2 14.7 13.0 13.9 13.2 14.4 13.3 15.9
Amenity use 13.0 13.6 15.0 15.5 10.2
OO00 13.9 9.4 14.1 13.2
Nature conservation 2.9 10.6 14.1 13.2 4.7 4.7 14.3 11.6 3.1 10.3
Total 13.8 15.1 16.4 16.7 12.6 13.2 16.1 15.0 13.4 15.5
The cost-effectiveness of woodland has also been demonstrated in a comparative study of land reclamation to soft end-uses (Land Capability Consultants, 1989). They reviewed 100 sites covering a range of land reclamation projects in the following categories:
• public open space (POS);• recreation;• agriculture;• woodland;• nature conservation;• mixed.
In terms of capital cost, land reclamation to forestry compares very favourably with other uses; only larger POS sites (more than 10 ha) and land reclamation for nature conservation are cheaper. The performance of sites was assessed by using criteria for
• safety;• land-use compatibility;• visual benefit;• amenity use;• nature conservation.
The mean scores for after-use and performance are shown in Table 3.5 where the results for woodland compare very favourably with other restoration options. When data on capital costs and performance are combined the effectiveness of woodland is clearly shown Figure 3.5. This reflects the low capital costs of reclamation, in particular the use of in situ rather than imported soils. It should be noted that the capital cost figures in Figure 3.5 are based on a weighted mean which takes account of the frequency with which the various components of reclamation costs are incurred.
Source: Land Capability Consultants, 1989
Maintenance costs of the woodlands in this survey, all of which were managed by local authorities, were of the order of £300-400 per annum during the four- or five-year establishment phase and £80-140 per annum subsequently. No account was taken of income from forest products. When gross maintenance and capital cost are compared for various after-uses (Figure 3.6), woodlands tend to perform particularly well. In most land reclamation schemes woodlands are incorporated as a long-term feature. It is therefore essential that consideration is given at the outset not only to how the plantation will be managed, but also to the possibility of achieving a financial return. In practice that may be difficult to achieve in the first rotation where, on difficult substrates, pioneer species such as birch and alder are predominant and where conifers may be ruled out, perhaps without good reason, on grounds of landscape amenity.
Short rotation forestryAs in upland Britain, so on the urban and industrial wastelands, it is likely to be poorer land which is made available for long-term forestry use. Flowever, there are significant opportunities for establishing highly productive short rotation crops on land of higher quality but where the future use is uncertain. The NUVIL project (New Uses for Vacant Industrial Land) in Knowsley, Merseyside, pioneered the introduction of woodland including short rotation coppice to vacant industrial land. The aims of the NUVIL project, which was established in 1989 are:
• To create new employment opportunities in woodland creation, woodland management and the timber industry;
42

Figure 3.5 Capital costs and performance of restoration options
2 0
1 9
1 8
° 1 7to i /o o c 0 E o
t 0 Q_
1 6
1 5
1 4
1 3
1 2
111 0
0
NATPOS 4
POS 3 ■
MIXEDWOOD1
POS 2
AGRIC REC
POST
POS 1 = <0.5ha POS 2 = 1-2ha POS 3 = 5-1 Oha POS 4 = >10ha POS T = Temporary
POS 1
1 0 1 5 2 0 2 5 3 0 3 5
Capital costs (£ thousand / ha)
4 0 4 5 5 0
Source: Land Capability Consultants, 1989
Figure 3.6 New Uses for Industrial Land (NUVIL) - a biomass plantation before and after development
After 5 yearsShort-term biomass plantation surrounded by forestry
Biomass on 3 year cropping cycle
Forestry on 40-120 year cropping cycle
M n e r y e a r sNew industrial development on cleared biomass in woodland setting
(Source: NUVIL Advisory Group, 1994. Artwork R. Macdonald)
43

• To increase the total area of woodland within Knowsley; and
• To bring vacant land back into beneficial use, to improve the condition of land and through this the image of the industrial sector within Knowsley
It was always recognised that, should development materialise on land zoned for industry, it would take precedence over forestry as a land use and, in one sense, it would be the ultimate mark of success of the project. In practice the 72 ha of new woodland created during the first five years of the project have remained inviolate (NUVIL, 1994a). Three broad categories of woodland have been created:
• Short rotation (3 year) biomass 10 ha
• Medium rotation (10 years) coppice 20 ha
• Long rotation (50 years + ) woodland 42 ha
Forest products (wood chips, willow pegs, willow wands, charcoal and timber) from the short rotation crops are expected to make a significant contribution to project income during the 1990s (NUVIL, 1994b).
Table 3.6 Black Country Open Space Survey
The importance of natural successionLeft to itself even the most hostile area of urban and industrial wasteland begins to take on a new life. Leaching, microbial activity and weathering all tend to ameliorate soil toxicity, though nutrient deficiency may still hold back natural succession. Nitrogen is of critical importance here; it is present in low quantities in most waste materials and skeletal soils and the accumulation of nitrogen depends on biological activity, especially nitrogen fixation (Harris, 1991).
Data from the Black Country Open Space Survey supplied by the National Urban Forestry Unit (Table 3.6) illustrates the importance of natural colonisation in contributing to the woodland cover in and around urban areas. Almost half (49%) of the woodland cover (some 1706 ha) in the Black Country has come from this source. The Black Country Survey also provides useful data on the potential for new woodland by planting on bare ground, amenity grassland and long unmanaged grassland (1516 ha) (NUFU, 1995).
The benefits of natural succession are now being recognised (Rodwell and Patterson 1994, Jarvis
Existing woodland
Area in hectares
Sandwell Dudley Walsall Wolver'ton Total
(a) establishing woodland (planted 0-15 years)
125 58 86 52 321
(b) emerging woodland (natural colonisation)
392 594 551 169 1706
(c) mature woodland (15 years plus) 292 565 362 230 1449
Total woodland (a+b+c) 809 1217 999 451 3476
Potential for new woodland
Area in hectares
Sandwell Dudley Walsall Wolver'ton Total
(d) Bare ground (bare, recently disturbed) 294 114 229 148 785
(e) Amenity managed grassland (regularly cut)
749 787 1192 679 3407
(f) Long unmanaged grassland (unmown grass)
270 289 685 272 1516
Total potential for new woodland 1313 1190 2106 099 5708
Source: National Urban Forestry Unit, 1995
44

Figure 3.7 Comparison of gross maintenance costs and capital cost for various after-uses
co.c
wCO■4—*COoo0ocCOc0
’coECOCOo
<5
1000,
900
800
700
600
500
400
300WOODa
200POS 3
NAT POS 4 . \ •
100 WOOD
0 --------------- 1---------- 1—
REC
POS 2
AGRIC
VMIXED
POST
POS 1
POS 1 = <0.5ha POS 2 = 1-2ha POS 3 = 5-1 Oha POS 4 = >10ha POS T = Temporary
0 10 15 45 5020 25 30 35 40
Capital costs (£ thousand / ha)
Source: Land Capability Consultants, 1989
Table 3.7 Proportion of seed types by intensity of urbanisation in naturally colonising woodland
Light windblown seed
Heavy windblown seed
Bird dispersed seed
Avon (lightly urbanised) 1% 40% 56%
South Staffordshire (moderately urbanised) 56% 26% 16%
West Midlands (intensely urbanised) 91% 1% 7%
1997). Rodwell and Patterson argue that natural colonisation of unwooded sites is preferable to planting for new native woodlands because of the natural matching of tree species to site conditions and the irregular structure and informal appearance that results. Natural colonisation is also more likely to conserve local genetic distinctiveness and diversity than planting with young trees of uncertain provenance.
Research by the Forestry Commission suggests that woodland creation by natural colonisation is a slow and uncertain process (Hodge, 1995). Of some 47 abandoned urban and urban edge sites, only 20% of quadrats examined were sufficiently colonised for woodland creation within 10 years of abandonment; a figure which persisted for a further 25 years. Intense competition from grasses and frequent burning will hold back colonisation on fertile ground, whereas nutrient deficiency and soil toxicity will operate on industrial wasteland.
Source: Hodge, 1995
Another key factor is the availability of seed and consequently urban woodlands created by natural colonisation tend to be somewhat species poor (Hodge, 1995; Hodge and Harmer, 1996). Their data (Table 3.7) suggests that the proportion of seed types present may itself be a function of the intensity of urbanisation.
As Rodwell and Patterson (1994) make clear, where natural regeneration is thought likely to be inadequate and on sites isolated from seed-parents, planting will be necessary to establish new woodlands with the proper diversity of trees and shrubs. Hodge (1995) also concludes that colonisation should be used primarily to augment rather than create woodlands. Despite these reservations, as Table 3.6 demonstrates, the potential for woodland creation by natural colonisation is significant and woodland grant regimes need to lend it their full support.
45

ConclusionThis chapter has explored the effective creation of woodland on urban and industrial wastelands. We now have the scientific understanding and practical techniques at our disposal to establish woodlands successfully on a wide range of substrates. The social environment is also now better understood; through effective community involvement the chances of success will be greatly improved bringing significant benefits to people as well as trees.
Forestry brings social, environmental and economic benefits to damaged and vacant land. It is a cost-
effective option where soft end-uses are envisaged in derelict land reclamation schemes, rivalled only by nature conservation, which it is well able to complement. Indeed natural succession provides an alternative route towards woodland creation. On better quality land, which has been taken out of production in anticipation of development, the prospects for forestry as a long-term land-use seem at first sight less promising. But even here, short rotation crops such as biomass and conventional coppicing offer a promising interim land-use. For these and other reasons, forestry is a natural choice for all categories of urban and industrial wasteland. In the next chapter the extent to which this potential has been realised in practice is explored.
46
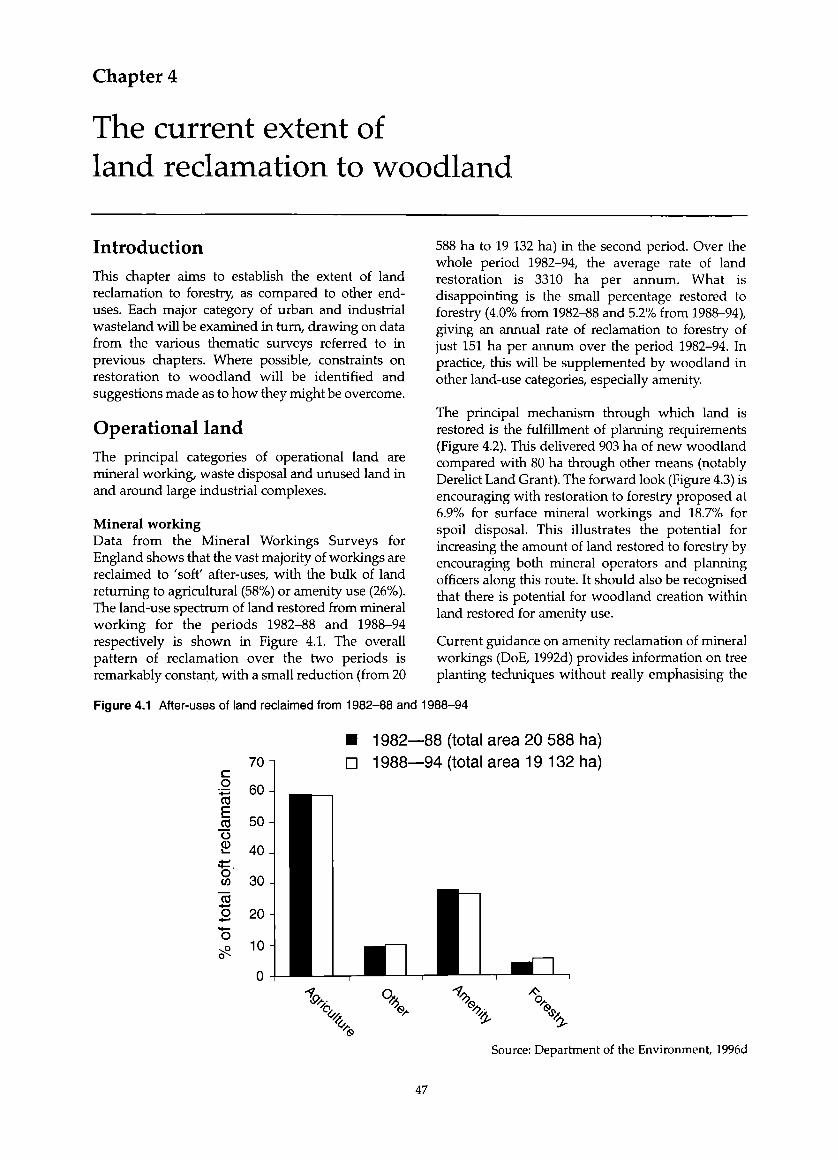
Chapter 4
The current extent of land reclamation to woodland
IntroductionThis chapter aims to establish the extent of land reclamation to forestry, as compared to other end- uses. Each major category of urban and industrial wasteland will be examined in turn, drawing on data from the various thematic surveys referred to in previous chapters. Where possible, constraints on restoration to woodland will be identified and suggestions made as to how they might be overcome.
Operational landThe principal categories of operational land are mineral working, waste disposal and unused land in and around large industrial complexes.
Mineral workingData from the Mineral Workings Surveys for England shows that the vast majority of workings are reclaimed to 'soft' after-uses, with the bulk of land returning to agricultural (58%) or amenity use (26%). The land-use spectrum of land restored from mineral working for the periods 1982-88 and 1988-94 respectively is shown in Figure 4.1. The overall pattern of reclamation over the two periods is remarkably constant, with a small reduction (from 20
588 ha to 19 132 ha) in the second period. Over the whole period 1982-94, the average rate of land restoration is 3310 ha per annum. What is disappointing is the small percentage restored to forestry (4.0% from 1982-88 and 5.2% from 1988-94), giving an annual rate of reclamation to forestry of just 151 ha per annum over the period 1982-94. In practice, this will be supplemented by woodland in other land-use categories, especially amenity.
The principal mechanism through which land is restored is the fulfillment of planning requirements (Figure 4.2). This delivered 903 ha of new woodland compared with 80 ha through other means (notably Derelict Land Grant). The forward look (Figure 4.3) is encouraging with restoration to forestry proposed at 6.9% for surface mineral workings and 18.7% for spoil disposal. This illustrates the potential for increasing the amount of land restored to forestry by encouraging both mineral operators and planning officers along this route. It should also be recognised that there is potential for woodland creation within land restored for amenity use.
Current guidance on amenity reclamation of mineral workings (DoE, 1992d) provides information on tree planting techniques without really emphasising the
Figure 4.1 After-uses of land reclaimed from 1982-88 and 1988-94
coCOE
_C0o<D
OV)
i§O
■ 1982—88 (total area 20 588 ha) □ 1988—94 (total area 19 132 ha)
■ a
%
Source: Department of the Environment, 1996d
47
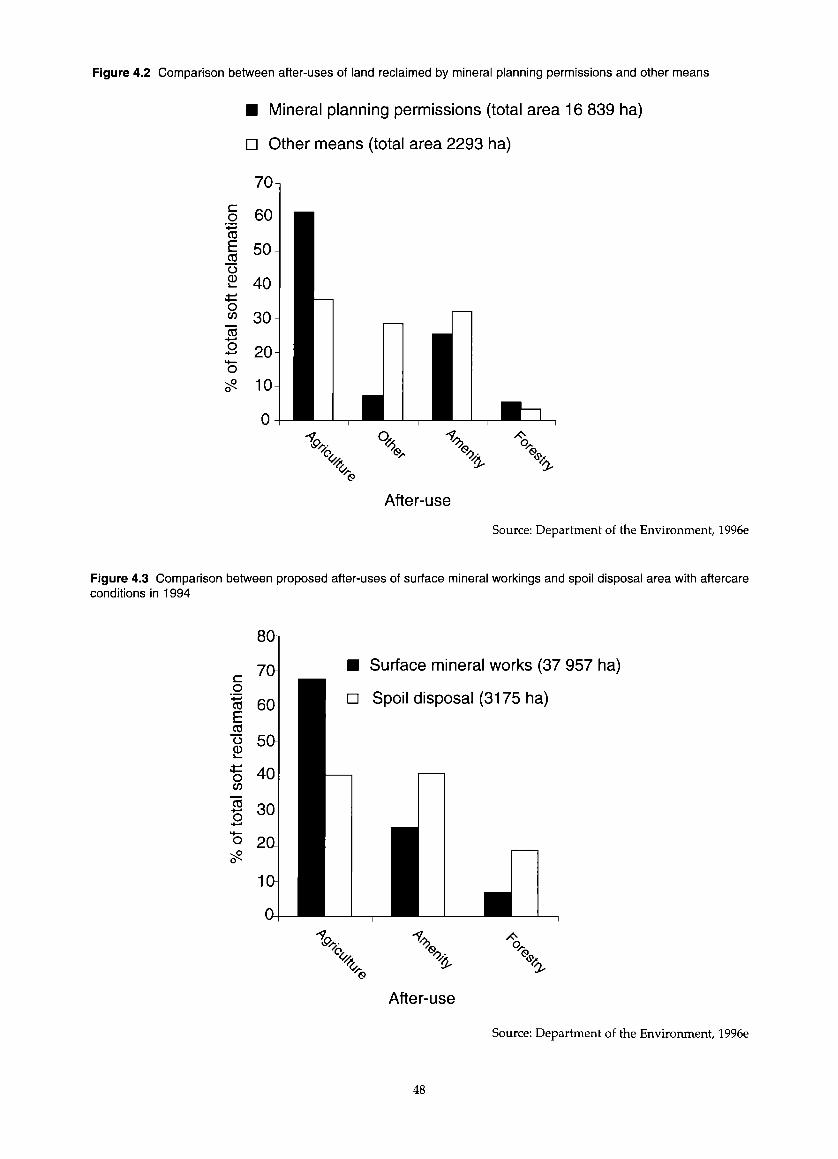
■ Mineral planning permissions (total area 16 839 ha)
□ Other means (total area 2293 ha)
70
Figure 4.2 Comparison between after-uses of land reclaimed by mineral planning permissions and other means
After-use
Source: Department of the Environment, 1996e
Figure 4.3 Comparison between proposed after-uses of surface mineral workings and spoil disposal area with aftercare conditions in 1994
■ Surface mineral works (37 957 ha)
□ Spoil disposal (3175 ha)
X'9 -
%
After-use
Source: Department of the Environment, 1996e
48

Figure 4.4 After-uses of land reclaimed between 1988-94 - main mineral types
■ Sand & gravel (8626 ha)
£ | Opencast coal (5241 ha)
I Limestone / dolomite (927 ha)
□ Clay / shale (852 ha)
□ Deep-mined coal (1692 ha)
Agriculture Other Amenity Forestry
After-useSource: Department of the Environment, 1996e
contribution that woodland can make within an amenity landscape. In general, landscape architects may be seeking to produce amenity landscapes that replicate the traditional English pastoral landscape without taking full advantage of the potential for woodland creation through mineral working.
Figure 4.4 shows the breakdown of restoration activity by mineral type. There are marked differences in percentage restoration to forestry with coal, both opencast (9.1%) and deep-mined (6.8%), significantly higher than other mineral types which are all less than 3%. These differences do not seem to coincide with land capability potential of different substrates, as described by Moffat and McNeill (1994); indeed the overburden associated with restored opencast coal working can be especially difficult (Bending, Moffat and Roberts, 1991). The small percentage of land restored to forestry from sand and gravel workings (2.8%) is surprising and of some significance, given that this is the largest category by area in the minerals survey.
There are also marked regional differences, both in the proportion of restored land going to forestry and in that specified under planning consent. The proportion of land reclaimed for forestry varies from1.3% in East Anglia to 9.2% in the Northern region.
Similarly, the area of land specified for forestry under planning conditions ranges from 3% in East Anglia to 11.9% in the South West, with the Northern region at11.3%. These differences are partly a reflection of land use and landscape character in the areas concerned, but may also reflect subjective influences of the decision-makers in the regions concerned.
In Wales, there has in the past been a strong tradition of land restoration to forestry. It is somewhat surprising that this is not reflected in the most recent data on restored land (Figure 4.5). Similarly, land reclamation to forestry is not a strong feature of land reclaimed under subsequent planning conditions (Figure 4.6, Welsh Office, 1991).
Given the physical potential of minerals land for forestry, it is surprising that this is not a more significant end-use in both England and Wales. There is clearly scope for encouraging greater awareness of the benefits of afforestation, as a principal land-use and within amenity landscapes, with both mineral operators and planning officers. Older planning consents are now subject to review through the Environment Act 1995; this presents an important opportunity to increase the woodland cover in land restoration from mineral working.
49

Area
(n
a)■ Agriculture
□ Forestry
□ Amenity
Figure 4.5 After-use of land reclaimed satisfactorily under planning conditions by county (Wales)
County
Source: Welsh Office, 1991
Figure 4.6 After-use of land reclaimed satisfactorily under subsequent planning conditions by county (Wales)
■ Agriculture
■ Forestry
□ Amenity□ Other
County
Source: Welsh Office, 1991
50

LandfillBy contrast with that available for m ineral w orking and derelict land, inform ation is difficult to obtain about the fate of land restored through landfill operations. Given the experience of m ineral w orking and the fact that, until recently, tree planting was officially discouraged on landfill sites (DoE, 1986), the extent of woodland establishment is likely to be limited. However, recent research has established that, far from threatening the integrity of landfill sites, tree planting is likely to im prove landfill performance (Moffat and Houston, 1991; Dobson and Moffat, 1993) besides bringing a variety of landscape amenity and other benefits. There is significant opportunity to establish new woodlands on former landfill sites and to ensure that, in future, woodland features significantly as a specified after-use in planning permissions and license agreem ents when new schem es are proposed.
Large industrial sitesNo data are available on the extent of woodland creation on large industrial sites. It may be possible to increase woodland cover as part of a systematic
review of the landscape potential of major industrial sites targeted at key industries, for example, the power and water utilities.
Vacant landNo data are available on the extent of woodland creation on vacant land except for derelict land (categories Z and P). It can be inferred from the land-use change data in Table 2.4 that the proportion going to woodland is negligible compared with other uses. The NUVIL project demonstrates that in those regions where the local economy is depressed and land turnover rates are low, urban forestry provides a beneficial and practical interim land-use.
Derelict landIn England, in the period 1988-93, some 56% of derelict land was reclaimed to 'soft' after-uses, 44% to 'hard'; this compares with 63% and 27% respectively in the period 1982-88 (DoE, 1995b). The key players in land reclamation to soft end-uses are the local authorities. Land reclamation for hard end- use is dominated by other agencies, especially development corporations and the private sector.
Table 4.1 Amount of derelict land reclaimed and in use by end-use and rural/urban location - 1 April 1993
Inner city Other urban Rural Total
ha % ha % ha % ha %
Hard end-uses 1137 66% 1990 51% 591 21% 3718 44%
Industry 365 22% 764 20% 170 6% 1139 16%
Commerce 285 17% 264 7% 84 3% 653 8%
Residential 245 14% 637 16% 43 1% 924 11%
Sports & recreation buildings 31 2% 130 3% 18 1% 179 2%
Other development 190 11% 174 4% 277 10% 642 8%
Soft end-uses 581 34% 1891 49% 2253 79% 4725 56%
Agriculture 81 5% 158 4% 598 21% 837 10%
Forestry / woodland 119 7% 256 7% 242 9% 617 7%
Public open space 311 18% 966 25% 292 10% 1568 19%
Outdoor recreation 53 3% 450 12% 871 31% 1375 16%
Nature conservation 16 1% 61 2% 250 9% 328 4%
Total 1178 100% 3881 100% 2844 100% 8442 100%
Source: Department of the Environment, 1995b
51

■ Agriculture
Figure 4.7 Amount of derelict land reclaimed and brought back into soft end-use 1988-93, by standard region
1200
CC
cd<D
□ Forestry / Woodland
□ Public open space
□ Outdoor recreation
n Nature conservation
X* X x x xx v ^X X %
Region
Source: Department of the Environment, 1995b
Figure 4.8 Potential after-uses of derelict land - All Wales
cd
9 0 0 0
8 0 0 0
7 0 0 0
6 0 0 0
5 0 0 0
<? 4 0 0 0
■ Reclaimed by Welsh Office
■ Reclaimed by Welsh Development Agency
b Reclaimed without grant
□ New programme / in progress
□ Not in programme
□ Low-cost sites
Potential after-useSource: Welsh Office, 1991
52

Information on the amount of derelict land reclaimed by end-use is given in Table 4.1 for the period 1988-93. During this period, 617 ha of new woodland/forestry was created on derelict land (123 ha per annum), representing 13% of the total reclaimed to soft end-use. It is important to note that the proportion of land restored to woodland in the inner city and urban fringe is almost as great as that in rural areas.
The regional pattern of reclamation to soft end-use is shown in Figure 4.7. As with minerals, it is in the Northern region where land restoration to forestry is most marked. In Wales as in England, reclamation to public open space/amenity is the dominant soft end- use, but land reclamation to forestry is also significant (Welsh Office/WDA, 1995).
Forestry is one of the more cost-effective soft end-uses for derelict land schemes. This is now beginning to be reflected in the proportion of land being restored to woodland. In Wales, land reclamation programmes are well advanced. In England, the stock of derelict land remains much as it was 20 years ago but the composition has changed. The rate of land reclamation will need to be substantially increased in order to reduce the backlog because new dereliction is still being created by structural economic change. It is best to think of this as a process to be managed rather than a problem to be solved.
Land restoration to forestry and woodland has an important role to play, especially within the community forests and other priority areas. English Partnerships - working with local authorities and the proposed regional development agencies - has a key role in ensuring that this potential is realised. The Forestry Commission will wish to ensure that woodland creation features as a key objective in the land reclamation strategies prepared annually by local authorities for English Partnerships.
Contaminated landNo data are available on conversion to woodland; nor do we have reliable data on the amount of contaminated land itself. There is a significant mismatch between the Government's narrow definition of contaminated land - which has sought to minimise the problem - and private sector perceptions, where concerns about contamination are now a major deterrent to recycling of 'brown' land, especially for sensitive end-uses such as housing. While this creates difficulties for urban policy, by diverting development pressure on to greenfield sites it creates an opportunity for forestry.
Plutchings and Moffat (1997) reviewed the potential for establishing woodland on contaminated land in a discussion paper presented to the steering group for
this project. As they point out, if trees are to be used for the safe and effective reclamation of 'contaminated' land, we must first gain a good understanding of the factors that influence the success of tree establishment. This includes an understanding of the long-term fate of both metal and organic contaminants within forest and woodland ecosystems. Unfortunately, both these subject areas are poorly understood and research is urgently needed to clarify the position.
Key factors which influence the mobilisation and cycling of potentially toxic elements (PTEs) within soil are: pH, organic matter content and leaching. While woodland may increase mobility of heavy metals by soil acidification, this will be counteracted by immobilisation on organic matter (which is more abundant in woodland soils) through reduced leaching (due to rainfall interception and evapotranspiration). The establishment of woodland may also reduce the risk of soil erosion by wind and water, thereby further limiting the spread of contamination. Research is needed to clarify the relative importance of these processes.
A second, more speculative benefit, is that trees may be valuable for their phyto-remediation properties, in order to 'clean up' the contamination. In natural ecosystems, trees act to filter and recycle potentially toxic substances generated by natural processes such as mineral weathering (Alloway, 1990). Phytoremediation uses this principle to immobilise, convert and remove contaminants generated by people. There is now great interest in the development of in situ methods of remediation which, unlike landfill or on-site containment, do not transfer the problem to another site or another generation (Wood, 1997). The indications are that woodland ecosystems may act as a sink for pollutants such as heavy metals, so preventing wider environmental contamination. They might also play an active part in the phyto-remediation of organic residues, reducing them to carbon dioxide and water, rather than simply storing or immobilising them (Ferro et al., 1997).
Overall conclusionsHutchings and Moffat (1997) conclude that tree establishment on moderately contaminated land appears to represent a cost-effective approach but that further research is needed to establish clear guidance on risk assessment, site preparation, species suitability, planting strategy and management implications. Despite the suitability of damaged and disturbed land for woodland, forestry is not well recognised as an after-use. In many cases, the proportion of restored land dedicated to woodland is less than that which already exists in England and Wales as a whole. However, marked
53
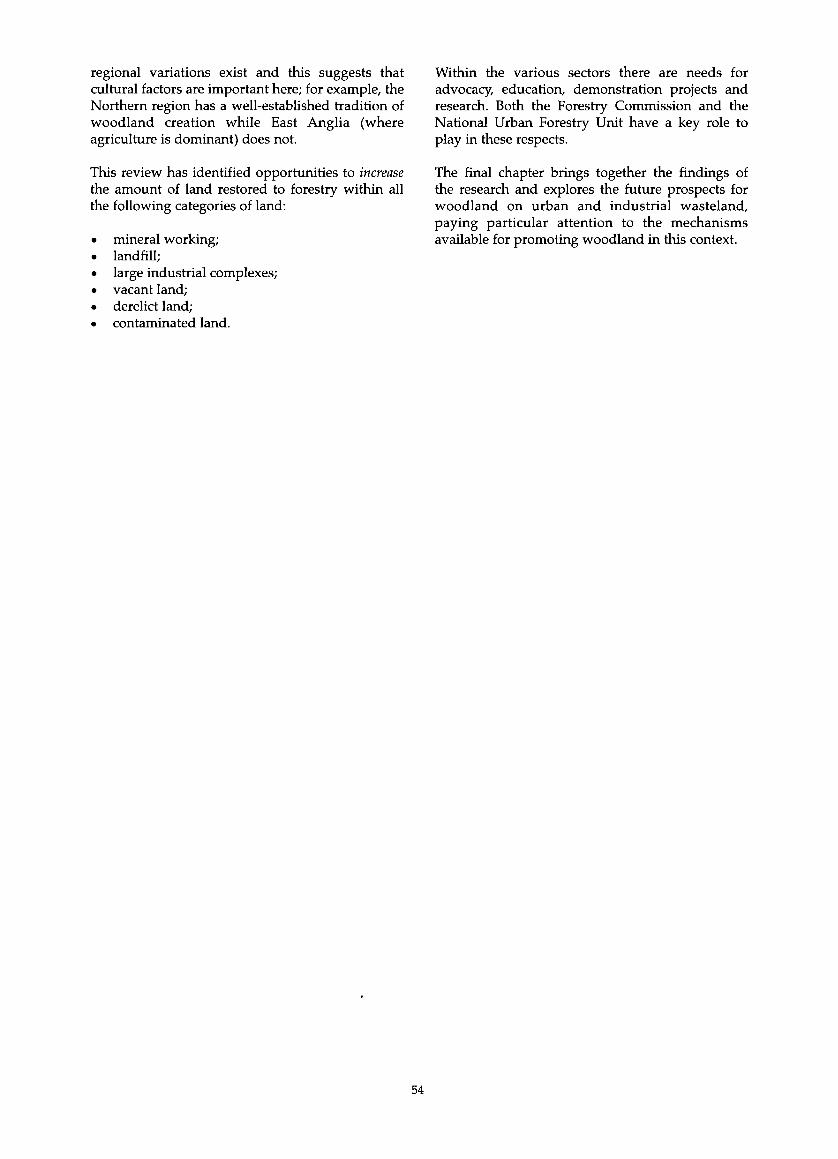
regional variations exist and this suggests that cultural factors are important here; for example, the Northern region has a well-established tradition of woodland creation while East Anglia (where agriculture is dominant) does not.
This review has identified opportunities to increase the amount of land restored to forestry within all the following categories of land:
• mineral working;• landfill;• large industrial complexes;• vacant land;• derelict land;• contaminated land.
Within the various sectors there are needs for advocacy, education, demonstration projects and research. Both the Forestry Commission and the National Urban Forestry Unit have a key role to play in these respects.
The final chapter brings together the findings of the research and explores the future prospects for woodland on urban and industrial wasteland, paying particular attention to the mechanisms available for promoting woodland in this context.
54

Chapter 5
The prospects for woodland on urban and industrial wasteland
IntroductionThis chapter draws on the full range of information gathered for this report and reviews the prospects for increasing woodland cover by utilising damaged and neglected land. We begin by revisiting the policy context and especially the response to consultation about woodland expansion targets. Competing claims on the land are evaluated and forestry is seen to be broadly compatible with both hard and soft end-uses. Information about the amount of land and future potential within each category of urban and industrial wasteland is summarised. Finally, suggestions are made about how best to achieve woodland creation by bringing forestry into the mainstream of the urban regeneration process, using existing and proposed institutional structures.
The policy contextFollowing policy developments at the global and European levels favouring the conservation and expansion of woodland cover, with particular emphasis on the environmental and social benefits of multi-purpose forestry, the UK Government has outlined its policy response in Sustainable forestry - the UK programme (HMSO, 1994a). The policy identifies two main objectives:
• the sustainable management of our existing woods and forests; and
• steady expansion of tree cover to increase the many diverse benefits that forests provide.
The recent consultation paper on a revised UK Strategy for sustainable development - Opportunities for change - invites views on how forestry can most effectively make its contribution to sustainable development (DETR, 1998b). The consultation paper points out that the UK imports almost 80% of the timber and wood products consume in Britain and observes that:
'we could reduce the burden on overseas forests, as well as contributing to a range of domestic sustainable development initiatives such as regeneration and extension of woodland
habitats and renewal of damaged landscapes, by appropriate planting of new woodlands and by managing existing ones more productively' (DETR, 1998).
In this respect, urban and industrial wastelands have been identified as a potential land resource for afforestation, of particular importance due to their general location in proximity to population centres. This fact, combined with the wider benefits of productivity and cost-effectiveness, has led to support for their restoration to forestry after-uses in the UK Sustainable Forestry Programme, the Rural White Papers and in the G overnm ent's recently published forestry strategy for England. At the operational level, they are emphasised in the Countryside Commission's National Forest and community forest strategies.
Woodland creation: consultation on needs and opportunitiesIn 1996 the Forestry Commission and Countryside Commission published a joint consultation paper - Woodland creation: needs and opportunities in the English countryside (Forestry Commission/ Countryside Commission, 1996). The paper asked four questions:
• Why do we need new woodlands?• What types of woodland do we need?• Where should new woodlands be sited?• How do we get more woodland?
Overall, respondents showed strong support for a continuing increase in woodland area in England.
It is interesting to compare the sentiments reflected in the report with the findings of a recent household interview survey commissioned by Groundwork in four urban areas (Porth, Blackburn, Dartford and St Helens). In this, 55% agreed and 35% agreed strongly that it is important to ensure that we pass on good woodland areas for future generations (Opinion Leader Research, 1998). The same Groundwork survey established equally strong support for tree planting in towns as in the countryside.
55

The incidence of derelict land (as found in the 1993 survey for the Department of the Environment, DoE, 1995b) was proposed as a key indicator in defining woodland opportunity areas in the consultation paper, Woodland creation (Forestry Commission/Countryside Commission, 1996). Consultees identified strong benefits associated with the planting of derelict land, including landscape enhancement, improved stability, generation of an economic return and improved image resulting in enhanced land values. The main problems, which have already been explored in Chapter 3 of this report, were said to include uncertainties about planting on landfill sites, problems of ground contamination and slow growth rates on derelict land substrates.
Competing land uses and the appropriateness of woodland creationThe consultation paper, Woodland creation (Forestry Commission/Countryside Commission, 1996) recognised both the importance of competing land uses (such as agriculture and nature conservation) and the appropriateness of woodland planting in relation to landscape character and distinctiveness. In some parts of the country, mainly on best quality (Grades 1 and 2) farmland, there is a continuing case for restoring disturbed land from mineral working to agriculture. But as this report shows (Chapter 4) the extent of land restoration from all categories of land to woodland is surprisingly low and there is scope for a significant shift in both restoration practice and planning requirements.
Conflict with nature conservation is at first sight unlikely on damaged and neglected land, but nature conservation is now recognised as a very cost-effective and beneficial end-use (Land Capability Consultants, 1989; Land Use Consultants, 1996b; Handley, 1996). Experience within the Community Forest projects suggests that, provided good quality ecological survey information is to hand, conflict can be avoided and, with proper design, these uses are often complementary (Hodge, 1995).
Many respondents to Woodland creation (Forestry Commission/Countryside Commission, 1996) emphasised that new woodland, in terms of its composition and scale, should reflect local character and sense of place. The Joint character map o f England, published in November 1996 by English Nature and the Countryside Commission exemplifies this, which can provide a guiding framework for the development of indicative forestry strategies. Respondents considered that woodland is especially appropriate in urban and
urban-fringe locations, forming 'a green girdle around towns and new development' together with 'green wedges and green corridors within urban areas'. A recent study of the distribution of derelict land in the Mersey Community Forest showed that it is precisely in the 'community urban fringe', close in around the built-up areas, where derelict land is most concentrated (Cakebread, 1997).
Here again, there is potential conflict because of the pressing need to recycle land which has previously been developed (the so-called 'brown land') for hard end-uses, especially residential development. An important driver here is the projected increase of 4.4 million households in England over the period 1991-2016. While this household projection should by no means be equated with house building, the pressure for urban expansion in considerable. The Government is committed to making towns and cities more sustainable and to reduce the need for development to spread into the countryside (HMG, 1998).
One of the measures proposed is to increase the proportion of new homes to be built on previously developed land from 50% to 60%. Far from presenting a barrier to woodland creation on brownfield sites, these two policy objectives are both compatible. This is because of the geographical mismatch between the prevalence of urban 'wasteland' and development pressure. And, because the key to land recycling is the creation of an attractive and credible setting for development, they are complementary. The Government's policy statement stresses that the key issues in planning for the projected increase in household numbers should relate to quality: 'the quality o f life that we create, the quality o f living environments we make and the degree o f choice that we can offer for all types o f households' (HMG, 1998). The work of the National Urban Forestry Unit (NUFU) is important here, demonstrating as it does the contribution that increasing the scale of tree and woodland cover can make to quality of life and local prosperity within urban areas (Chapter 3).
The dynamics of urban and industrial wastelandThe consideration of dynamics is of primary importance because of the need to establish the potential availability of land for afforestation. The following model and formula have been developed in order to establish the key parameters describing stock dynamics and availability for forestry, as shown in Figure 5.1.
If derelict and despoiled land is to be used for forestry, we need to know something about all of
56
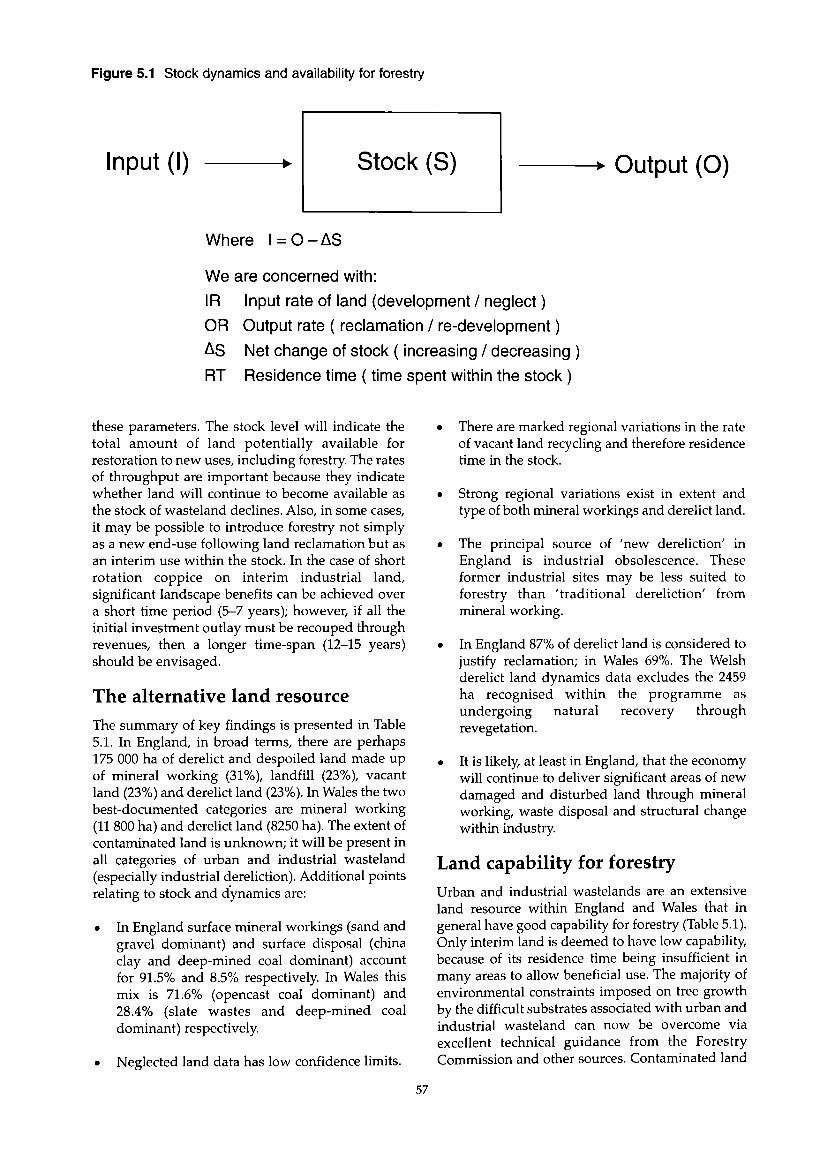
Figure 5.1 Stock dynamics and availability for forestry
Input (I)
Where l = 0 - A S
Output (0)
We are concerned with: IR Input rate of land (development / neglect) OR Output rate ( reclamation / re-development) As Net change of stock ( increasing / decreasing ) RT Residence time ( time spent within the stock )
these parameters. The stock level will indicate the total amount of land potentially available for restoration to new uses, including forestry. The rates of throughput are important because they indicate whether land will continue to become available as the stock of wasteland declines. Also, in some cases, it may be possible to introduce forestry not simply as a new end-use following land reclamation but as an interim use within the stock. In the case of short rotation coppice on interim industrial land, significant landscape benefits can be achieved over a short time period (5-7 years); however, if all the initial investment outlay must be recouped through revenues, then a longer time-span (12-15 years) should be envisaged.
The alternative land resourceThe summary of key findings is presented in Table 5.1. In England, in broad terms, there are perhaps 175 000 ha of derelict and despoiled land made up of mineral working (31%), landfill (23%), vacant land (23%) and derelict land (23%). In Wales the two best-documented categories are mineral working (11 800 ha) and derelict land (8250 ha). The extent of contaminated land is unknown; it will be present in all categories of urban and industrial wasteland (especially industrial dereliction). Additional points relating to stock and dynamics are:
• In England surface mineral workings (sand and gravel dominant) and surface disposal (china clay and deep-mined coal dominant) account for 91.5% and 8.5% respectively. In Wales this mix is 71.6% (opencast coal dominant) and 28.4% (slate wastes and deep-mined coal dominant) respectively.
• Neglected land data has low confidence limits.
• There are marked regional variations in the rate of vacant land recycling and therefore residence time in the stock.
• Strong regional variations exist in extent and type of both mineral workings and derelict land.
• The principal source of 'new dereliction' in England is industrial obsolescence. These former industrial sites may be less suited to forestry than 'traditional dereliction' from mineral working.
• In England 87% of derelict land is considered to justify reclamation; in Wales 69%. The Welsh derelict land dynamics data excludes the 2459 ha recognised within the programme as undergoing natural recovery through revegetation.
• It is likely, at least in England, that the economy will continue to deliver significant areas of new damaged and disturbed land through mineral working, waste disposal and structural change within industry.
Land capability for forestryUrban and industrial wastelands are an extensive land resource within England and Wales that in general have good capability for forestry (Table 5.1). Only interim land is deemed to have low capability, because of its residence time being insufficient in many areas to allow beneficial use. The majority of environmental constraints imposed on tree growth by the difficult substrates associated with urban and industrial wasteland can now be overcome via excellent technical guidance from the Forestry Commission and other sources. Contaminated land
57

Tabl
e 5.1
Ur
ban
and
indu
stria
l w
aste
land
in
Engl
and
and
Wal
es
7 3Cm
7 3OJInc• H
s+4COu
I7 3£cn
T b£PQ
£O ^ X cn cn cc a> vj
E a , 5
.3 E S■ ■ io “ x
OJ JOoj
<u 3 '■5■S t o «
E m E. 3 u nj in
r B U 'gb £ a I
^ c L o S
7 3OJ
7 3011 £
'■C cTO SE £Pc b o 3
•s aQJ 03
X OJ
J]J
xcn
0/
7 3OO60MHo
0/ Xcn u| 8 |
^ X 2 £ »->*£> ^ “irt n •CO O
E E
2 Ecn c
" l l o£ a 5 ‘
013 rtHcn H
cn 7 3 O
j i I 1 . p ‘
s 2 & £ ig i?
. £ 0) > £ * > 7 3 W O £ £
7 3 X oj cn
7 3ecn
0/IHD
QJ
1
7 3£cn
To£W
6 0£‘cncnqj
uQJ
Q
cn4->cn
7 3
O2
6 0£
u0/Q
g-21 3 cn —-i
.2 S
£ >cn £Q1 U£ QJo 5±3
Ph QJ
£O‘Eb0/M>,
X
£O
0/Cl,
7 3£
O
6£O
JD
3
o£ ■ 8f r l n
-•-» Uicn -*-»qi cn
O 3PL cn
X
S
7 3 I£ cn cn o>
i—, cn
ts 33 = 3 3
a cS J S
"O bo bo C 5 ■•c!f . QJ £ P CL
£ EX o U U
01
c Ir Icn i-i > 6 0 u, o 0/
£ ^O ' o u u* ££ n « 3 o m5 r oj 2 CL bou qj cn
r v »-«cn OJ QJ PL
7 3£cn
£mv
£
7 3QJ
6 0QJ
QJ4-<£
X
.2X
£
QJX
£cnu
oXCO
_QJ
25 w« 8 33 g
ro S3 bO T 3 oj -p
l i bi—J cn >
I s ■8 "
£ - » cn cj
£ t>C
Co3 310
„ D
• S &
s u . f i L 5
S b ?
e2 & . U Z
7 3£cn
I n£O
2 &0) 7 3d , s
o .3
i* 3
7 3£jv
To£
W
01>
QJ X 7 3
I I Iw QJ 7 3
3 O ° X
X
cn 7 3 QJQJ '
w bO bO r f gt G C - s5 - g - gyj ^O U u
X QJ QJ 2 7 3 7 3
cn
QJ
QJ Qi-i o u £ A
C L -
g E £
. 5 ^ 2X X J 3 j_< qj cn
£ ’g I
">< o ^ ta bo 2
> S -ST) fi i iG 2 rSO T ) ca ,
« -S •-QJ tO — J' a. 2o S"PL, U
o ccnQJO QJ
7 3
aj b £cn cnQJ U
o ■£V4-, UhQJ
S c g
2 S3O u £
u £
7 3
I•0 „ . J .
O fc w
£• QJ
6£O
•-> !-<QJ * r CL >O ^
W O 732 c £ 03
.2 w■£ inCL. J i Utu 5 Cy 2 53 S J S 5 >
f a a .< C
O *77 cn
8 2 CL £ - CL QJ Sw £ .2u m - £r ^ uJ S ^ ' f i £ g 2 - c ;E ! 3 t i
U 3 5 < U D ujPUChC
• a
J c 1'cn " £
o i ? 2
CL
0 5
7 3£JV
To£
W
cnQJ> 7
QJ> 7
60£
£O
’5bQJIh
X
7 3QJ
QJ7 3££
7 3 cn
2 oO J3I n ^ q j O £ u
£ QJO CL13 &
QJ
cn
cn
> QJ
7 3 . £
3 E
S £
2 ^ x ' C l *-< x _ cn cn
X h cn ■5 w ^0 - 3 5
S o 5 e S E (2
QJU£
7 3QJI-i
3,
^ 03 E C l 03 cn
X u
QJCLO
£ O cn
QJ
•E ° c 11 Q.J3^ a , Cl.
E 2 - a
r£ P Cl U CL. tO
£0cn
i scn
6 0£
XQJ
XlHcn
67 3QJ4-*QJ6 0u£
cn
"6 T3
£ £g 1 1— C O
2 2 < 6 0 ^OJ on O
O c" ■ ■ 5 32 2 1 3§ £ « O t n < 5
£ 2 ^
cnX
Xuo
35
I g a e - f« g p 'c c
1 1 5 s a1 1 s ’0 S
S s £ - 1 5 3 S^ g. a o 2 Q 33 O on es
QJ
7 3 ' C
cn
xcnCLcn
U
£ • M(0
CO
u
tu•J3
OCl.CL.O
58
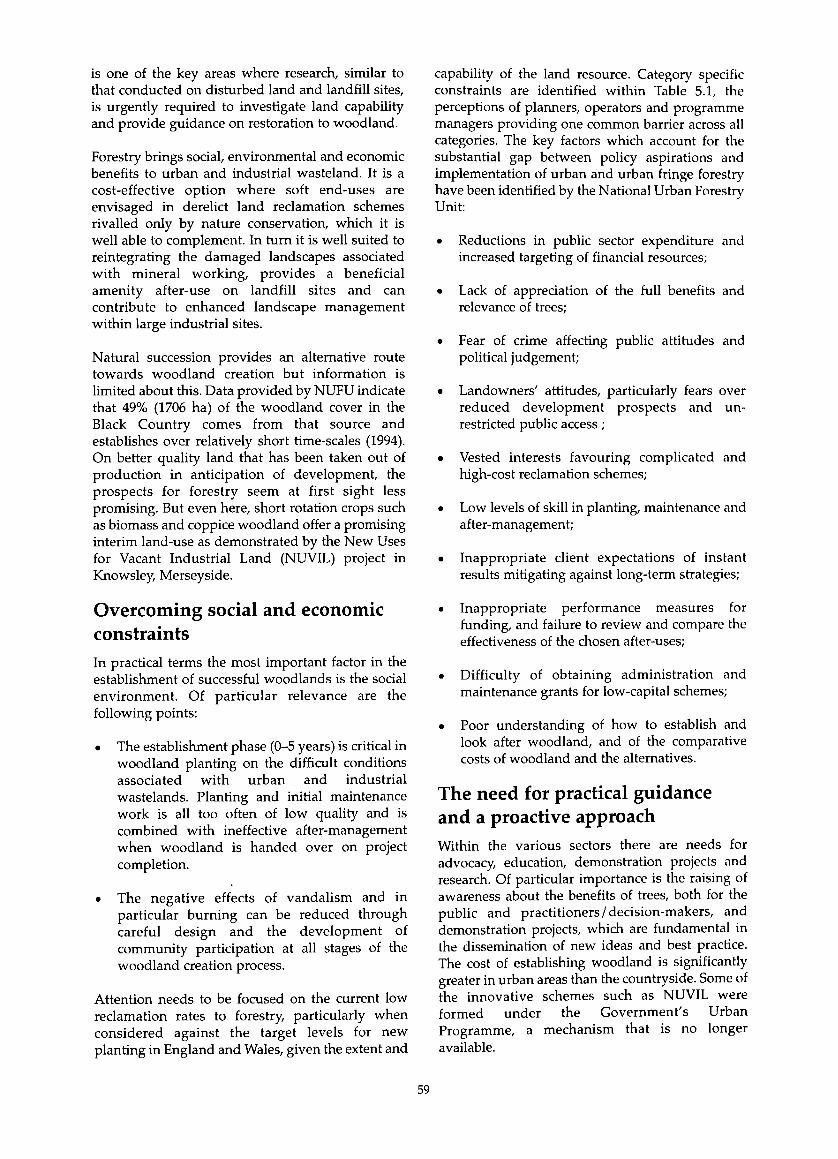
is one of the key areas where research, similar to that conducted on disturbed land and landfill sites, is urgently required to investigate land capability and provide guidance on restoration to woodland.
Forestry brings social, environmental and economic benefits to urban and industrial wasteland. It is a cost-effective option where soft end-uses are envisaged in derelict land reclamation schemes rivalled only by nature conservation, which it is well able to complement. In turn it is well suited to reintegrating the damaged landscapes associated with mineral working, provides a beneficial amenity after-use on landfill sites and can contribute to enhanced landscape management within large industrial sites.
Natural succession provides an alternative route towards woodland creation but information is limited about this. Data provided by NUFU indicate that 49% (1706 ha) of the woodland cover in the Black Country comes from that source and establishes over relatively short time-scales (1994). On better quality land that has been taken out of production in anticipation of development, the prospects for forestry seem at first sight less promising. But even here, short rotation crops such as biomass and coppice woodland offer a promising interim land-use as demonstrated by the New Uses for Vacant Industrial Land (NUVIL) project in Knowsley, Merseyside.
Overcoming social and economic constraintsIn practical terms the most important factor in the establishment of successful woodlands is the social environment. Of particular relevance are the following points:
• The establishment phase (0-5 years) is critical in woodland planting on the difficult conditions associated with urban and industrial wastelands. Planting and initial maintenance work is all too often of low quality and is combined with ineffective after-management when woodland is handed over on project completion.
• The negative effects of vandalism and in particular burning can be reduced through careful design and the development of community participation at all stages of the woodland creation process.
Attention needs to be focused on the current low reclamation rates to forestry, particularly when considered against the target levels for new planting in England and Wales, given the extent and
capability of the land resource. Category specific constraints are identified within Table 5.1, the perceptions of planners, operators and programme managers providing one common barrier across all categories. The key factors which account for the substantial gap between policy aspirations and implementation of urban and urban fringe forestry have been identified by the National Urban Forestry Unit:
• Reductions in public sector expenditure and increased targeting of financial resources;
• Lack of appreciation of the full benefits and relevance of trees;
• Fear of crime affecting public attitudes and political judgement;
• Landowners' attitudes, particularly fears over reduced development prospects and unrestricted public access;
• Vested interests favouring complicated and high-cost reclamation schemes;
• Low levels of skill in planting, maintenance and after-management;
• Inappropriate client expectations of instant results mitigating against long-term strategies;
• Inappropriate performance measures for funding, and failure to review and compare the effectiveness of the chosen after-uses;
• Difficulty of obtaining administration and maintenance grants for low-capital schemes;
• Poor understanding of how to establish and look after woodland, and of the comparative costs of woodland and the alternatives.
The need for practical guidance and a proactive approachWithin the various sectors there are needs for advocacy, education, demonstration projects and research. Of particular importance is the raising of awareness about the benefits of trees, both for the public and practitioners/decision-makers, and demonstration projects, which are fundamental in the dissemination of new ideas and best practice. The cost of establishing woodland is significantly greater in urban areas than the countryside. Some of the innovative schemes such as NUVIL were formed under the Government's Urban Programme, a mechanism that is no longer available.
59

Access to funding for the planting and establishment of new woodlands is a key issue, as is the development of integrated bid proposals linking forestry as environmental improvement with other forms of development. The aim should be to gain access to more sizeable funding streams such as Single Regeneration Budget or European Regional Development/Social funds. This integrated approach is also advocated by the DoE Green the city initiative (DoE, 1996c) which seeks to examine the issue of woodland creation within the context of a) mixed amenity land uses and b) inter-mixing of trees and commercial developments. Changes to grant structures that encourage lower-capital cost schemes - such as forestry (especially managing natural colonisation) - and allow such schemes to bid for staffing and administration costs are to be encouraged.
The way forward demands a strategic approach focused on areas where urban and industrial wasteland is concentrated. In Wales, the benefits of such an approach, led by the Welsh Development Agency, have been evident for some time. In England, the establishment of regional development agencies (RDAs), working closely with English Partnerships and local authorities, provide a new focus for action. At the local level, this will involve an integrated and proactive approach - similar to that practised by Wasteland to Woodland in St Helens which brings major landowners and operators together with local authorities and government agencies.
The community forest projects provide a useful vehicle but the Forestry Commission will also need to work with English Partnerships, RDAs and NUFU to propagate partnership-type initiatives in areas not currently covered and which have suitable characteristics, that is, extensive areas of derelict and despoiled land. The Groundwork Trusts will make useful partners in some cases and the single regeneration budget represents a potential funding regime where woodland creation can be shown to assist economic regeneration. Forest Enterprise, with its technical expertise, resources and land management capability, is emerging as a significant player in urban-fringe locations.
Priorities for research and developmentTwo specific opportunities require particular attention by the Forestry Commission, namely landfill and contaminated land. Further research in collaboration with the Environment Agency and English Partnerships is needed in these areas to establish and demonstrate that woodland is an appropriate after-use, especially on older
landfill sites that have not been restored to modem standards. One large-scale experimental project is already underway on Merseyside where English Partnerships is supporting the Mersey Community Forest in woodland trials on former landfill sites.
Research should also be directed towards the potential of forestry as an effective long-term use of land where capability is prejudiced by concerns about contamination and associated liabilities. There may be a role for Forest Enterprise to take on the management of contaminated sites for forestry if liabilities under the Environment Act 1995 are not transferred in the process. The Landfill Tax rebate scheme could provide a new source of funding for research, education and implementation. In addition, the role of trees and woodlands in both leisure and amenity landscapes cannot be overemphasised and should be encouraged in all relevant policies and development strategies.
Natural colonisation is an important creator of new woodland on vacant land. The value of this process needs to be recognised and supported but sensitively, given the growing recognition of the importance of these areas for nature conservation.
The importance of advocacyPlanning conditions agreed with the operators of mineral workings and landfill sites provide the best opportunities for expanding reclamation rates to woodland in these areas. This requires greater awareness of the benefits of forestry among planners and the demonstration of practical and financial benefits to operators. In the same way, Section 106 agreements represent an excellent opportunity for restoring mineral workings with ineffective or outdated reclamation conditions into beneficial forestry after-uses. Efforts also need to be directed towards changing the attitudes of derelict land programme managers so that trees and woodland become a more integral part of reclamation practice, particularly to amenity land. The benefits of woodland to operators and programme managers include the following facts:
• Woodland can be a cheap option.
• Site preparation does not involve complex drainage or other works.
• Revenue costs are low and predictable.
• Woodland is relatively easy to establish.
• It can be a low-risk use for contaminated sites.
60

• It produces visual changes quickly.
• It delivers a variety of non-market benefits such as landscape, wildlife and recreation.
• It has a high perceived value to local people.
• It can produce income.
• It is grant-aided (even when required by planning conditions) for capital and revenue costs.
• Natural colonisation can be a valuable asset.
• Expert advice is available from the Forestry Commission.
• Long-term management can often be arranged with bodies such as the Woodland Trust, local authority or Forest Enterprise.
ConclusionThis report has reviewed the extent and capability of land that has been damaged and disturbed by urban and industrial use or that falls vacant within the development cycle. Opportunities exist to increase the amount of land restored to woodland within all the following categories of land:
• mineral working;• landfill;• large industrial complexes;• vacant land;• derelict land;• contaminated land.
Taken together, this represents a substantial opportunity to increase the woodland cover and, in the process, to make a lasting contribution to quality of life and sustainability in and around towns and cities. Within the various sectors there are needs for advocacy, education, demonstration projects and research. But the real key to success is to bring forestry into the mainstream of urban regeneration programmes, taking full advantage of the new policy climate and institutional frameworks.
61

ReferencesALLOWAY, B.J. (1990). Soil processes and the behaviour of metals. In, Heavy metals in soils, 7-28, ed. B.J. Alloway. Blackie & Son Ltd., Glasgow.
ASH, H.J. (1991). Soils and vegetation in urban areas. In, Soils in the urban environment, eds P. Bullock and P.J. Gregory. Blackwell, London.
ATTEWELL, P. (1993). Ground pollution: environment, geology, engineering and law. Chapman and Hall, London.
BANWELL, D.F. (1967). The Lower Swansea Valley Project. Town and Country Planning (November).
BENDING, N.A.D. and MOFFAT, A.J. (1997). Tree establishment on landfill sites: research and updated guidance. Forestry Commission, Edinburgh.
BENDING, N.A.D., MOFFAT, A.J. and ROBERTS, C.J. (1991). Site factors affecting tree response on restored opencast ground in the South Wales coalfield. In, Land reclamation: an end to dereliction? ed. N.C.R. Davies. Elsevier Applied Science, London.
BIBBY, J.S., HESLOP, R.E.F. and HARTNUP, R.L.(1988). Land capability fo r forestry. Macaulay Institute, Edinburgh.
BIBBY, P. and COPPIN, P. (1994). Analyses o f land use change statistics. SERRL Occasional Monograph 1. HMSO, London.
BRADSHAW, A.D. (1984). Ecological principles and land reclamation practice. Landscape Planning 11, 35-48.
BRADSHAW, A.D. and CHADWICK, M.J. (1980). Restoration o f land - the ecology and reclamation o f derelict and degraded land. Blackwell, Oxford.
BRADSHAW, A.D. and WALMSLEY, T.J. (1995). Trees in the urban landscape. E. and F.N. Spon, London.
BROAD, K.F. (1979). Tree planting on man-made sites in Wales. Occasional Paper 3. Forestry Commission, Edinburgh.
BURT, A. and BRADSHAW, A.D. (1986). Transforming our wasteland: the way forward. HMSO, London.
CAKEBREAD, T. (1997). The potential for woodland on damaged and neglected land in the Mersey Forest. MA Thesis, University of Manchester (unpub.).
CER RESEARCH AND CONSULTANCY AND TOWN AND COUNTRY PLANNING ASSOCIATION (1995). M anchester 2020 - sustainable development in the city region. 2nd edtn consultation draft. CERRC, Manchester.
CIVIC TRUST (1964). Derelict land - a study o f industrial dereliction and how it may be redeemed. Civic Trust, London.
CIVIC TRUST (1988). Urban wasteland now. Civic Trust, London.
COUNTRYSIDE COMMISSION (1993a). England's trees and woods. CCP 408. Countryside Commission, Cheltenham.
COUNTRYSIDE COMMISSION (1993b). The National Forest strategy. CCP 411. Countryside Commission, Cheltenham.
DEPARTMENT OF THE ENVIRONMENT (1986). Landfilling wastes. Waste management Paper 26. HMSO, London.
DEPARTMENT OF THE ENVIRONMENT (1989). A review o f derelict land policy. HMSO, London.
DEPARTMENT OF THE ENVIRONMENT (1990). Environmental Protection Act 1990. HMSO, London
DEPARTMENT OF THE ENVIRONMENT (1992b). National survey o f vacant land in urban areas in 1990. HMSO, London.
DEPARTMENT OF THE ENVIRONMENT (1992c). Land use change in England 1985-90. Statistical Bulletin (92)3. HMSO, London.
DEPARTMENT OF THE ENVIRONMENT (1992d). Amenity reclamation o f mineral workings: main report; the use o f land for amenity purposes: a summary o f requirements. HMSO, London.
DEPARTMENT OF THE ENVIRONMENT (1994a). Framework for contaminated land. HMSO, London.
DEPARTMENT OF THE ENVIRONMENT (1994b). Land use change in England No. 9. Statistical Bulletin (94)1. HMSO, London.
DEPARTMENT OF THE ENVIRONMENT (1995a). Rural England. CM 3016. HMSO, London.
DEPARTMENT OF THE ENVIRONMENT (1995b). Derelict land survey 1993. HMSO, London.
DEPARTMENT OF THE ENVIRONMENT (1995c). Environment Act 1995. HMSO, London.
62

DEPARTMENT OF THE ENVIRONMENT (1995d). Derelict land prevention and the planning system. HMSO, London.
DEPARTMENT OF THE ENVIRONMENT (1996a). A working countryside for Wales. CM 3180. HMSO, London.
DEPARTMENT OF THE ENVIRONMENT (1996b). Peoples, parks and cities - a guide to current good practice in urban parks. HMSO, London.
DEPARTMENT OF THE ENVIRONMENT (1996c). Green the city: a guide to good practice. HMSO, Norwich.
DEPARTMENT OF THE ENVIRONMENT (1996d). Survey o f land for mineral workings 1994. HMSO, London.
DEPARTMENT OF THE ENVIRONMENT (1996e). The Environment Act 1995: review o f mineral planning permissions. MPG14. HMSO, London.
DEPARTMENT OF THE ENVIRONMENT, TRANSPORT AND THE REGIONS (1998a). Planning for the communities o f the future. Cmd 3885. DETR, London.
DEPARTMENT OF THE ENVIRONMENT, TRANSPORT AND THE REGIONS (1998b). Opportunities fo r change: consultation paper on a revised UK strategy for sustainable development. DETR, London.
DEPARTMENT OF THE ENVIRONMENT and the WELSH OFFICE (1992a). Indicative forest strategies. Circular 29 / 92. HMSO, London.
DOBSON, M.C. and MOFFAT, A.J. (1993). The potential for woodland establishment on landfill sites. HMSO, London.
ENGLISH NATURE AND THE COUNTRYSIDE COMMISSION (1996). Joint character map o f England. English Nature and the Countryside Commission.
FARMER, R.A. (1993). Forestry in South Wales. Forestry 66 (2),113-134.
FERRO, A., KENNEDY, J. and KNIGHT, D. (1997). Phyto-remediation o f soils contaminated with pentachlorophenol and polyaromatic hydrocarbons. In situ and on-site bioremediation. Battelle 4th International Symposium, New Orleans.
FORESTRY COMMISSION (1994). 73rd annual report and accounts 1992-1993. Forestry Commission, Edinburgh.
FORESTRY COMMISSION / COUNTRYSIDE COMMISSION (1996). Woodland creation: needs and opportunities in the English countryside - taking forward the White Paper on rural England. CCP507. Countryside Commission, Cheltenham.
FORESTRY COMMISSION/COUNTRYSIDE COMMISSION (1997). Woodland creation: needs and opportunities in the English countryside - responses to a discussion paper. CCP522. Countryside Commission, Cheltenham.
GILBERT, O.L. (1984). The urban common.Landscape Design 149, 35-36.
GROUNDWORK TRUST (1986). Report for the Forestry Commission - report o f the Working Party on the aftercare o f reclaimed land in St Helens and Knowsley. Groundwork Trust, St Helens.
GROUNDWORK TRUST (1989). Report for Sefton Metropolitan Borough Council - aftercare requirements fo r urban landscape improvements in Sefton. Groundwork Trust, St Helens.
HANDLEY, J. (1996). The post-industrial landscape - a groundwork status report. Groundwork Foundation, Birmingham.
HARRIS, J.A. (1991). The biology of soils in urban areas. In, Soils in the urban environment, eds P. Bullock and P.J. Gregory. Blackwell, Oxford.
HER MAJESTY'S GOVERNMENT (1994a). Sustainable forestry - the UK programme. HMSO, London.
HER MAJESTY'S GOVERNMENT (1994b). Sustainable development - the UK strategy. CM2426. HMSO, London.
HER MAJESTY'S GOVERNMENT (1995). Making waste work - a strategy fo r sustainable waste management in England and Wales. CM3040. London, HMSO.
HER MAJESTY'S GOVERNMENT (1998). Planning for the communities o f the future. Crnnd. 3885. DETR, London.
HODGE, S.J. (1995). Creating and managing woodlands around towns. Forestry Commission Handbook 11. HMSO, London.
HODGE, S.J. and HARMER, R. (1996). Woody colonisation on unmanaged urban land and exindustrial sites. Forestry 69, 245-261.
HOLLIS, J.M. (1991). The classification of soils in urban areas. In, Soils in the urban environment, eds P. Bullock and P.J. Gregory. Blackwell, Oxford.
63
HUTCHINGS, T.R. and MOFFAT, A.J. (1997). Establishing trees on contaminated land - viability, implications and rewards. Working paper submitted to the Steering Group on Potential for Woodland on Urban and Industrial Wasteland (unpub.).
INTERDEPARTMENTAL COMMITTEE ON THE RECLAMATION OF CONTAMINATED LAND (1987). Guidance on the assessment and redevelopment of contaminated land. ICRCL Guidance note 59/83. HMSO, London.
JARVIS, P. (1997). Forests for free. Urban Nature Magazine 3 (1), 11.
JOBLING, R. and CARNELL, R. (1985). Tree planting in colliery spoil. Research and Development Paper 136. Forestry Commission, Edinburgh.
KIVELL, P.J. (1987). Derelict land in England. Regional Studies 21 (3), 265-273.
KTVELL, P.J. (1993). Land and the city - patterns and processes o f urban change. Routledge, London.
KNOX (1989). Practice and trends in landfilling. In, Sanitary landfilling, eds T.H. Christensen et al. Academic Press, London.
LAND CAPABILITY CONSULTANTS (1989). Cost effective management o f reclaimed derelict sites. HMSO, London.
LAND USE CONSULTANTS (1996a). Urban woodland and grassland: comparative management costs. LUC, London.
LAND USE CONSULTANTS (1996b). Reclamation o f damaged land for nature conservation. HMSO, London.
LAVENDER, S.J. (1981). New land fo r old - the environmental renaissance o f the Lower Swansea Valley. Adam Hilger, Bristol.
MOFFAT, A.J. and HOUSTON, T.J. (1991). Tree establishment and growth at Pitsea landfill site.Waste Management and Research 9 (1), 35-46.
MOFFAT, A.J. and McNEILL, J.D. (1994). Reclaiming disturbed land fo r forestry. Forestry Commission Bulletin 110. HMSO, London.
MOFFAT, A.J. AND ROBERTS, C.J. (1990). Grass mixtures for afforested opencast spoils in South Wales. Land Degradation and Rehabilitation 2, 127-134.
MOFFAT, A.J., ROBERTS, C.J. and McNEILL, J.D.(1989). The use o f nitrogen-fixing plants in forest reclamation. Research Information Note 158.
Forestry Commission, Edinburgh.
NATIONAL GRID COMPANY (1995). Seven year statement 1995/6 - 2001/2. National Grid Company pic, Coventry.
NATIONAL URBAN FORESTRY UNIT (1994). Open space survey o f the Black Country. Working paper submitted to the Steering Group on Potential for Woodland on Urban and Industrial Wasteland (unpub.).
NATIONAL URBAN FORESTRY UNIT (1995). Black Country open space survey. NUFU, Sandwell.
NUVIL (1994a). Advisory Group Annual Report. NUVIL, Knowsley.
NUVIL (1994b). Advisory Group Business Plan. NUVIL, Knowsley.
OPINION LEADER RESEARCH (1998). Environmental partnerships study. OLR2178 (unpub.). Groundwork Foundation, Birmingham.
PARLIAMENTARY OFFICE OF SCIENCE AND TECHNOLOGY (1993). Contaminated land. POST, London.
RODWELL, J. and PATTERSON, G. (1994). Creating new native woodlands. Forestry Commission Bulletin 112. Forestry Commission, Edinburgh.
ROYAL COMMISSION ON ENVIRONMENTAL POLLUTION (1995). Eighteenth report - transport and the environment. HMSO, London.
ROYAL COMMISSION ON ENVIRONMENTAL POLLUTION (1996). Nineteenth report - sustainable use o f soil. CM 3165. HMSO, London.
SCOTTISH OFFICE ENVIRONMENT DEPARTMENT (1994). Our forests - the way ahead. Enterprise, environment and access, conclusions from the Forestry Review. Cm 2644, HMSO, Edinburgh.
WELSH DEVELOPMENT AGENCY (1994). Working with nature - low cost reclamation. WDA, Cardiff.
WELSH OFFICE (1991) 1988 Survey o f mineral workings in Wales. HMSO, Cardiff.
WELSH OFFICE (1992). Survey o f contaminated land in Wales 1988. HMSO, Cardiff.
WELSH OFFICE AND WELSH DEVELOPMENT AGENCY (1995). 1988 Derelict land survey with 1993 update. (Draft report). HMSO, Cardiff.
WILSON, K. (1985). A guide to the reclamation o f
64

mineral workings fo r forestry. Research and Development Paper 141. Forestry Commission, Edinburgh.
WOOD, P.A. (1997). Restoration methods for contaminated sites. In, Contaminated land and its reclamation, eds R.E. Hester and R.M. Harrison. Thomas Telford, London.
WOOD, R.F. and THIRGOOD, J.V. (1955). Tree planting on colliery spoil heaps. Research Branch Paper 17. Forestry Commission, London.
65
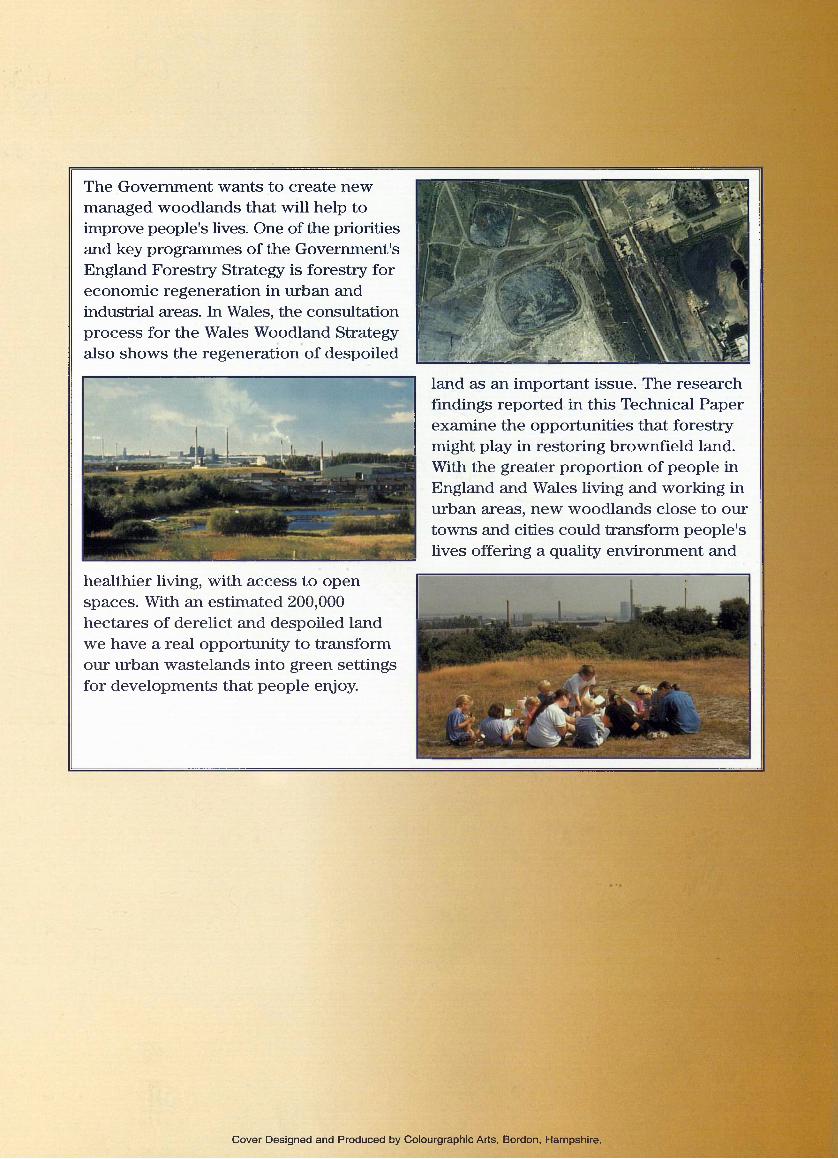
The Government wants to create new managed woodlands that will help to improve people's lives. One of the priorities and key programmes of the Government's England Forestry Strategy is forestry for economic regeneration in urban and industrial areas. In Wales, the consultation process for the Wales Woodland Strategy also shows the regeneration of despoiled
land as an important issue. The research findings reported in this Technical Paper examine the opportunities that forestry might play in restoring brownfield land. With the greater proportion of people in England and Wales living and working in urban areas, new woodlands close to our towns and cities could transform people's lives offering a quality environment and
healthier living, with access to open spaces. With an estimated 200,000 hectares of derelict and despoiled land we have a real opportunity to transform our urban wastelands into green settings for developments that people enjoy.
Cover Designed and Produced by Colourgraphic Arts, Bordon, Hampshire.