the effects of cds trading on information asymmetry...
TRANSCRIPT

The Effects of CDS Trading on Information Asymmetry in Syndicated Loans
Dan Amiram Columbia Business School
Columbia University
William Beaver Graduate School of Business
Stanford University
Wayne R. Landsman* Kenan-Flagler Business School
University of North Carolina and
Securities and Exchange Commission
Jianxin Zhao Kenan-Flagler Business School
University of North Carolina
October 2016
Journal of Financial Economics, Forthcoming
We thank Mary Barth, Nittai Bergman, Robert Bushman, Ilya Dichev, Miguel Ferreira, Fabrizio Ferri, Jon Glover, Bjorn Jorgensen, Alon Kalay, Doron Nissim, Martin Oehmke, Shiva Rajgopal, an anonymous reviewer, and workshop participants at the Cambridge Financial Accounting Symposium, Catolica-Nova Lisbon Accounting Conference, Columbia University, the European Accounting Association Annual Congress, Emory University, IDC Herzliya, London School of Economics, Temple University, the University of Toronto Rotman Research Conference, the UNC-Duke Fall Camp, and the University of North Carolina Chapel Hill for helpful comments. We appreciate funding from the Center for Finance and Accounting Research, Kenan-Flagler Business School, the Center for Global Business and the Economy, Stanford Graduate School of Business, and Columbia Business School. We thank Ki-Soon Choi for research assistance. * Corresponding author at: 300 Kenan Drive, Chapel Hill, NC 27599, USA. Tel.: +1-919-962-3221; fax: +1-919-962-4727, E-mail address: [email protected]. The Securities and Exchange Commission, as a matter of policy, disclaims responsibility for any private publication or statement by any of its employees. The views expressed herein are those of Wayne Landsman and do not necessarily reflect the views of the Commission or of the study’s other coauthors upon the staff of the Commission.

The Effects of CDS Trading on Information Asymmetry in Syndicated Loans
Abstract This study shows that initiation of CDS trading for an entity’s debt increases the share of loans retained by loan syndicate lead arrangers and increases loan spread. These findings are consistent with CDS initiation reducing the effectiveness of a lead arranger’s stake in the loan to serve as a mechanism to address the adverse selection and moral hazard problems in the loan syndicate. Additional findings corroborate this interpretation by revealing a moderating effect for firms with greater transparency, for loans originated by a lead arranger with a strong reputation in this market, and for firms with relatively liquid CDS markets. JEL Classifications: G10, G21, G32 Keywords: CDS, Syndicated loans, Adverse selection, Moral hazard, Information asymmetry

1
1. Introduction
Syndicated loans are the largest source of US corporate financing activity (Sufi, 2007;
Ivashina, 2009). Globally, the syndicated loan market plays a similarly leading role in corporate
financing, with volume growing from nearly $3 trillion in 2010 to $4.7 trillion in 2014, and
shows no signs of slowing down (Thomson and Reuters, 2014). An important friction in this
market is information asymmetry between the lead arranger, who originates the loan with a
borrower, and the participants within the syndicate. This friction impedes the ability of the lead
arranger to find syndicate participants, which can restrict loan amounts or raise the cost of
borrowing. A well known solution to the information asymmetry problem is for the lead
arranger to have ‘skin in the game’ by holding a share of each originated loan (Sufi, 2007;
Ivashina, 2009; Gopalan, Nanda, and Yerramilli, 2011).
Many believed that the development of the credit default swaps (CDSs) potentially
benefited the lending market by providing the lead arranger with more opportunities to hedge
credit risk, thereby reducing the price of risk. However, initiation of CDS trading also could
have created unintended costs in the lending market. These instruments, which pay their holders
the face value in a case of a reference entity (i.e., borrower) credit event (e.g., debt default) in
return for a premium, were issued first in the early 1990s and reached a peak of $62.2 trillion of
notional outstanding value in 2007 (ISDA, 2013). The introduction of CDS trading potentially
can impede the effectiveness of the lead arranger’s ‘skin in the game’ to resolve the information
asymmetry problem inherent in the loan syndicate. Because the syndicated loan market is a key
source of corporate financing and CDS trading has become widespread, we investigate whether
the initiation of CDS trading exacerbates the information asymmetry problem within the loan
syndicate.

2
In contrast to a traditional bank loan, which involves a single lender, a syndicated loan
involves a group of lenders. Loan syndication has evolved as an efficient mechanism that
permits the lead arranger to share risk with syndicate participants, who depend on the lead
arranger to screen borrowers before loan syndication and monitor borrowers throughout the life
of the loans. Because screening and monitoring efforts are costly and unobservable, the loan
syndication process suffers from information asymmetry problems that can adversely affect the
loan syndication process. The information asymmetry between the lead arranger and syndicate
participants creates an adverse selection problem, in which the lead arranger has an incentive to
misrepresent the quality of syndicated loans, and creates a moral hazard problem, in which the
lead arranger has an incentive to underperform on its monitoring. To mitigate these information
asymmetry problems, syndicate participants can require the lead arranger to retain a larger share
of a loan, i.e., have ‘skin in the game,’ than would otherwise be optimal from a pure risk-sharing
perspective. This ‘skin in the game’ serves as a commitment for the lead arranger to set loan
terms that accurately reflect the riskiness of the loan and to exert monitoring effort after loan
origination.
Initiation of a CDS market introduces a potential positive externality to the syndicated
loan market by providing the lead arranger with an alternative mechanism to hedge exposure to
credit risk associated the portion of the loan it retains. However, the ability of the lead arranger
to hedge credit risk using CDSs introduces a potential negative externality in that CDS trading
reduces the effectiveness of lead arranger ownership to serve as a mechanism to mitigate the
information asymmetry problems of adverse selection and moral hazard. CDS initiation
introduces another negative externality by increasing the default risk of the reference entity

3
because speculators that hold CDSs on the borrower may have incentives to encourage it to
default (e.g., Che and Sethi, 2013; Subrahmanyam, Tang, and Wang, 2014).
We begin our study by first developing a framework for understanding the economic
effects of CDS initiation on loan syndication, which enables us to gain insight into whether CDS
initiation exacerbates adverse selection and moral hazard problems within the syndicate. We do
this by building on Ivashina (2009), which develops an equilibrium model of loan syndication in
which the observed loan spread and a lead bank’s share of a loan corresponds to the intersection
of two pricing schedules representing the syndicate participants’ demand for a proportional share
of a loan and the lead bank’s willingness to retain a proportional share of a loan. We show that
CDS initiation can lead to a variety of new equilibrium combinations of loan share retained by
the lead arranger and borrower loan spread. However, an important observation is that an
increase in neither loan share retained nor loan spread following CDS initiation is sufficient for
evidence of an increase in adverse selection and moral hazard (hereafter information asymmetry)
associated with loan syndication. Observing simultaneous increases in both loan share retained
and loan spread are necessary for there to be an economically significant increase in information
asymmetry.
To analyze empirically the effect of CDS trading initiation on the loan share retained and
loan spread of the syndicated loan market, we obtain CDS trading information from Markit and
collect a sample of 22,406 loan contracts from Dealscan over the period 1993-2014. We
investigate the effects of CDS initiation on the share retained by the lead arranger using a
research design borrowed from Bertrand and Mullainathan (2003) that controls for borrower and
time fixed effects. In all tests we also include as controls firm- and loan-specific characteristics.
We find that CDS initiation is associated with an increase in the loan share retained by the lead

4
arranger. This finding is consistent with two alternative explanations. The first is that CDS
initiation introduces a positive externality arising from the availability to the lead arranger of an
alternative means to diversify credit risk exposure to a loan. The second is that CDS initiation
introduces a negative externality arising from the reduced effectiveness of lead arranger
ownership to serve as a mechanism to mitigate the information asymmetry problems.
To help distinguish whether the ownership structure changes more likely arise from the
lead arranger’s diversification benefit or an increase in information asymmetry problems, we
also test for the effect on loan spreads arising from CDS initiation. Findings from this test
indicate that average loan spread increases. As we explain in section 2, finding an increase in
both loan share retained by the lead arranger and loan spread is evidence consistent with CDS
initiation introducing a negative externality arising from an increase in information asymmetry
that more than offsets any possible positive externality from diversification.
A research design problem common to studies on CDS initiation is that CDS initiation is
possibly endogenously related to an increase in credit risk or change in some other unobservable
time varying characteristics of the reference entity. To address this possibility, following prior
literature, we conduct additional tests including the use of a propensity score matched sample, an
entropy balanced sample, and instrumental variable approaches (two-stage least squares and
Heckman correction) that utilize an instrument used in related prior studies (e.g., Saretto and
Tookes, 2013; Subarhmanyam et al., 2014). Findings from these tests reveal the same inferences
as those based on our primary tests. Because we base our tests on a difference-in-differences
research design, we also conduct additional analyses to test whether there is a pre-determined
trend in the dependent variables for the CDS traded firms relative to the non-CDS traded firms,
and whether our findings are robust to limiting the sample to loans immediately before and after

5
CDS initiation. Findings reveal no evidence of a pre-determined trend and that inferences are
robust to estimating the models with the short window sample.
Finally, to mitigate the potential for alternative explanations for our results, we also
conduct cross-sectional tests to determine whether the effects of CDS initiation on syndicated
loan structure and loan spread vary with borrower transparency and lead arranger reputation, two
factors that prior literature shows moderate the effects of the information asymmetry problems
within the loan syndicate. Regarding borrower transparency, if a borrower’s risks and activities
are more transparent, then the information asymmetry problems are less severe and monitoring
by lead arrangers is less important to syndicate participants. As a result, the information
asymmetry problems created by CDS trading is likely to be less severe for more transparent
firms. We test our prediction of a moderating influence of a borrower’s transparency using a
measure of the debt-contracting value of borrowers’ accounting information in explaining credit
ratings (Ball et al., 2008). Findings from these tests support our prediction that for firms with
higher transparency there are smaller increases in loan share retained by the lead arranger and
loan spreads following CDS initiation. Similarly, we also find that, as predicted, our
documented effects of CDS initiation on loan share retained and loan spreads are less
pronounced when the lead arranger has a strong reputation in the syndicated loan market. This is
because lead arrangers with a strong reputation to protect have greater incentives to screen and
monitor borrowers, which mitigates the information asymmetry problems.
A key assumption in our use of CDS initiation as an indication that the cost of
anonymously hedging its retained credit risk in the borrower decreases for the lead arranger is
predicated on the existence of a liquid CDS market. As a result, we predict and find evidence of
larger share retained by the lead arranger and higher loan spreads relating to loans for which

6
CDS contracts are relatively liquid. These findings suggest that existence of a liquid CDS
market better enables the lead arranger to hedge its retained credit risk using CDS, thereby
exacerbating information asymmetry effects of CDS initiation.
Our study contributes to the literature by documenting the effects of CDS initiation on the
information asymmetry problems in the syndicated loan market. Although prior studies find that
CDS initiation is associated with an increase in reference entity bankruptcy risk (Subarhmanyam
et al., 2014), an increase in loan spread for relatively opaque reference entities (Ashcraft and
Santos, 2009), and an increase in lead arranger ownership (Streitz, 2016), our study is the first to
provide evidence that CDS initiation exacerbates the moral hazard and adverse selection
problems in the syndicated loan market. Finding an increase in both loan share retained by the
lead arranger and loan spread and that these increases are larger for borrowers with lower
transparency and for loans originated by a lead arranger with a relatively low reputation in the
syndicated loan market enable us to infer that CDS initiation results in an increase in information
asymmetry that more than offsets possible diversification benefits to the lead arranger. Thus,
CDS initiation reduces the effectiveness of a lead arranger’s stake in the loan to serve as a
mechanism to address the information asymmetry problems.
The remainder of the paper is organized as follows. The next section discusses the
institutional background, related literature, and provides our predictions. Section 3 presents our
research design, section 4 describes our sample and data, and section 5 presents our results.
Section 6 provides concluding remarks.
2. Background and predictions
A credit default swap (CDS) is essentially an insurance contract that provides that the
seller of the CDS compensates the buyer in the event of a debt default or other specified credit

7
event relating to a specific entity. The CDS contract typically requires the buyer of the CDS to
make a series of payments to the seller throughout the life of the debt and, in exchange, the buyer
receives a payoff if the debt defaults. The availability of a CDS market can significantly reduce
the cost of hedging credit risk exposure to a borrower for holders of the borrower’s debt
securities. CDS transactions are conducted through an over-the-counter market and thus are
unobservable to parties outside of the deal. Therefore, if a CDS market for a firm’s debt is
available, the lead arranger anonymously can purchase CDSs to lay off credit risk associated
with the portion of the loan it holds.1 Although there are so-called “loan-only” CDS contracts,
LCDS, credit protection buyers—including lead arranger banks—typically use CDS contracts as
a means to hedge credit risk of the borrower because the market for LCDS contracts is relatively
illiquid.2
The ability of the lead arranger to lay off credit risk has several potential economic
effects on loan syndication, particularly syndicate ownership structure and loan spread. To
understand these economic effects and develop predictions, we build on Ivashina (2009), which
develops an equilibrium model of loan syndication in which the observed loan spread and a lead
bank’s share of a loan correspond to the intersection of two pricing schedules representing the
syndicate participants’ demand for a proportional share of a loan and the lead bank’s willingness
to retain a proportional share of a loan. Fig. 1, which plots loan spread and share retained by the
1 The lead arranger’s actions are, in principle, observable to the CDS seller only, i.e., its actions are unobservable by syndicate participants. To the extent that the lead arranger is concerned about maintaining anonymity with all parties, including the seller, it can arrange for a third party to purchase the CDS directly from the seller and then acquire the CDS from the third party. 2 The most prevalent form of CDS contracts are those written on bonds. Such contracts have been written since inception of CDS market. However, since 2007 LCDS have begun to be traded with some degree of frequency and it is generally the case that since 2007 LCDS markets continue to be less liquid than CDS markets (Choudhry, 2011). Because LCDS contracts are linked to secured loans with higher recovery rates than unsecured bonds, spreads for LCDS contracts generally are smaller than those for CDS contracts for the same reference entity. However, because loan and bond contracts typically are cross-referenced with respect to a defining default event, the default event date is normally the same for CDS and LCDS.

8
lead arranger, illustrates the model. In the presence of adverse selection arising from syndicate
participants being unable to observe the creditworthiness of the borrower and the moral hazard
problem arising from their inability to assess whether the lead arranger monitors the borrower’s
activities throughout the life of the loan, the syndicate participants’ demand curve is downward-
sloping. Other things equal, syndicate participants demand a higher loan spread the greater are
the information asymmetry problems. The downward slope of their demand curve, DSynd,
reflects their requiring a lower loan spread when the lead arranger retains a larger proportion of
the loan, which reduces the information asymmetry problems. Because of the lead arranger’s
desire to diversify loan portfolio risk, as the share retained increases, the greater must be the loan
spread to compensate the lead arranger for the greater risk exposure. Hence, the lead arranger’s
demand curve, DLeadA, is upward sloping. The intersection of the two demand curves yields
the equilibrium loan spread and share retained by the lead arranger given by E(0).
The first economic effect of CDS initiation on loan syndication relates to a shift in the
syndicate participants’ demand curve resulting from an increase in information asymmetry risk.
The ability of lead arrangers to anonymously lay off credit risk using CDS reduces their
incentive to screen and monitor borrowers (e.g., Morrison, 2005). As a result, holding a portion
of the loan no longer provides as credible commitment as before CDS initiation that the lead
arranger will provide a fair assessment of the riskiness of the loan and exert monitoring effort.
Moreover, because CDSs allow banks and creditors to transfer risk exposure to third parties
through the purchase of CDS protection, an “empty creditor” problem is created in that creditors
with CDS insurance are better off when the borrowing firm defaults and may even have
incentives to push the borrower into default (Hu and Black, 2008a, 2008b) or inefficient

9
bankruptcy because the lender’s total pay-off would be higher in that event (Bolton and Oehmke,
2011).
Thus, CDS initiation exposes syndicate participants to increased information asymmetry
risk. Of course, loan syndicate participants are likely to take actions to protect themselves from
these increased risks arising from CDS initiation, resulting in a new equilibrium loan spread and
share retained by the lead arranger. In the context of the Ivashina (2009) framework, for a given
level of lead bank’s share in the loan, syndicate participants will demand higher spreads because
of CDS initiation, which results in a shift of the syndicate demand curve to the right. This is
shown in Fig. 2, where DSynd_pre and Dsynd_post are the demand curves before and after CDS
initiation.3 Note that in the absence of a shift in the lead arranger’s demand curve, DLeadA, the
resulting equilibrium, E(1), is a greater share retained by the lead arranger after CDS initiation
and a larger loan spread. We refer to this shift in the syndicate participants’ demand curve as the
adverse selection/moral hazard effect arising from CDS initiation. In the limit, if the increase in
the adverse selection/moral hazard effect is sufficiently large, the lead arranger will have to
retain the entire loan, i.e., the loan will be issued as a sole lending loan, and the syndicate
structure fully breaks down.
The second and third economic effects of CDS initiation on loan syndication relate to
shifts in the lead arranger’s demand curve. The first shift arises from the lead arranger’s reduced
cost of hedging exposure to the borrower’s credit risk after CDS initiation. Development of the
CDS market for a borrower provides the lead arranger (and other holders of a borrower’s debt)
with an additional way to hedge or lay off credit risk exposure to the borrower without having to
3 For ease of exposition and because there is no effect on our predictions, we do not consider the slope and potential changes in the slope of the Dsynd and the DLeadA curves after CDS initiation.

10
sell its stake in the loan.4 This enables the lead arranger to reduce the cost of hedging the
borrower’s credit risk while maintaining a lending relationship with the borrower (Saretto and
Tookes, 2013) and provides the lead arranger with an opportunity to reduce regulatory capital
requirements (Martin and Roychowdhury, 2015). Even if lenders do not purchase CDSs
immediately, the existence of CDS markets provides a liquid resale option and makes holding
credit risk more attractive. Because CDS initiation provides an additional way for the lead
arranger to reduce the risk exposure from holding a share in a loan, in the context of the Ivashina
(2009) framework, for each level of shares retained by the lead arranger, the lead arranger is
willing to charge a lower level of loan spread. As shown in Fig. 3, this implies a shift of the lead
arranger’s demand curve to the right, where DLeadA_pre and DLeadA_post_1 are the lead
arranger’s demand curves before and after CDS initiation. Note that in the absence of a shift in
the syndicate participants’ demand curve, Dsynd, after CDS initiation the resulting equilibrium,
E(1), is a greater share retained by the lead arranger but a lower loan spread faced by the
borrower. We refer to this shift in the lead arranger’s demand curve as the diversification effect.
In the limit, if the diversification effect is sufficiently large, the new equilibrium can result in the
lead arranger retaining 100% of the loan, i.e., the loan is issued as a sole lending loan.
The second shift in the lead arranger’s demand curve arises from the fact that CDS
initiation also reduces the cost of speculation for investors who are not creditors. Such investors
may have incentives to cause the borrower to default on its loans (Soros, 2009; Stulz, 2010;
Portes, 2010; Markose et al., 2012; Che and Sethi, 2013), which increases the credit risk of loans
4 Even though, in principle, syndicate participants also can purchase CDSs to reduce their exposure to the borrower’s credit risk, they have less incentive than the lead arranger to do so. Typically the lead arranger’s primary objective in arranging debt financing for the borrower is to generate origination fees, and therefore prefers to have minimal exposure to the borrower’s credit risk. In contrast, syndicate participants purchase shares of the syndicated loans with the objective of generating interest revenue from the loans. Purchasing CDSs by syndicate participants would reduce their exposure to loans at a cost of sacrificing their net revenue.

11
in the lead arranger’s portfolio.5 However, this increase in credit risk likely is idiosyncratic to
the lead arranger and not borne by the syndicate participants. Whereas the lead bank typically
retains a large share of the loan, each syndicate participant typically holds a small proportion and
can diversify away the extra risk arising from CDS initiation (Ivashina, 2009). The increase in
default risk on the lead arranger’s portfolio will shift the lead arranger’s curve to the left, as the
lead arranger will want to diversify more for a given level of interest spread. We refer to this
shift in the lead arranger’s demand curve as the credit risk effect. Thus, despite the potential
benefits of diversification brought about by CDS initiation, it is possible that this credit risk
effect arising from CDS initiation could result in the lead arranger’s curve shifting on net to the
left, which is illustrated as DLeadA_post_2 in Fig. 3. Note that in contrast to the equilibrium
associated with the diversification effect, E(1), the equilibrium associated with the credit risk
effect, E(2), is a smaller share retained by the lead arranger but a greater loan spread faced by the
borrower. That is E(1) and E(2) have opposite effects on share retained by the lead arranger and
loan spread when compared to E(0).
The resulting equilibrium following CDS initiation depends on the relative magnitude of
the adverse selection/moral hazard effect. Returning to Fig. 3, if there is little or no adverse
selection/moral hazard effect, then as noted above, the resulting equilibrium is either E(1) or
E(2). In the case of the first equilibrium, E(1), the diversification effect causes DLeadA_pre to
shift to the right, which results in an increase in the share retained by the lead arranger but a
decrease in the borrower’s loan spread. Conversely, in the case of the second equilibrium, E(2),
the credit risk effect dominates the diversification effect, causing DLeadA_pre to shift to the left
5 To see this, consider the hypothetical example of insurers issuing homeowner policies that provide a payoff to the policyholder in the event of a house fire for a home not owned by the policyholder. Although CDS holders cannot necessarily directly cause a borrower to default on a loan (or, by analogy, “burn down” a home), actions they take collectively in the credit markets—including “bear raiding,” i.e., spreading negative information about a borrower—can make it difficult for a borrower to secure future borrowing.

12
such that there is a decrease in the share retained by the lead arranger but an increase in the
borrower’s loan spread.
However, CDS initiation can result in an increase in the adverse selection/moral hazard
effect such that it is sufficiently large so as to dominate the diversification effect (a shift to the
right) or the credit risk effect (a shift to the left). In this case, as Fig. 3 illustrates, the shift in the
syndicate participants’ demand curve from DSynd_pre to DSynd_post results in increases in
share retained by the lead arranger and loan spread. That is, in Fig. 3, for both of the new
equilibria, E(3) and E(4), share of a loan retained by the lead arranger and loan spread are higher
than are the amounts for E(0). Thus, we will observe an increase in both share of a loan retained
by the lead arranger and loan spread only if there also is an adverse selection/moral hazard effect
that causes a shift to the right in the syndicate participants’ demand curve.
Taken together, Fig. 3 illustrates that CDS initiation can lead to a variety of new
equilibrium combinations of changes in loan share retained by the lead arranger and loan spread.
However, two other observations based on the figures are noteworthy. First, as Fig. 3 makes
clear, an economically significant adverse selection/moral hazard effect following CDS initiation
will lead to an increase in both loan share retained and loan spread. Second, observing either an
increase in loan share retained or loan spread alone is not sufficient for determining whether
there is an adverse selection/moral hazard effect.
One caveat is in order regarding our predictions. As noted above, we expect that the
credit risk effect of CDS initiation will only affect the lead arranger’s demand schedule and not
the syndicate participants’ demand schedule. This assumption may not hold empirically if the
syndicate participants cannot diversify away the credit risk increase. If this is the case, then the
syndicate demand curve could also shift to the right. Such a shift could result in observing an

13
increase in loan spread regardless of the effect of credit risk on the lead arranger’s pricing
schedule, although it is unclear what would be the resulting equilibrium share retained by the
lead arranger. In addition, observing an increase in both loan share and loan spread no longer
would imply that CDS initiation creates a net adverse selection/moral hazard effect that is caused
by lead arranger using CDSs to hedge credit risk. As a result, following Ivashina (2009) and as
described in the section below, we include a proxy for credit risk when conducting our empirical
tests as a control for the impact of change in credit risk on the syndicate participants’ pricing
schedule.
3. Research design
In this section we describe the empirical relations between CDS initiation and changes in
loan syndication ownership structure and loan spread. Following Ashcraft and Santos (2009)
and others, we assume that the first trading date is associated with an economically significant
reduced cost of hedging credit risk and speculation. Because the cost of hedging may not fall
substantially until the CDS market for the borrower becomes liquid enough to make it practical
to hedge credit risk, using the first date can mismeasure when the cost of hedging credit risk
falls, which would make it more difficult to detect effects of CDS initiation on syndicate
ownership structure and spread. In addition, use of the binary event—initiation of CDS
trading—precludes us from exploiting the cross-sectional and intertemporal variation in the
liquidity of the CDS market. Although it is difficult to develop a continuous measure of change
in the cost of hedging credit risk based on CDS market liquidity because standard liquidity
measures such as bid-ask spread and trading volume generally are not publicly available, in
section 5.5.3 below, we extend our tests to include a measure of CDS market liquidity based on
the number of CDS dealers.

14
3.1. The effect of CDS trading on syndicate ownership structure
To test whether CDS initiation leads to an increase, decrease, or no change in the share
retained by the lead arranger, we estimate the following linear regression model given by Eq. (1):
_ it it i i t t itLEAD OWN TradedPost Controls D Dβ γ α α ε= + + + + (1)
_LEAD OWN is percentage of a loan retained by lead arrangers. TradedPost is an indicator
variable that equals one if a loan is issued after the month of CDS initiation, and zero otherwise.
Di, and Dt are firm, and year-month fixed effects, where subscripts i and t refer to borrower and
year and month at loan origination. This methodology, which follows Bertrand and
Mullainathan (2003) and is used in prior studies that examine the effects of events on loan
contracting terms (e.g., Sapienza 2002; Valta, 2012), controls for fixed differences between firms
that have CDS contracts traded and those that do not via the firm fixed effects, and controls for
aggregate fluctuations via the year-month fixed effects. As such, Eq. (1) is essentially a
difference-in-differences research design.6 If CDS initiation is associated with an increase
(decrease, no change) in the share retained by the lead arranger, then 0 ( 0, 0)β β β> < = .
Controls is a set of control variables for a variety of firm- and loan-specific
characteristics suggested by prior research to affect loan syndication. The firm characteristics
include return on assets, ROA; profit margin, Profit; the debt-to asset-ratio, Leverage; firm size
as measured by the natural logarithm of total assets, Log_asset; and a set of indicator variables
corresponding to each of 22 possible credit ratings (e.g., AAA, AA+, AA, etc.).7 Loan
6 Because we cannot assign a specific treatment date for each control firm, we estimate Eq. (1) and Eq. (2) using the Bertrand and Mullainathan (2003) difference-in-differences design. In section 5.4 below, we present findings in which we match each CDS traded firm to a non-CDS traded firm and use the loan immediately before and after CDS initiation for the CDS traded firm. This enables us to use a standard difference-in-differences design because we can identify a treatment date for the non-CDS traded firms. 7 For firms without credit ratings, we follow the approach in Barth et al. (1998) to use accounting measures to generate credit ratings. We also estimated a version of Eqs. (1) and (2) that include an indicator variable for whether

15
characteristics, include loan spread, LoanSpread, revolver lines, Revolver; term loan B or below,
TermLoanB; and presence of guarantors, Guarantor; the loan dollar amount in billions,
LoanAmt; the loan term in months, Maturity; the number of financial covenants, NCOV; an
indicator variable that equals one if a loan is secured and zero otherwise, Securdum; and a set of
30 indicator variables for loan purpose, e.g., whether a loan is used to finance an acquisition or
whether a loan is used to execute a leveraged buyout.8 All firm firm-level variables are
measured as of the most recent quarterly financial reporting date. We cluster standard errors at
the firm level.
3.2. The effect of CDS trading on loan pricing
To examine the effect of CDS initiation on loan pricing, we estimate the following
regression model:
it it i i t t itLoanSpread TradedPost Controls D Dβ γ α α ε= + + + + (2)
The dependent variable, LoanSpread, is loan spread based on the all-in-drawn spreads over
LIBOR at issue date for loans issued to firm i in year t. Because loan spreads are highly skewed,
following prior studies (e.g., Graham, Li, and Qiu, 2008; Chava et al., 2009), we measure
LoanSpread as the natural logarithm of the actual loan spread. If CDS initiation is associated
with an increase (decrease, no change) in the loan spread, then 0 ( 0, 0)β β β> < = . Eq. (2)
includes the same set of control variables as those in Eq. (1), omitting LoanSpread.9 In addition,
we include in Eq. (2) an additional loan characteristic, the number of lenders, Lender_num.
a firm has a credit rating, and do not estimate credit ratings for firms that are not rated. Untabulated findings from these estimates result in the same inferences as those based on tabulated findings. 8 To the extent that changes in ownership structure and loan spread are simultaneously determined, inclusion of loan characteristics, particularly LoanSpread, in Eqs. (1) and (2), can mitigate the effects of potential simultaneity bias on the TradedPost coefficient. 9 We also estimate versions of Eq. (2) in which we replace LoanSpread with each of four non-price loan terms, LoanAmt, Maturity, NCOV, and Securdum, to examine whether there is any trade-off between price and non-price terms. For example, after CDS initiation borrowers may be charged a higher loan spread—CDS initiation is costly,

16
4. Data and sample
We start by merging the quarterly CRSP-Compustat database with Dealscan to identify a
sample of non-financial US firms that have private loan information and accounting and price
information.10 Each observation in the analysis corresponds to a separate loan agreement, i.e.,
loan deal. We use the following steps to identify CDS initiations for the firms in our sample.
First, we identify all the firms in our merged sample that ever had a CDS traded on their debt
according to Markit. Next, following Ashcraft and Santos (2009), for every firm we identify the
first date on which a five-year-to maturity, U.S.-dollar-denominated CDS contract is traded. We
use this date as the date of the onset of CDS trading. We eliminate all firms that have a CDS
initiation date in January 2001 because the Markit database begins its coverage then and thus the
CDS initiation date for these firms is ambiguous. We use all loans in the period 1993-2014 with
available data necessary to estimate Eqs (1) and (2). The resulting sample includes 836 CDS
traded firms with 7,046 loans issued by these firms over the period 1993-2014. This is CDS
traded sample we use for estimation of Eq. (2), the loan spread model.
Using the Markit database to identify the initiation of CDS trading as a means to assess
when the cost of hedging credit risk changed for lead arrangers posses a few challenges. First,
Markit is a contributor-based database. Markit’s CDS User Guide states that as of March 2012,
22 global banks contributed data, with over one million data points are being contributed daily
across approximately 3,000 entity-tiers. For a given contract, Markit calculates a composite
CDS spread if Markit has received prices from at least 3 distinct dealers, of which at least 2 have
but may be able to get expanded access to bank lending capital—CDS initiation is beneficial. If this is the case, then the effect of CDS initiation on loan contract terms is ambiguous. However, following prior research, we can interpret the effect of CDS initiation on loan pricing more definitively if the inferences are consistent across the LoanSpread and four non-price loan term estimations. Untabulated findings indicate that there is no evidence of any such trade-off between spreads and these non-price terms after CDS initiation. 10 Financial firms are those with two-digit SIC between 60 and 64, inclusive (Ivashina, 2009).

17
passed all data cleaning tests that are proprietary to Markit. As a result, the actual date when
CDS trading begins for a firm may not be the same as date trade information first appears on the
Markit database. This is unlikely to be a serious problem because syndicated loan originations
are infrequent, averaging 22 months between consecutive originations for our sample firms.
Therefore, the time lag between the date of initial trading and appearance on the Markit database
would have to be several months or more to misclassify a loan originating before or after CDS
trading.
Second, the Markit database only includes CDS contracts written on bonds, i.e., it does
not include LCDS contracts. Because CDS spreads generally exceed LCDS spreads, it is
possible that the initiation of CDS trading did not lower the cost of hedging for lead arrangers,
and they had to wait until LCDS contracts appeared (if at all) later in our sample period to hedge
credit risk. Nonetheless, as noted above, because the market for LCDS contracts is relatively
illiquid compared to the market for CDS contracts, banks and other purchasers of credit
protection typically use CDS contracts to hedge credit risk of the borrower.11
To develop the sample for estimation of Eq. (1) we exclude observations for which shares
retained by the lead arranger are unavailable. We generally follow Sufi (2007) to identify who
the lead arranger is for a loan deal.12 Lenders’ commitments, including the lead bank’s share, are
settled at the end of loan syndication. As with Ivashina (2009), information regarding shares
11 Whether the cost of hedging for the lead arranger is significantly lower using LCDS than CDS depends on whether they have substantially different spreads as well as the relative liquidity of the two markets. Regarding spreads, untabulated statistics reveal that 93% of our sample CDS contracts are written on senior unsecured bonds, 2% are written on senior secured bonds, and 5% are written on subordinated bonds. Recovery rates for senior bonds are closer to those for loans than for other subordinated bonds. As a result, spreads for our sample firms’ CDS contracts are likely to be closer to those for LCDS than those for other subordinated bonds. 12 We use two variables to classify lenders as either lead arrangers or participants. Both are available from Dealscan. One variable is “Lead arranger credit” and the other is “Lender role”. We designate as lead arrangers any lender for which the field “lead arranger credit” is marked “Yes”. If this field is unavailable, then lenders that act as an administrative agent, agent, arranger, bookrunner, lead arranger, lead bank, or lead manager are defined to be lead arrangers. When a loan has more than one lead arranger, following Ivashina (2009), we treat them as a single entity when calculating share retained by the lead arranger.

18
retained by the lead arranger is available for only approximately 30% of loans for which we can
identify a lead arranger. Ivashina (2009) notes that there is a reporting bias regarding lead
arranger share in DealScan towards large loans, which implies that the sample loans we use in
our tests are likely to relate to relatively large and transparent borrowers. Other things equal, this
will make it difficult to detect changes in share retained by lead arranger and loan spread
following CDS initiation.13 The resulting sample for the lead arranger’s ownership analysis, Eq.
(1), contains 616 CDS traded firms and 2,321 loans issued by these firms. Because lead bank
share is missing more than 70% of the time when loan spread is available, the sample size for the
lead arranger’ ownership analysis is smaller than that for the loan spread analysis, Eq. (2), which
as discussed above contains 836 CDS traded firms with 7,046 loans.14
We obtain our control sample using all US private loans issued by non-CDS-traded firms
with available data in Dealscan. The sample of loans for firms that never have CDS traded
contracts during our sample period includes 4,974 firms with 15,360 loans issued by these firms
over the same period. Thus, for the loan spread analysis, Eq. (2), our sample comprises 22,406
loans (7,046 for CDS traded firms and 15,360 loans for non-CDS traded firms) from 5,810
unique firms (836 CDS traded and 4,974 non-CDS traded firms). For the lead arranger’s
ownership analysis, Eq. (1), there are 6,201 syndicated loans (2,321 and 3,880 loans for CDS and
non-CDS traded firms) from 2,599 firms (616 CDS traded and 1,983 non-CDS traded firms).
Syndicated loans can be structured in several facilities. As a result, following Ivashina (2009),
when there is more than one facility in a loan package, we use the loan characteristics of the
13 Ivashina (2009) also provides evidence that the reporting bias grows stronger over time. Ivashina (2009) suggests that inclusion of time fixed effects mitigates the effects of this bias. Therefore, we include time fixed effects in our research design. 14 Untabulated findings relating to our loan spread analysis using the same sample as the lead arranger’s analysis yield the same inferences as those based on the tabulated findings.

19
largest facility. Specifically, we measure loan spread, loan amount, maturity, and other facility
level variables based on the largest facility.
Table 1, Panel A, presents mean and standard deviation statistics for the full sample, as
well as separate statistics for CDS traded and non-CDS traded firms. The statistics indicate that
there are significant mean differences in firm and loan characteristics between the two groups.
Notably, the CDS traded firms are larger (Log_asset: 8.513 vs. 5.977), more profitable (ROA:
0.023 vs. 0.014), and have better credit ratings (Rating: 10.160 vs. 12.574). In addition, mean
log loan spread and share of the loan retained by the lead arranger are significantly smaller for
CDS traded firms (4.604 vs. 5.197 and 26.2% vs. 37%).
Table 1, Panel B, which presents mean and standard deviation statistics for CDS traded
firms before and after CDS trading, reveals that mean log loan spread and share of the loan
retained by the lead arranger are significantly larger after CDS trading (4.726 vs. 4.490 and
30.5% vs. 22.5%). In addition, there are significant differences in each of the borrower and loan
characteristics. Notably, two credit risk measures, credit ratings and leverage, Rating and
Leverage, are consistent with firms’ credit quality improving slightly after CDS trading, which
taken at face value is inconsistent with the observed increase in loan share retained and spreads
following CDS trading being attributable to an increase in credit risk. In addition, average loan
size and average loan maturity, LoanAmt and Maturity, increase, and the number of financial
covenants for a loan and the likelihood of collateral, NCOV and Securedum, also decrease.
The statistics in Panel B showing that loans within CDS traded firms differ significantly
before and after CDS trading along dimensions suggests the possibility that the firms before and
after CDS initiation fundamentally differ in other unobservable dimensions. If the key
assumption of this design, i.e., the dependent variables in Eqs. (1) and (2) follow parallel trends

20
for CDS and non-CDS traded firms, is valid, then employing our difference-in-differences design
with firm and time fixed effects helps to mitigate the effect on our inferences of such
unobservable differences. However, the statistics in Panel A showing that CDS traded firms
differ significantly from non-CDS traded firms along several dimensions suggests the possibility
that the parallel trend assumption may not hold. Therefore, as discussed in section 5.3 below, we
conduct additional tests to address these issues, including estimation of Eqs. (1) and (2) using a
propensity score-matched sample and an entropy balanced sample.
Finally, Table 1, Panel C, which presents descriptive statistics relating to the distribution
of the number of months between CDS initiation and loan origination, indicates that few sample
loans are originated in the months surrounding CDS initiation. For example, 75% of all loans are
originated at least 23 months before or after CDS initiation. Moreover, the loan origination
distributions before and after CDS initiation are fairly symmetric. These Panel C findings
suggest that CDS initiation does not appear to arise endogenously in anticipation of an increase
in loan origination.
5. Results
5.1. Main Results
Table 2, Columns 1 and 2, reports the regression summary statistics associated with
estimation of Eqs. (1) and (2) using all loans as described in section 4. Regarding Eq. (1), the
key finding is that the TradedPost coefficient, 0.041, is significantly positive (t-statistic =
2.60).15 The magnitudes of the coefficients are also economically significant. In particular, the
TradedPost coefficient implies that the onset of CDS trading leads to an incremental increase in
15 Throughout, when discussing a coefficient, we use the term significant to denote a 5% significance level under a two-sided alternative.

21
the percentage of the loan retained by the lead arranger in excess of 4.1%, which is 12.5% of the
sample mean for loan share retained by CDS traded firms, 30.5%.
This finding is consistent with CDS initiation increasing the loan share retained by the
lead arranger. As explained in the prior section, these increases after CDS initiation could reflect
the positive effect of a more efficient alternative diversification mechanism for the lead arranger
or because the negative effect of reducing the effectiveness of ownership in mitigating
information asymmetry problems. To identify which effect most likely accounts for such an
increase, we now turn to observing the effect of CDS initiation on loan spreads.
Regarding Eq. (2), the key finding in Column 2 is that the TradedPost coefficient is
significantly positive (coefficient = 0.131; t-statistic = 5.68). The magnitude of the coefficient is
also economically significant, implying that the onset of CDS trading leads to an increase of
approximately 13% of loan spreads. This implies that for a firm that faced a loan spread of
197bp before CDS initiation, the average loan spread for firms in our sample, its loan spread
increased to approximately 228bp after CDS initiation. Finding an increase in loan spread
following CDS initiation, together with the finding in Column 1 showing an increase in loan
share retained by the lead arranger, is indicative of a significant increase in the adverse
selection/moral hazard effect.16 Moreover, the findings suggest that CDS initiation results in an
increase in an information asymmetry cost that more than offsets possible diversification benefits
to the lead arranger. Thus, CDS initiation reduces the effectiveness of a lead arranger’s stake in
the loan to serve as a mechanism to address the information asymmetry problems.
16 Although Ashcraft and Santos (2009) does not examine the effect of CDS initiation on the share retained by the lead arranger, viewed in isolation the study’s finding of no effect of CDS trading on loan spreads for the average sample firm suggests that the adverse selection/moral hazard and diversification effects are, on average, offsetting. There are several sample and research design differences between Ashcraft and Santos (2009) and our study that likely account for different loan spread results. For example, relative to our study, Ashcraft and Santos (2009) is limited to a smaller sample (approximately 1/5 our sample size) comprised of mostly larger borrowers that, other things equal, are relatively transparent and less likely to be affected by CDS initiation.

22
The majority of the control variables’ coefficients are significant, with signs that are
largely consistent with prior research. For example, firms with high return on assets, ROA, on
average have a lower cost of debt. Larger firms (Log_asset) and firms with more tangible assets
(Tangible) enjoying lower load spreads, and more highly leveraged firms (Leverage) paying
higher spreads; the significantly negative coefficient on Revolver and significantly positive
coefficient on TermLoanB indicate that revolver loans and term loans B (i.e., those in which
syndicate participants are non-bank institutions) face lower and higher rates (Harjoto et al., 2004;
Zhang, 2008; Nandy and Shao, 2010; Lim et al., 2013).
Regarding the four non-price loan terms, the loan amount (LoanAmt) and the number of
covenants (NCOV) coefficients are insignificant. However, there is a significantly positive
relation between the loan spread and collateral (Securedum) (Berger and Udell, 1990; Bradley
and Roberts, 2004), and a significantly negative relation between loan spread and maturity,
which perhaps reflects the endogenous determination of loan contractual terms.17
We also estimated Eqs. (1) and (2) decomposing Leverage into bank debt leverage and
non-bank debt leverage, which effectively relaxes the constraint that these two sources of
leverage have the same effects on loan syndicate structure and loan spread. We do so to mitigate
the concern that CDS initiation could be correlated with the extent there is a change in firm’s
debt structure, i.e., bank debt vs. non-bank debt, which also could affect loan syndicate structure
and spread. Untabulated findings reveal that although the coefficients on bank debt and non-
bank debt leverage differ from each other, the TradedPost coefficients in the LEAD_OWN and
Log_spread estimations, 0.039 and 0.130 (t-statistics = 2.54 and 5.63), are similar in magnitude
17 Untabulated findings from estimations of Eq. (2) that exclude the four non-price loan terms yield the same inference regarding the association between TradedPost and loan spread, i.e., the TradedPost coefficient is significantly positive. These additional findings are consistent with simultaneous determination of loan terms not being the cause of the positive relation.

23
to those reported in Table 2.18 Relatedly, we also test whether loans are more likely to be used
for refinancing purposes after CDS initiation by estimating a linear probability model of loan
refinancing using the same independent variables and same design as in Eq. (2). Untabulated
statistics reveal that there is no significant difference in the likelihood of loans being used for
refinancing before and after CDS initiation (t-statistic = 1.04).
5.2. Testing for a pre-determined trend
The finding in Table 1 showing that CDS traded firms have different firm characteristics
before and after CDS initiation raises the question of whether there is a pre-determined trend in
the share retained by the lead arranger and loan spread for the CDS traded firms relative to the
non-CDS traded firms. Existence of such a trend could call into question the parallel trend
assumption that underlies the difference-in-differences design of Eqs. (1) and (2). If there is a
pre-determined trend, then such a trend likely begins before CDS initiation, which should
manifest as an increase in loan share retained and spread for loans immediately preceding CDS
initiation (e.g., Heider and Ljungvist, 2015). Therefore, we modify and estimate Eqs. (1) and (2)
by including an indicator variable, Last_loan_beforeCDS, that equals one if the loan is the last
loan originated before CDS initiation, and zero otherwise. In these estimations, the coefficient
on this indicator variable reflects the difference in the loan share retained and spread between the
last loan before CDS initiation and the loans that preceded it. Therefore, finding that this
coefficient is not different from zero provides evidence in support of the parallel trend
assumption in our tests.
18 We construct bank debt and non-bank debt as of the most recent financial reporting date preceding each loan origination date using loan amount and maturity information from Dealscan. Following Ozelge and Saunders (2012), we set bank debt equal to total loans outstanding, and set non-bank debt equal to total debt less total loans outstanding. This approach for calculating loans outstanding using Dealscan is similar to that used by Ivashina et al. (2009) and Gopalan et al. (2011) for calculating the exposure particular banks have to particular borrowers.

24
Table 2, Columns 3 and 4, presents the findings from these estimations. The findings
reveal that the coefficients on the indicator variable, Last_loan_beforeCDS, are insignificant
(coefficients = 0.006 and 0.029, t-statistics = 0.34 and 1.28), which means that the share retained
and spread of the last loans immediately before CDS initiation are not significantly different
from those of the prior loans. The findings also reveal that the indicator variable’s coefficients
are significantly smaller than the TradedPost coefficients, 0.042 and 0.140, which means that
loans following CDS initiation have significantly larger share retained and spread than the last
loans originated before CDS initiation. Taken together these findings not only increase our
confidence that the observed increases in share retained by the lead arranger and loan spread are
not attributable to pre-determined trends, but also increase our confidence that CDS initiation is
the underlying event that affected the observed changes in syndicated loan market structure and
loan pricing.
5.3. Endogeneity: matched sample and instrumental variable approaches
A key assumption of the regression approach represented by Eqs. (1) and (2) and
similarly employed in prior literature (Ashcraft and Santos, 2009; Subarhmanyam et al., 2014) is
that the timing of CDS introduction is exogenous. However, it is possible that the initiation of
CDS trading for a reference entity is the result of an increase in its credit risk or other
unobservable changes. Hence, changes in syndicate ownership structure and loan terms could be
the result of these changes and not CDS initiation. If this is the case, then the estimated
parameters in Eqs. (1) and (2) are subject to endogeneity bias.
We address potential endogeneity bias when assessing the effect of CDS initiation on
loan share retained and loan pricing in two approaches: by estimating Eqs. (1) and (2) using
matched sample approaches and instrumental variables approaches.

25
5.3.1 Matched sample approaches
Regarding the propensity score matched sample approach, we match each CDS traded
firm with a non-CDS traded firm based on propensity scores, and then use the loan observations
of the CDS traded firms and matched non-CDS traded firms to estimate Eqs. (1) and (2). We do
this by first estimating a Probit model with TradedPost as the dependent variable and the firm-
specific variables as independent variables, and then using the estimated model parameters to
calculate propensity scores for each firm.19 We match each CDS firm to the non-CDS trading
firm whose propensity score is closest, doing so without replacement.20 Untabulated statistics
reveal that CDS traded and matched non-CDS traded firms differ significantly only along two
dimensions. In particular, as in prior research (Ashcraft and Santos, 2009; Subrahmanyam et al.,
2014) we find that CDS traded firms are significantly larger and have significantly higher credit
ratings than matched non-CDS traded firms. The effects of these two differences are mitigated
by including firm size and credit rating when estimating Eqs. (1) and (2).
Table 3, Panel A, reports the regression summary statistics associated with estimation of
Eqs. (1) and (2) using the propensity score-matched sample. The key finding is that the
TradedPost coefficient is significantly positive in both estimations (coefficients = 0.031 and
0.064; t-statistics = 2.07 and 2.71). As in Table 2, the magnitudes of the coefficients are also
economically significant, although they are somewhat smaller. In particular, the TradedPost
19 Also, although the unit of analysis for Eqs. (1) and (2) is at the loan level, following Ashcraft and Santos (2009) and Subrahmanyam et al. (2014), we match each CDS traded firm to a non-CDS traded firm based on firm characteristics for both sets of firms as of the quarter in which CDS initiation occurs. To obtain a sample for estimating propensity scores, we use firm-quarter observations. We estimate the propensity score model using all CDS traded firms’ quarterly observations between 2001 and the date of CDS initiation for each firm; and all potential control firms’ quarterly observations between 2001 and the last sample quarter, quarter 4 of 2014. Following Ashcraft and Santos (2009), we begin the propensity score estimation sample in 2001 because this is the earliest year in which a CDS initiation occurs in our sample. 20 Untabulated statistics reveal that the number of CDS traded firms used in the propensity score matched sample tests are 582 and 783 for Eqs. (1) and (2). The loss of 34 and 53 firms is largely attributable to missing data for CDS-traded firms necessary to estimate the Probit model of the likelihood of CDS trading.

26
coefficient implies that the onset of CDS trading leads to an incremental increase in the
percentage of the loan retained by the lead arranger of 3.1% and an increase in loan spread of
approximately 12.8 basis points for the average sample loan.
As noted above, on average the CDS traded firms are larger and have higher credit
ratings than their matched non-CDS traded firms. To mitigate the influence these differences
could have on our inferences, we also estimated Eqs. (1) and (2) using an alternative matching
process, entropy balancing, that by design ensures that the treatment and control groups’
covariates, i.e., firm characteristics, are balanced at the mean (Hainmueller, 2012). Untabulated
findings result in the same inferences regarding the TradedPost coefficients as those based on the
Tables 2 findings. In particular, the TradedPost coefficient is significantly positive in both Eqs.
(1) and (2) (coefficients = 0.032 and 0.065; t-statistics = 1.97 and 2.68).
5.3.2 Instrumental variable approaches
We also apply instrumental variable approaches to mitigate further the concern that CDS
initiation arises endogenously. Following Saretto and Tookes (2013) and Subarhmanyam et al.
(2014), we use the foreign exchange (FX) hedging position of lenders, Lender_FX, as an
instrument for Tradedpost. A lender’s use of foreign exchange hedging is related to its general
propensity to hedge risk. Lenders with larger FX hedging positions are more likely to trade the
CDS of their borrowers. However, because the aggregate FX hedging interests of a bank are
unlikely to be related to the credit quality or other characteristics of a particular borrower,
Lender_FX likely satisfies the exclusion restriction requirement (Saretto and Tookes, 2013;
Subarhmanyam et al., 2014).
To construct Lender_FX, we first identify lenders for our sample firms based on
Dealscan. We then obtain foreign exchange derivative positions of the bank holding companies

27
of borrowers’ lead banks using Federal Reserve Call Reports. For each borrower in each quarter,
Lender_FX is constructed as the ratio of the notional volume of foreign exchange derivatives
used for hedging purposes to total assets, averaged across the banks that served as a lead arranger
for the firm over the previous five years. For each loan origination, we use the Lender_FX from
the most recent quarter. Because our key independent variable, TradedPost, is an endogenous
binary variable, following Bharath et al. (2011) and Saretto and Tookes (2013), we implement
our instrumental variable approach using the method described by Wooldrige (2010).
Specifically, we use a first-stage probit model to estimate the predicted value for TradedPost,
which is then used as an instrument in the standard two-stage least squares estimation.21 When
estimating the probit model for Eqs (1) and (2), in addition to Lender_FX we include all control
variables in the respective equations.22 Untabulated statistics reveal that the probit models for
Eqs (1) and (2) indicate that Lender_FX is not weak. In particular, as predicted, the coefficient
on Lender_FX is positive and significant and the incremental Wald 2χ -statistics are 15.7 and
44.1, and are significant at less than the 0.001 level.
Table 3, Panel B, reports the regression summary statistics associated with estimation of
Eqs. (1) and (2) using the two-stage approach. The key finding is that the coefficient for the
fitted TradedPost coefficient is significantly positive in both estimations (coefficients = 0.161
and 0.411; t-statistics = 5.13 and 9.46). These findings suggest that a one standard deviation
increase in the fitted value of TradedPost from the probit model implies increases in loan share
retained and loan spread of 4.4% and 9.7%, which are consistent with the findings in Table 2.
21 Wooldridge (2010) shows that two-stage least squares coefficients are consistent and their standard errors are still asymptotically valid. 22 Estimating this two-stage procedure with firm fixed effects when the endogenous variable is binary may result in biased coefficients. Therefore, following Saretto and Tookes (2013), we also estimate the two-stage least squares models using industry fixed effects. Inferences from this alternative estimation are identical to the ones reported in the paper.

28
Following Subarhmanyam et al. (2014) we also use the instrumental variable to
implement the Heckman-correction procedure, which involves estimating a probit model using
Lender_FX as an instrumental variable in the first-stage probit model. Untabulated findings
indicate that the effects of CDS initiation on share retained by the lead arranger and loan pricing
are similar to those based on the Table 2 findings. In particular, the TradedPost coefficients are
positive and significant for both Eqs. (1) and (2). In addition, we implemented the propensity
score matched sample approach by including Lender_FX in the probit model used to predict
CDS trading. Untabulated findings yield the same inferences as those based on the Table 3,
Panel A, findings.
Taken together, the findings in Table 3 provide additional support that the inferences we
draw from the Table 2 findings—that CDS initiation has adverse effects on the syndicated loan
market structure and loan pricing—are not the result of the potential endogeneity in the onset of
CDS trading for a firm.
5.4. Loans immediately before and after CDS initiation
The main findings in Table 2 are based on using all loans available during our sample
period. Table 1, Panel C, indicates that the median length of time between CDS initiation date
and loan origination based on all loans is approximately four years. This distance in time
increases the likelihood that other events unrelated to CDS initiation that occur before and after
CDS initiation could be the underlying reason for the increases in the share retained by the lead
arranger and loan spread documented in Table 2. To address this issue, we estimate versions of
Eqs. (1) and (2) that use as observations one loan immediately before and after CDS initiation for
the CDS traded firm and its match. This approach increases our confidence that changes in the

29
share retained by the lead arranger and loan spread for CDS traded firms are attributable to CDS
initiation rather than other events that are unrelated to CDS initiation.
To implement this approach, we first identify four non-CDS traded firms with propensity
scores closest to each CDS traded firm, and assign the CDS initiation date to its four potential
matched firms. Second, from this set of potential matches, we select the non-CDS traded firm
that has loan origination dates closest to the loan dates for the CDS traded firm.23 Minimizing
time differences when selecting a match mitigates the confounding effect of loan differences
arising from being originated at different dates. Limiting the sample of loans to two each for the
CDS traded and its matched non-CDS traded firm results in there being a narrow window of
observation that minimizes the influence of other events on share retained by the lead arranger
and loan spread.24 The median length of time between CDS initiation date and loan origination
for CDS traded firms based on this sample is approximately 1 year (10 and 9 months for loans
before and after CDS initiation). Because each resulting matched pair has the same event date,
i.e., the CDS traded firm’s CDS initiation date, we modify Eqs. (1) and (2) by including an
indicator variable, Post, which equals one if a loan is after the CDS initiation date and zero
otherwise, and an indicator variable, Traded, which equals one if a firm is a CDS traded firm and
zero otherwise, and by replacing firm fixed effects with industry fixed effects (Dj) and year-
month fixed effects with year fixed effects (Dt). The resulting equations are as follows:
1 2 3_ it it it it j j t t itLEAD OWN Post Traded TradedPost Controls D Dβ β β γ α α ε= + + + + + + (3)
23 To do this, for the CDS traded and each potential matched firm, we calculate the number of months between loan origination dates for the two loans immediately before CDS initiation, and repeat this procedure for the two loans immediately after CDS initiation. We then compute the average of the two time differences. We select that non-CDS traded firm with the shortest average time difference. Untabulated statistics reveal the mean (median) average time difference for the resulting matched sample is 10.7 (7.3) months. 24 Untabulated statistics reveal that for both CDS traded and non-CDS traded firms, mean firm characteristics, e.g., ROA, Leverage, and Rating, generally are not statistically or economically different before and after CDS initiation. This is not surprising because the loans, by design, relate to observations that are closer together in time than those for all loans in Table 1.

30
1 2 3it it it it j j t t itLoanSpread Post Traded TradedPost Controls D Dβ β β γ α α ε= + + + + + + (4)
Table 4 presents the regression summary statistics associated with estimation of Eqs. (3)
and (4). There are 231 and 509 matched pairs for Eqs. (3) and (4), comprising 924 and 2,036
loans. The key findings are that the TradedPost coefficients are significantly positive in both
estimations (coefficients = 0.068 and 0.099; t-statistics = 3.15 and 2.94) and, as in Table 2, the
magnitudes of the coefficients are also economically significant. Hence, the findings in Table 4
provide additional support that the inferences we draw from the Table 2 findings—that CDS
initiation has adverse effects on the syndicated loan market structure and loan pricing—are not
the result of other events that are unrelated to the onset of CDS trading for a firm.
5.5. Additional tests: transparency, reputation and liquidity
In this section we present findings from cross-sectional tests to determine whether the
effects of CDS initiation on syndicated loan structure and loan spread vary with borrower
transparency and lead arranger reputation, two factors that prior literature shows moderate the
effects of information asymmetry problems within the loan syndicate. We also present findings
from cross-sectional tests to determine whether the effects of CDS initiation on loan syndication
structure and loan spread vary with CDS market liquidity.
5.5.1. Effect of borrower transparency
The findings in Tables 2 indicate that following CDS initiation there is a significant
increase in the information asymmetry problems. However, if a borrower’s risks and activities
are readily transparent, then the adverse selection problem is less severe and monitoring by lead
arrangers is less important to syndicate participants (Sufi, 2007; Ball et al., 2008). As a result, if
a borrower’s activities are readily transparent, CDS initiation is less likely to have any effect on
adverse selection or moral hazard. In the context of the syndicate analysis in Fig. 3, other things

31
equal, CDS initiation creates less severe information asymmetry problems for a transparent
borrower than for an opaque borrower. As a result, there is a smaller shift to the right of the
syndicate participants’ demand curve, DSynd, for a transparent borrower. Thus, we predict that
CDS initiation causes a smaller increase in share retained by lead arranger and a smaller increase
in loan spread for more transparent firms.
To test our prediction that greater borrower transparency leads to a smaller increase in
shares retained by the lead arranger and a smaller increase in loan spreads, we estimate Eqs. (1)
and (2) separately for firms above and below the sample median, by year, of our financial
reporting transparency measure, DCV. DCV is the debt-contracting value of borrowers’
accounting information developed in Ball, Bushman, and Vasvari (2008) and extended by Dou
(2012). Our DCV measure reflects the inherent ability of firms’ public accounting information to
capture credit quality. DCV is the Somers’ D-statistic derived from the explanatory power of
accounting variables (i.e., earnings, leverage, equity book value and interest coverage) in an
industry-specific probit model of firm credit ratings and ranges from zero—low transparency—
to one—high transparency. As such, DCV reflects the inherent ability of firms’ accounting
amounts to capture credit quality measured at the industry rather than the firm level (see
Appendix for details of how DCV is constructed). If, as we predict, financial reporting
transparency mitigates the adverse effect of CDS trading on loan syndication ownership structure
and loan spread, then the TradedPost coefficient will be smaller for firms with relatively high
DCV.
We use DCV, a measure of financial statement transparency, rather than equity bid-ask
spread or analysts’ coverage (Ashcraft and Santos, 2009) as our measure of transparency for
several reasons. First, whereas DCV relates specifically to the credit market, equity bid-ask

32
spread and analysts’ coverage relate primarily to the equity market. Second, DCV is particularly
relevant to the credit markets at the time of loan initiation because accounting information is the
primary source of information lenders use when they initiate loans. In this regard, prior studies
provide consistent evidence that accounting information plays an important role in the design of
debt contracts (e.g., Ball et al., 2008; Graham et al., 2008; Armstrong et al., 2010; Amiram,
2013). In particular, Ball et al. (2008) demonstrates that when a borrower’s public accounting
information possesses higher DCV, information asymmetry between the lead arranger and other
syndicate participants is lower, which results in lead arrangers being required to retain a lower
loan share.
Table 5, Panel A, reports summary statistics associated with estimation of Eqs. (1) and
(2) for the subsamples of high and low financial reporting transparency, DCV, i.e., firms for
which DCV is above or below the sample median, by year. The key finding in Panel A is that the
TradedPost coefficients are significantly higher for low transparency firms for both analyses,
which is consistent with our prediction that transparency has a moderating influence on the
adverse effect of CDS initiation on the loan syndication market.
Regarding share retained by the lead arranger, Panel A reveals that the TradedPost
coefficients for low and high DCV firms are 0.068 and 0.005, and the difference is significantly
positive ( 2χ -statistic = 10.22, p-value < 0.001).25 These findings imply that CDS trading is
associated with an increase in the percentage of the loan retained by the lead arranger that is
6.3% smaller (= 0.068 – 0.005) for high DCV firms relative to low DCV firms.
25 Because we have a signed prediction for the difference in TradedPost coefficients between low and high transparency firms, we use a 5% significance level under a one-sided alternative. For ease of exposition, the reported p-values in Table 5 assume a two-sided alternative.

33
Finally, regarding loan spread, Panel A reveals that the TradedPost coefficients for low
and high DCV firms are 0.160 and 0.091, and the difference is significantly positive ( 2χ -statistic
= 5.61, p-value = 0.017). This finding implies that CDS trading is associated with an increase in
loan spread that is 6.9% (= 0.160 – 0.091) smaller for high DCV firms relative to low DCV firms,
which is consistent with the finding in Ashcraft and Santos (2009) that opaque firms pay a higher
loan spread following CDS initiation.
We also estimated versions of Eqs. (1) and (2) that use analysts’ coverage, a measure of
transparency used in Ashcraft and Santos (2009), in place of DCV. In particular, we estimate
Eqs. (1) and (2) separately for firms above and below the top quintile of number of analysts
based on each firm’s average number of analysts that follow the firm during our sample period.
Regarding Eq. (1), untabulated findings reveal that the TradedPost coefficients for firms with
number of analysts below and above the top quintile are 0.139 and 0.014, and the difference is
significantly positive ( 2χ -statistic = 18.1, p-value < 0.001). Regarding Eq. (2), untabulated
findings reveal that the TradedPost coefficients for firms with number of analysts below and
above the top quintile are 0.045 and 0.007, and the difference is significantly positive ( 2χ -
statistic = 4.58, p-value = 0.032). These findings support the tabulated findings based on DCV
that high borrower transparency has a moderating influence on the adverse effect of CDS
initiation on the loan syndication market.
5.5.2. The role of lead bank reputation
Another factor that possibly mitigates the information asymmetry problems at the level of
the lead arranger is reputational costs of the lead arranger. The syndicated loan market is one of
repeated interactions, and most reputable lead arrangers may be able to overcome moral hazard
concerns. Sufi (2007), among other studies, finds that lead arranger reputation can serve as an

34
effective mechanism in reducing moral hazard, even though reputation does not eliminate moral
hazard. Thus, because we expect lead arranger banks with higher reputation are less likely to
reduce their monitoring effort, we predict that the negative effect of CDS initiation on loan share
retained and loan pricing is more pronounced for lead arrangers with a less established reputation
in the syndicated loan marketplace. To see this in the context of the syndicate analysis in Fig. 3,
if a high reputation lead arranger has a greater incentive to monitor a borrower than a lead
arranger with a low reputation, then CDS initiation will result in a smaller shift to the right of the
syndicate participants’ demand curve, DSynd_pre.
To test this prediction, we estimate versions of Eqs. (1) and (2) separately for
observations with lead arrangers that have relatively high and low reputations. Following Sufi
(2007), we measure lead arranger reputation, MKT_PCT, as the percentage market share of
syndicated loan amount initiated by the lead arranger in the prior calendar year.26 We classify
observations into high and low reputation subsamples as follows. For each year, we first sort
loans by the MKT_PCT for the loan’s lead arranger. We then classify those loans in the top
quintile of MKT_PCT as the high reputation sample for each given year. Table 5, Panel B,
reports the regression summary statistics relating to the two sets of estimations.
Regarding share retained by the lead arranger, Panel B reveals that the TradedPost
coefficients for the low and high reputation subsamples are 0.047 and 0.012, and the difference is
significantly positive ( 2χ -statistic = 3.12, p-value = 0.074). This finding implies that CDS
trading is associated with an increase in the percentage of the loan retained by the lead arranger
that is 3.5% smaller when a lead arranger has a high reputation.
26 We obtain MKT_PCT from the historical league tables in SDC Platinum. JP Morgan, Bank of American Merrill Lynch, and Citigroup are the largest banks in the syndicated loan market in terms of lending volume during our sample period. These three banks together control approximately 50% of the market share in the global syndicated loan market.

35
Regarding loan spread, Panel B reveals that the TradedPost coefficients for low and high
reputation subsamples are 0.144 and 0.063, and the difference is significantly positive ( 2χ -
statistic = 7.84, p-value = 0.005). This finding implies that CDS trading is associated with an
increase in loan spread that is 8.1% smaller when the lead arranger has a high reputation.
5.5.3. CDS market liquidity
A key assumption in our use of CDS initiation as an indication that the cost of hedging
credit risk decreases for the lead arranger is predicated on the existence of a liquid CDS market.
To the extent that there is heterogeneity in our sample regarding CDS market liquidity, a
question arises whether the effects of CDS initiation on loan syndication structure and loan
spread are greater when CDS market liquidity is higher. To address this question, we re-estimate
Eqs. (1) and (2) for subsamples of observations with relatively high and low CDS market
liquidity. Following Ashcraft and Santos (2009) and Qiu and Yu (2012), we use the number of
distinct dealers providing quotes as our proxy for the liquidity of CDS contracts. We classify a
CDS traded firm as having high (low) CDS market liquidity if the mean number of daily distinct
dealers during the post-CDS initiation period is above (below) the sample median. When
estimating Eqs. (1) and (2) for the subsamples, we use the full control sample of non-CDS traded
firms. Table 5, Panel C, reports the regression summary statistics relating to the two sets of
estimations.
Regarding share retained by the lead arranger, Panel C reveals that the TradedPost
coefficients for the high and low CDS market liquidity subsamples are 0.068 and 0.030, and
significantly so only for the high liquidity subsample (t-statistics = 3.34 and 1.30). Moreover,
the difference is significantly positive ( 2χ -statistic = 3.98, p-value = 0.046). These findings
indicate that CDS trading is associated with an increase in the percentage of the loan retained by

36
the lead arranger only when there is sufficient market liquidity for CDS trading to serve as an
efficient mechanism for the lead arranger to hedge credit risk.
Regarding loan spread, Panel C reveals that the TradedPost coefficients for high and low
CDS market liquidity subsamples are 0.206 and 0.119. Although both coefficients are
significantly positive (t-statistics = 6.18 and 3.95), the difference is significantly positive ( 2χ -
statistic = 5.15, p-value = 0.023). This finding implies that CDS trading is associated with an
increase in loan spread that is 8.7% larger for firms with relatively high levels of CDS market
liquidity.
Taken together, the findings in Table 5 suggest that the increase in information
asymmetry problems we document in Table 2 are concentrated in those loans for which CDS
contracts are relatively liquid.
6. Summary and concluding remarks
In this paper, we provide evidence that the initiation of CDS market trading exacerbates
the information asymmetry problems within the loan syndicate. In particular, we find that, on
average, lead arrangers’ ownership in syndicated loans and loan spreads increase after CDS
initiation. Based on predictions developed using the Ivashina (2009) framework, these two
findings suggest that any potential diversification benefit lead arrangers enjoy following CDS
initiation is more than offset by CDS markets limiting the ability of lead arrangers’ ownership to
mitigate the information asymmetry problems in loan syndication. Inferences from our tests of
the effects of CDS initiation are robust to using a propensity score matched sample, an entropy
balanced sample, instrumental variable approaches, and a sample limited to loans immediately
before and after CDS initiation. Additional findings reveal no evidence of a predetermined trend
in dependent variables for the CDS traded firms relative to the non-CDS traded firms.

37
We corroborate the interpretation of these results by predicting and finding evidence that
the effect of an increase in the information asymmetry problems following CDS initiation is
larger for borrowers with lower transparency and for loans originated by a lead arranger with a
relatively low reputation in the syndicated loan market. Additional findings suggest that the
information asymmetry effects are concentrated in those loans for which CDS contracts are
relatively liquid.
Although our study provides evidence of a significant increase in information asymmetry
problems, it is important to note that this does not imply that there is a net aggregate cost of CDS
trading on the syndicated loan market. In particular, even though lead arranger might have to
retain a larger fraction of each loan they originate and syndicate, because of regulatory capital
and other benefits lead arrangers could be in a position to originate more loans. We leave it to
future research to assess the aggregate costs and benefits of CDS trading on the loan syndication
market.

38
APPENDIX: DCV Construction and Definition Variable Description DCV A credit market based financial reporting transparency measure computed
as the Somers’ D association statistic obtained from industry-specific probit regressions that predict credit ratings; industries are based on Fama and French(1997) industry groupings. Specifically, for any given year, we estimate an ordered probit model using quarterly data in the past five years for each industry grouping:
4 4, , ,1 1 1
4 4, ,1 1
( ) (
)
Nq i n k q k i k q k in k k
k q k i k q k ik k
P Rating N E COV
LEV NW
µ α β
δ γ
− −= = =
− −= =
≤ =Φ + + +
+
∑ ∑ ∑∑ ∑
Rating is constructed by assigning 1 to firms with the highest S&P credit rating AAA in quarter q, 2 to AA+ and so on. E is EBITDA in quarter q-k for firm i divided by total assets at the beginning of the quarter. COV is interest coverage in quarter q-k (EBITDA divided by total interest expense). LEV is the long-term debt in quarter q-k divided by total assets. NW is common equity in quarter q-k divided by total assets. Each regression requires at least 100 firm-quarter observations. DCV is measured as Somers’s D, a goodness-of-fit statistic.

39
References Amiram, D., 2013. Debt contracts and loss given default. Unpublished working paper, Columbia
University.
Ashcraft, A., Santos, J., 2009. Has the CDS market lowered the cost of corporate debt?, Journal of Monetary Economics 56, 514-523.
Armstrong, C., Guay, W., Weber, J., 2010. The role of information and financial reporting in corporate governance and debt contracting. Journal of Accounting and Economics 50, 179-234.
Ball, R., Bushman, R., M., Vasvari, F., 2008. The debt‐contracting value of accounting information and loan syndicate structure. Journal of Accounting Research 46, 247-287.
Barth, M., Beaver, W., Landsman, W. 1998. Relative valuation roles of equity book value and net income as a function of financial health. Journal of Accounting and Economics 25, 1-34.
Berger, A., Udell, G., 1990. Collateral, loan quality and bank risk. Journal of Monetary Economics 251, 21-42.
Bertrand, M., and Mullainathan, S, 2003. Enjoying the quiet life? Corporate governance and managerial preferences. Journal of Political Economy 111, 1043-75.
Bharath, S.T., Dahiya, S., Saunders, A., Srinivasan, A., 2011. Lending relationships and loan contract terms, Review of Financial Studies 24, 1141-1203.
Bolton, P., Oehmke, M., 2011. Credit default swaps and the empty creditor problem. Review of Financial Studies 24, 2617-2655.
Bradley, M., Roberts, M., 2004. The structure and pricing of corporate debt covenants. Unpublished working paper, University of Pennsylvania.
Chava, S., Livdan, D., Purnanandam, A., 2009. Do shareholder rights affect the cost of bank loans?. Review of Financial Studies 22, 2973-3004.
Che, Y., Sethi, R., 2013. Credit market speculation and the cost of capital. Unpublished working paper, Columbia University
Choudhry, M., 2011. Structured credit products: credit derivatives and synthetic securitisation, Edition 2. John Wiley & Sons.
Dou, Y., 2012. The debt-contracting value of accounting numbers, renegotiation, and investment efficiency. Unpublished working paper, University of Toronto.
Fama, E., French, K., 1997. Industry costs of equity. Journal of Financial Economics 43, 153-193.
Gopalan, R., Nanda, V., and Yerramilli, V. 2011. Does poor performance damage the reputation of financial intermediaries? Evidence from the loan syndication market. The Journal of Finance 66, 2083-2120.
Graham, J., Li, S., Qiu, J., 2008. Corporate misreporting and bank loan contracting. Journal of Financial Economics 89, 44-61.

40
Hainmueller, J., 2012. Entropy balancing for causal effects: a multivariate reweighting method to produce balanced samples in observational studies. Political Analysis 20, 25-46.
Harjoto, M., Mullineaux, D., Yi H., 2006. Loan pricing at investment versus commercial banks. Financial Management 35, 49-70.
Heider, F., Ljungqvist, A., 2015. As certain as debt and taxes: estimating the tax sensitivity of leverage from state tax changes. Journal of Financial Economics 118, 684-712.
Hu, H., Black, B., 2008a. Debt, equity and hybrid decoupling: governance and systemic risk implications. European Financial Management 14, 663-709.
Hu, H., Black, B., 2008b, Equity and debt decoupling and empty voting II: importance and extensions. University of Pennsylvania Law Review 156, 625-739.
ISDA., 2013. Summaries of market survey results. http://www.isda.org/statistics/recent.html
Ivashina, V., 2009. Asymmetric information effects on loan spreads. Journal of Financial Economics, 92, 300-319.
Ivashina, V., Nair, V.B., Saunders, A., Massoud, N. and Stover, R., 2009. Bank debt and corporate governance. Review of Financial Studies 22, 41-77.
Lim, J., Minton, B., and Weisbach, B., 2013. Syndicated loan spreads and the composition of the syndicate. Unpublished working paper, Ohio State University
Markose, S., Giansante, S., Shaghaghi, A. R., 2012. ‘Too interconnected to fail’ financial network of US CDS market: Topological fragility and systemic risk. Journal of Economic Behavior & Organization, 83, 627-646.
Martin, X., Roychowdhury, S., 2015. Do financial market developments influence accounting practices? Credit default swaps and borrowers’ reporting conservatism. Journal of Accounting and Economics 59, 80-104
Morrison, A., 2005. Credit derivatives, disintermediation, and investment decisions. Journal of Business 78, 621-47.
Nandy, D., Shao, P., 2010. Institutional investment in syndicated loans. Unpublished working Paper, York University
Portes, R. 2010. “Ban Naked CDS,” Eurointelligence, March 18.
Qiu, J., Yu, F., 2012. Endogenous liquidity in credit derivatives. Journal of Financial Economics 103, 611-631.
Ozelge, S., Saunders, A., 2012. The role of lending banks in forced CEO turnovers. Journal of Money, Credit and Banking 44, 631-659.
Sapienza, P., 2002. The effects of banking mergers on loan contracts. The Journal of Finance, 57, 329-367.
Saretto, A., Tookes, H., 2013. Corporate leverage, debt maturity, and credit supply: the role of credit default swaps. Review of Financial Studies 26, 1190-1247.
Soros, G., 2009. Soros slams ‘instruments of destruction.’ http://money.cnn.com/2009/06/12/news/economy/soros_swaps.reut/index.htm

41
Streitz, D., 2016. The impact of credit default swap trading on loan syndication. Review of Finance 20, 265-286.
Stulz, R., 2010. Credit default swaps and the credit crisis. Journal of Economic Perspectives 24, 73-92.
Subrahmanyam, M., Tang, D., Wang, S., 2014. Does the tail wag the dog? The effect of credit default swaps on credit risk. Review of Financial Studies, 27, 2927-2960.
Sufi, A. 2007. Information asymmetry and financing arrangements: evidence from syndicated loans. The Journal of Finance 62, 629-668.
Thomson Reuters., 2014. Global syndicated loans review.
http://dmi.thomsonreuters.com/Content/Files/4Q2014_Global_Syndicated_Loans_Review.pdf
Valta, P., 2012. Competition and the cost of debt. Journal of Financial Economics 105, 661-682.
Wooldridge, J.M., 2010. Econometric analysis of cross section and panel data: Edition 2. The MIT Press.
Zhang, J., 2008. The contracting benefits of accounting conservatism to lenders and borrowers. Journal of Accounting and Economics 45, 27-54.
42
Fig. 1. Equilibrium outcome of two demand curves within a loan syndicate The share retained by the lead arranger and loan spread are simultaneously determined as the result of interaction between the syndicate participants’ demand curve (adverse selection/moral hazard effect), DSynd, and the lead arranger’s demand curve (diversification effect), DLeadA. E(0) is the equilibrium outcome of the two effects, i.e., the intersection of DSynd and DLeadA.
Lead bank’s share
Loan spread
0 1
Diversification effect (DLeadA)
Adverse selection/moral hazard effect (DSynd)
E (0)
43
Fig. 2. CDS initiation and the adverse selection/moral hazard effect The share retained by the lead arranger and loan spread are simultaneously determined as the result of interaction between the syndicate participants’ demand curve (adverse selection/moral hazard effect), DSynd, and the lead arranger’s demand curve (diversification effect), DLeadA. E(0) is the equilibrium outcome of the two effects before CDS initiation, i.e., the intersection of DSynd_pre and DLeadA. After CDS initiation, if DSynd_pre shifts to the right as indicated by the line, DSynd_post, then the new equilibrium outcome is E(1), i.e., the intersection of DSynd_post and DLeadA.
Loan spread
Lead bank’s share
0 1
Adverse selection/moral hazard effect (DSynd_pre)
Diversification effect (DLeadA)
Adverse selection/moral hazard effect (DSynd_post)
E (1)
E (0)
44
Fig. 3. CDS initiation and the diversification effect vs. the credit risk effect The share retained by the lead arranger and loan spread are simultaneously determined as the result of interaction between the syndicate participants’ demand curve (adverse selection/moral hazard effect), DSynd, and the lead arranger’s demand curve (diversification effect), DLeadA. E(0) is the equilibrium outcome of the two effects before CDS initiation, i.e., the intersection of DSynd_pre and DLeadA_pre. After CDS initiation, if the lead arranger’s demand curve shifts to the right, i.e., from DLeadA_pre to DLeadA_post_1, then the new equilibrium outcome is E(1), i.e., the intersection of DSynd_pre and DLeadA_post_1. If the lead arranger’s demand curve shifts to the left, i.e., from DLeadA_pre to DLeadA_post_2, then the new equilibrium outcome is E(2), i.e., the intersection of DSynd_pre and DLeadA_post_2. After CDS initiation, if there is a substantial shift in the adverse selection/moral hazard curve to the right, i.e., if DSynd_pre shifts to DSynd_post after CDS initiation, then the new equilibrium outcome is E(3) or E(4), i.e., the intersection of DSynd_post and DLeadA_post_2 or the intersection of DSynd_post and DLeadA_post_1.
Loan spread
0 1
Adverse selection/moral hazard effect (DSynd_pre)
Diversification effect (DLeadA_pre)
Lead bank’s share
Diversification effect (DLeadA_post_1)
Credit risk effect (DLeadA_post_2)
E (1)
E (2)
E (0) Adverse selection/moral hazard effect (DSynd_post)
E (3)
E (4)
45
Table 1 Summary Statistics
This table presents summary statistics for the sample of 22,406 syndicated loans representing 5,810 firms from 1993 through 2014. Each observation in the analysis corresponds to one loan agreement. Panel A reports mean and standard deviations statistics of CDS and non-CDS traded firms and their loans. Panel B reports mean and standard deviations statistics of CDS traded firms and their loans before and after CDS initiation. ROA is return on assets, defined as operating income after depreciation, divided by total assets. Profit is profit margin, defined as operating income after depreciation, divided by total sales. Leverage is total debt (short-term debt plus long-term debt), divided by total assets. Tangible is defined as property, plant and equipment (PPE), divided by total assets. Log_asset is the natural logarithm of a firm’s total asset. DCV is a credit market-based financial reporting transparency measure, computed as the Somers’ D association statistics from industry-specific probit regressions that predict credit ratings. Rating is a numeric rank of S&P credit ratings. We assign 1 to AAA, 2 to AA+, 3 to AA, etc. Log_spread is the natural logarithm of interest spread of the largest facility within a loan package, which equals the spread between the interest rate on the loan and the relevant Libor rate, per dollar of loan facility, measured in basis points. LoanAmt is the dollar amount of the largest facility within a loan package, measured in billions. Maturity is the term of the largest facility within a loan package, measured in months. NCOV is the number of financial and net worth covenants for a loan deal. Securedum is an indicator variable that equals one if the debt is secured and zero otherwise. LEAD_OWN is the fraction of the loan deal owned by the lead arranger. TermLoanB is an indicator variable that equals one if the loan is term loan B, C, or D, and zero otherwise. Revolver is an indicator variable that equals one if the loan is a revolver, and zero otherwise. Guarantor is an indicator variable that equals one when borrower has a guarantor, and zero otherwise. Lender_num is the number of lenders on a loan. MKT_PCT is the percentage market share of syndicated loan amount initiated by the lead arranger in the prior calendar year. Panel B reports the distribution of the length of time between CDS initiation and loan origination (in months). *, **, and *** indicate significance at the 10%, 5%, and 1% level. Panel A: Loans for CDS traded firms and non-CDS traded firms
All loans (N=22,406)
Loans for CDS traded firms (N=7,046)
Loans for non-CDS traded firms (N=15,360)
Variable Mean Std Dev Mean Std Dev Mean Std Dev Diff. (A) (B) B-A
Borrower Characteristics
ROA 0.017 0.037
0.023 0.022
0.014 0.042
–0.009 ***
Profit –0.024 0.444
0.035 0.253
–0.050 0.506
–0.085 ***
Tangible 0.348 0.263
0.407 0.256
0.321 0.261
–0.085 ***
Leverage 0.330 0.225
0.369 0.198
0.312 0.234
–0.056 ***
Log_asset 6.775 1.974
8.513 1.329
5.977 1.688
–2.536 ***
Rating 11.815 3.612
10.160 3.801
12.574 3.252
2.414 ***
DCV 0.510 0.124
0.494 0.127
0.517 0.122
0.023 ***
Loan Characteristics
Log_spread 5.011 0.810
4.604 0.901
5.197 0.689
0.593 ***
LEAD_OWN 0.329 0.220
0.262 0.198
0.370 0.222
0.108 ***
LoanAmt 0.367 0.592
0.714 0.803
0.208 0.368
–0.506 ***
Maturity 44.237 23.347
44.462 24.571
44.134 22.764
–0.328
NCOV 1.509 1.525
1.127 1.314
1.685 1.581
0.557 ***
Securedum 0.509 0.500
0.284 0.451
0.612 0.487
0.327 ***

46
Table 1 (continued)
Lender_num 7.141 7.187
11.058 8.169
5.344 5.872
–5.714 ***
Revolver 0.767 0.423
0.763 0.425
0.769 0.421
0.007
TermLoanB 0.075 0.263
0.089 0.285
0.068 0.252
–0.021 ***
Guarantor 0.082 0.274
0.082 0.275
0.082 0.274
0.000
MKT_PCT 15.513 14.644 20.061 14.151 13.426 14.393 –6.635 *** Panel B: Loans before and after CDS initiation for CDS traded firms
Loans before CDS initiation (N=3,639)
Loans after CDS initiation (N=3,407)
Variable Mean Std Dev Mean Std Dev Diff. (A) (B) B–A
Borrower Characteristics
ROA
0.024 0.024
0.022 0.020
–0.001 **
Profit
0.022 0.283
0.049 0.216
0.027 ***
Tangible
0.418 0.259
0.394 0.253
–0.023 ***
Leverage
0.376 0.205
0.361 0.191
–0.016 ***
Log_asset
7.999 1.320
9.062 1.099
1.064 ***
Rating
10.378 4.068
9.928 3.479
–0.450 ***
DCV
0.519 0.124
0.469 0.126
–0.050 ***
Loan Characteristics
Log_spread 4.490 0.902
4.726 0.883
0.236 ***
LEAD_OWN 0.225 0.186
0.305 0.204
0.080 ***
LoanAmt
0.488 0.544
0.955 0.951
0.467 ***
Maturity
41.460 26.088
47.668 22.404
6.208 ***
NCOV
1.262 1.477
0.984 1.096
–0.279 ***
Securedum 0.303 0.460
0.264 0.441
–0.038 ***
Lender_num 10.637 8.719
11.507 7.514
0.870 ***
Revolver
0.779 0.415
0.746 0.435
–0.033 ***
TermLoanB 0.068 0.251
0.112 0.315
0.044 ***
Guarantor 0.049 0.216
0.117 0.322
0.068 ***
MKT_PCT 21.075 16.953 18.978 10.244 –2.097 *** Panel C: Distribution of length of time (number of months) between CDS initiation and loan origination
25% Median Mean 75%
All loans before CDS initiation 23 51 58 85 All loans after CDS initiation 23 49 59 93 Latest loans before CDS initiation 5 11 23 31 First loans after CDS initiation 4 10 19 26

47
Table 2 Effect of CDS trading on loan syndicate structure and loan spread This table reports the results of OLS regressions investigating the effects of CDS trading on the syndicated loan market. Each observation in the analysis corresponds to one loan agreement. The dependent variable in Column 1 and 3 (LEAD_OWN) is the share of the loan deal retained by the lead arranger, and the dependent variable in Column 2 and 4 (Log_spread) is the natural logarithm of loan spread (in basis points). The central explanatory variable is TradedPost, an indicator variable that equals one if a loan is issued after the month of CDS initiation, and zero otherwise. Column 3 and 4 report the results of OLS regressions investigating whether there are pre-determined trends in the dependent variables for CDS traded firms relative to non-CDS traded firms. We include in Eqs.(1) and (2) an indicator variable Last_loan_beforeCDS, which equals one for the last loan before CDS initiation for CDS traded firms and zero otherwise. We include borrower, year-month, credit rating (i.e., AAA, AA+, etc.), and loan purpose fixed effects in all regressions. See Table 1 for definitions of the remaining variables. t-statistics in parentheses are based on standard errors clustered by borrower. *, ** and *** indicate significance at the 10%, 5% and 1% level, respectively. (1) (2) (3) (4) Variables LEAD_OWN Log_spread LEAD_OWN Log_spread
TradedPost 0.041***
0.131***
0.042**
0.140***
(2.60)
(5.68)
(2.38)
(5.45)
Last_loan_beforeCDS ––
––
0.006
0.029
(0.34)
(1.28)
Firm Characteristics
ROA –0.513**
–1.505***
–0.513**
–1.505***
(–2.09)
(–7.40)
(–2.22)
(–7.40)
Profit 0.006
0.041**
0.011
0.041**
(0.23)
(2.25)
(0.45)
(2.25)
Tangible 0.020
–0.224***
0.022
–0.223***
(0.28)
(–3.36)
(0.30)
(–3.34)
Leverage –0.056
0.388***
–0.057
0.388***
(–1.33)
(10.22)
(–1.35)
(10.19)
Log_asset –0.053***
–0.125***
–0.052***
–0.125***
(–4.84)
(–11.57)
(–4.80)
(–11.58)
Loan Characteristics
LoanAmt –0.010
0.014
–0.011
0.014
(–0.89)
(1.10)
(–0.94)
(1.07)
Maturity –0.002***
–0.001***
–0.002***
–0.001***
(–5.73)
(–3.70)
(–5.60)
(–3.70)
NCOV –0.013***
0.003
–0.013***
0.003
(–2.94)
(0.70)
(–2.92)
(0.70)
Log_spread 0.029***
––
0.029***
––
(2.64)
(2.60)
Securedum –0.003
0.188***
–0.003
0.188***
(–0.24)
(13.69)
(–0.23)
(13.68)
Revolver –0.096***
–0.272***
–0.096***
–0.272***
(–4.67)
(–17.65)
(–4.68)
(–17.64)
TermLoanB 0.078
0.135***
0.077
0.135***
(1.06)
(5.64)
(1.05)
(5.63)

48
Table 2 (continued)
Guarantor 0.010
0.014
0.011
0.014
(0.63)
(0.82)
(0.66)
(0.83)
Lender_num ––
–0.004***
––
–0.004***
(–5.04)
(–5.07)
Credit Rating FE YES
YES
YES
YES Firm FE YES
YES
YES
YES
YearMonth FE YES
YES
YES
YES Loan Purpose FE YES
YES
YES
YES
Observations 6,201
22,406
6,201
22,406 Adjusted R-squared 0.514 0.752 0.513 0.753

49
Table 3 Effect of CDS trading on loan syndicate structure and loan spread, matched sample and instrument variable approach This table reports the results of OLS regressions investigating the effects of CDS trading on the syndicated loan market using a propensity score matched sample (Panel A) and an instrument variable approach (Panel B). Each observation in the analysis corresponds to one loan agreement. The dependent variable in Column 1 (LEAD_OWN) is the share of the loan deal retained by the lead arranger, and the dependent variable in Column 2 (Log_spread) is the natural logarithm of loan spread (in basis points). The central explanatory variable is TradedPost, an indicator variable that equals one if a loan is issued after the month of CDS initiation, and zero otherwise. In panel A, matched non-CDS traded firms are selected based on propensity scores estimated from a probit model of CDS trading on firm characteristics. Panel B presents the instrumental variable regressions results. The instrument for TradedPost is the average amount of foreign exchange derivatives used for hedging purposes (not trading) relative to total assets of the lead banks that the borrower has done business with in the past five years (Lender_FX). Regressions include borrower, year-month, credit rating (i.e., AAA, AA+, etc.), and loan purpose fixed effects and the set of firm and loan characteristic control variables in Table 2. t-statistics in parentheses are based on standard errors clustered by borrower. *, ** and *** indicate significance at the 10%, 5% and 1% level, respectively. Panel A: propensity score matched sample
(1)
(2)
Variables LEAD_OWN Log_spread TradedPost 0.031** 0.064*** (2.07) (2.71) Controls YES YES Credit Rating FE YES YES Firm FE YES YES YearMonth FE YES YES Loan Purpose FE YES YES Observations 3,747 11,138 Adjusted R-squared 0.483 0.771 Panel B: IV approach
(1)
(2)
Variables LEAD_OWN Log_spread
TradedPost IV 0.161***
0.411***
(5.13)
(9.46)
Controls YES
YES Credit Rating FE YES YES Firm FE YES
YES
YearMonth FE YES
YES Loan Purpose FE YES
YES
Incremental Wald 2χ of IV from the
first stage probit model 15.7
(p-value < 0.001) 44.1
(p-value < 0.001) Observations 6,201 22,406 Adjusted R-squared 0.514 0.752

50
Table 4 Effect of CDS trading on loan syndicate structure and loan spread, loans immediately before and after CDS initiation This table reports the results of OLS regressions investigating the effects of CDS trading on the syndicated loan market using the loans immediately before and after CDS initiation date for CDS traded firms and matched non-CDS traded firms. Matched non-CDS traded firms are selected based on propensity scores estimated from a probit model of CDS trading on firm characteristics. Each observation in the analysis corresponds to one loan agreement. The dependent variable in Column 1 (LEAD_OWN) is the share of the loan deal retained by the lead arranger, and the dependent variable in Column 2 (Log_spread) is the natural logarithm of loan spread (in basis points). Traded is an indicator that equals one if a firm is a CDS traded firm and zero otherwise, Post is an indicator that equals one if a loan is after the CDS initiation date and zero otherwise. The central explanatory variable is TradedPost, an indicator variable that equals one if a loan is issued after CDS initiation, and zero otherwise. Regressions include borrower, year-month, credit rating (i.e., AAA, AA+, etc.), and loan purpose fixed effects and the set of firm and loan characteristic control variables in Table 2. t-statistics in parentheses are based on standard errors clustered by borrower. *, ** and *** indicate significance at the 10%, 5% and 1% level, respectively. (1) (2) Variables LEAD_OWN Log_spread
Traded –0.074***
–0.060
(–3.03)
(–1.48)
Post –0.044**
–0.076***
(–2.41)
(–2.78)
TradedPost 0.068***
0.099***
(3.15)
(2.94)
Controls YES YES Credit Rating FE YES YES Industry FE YES YES Year FE YES YES Loan Purpose FE YES YES Observations 924
2,036
Adjusted R-squared 0.271 0.754
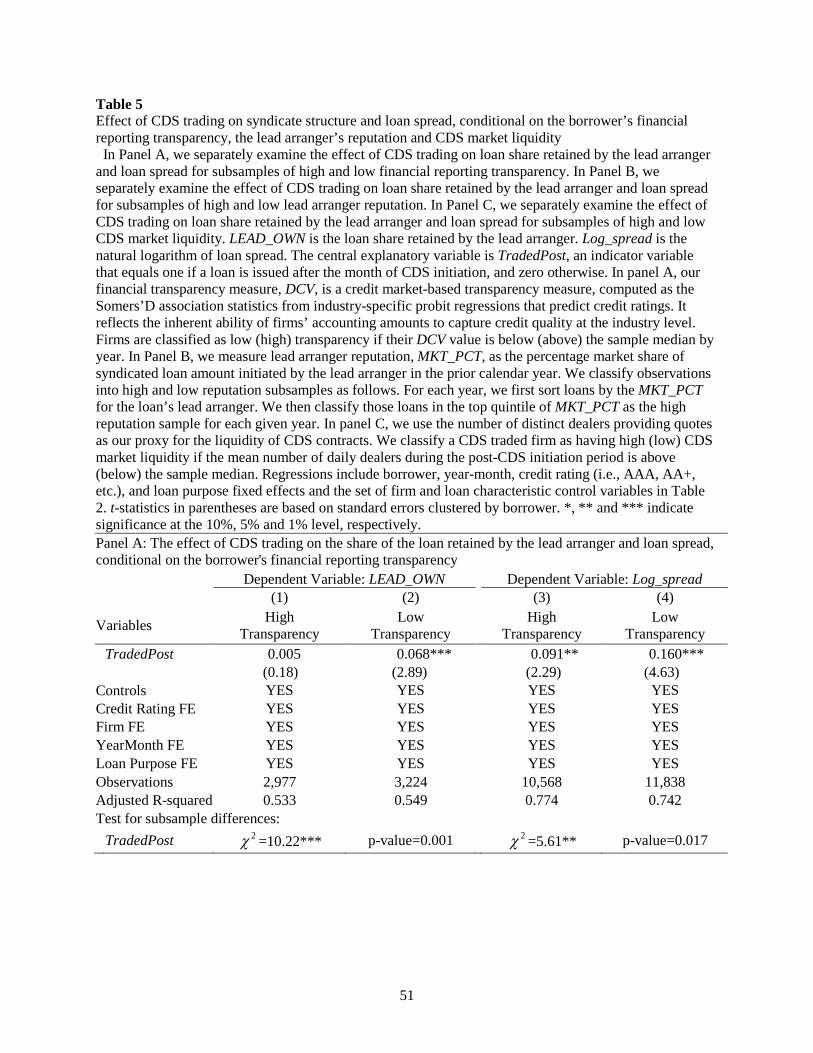
51
Table 5 Effect of CDS trading on syndicate structure and loan spread, conditional on the borrower’s financial reporting transparency, the lead arranger’s reputation and CDS market liquidity In Panel A, we separately examine the effect of CDS trading on loan share retained by the lead arranger and loan spread for subsamples of high and low financial reporting transparency. In Panel B, we separately examine the effect of CDS trading on loan share retained by the lead arranger and loan spread for subsamples of high and low lead arranger reputation. In Panel C, we separately examine the effect of CDS trading on loan share retained by the lead arranger and loan spread for subsamples of high and low CDS market liquidity. LEAD_OWN is the loan share retained by the lead arranger. Log_spread is the natural logarithm of loan spread. The central explanatory variable is TradedPost, an indicator variable that equals one if a loan is issued after the month of CDS initiation, and zero otherwise. In panel A, our financial transparency measure, DCV, is a credit market-based transparency measure, computed as the Somers’D association statistics from industry-specific probit regressions that predict credit ratings. It reflects the inherent ability of firms’ accounting amounts to capture credit quality at the industry level. Firms are classified as low (high) transparency if their DCV value is below (above) the sample median by year. In Panel B, we measure lead arranger reputation, MKT_PCT, as the percentage market share of syndicated loan amount initiated by the lead arranger in the prior calendar year. We classify observations into high and low reputation subsamples as follows. For each year, we first sort loans by the MKT_PCT for the loan’s lead arranger. We then classify those loans in the top quintile of MKT_PCT as the high reputation sample for each given year. In panel C, we use the number of distinct dealers providing quotes as our proxy for the liquidity of CDS contracts. We classify a CDS traded firm as having high (low) CDS market liquidity if the mean number of daily dealers during the post-CDS initiation period is above (below) the sample median. Regressions include borrower, year-month, credit rating (i.e., AAA, AA+, etc.), and loan purpose fixed effects and the set of firm and loan characteristic control variables in Table 2. t-statistics in parentheses are based on standard errors clustered by borrower. *, ** and *** indicate significance at the 10%, 5% and 1% level, respectively. Panel A: The effect of CDS trading on the share of the loan retained by the lead arranger and loan spread, conditional on the borrower's financial reporting transparency
Dependent Variable: LEAD_OWN
Dependent Variable: Log_spread
(1) (2)
(3) (4)
Variables High Transparency
Low Transparency High
Transparency Low
Transparency
TradedPost 0.005 0.068***
0.091** 0.160***
(0.18) (2.89)
(2.29) (4.63)
Controls YES YES
YES YES Credit Rating FE YES YES
YES YES
Firm FE YES YES
YES YES YearMonth FE YES YES
YES YES
Loan Purpose FE YES YES
YES YES Observations 2,977 3,224
10,568 11,838
Adjusted R-squared 0.533 0.549
0.774 0.742 Test for subsample differences:
TradedPost 2χ =10.22*** p-value=0.001 2χ =5.61** p-value=0.017

52
Table 5 (continued) Panel B: The effect of CDS trading on the share of the loan retained by the lead arranger and loan spread, conditional on the lead arranger reputation
Dependent Variable: LEAD_OWN
Dependent Variable: Log_spread
(1) (2)
(3) (4)
Variables High Reputation Low Reputation High Reputation Low Reputation
TradedPost 0.012 0.047*
0.063* 0.144***
(0.44) (1.79)
(1.75) (4.38)
Controls YES YES
YES YES Credit Rating FE YES YES
YES YES
Firm FE YES YES
YES YES YearMonth FE YES YES
YES YES
Loan Purpose FE YES YES
YES YES Observations 2,166 4,035
6,641 15,765
Adjusted R-squared 0.620 0.520
0.805 0.736 Test for subsample differences:
TradedPost 2χ =3.12* p-value=0.074 2χ =7.84*** p-value=0.005
Panel C: The effect of CDS trading on the share of the loan retained by the lead arranger and loan spread, conditional on the CDS market liquidity
Dependent Variable: LEAD_OWN
Dependent Variable: Log_spread
(1) (2)
(3) (4)
Variables High Liquidity Low Liquidity High Liquidity Low Liquidity
TradedPost 0.068*** 0.030
0.206*** 0.119***
(3.34) (1.30)
(6.18) (3.95)
Controls YES YES
YES YES Credit Rating FE YES YES
YES YES
Firm FE YES YES
YES YES YearMonth FE YES YES
YES YES
Loan Purpose FE YES YES
YES YES Observations 4,923 5,158
18,334 19,432
Adjusted R-squared 0.532 0.496
0.744 0.717 Test for subsample differences:
TradedPost 2χ =3.98** p-value=0.046 2χ =5.15** p-value=0.023