the effects of cds trading initiation on the structure of ... documents... · the effects of cds...
TRANSCRIPT

The Effects of CDS Trading Initiation on the Structure of Syndicated Loans
Dan Amiram Columbia Business School
Columbia University
William Beaver Graduate School of Business
Stanford University
Wayne R. Landsman* and Jianxin Zhao Kenan-Flagler Business School
University of North Carolina
February 2015
*Corresponding author: [email protected]. We thank Robert Bushman, Doron Nissim, Alon Kalay, and workshop participants at the University of North Carolina Chapel Hill for helpful comments. We appreciate funding from the Center for Finance and Accounting Research, Kenan-Flagler Business School, the Center for Global Business and the Economy, Stanford Graduate School of Business, and Columbia Business School.
The Effects of CDS Trading Initiation on the Structure of Syndicated Loans
Abstract The initiation of a credit default swap (CDS) market for an entity’s debt can introduce both negative and positive externalities to the syndicated loan market that may alter the equilibrium ownership structure in that market. We find that, after the initiation of CDS trading, both the share of loans retained by syndicate lead arrangers and the incidence of sole lending loans experienced a significant increase. Further evidence shows that this finding is consistent with CDS initiation introducing a negative externality to the syndicated loan market by reducing the effectiveness of a lead arranger’s stake in the loan so serve as a mechanism to address the adverse selection/moral hazard problem in this market. We conduct our analyses using a sample of 20,780 loan contracts from Dealscan over the period 1993-2011, and test for changes loan syndication structure using a difference-in-difference research design. We corroborate the interpretation of the main results by predicting and providing evidence that the negative externality we document is moderated for firms with greater transparency and for loans originated by a lead arranger with a strong reputation in this market. Inferences from our tests of the effects of CDS initiation are robust to using propensity score matching and the Heckman two-stage correction for self-selection bias.

!
!
1. Introduction
The emergence of the credit default swap (CDS) is one of the most important financial
innovations of the last twenty years. These instruments, which pay their holders the face value in
a case of a reference entity credit event in a return for a premium, were issued first in the early
1990s and reached a peak of $62.2 trillion of notional outstanding value (ISDA, 2013).
Although theoretical work suggests that this financial innovation can introduce both positive and
negative externalities to the structure of ownership in the syndicated loan market, which is a
primary source of corporate financing, to date there is little empirical evidence investigating the
effect of these forces. We find that share of loans retained by syndicate lead arranger banks and
the incidence of sole lending loans significantly increase after CDS initiation. We provide
additional evidence that suggests that these findings are consistent with the CDS market
introducing a negative externality to the syndicated loan market by reducing the effectiveness of
a lead arranger’s stake in the loan to serve as a mechanism to address the adverse selection/moral
hazard problem in this market.
Loan syndication has evolved as an efficient mechanism that permits the lead arranger to
share risk with syndicate participants, who depend on the lead arranger to screen borrowers
before loan syndication and monitor borrowers throughout the life of the loans. Adverse
selection and moral hazard problems arise because the lead arranger’s screening and monitoring
efforts are unobservable. To mitigate these information asymmetry problems, syndicate
participants require the lead arranger to retain a larger share of a loan, i.e., have “skin in the
game,” than would otherwise be optimal from a pure risk-sharing perspective. Initiation of a
CDS market introduces several externalities to the syndicated loan market. First, CDSs create a
positive externality in that they provide an alternative mechanism through which the lead

!
2!
arranger can shed risk in a loan, thereby reducing the need to sell a significant share of a loan to
syndicate participants. However, the ability of the lead arranger to shed risk using CDSs
introduces a negative externality in that CDS trading reduces the effectiveness of lead arranger
ownership to serve as a mechanism to mitigate the information asymmetry problems of adverse
selection and moral hazard. CDS initiation introduces another potential negative externality by
increasing the default risk of the referenced entity (the borrower) because speculators that hold
CDSs on the borrower may have incentives to encourage it to default. An increase in default risk
increases the lead arranger’s incentive to reduce loan ownership. How these externalities to the
syndicated market arising from CDS market initiation play out in affecting loan syndication
structure is, to date, an unexplored empirical matter and therefore the focus of our study.
We begin our study by first developing a framework for understanding the effects of
these forces on loan syndication. We do this by building on Ivashina (2009), which develops an
equilibrium model of loan syndication in which the observed loan spread and a lead bank’s share
of a loan corresponds to the intersection of two pricing schedules representing the syndicate
participants’ demand for a proportional share of a loan and the lead bank’s willingness to retain a
proportional share of a loan. We show that although CDS initiation can lead to a variety of new
equilibrium combinations of loan share retained by the lead arranger and borrower loan spread,
empirically observing an increase in both loan share retained and loan spread is not possible
without CDS initiation creating an economically significant increase in the adverse
selection/moral hazard associated with loan syndication.
To analyze empirically the effect of CDS trading initiation on the syndicated loan market,
we use a comprehensive dataset on CDS trading from Markit and collect a sample of 20,780 loan
contracts from Dealscan over the period 1993-2011. We use a difference-in-difference research

3"
design to investigate the effects of CDS initiation on the share retained by the lead arranger and
in increase in the likelihood of non-syndicated lending of subsequent loans for loans issued by
firms before and after there are CDS contracts traded on the firms’ debt. In all tests we include
as controls a wide range of firm- and loan-specific characteristics. We find that CDS initiation
results in an increase in the loan share retained by the lead arranger and an increase in the
probability of sole lending. These findings are consistent with CDS initiation introducing both a
positive externality arising from the availability to the lead arranger of an alternative means to
diversify holdings in a loan as well as a negative externality arising from the reduced
effectiveness of lead arranger ownership to serve as a mechanism to mitigate adverse selection
and moral hazard problems. Therefore, using a difference-in-difference research design, we also
test for the effect on loan spreads arising from CDS initiation and find that average loan spread
also increases following CDS initiation. As we explain in section 2, finding an increase in both
loan share retained by the lead arranger and loan spread is evidence consistent with CDS
initiation introducing an economically negative externality in the loan syndication market that
more than offsets any possible positive externality from diversifcation.
To corroborate the interpretation of our results we also test whether this negative
externality is moderated, as expected, for firms with greater transparency. If a borrower’s risks
and activities are more transparent, then the adverse selection/moral hazard problems are less
severe and monitoring by lead arrangers is less important to syndicate participants. As a result,
the adverse selection/moral hazard problem created by CDS trading is likely to be less severe for
more transparent firms. We test our prediction of a moderating influence of a borrower’s
transparency using a measure of the debt-contracting value of borrowers’ accounting information
in explaining credit ratings. Findings from these tests support our prediction as evidenced by a

4"
smaller increase in loan share retention, probability of sole lending, and loan spreads following
CDS initiation for firms with higher transparency. Similarly, we also find that, as predicted, our
documented effects of CDS initiation on loan share retention and the probability of sole lending
and loan spreads are less pronounced when the lead arranger has a strong reputation in the
syndicated loan market. Findings from additional tests reveal that inferences from our tests of
the effects of CDS initiation are robust to using propensity score matching and the Heckman
two-stage correction for self-selection bias.
Our study contributes to the literature by being the first to document the effects of CDS
imitation on syndicated loan ownership structure. Second, our study contributes to the literature
by being first to provide evidence that the initiation of a CDS market introduces a negative
externality to the loan syndication market. These findings also contribute to the broader debate
regarding the costs and benefits of credit derivatives by demonstrating the impact of CDSs on the
loan syndication market.
The remainder of the paper is organized as follows. The next section discusses the
institutional background, related literature, and provides our predictions. Section 3 presents our
research design, section 4 describes our sample and data, and section 5 presents our results.
Section 6 provides concluding remarks.
2. Institutional Background, Related Literature, and Predictions
2.1 Loan syndication
In a syndicated loan, a lead arranger—typically a commercial or investment bank—
arranges for an entity to borrow funds from a pool of lenders that often are other commercial or
investment banks, or other institutional investors such as hedge funds and pension funds. A key

5"
purpose of loan syndication is that it permits the primary lender, i.e., the lead arranger, to
diversify risk and to hold a portion of the loan rather than the full amount of the loan.
The lead arranger screens borrowers for creditworthiness and is responsible for
monitoring the borrower over the life of the loan. Because screening and monitoring efforts are
costly and unobservable, the loan syndication process suffers from an adverse selection and a
moral hazard problem that potentially can adversely affect the loan syndication process. The
adverse selection problem arises from syndicate participants being at an informational
disadvantage relative to the lead arranger because the lead arranger screens borrowers – many of
which often have long-term relationships with the lead arranger. Therefore, at the time of loan
origination and syndication, there is no direct means for syndicate participants to observe the risk
characteristics of the borrower that are relevant to loan pricing. Subsequent to origination,
syndicate participants rely on the lead arranger to monitor the borrower for changes in credit
worthiness but have no means to observe directly efforts undertaken by the lead arranger, which
therefore creates moral hazard problem. If these information problems are severe enough, there
could be a breakdown in the syndication process, whereby the lead arranger cannot attract other
lenders to participate in the syndicate.
A costly means to solve the adverse selection/moral hazard problem is for the lead
arranger to hold a portion of the loan; requiring the lead arranger to have “skin in the game”
(e.g., Sufi, 2007) serves as a commitment for the lead arranger to set loan terms that reflect the
riskiness of the loan and to exert monitoring effort subsequent to loan origination/syndication.
The solution is costly because the lead arranger is unable to diversify its holding of the loan as
much as would be the case in the absence of adverse selection and moral hazard. Of course, if
the borrower’s activities and risk characteristics are observable at relatively low cost by lenders,

6"
including loan syndication participants, particularly if their accounting information is
transparent, then information asymmetry between the lead arranger and the other lenders in the
syndicate is mitigated, and the lead arranger may be required to retain a smaller portion of the
loan.
Ivashina (2009) develops an equilibrium model in which the observed loan spread and a
bank’s share of a loan corresponds to the intersection of two pricing schedules representing the
syndicate participants’ demand for a proportional share of a loan and the lead bank’s willingness
to retain a proportional share of a loan. Figure 1, which plots loan spread and share retained by
the lead arranger, illustrates the model. In the presence of adverse selection arising from
syndicate participants being unable to observe the creditworthiness of the borrower and the
moral hazard problem arising from their inability to assess whether the lead arranger monitors
the borrower’s activities throughout the life of the loan, the syndicate participants demand curve,
is downward-sloping. Other things equal, syndicate participants demand a higher loan spread the
greater is the adverse selection/moral hazard problem. The downward slope of their demand
curve, DSynd, reflects their requiring a lower loan spread when the lead arranger retains a larger
proportion of the loan, which reduces the adverse selection/moral hazard problem. Because of
the lead arranger’s desire to diversify loan portfolio risk, as the share retained increases, the
greater must be the loan spread to compensate the lead arranger for the greater risk exposure.
Hence, the lead arranger’s demand curve, DLeadA, is upward sloping. The intersection of the
two demand curves yields the equilibrium loan spread and share retained by the lead arranger
given by E(0).
Sufi (2007) examines the effect of information asymmetry on shares retained by the lead
arranger. Although the study does not consider loan spread, it does posit that because the adverse

7"
selection/moral hazard problem is lower the greater is the borrower’s transparency, other things
equal, greater transparency should lead to syndicate participants requiring the lead arranger to
retain a lower share of the loan. This implies that the DSynd curve for a borrower with higher
transparency is to the left of the Dsynd curve for a borrower with lower transparency. Thus,
other things equal, greater borrower transparency should lead to a lower equilibrium loan spread
and share retained by the lead arranger (Sufi, 2007; Ball et al., 2008).1
2.2 Credit default swaps
A credit default swap (CDS) is an agreement that provides that the seller of the CDS
compensate the buyer in the event of a debt default or other specified credit event relating to a
specific entity. The CDS contract typically requires the buyer of the CDS to makes a series of
payments to the seller throughout the life of the loan and, in exchange, the buyer receives a
payoff if the debt defaults. In essence, the CDS is an insurance contract, and therefore the
seller’s premium is greater the larger is the likelihood of debt default when the CDS contract is
signed. Soon after CDS contracts were initiated in the 1990s, secondary markets for CDSs
developed, providing market participants with timely information regarding a borrower’s credit-
worthiness, regardless of whether the entity’s debt is publicly traded.
CDS contracts are typically available to investors (e.g., lenders) primarily from monoline
insurers such as AIG and Ambac, who operate on the sell-side, as well financial institutions and
hedge funds, including J.P. Morgan and Goldman Sachs, who serve as market-makers as well as
CDS sellers.2 CDS transactions are conducted through an over-the-counter market and thus are
""""""""""""""""""""""""""""""""""""""""""""""""""""""""1 In our study we use loan spread as the primary loan characteristic of interest. It is possible that the lead arranger and syndicate participants consider other loan characteristics, e.g., loan covenants, when arriving at the equilibrium loan spread and share retained by the lead arranger. As described below, we consider other loan characteristics in additional tests examining the effect of CDS initiation on loan syndication. 2 Borrowers are unlikely to trade on their own CDSs. There are at least two reasons. First, firms are not likely to sell CDSs linked to their debt because investors would be unwilling to buy CDS protection from the firm itself. If the firm goes bankrupt, then CDS buyers cannot be compensated for the loss incurred given that the firm is already

8"
unobservable to parties outside of the deal. Although the parties to CDS transactions are not
publicly disclosed, in aggregate, banks are net protection buyers of CDS (Gong et al., 2013;
Song et al., 2013; Suestersic, 2013).3 Although the buyer of a CDS need not actually hold the
debt security on which the CDS is written, if the buyer does hold the debt security, then the risk
of default is transferred from the holder of the debt security to the CDS seller. This transfer of
risk plays an important role in loan syndication.
2.3 CDS and loan syndication
2.3.1 Adverse Selection and Moral Hazard Effect
If a CDS market for a firm’s debt is available, the lead arranger can anonymously
purchase CDSs to lay off credit risk associated with the portion of loan it holds. Thus, lead
arranger banks that have purchased CDSs have a reduced incentive to screen and monitor
borrowers (e.g., Morrison, 2005). As a result, holding a portion of the loan no longer provides as
credible commitment that the lead arranger will provide a fair assessment of the riskiness of the
loan and exert monitoring effort as before the CDS market was initiated.4
"""""""""""""""""""""""""""""""""""""""""""""""""""""""""""""""""""""""""""""""""""""""""""""""""""""""""""""""""""""""""""""""""""""""""""""""""""""""""""""""""""""""""""""""""""bankrupt. In other words, the counter party risk is 100% in this case. Second, the firm is unlikely to buy CDSs either because buying a CDS is tantamount to betting that the firm’s credit risk will increase. Such an action is equivalent to shorting on the firm’s stock, which is an action that is unlikely to be approved by the firm’s board. "3 Another important characteristic of the CDS market is that its dominant players are major banks and financial institutions. There is a concern that these banks and financial institutions may have access to material non-public information on CDS obligors through their lending activities and then trade on this information (e.g., Acharya and Johnson, 2007; Kim et al., 2014). To the extent that lenders possess private information on their borrowers’ creditworthiness, CDS sellers can take into account their own information disadvantage when pricing CDS contracts (Fink 2004)."4 Moreover, because CDSs allow banks and creditors to transfer risk exposure to third parties through the purchase of CDS protection, an “empty creditor” problem is created in that creditors with CDS insurance are better off when the borrowing firm defaults and may even have incentives to push the borrower into default (Hu and Black, 2008a, 2008b) or inefficient bankruptcy because the lender’s total pay-off would be higher in that event (Bolton and Oehmke 2011). A key feature of the Bolton and Oehmke (2011) model is that debt renegotiation in the interim period may occur because the borrower may not generate enough cash to make promised payments to the lender. Without CDSs, the lender and the borrower will restructure the debt and share the renegotiation surplus based on their bargaining power. However, with the availability of a CDS market, the lender will tend to use CDSs to insure against the potential default in the interim period. Purchasing a CDS gives the lender a better outside option in renegotiation since the CDS pays out when the renegotiation fails and the borrower defaults. This outside option enables the lender to extract more from the borrower in renegotiation because the lender has stronger bargaining power. Bolton and Oehmke (2011) shows that, in equilibrium, the lender tends to purchase too much CDS

9"
Thus, CDS initiation exposes syndicate participants to increased adverse selection/moral
hazard risk. Of course, loan syndicate participants are likely to take actions to protect
themselves from these increased risks arising from CDS initiation, resulting in a new equilibrium
loan spread and share retained by the lead arranger. In the context of the Ivashina (2009)
framework, for a given level of lead bank’s share in the loan, syndicate participants will demand
higher spreads because of CDS initiation, which results in a shift of the syndicate demand curve
to the right. This is shown in Figure 2, where DSynd_pre and Dsynd_post are the demand
curves before and after CDS initiation. Note that in the absence of a shift in the lead arranger’s
demand curve, DLeadA, the resulting equilibrium, E(1), is a larger loan spread and greater share
retained by the lead arranger after CDS initiation. We refer to this shift in the syndicate
participants’ demand curve as the adverse selection/moral hazard effect. In the limit, if the shift
of the adverse selection/moral hazard effect is sufficiently large, the lead arranger will have to
retain the entire loan, i.e., the loan will be issued as a sole lending loan, and the syndicate
structure fully breaks down.5
2.3.2 The Diversification Effect
Although CDS initiation affects the loan syndicate participants’ pricing schedule, it also
potentially affects the lead arranger’s pricing schedule. The development of the CDS market for
a borrower provides the lead arranger (and other holders of a borrower’s debt) with an additional
way to hedge or lay off their credit risk exposure to the borrower, while also maintaining their
lending relationship with the borrower (Saretto and Tookes, 2013). Even if lenders do not """""""""""""""""""""""""""""""""""""""""""""""""""""""""""""""""""""""""""""""""""""""""""""""""""""""""""""""""""""""""""""""""""""""""""""""""""""""""""""""""""""""""""""""""""protection relative to the social optimum—even when CDSs are fairly priced—because the lender does not internalize the loss surplus that arises from failed renegotiation."5 Borrowers may change their behavior to address the moral hazard problem created by CDS initiation. For example, they can alter their disclosure/transparency policies. There is evidence that firms do change their disclosure and reporting behavior after CDS initiation (e.g., Gong et al., 2013; Kim et al., 2014). The fact that they did not change their reporting behavior until after CDS initiation suggests that it was not optimal for them to do so before. Therefore, the outcome in the lending market we observe is the equilibrium outcome of a tradeoff between increased disclosure costs and increased private lending costs. "

10"
purchase CDSs immediately, the existence of CDS markets provides a liquid resale option and
makes holding credit risk more attractive. Because CDS initiation provides an additional way
for the lead arranger to reduce the risk exposure from holding a share in a loan, in the context of
the Ivashina (2009) framework, for each level of shares retained by the lead arranger, the lead
arranger is willing to charge a lower level of loan spread. As shown in Figure 3, this implies a
shift of the lead arranger’s demand curve to the right (as indicated by the red demand curve),
where DLeadA_pre and DLeadA_post_1 are the lead arranger’s demand curves before and after
CDS initiation. Note that in the absence of a shift in the syndicate participants’ demand curve,
Dsynd, after CDS initiation the resulting equilibrium, E(1), is a greater share retained by the lead
arranger but a lower loan spread faced by the borrower. We refer to this shift in the lead
arranger’s demand curve as the diversification effect. In the limit, if the diversification effect is
sufficiently large, the new equilibrium can result in the lead arranger retaining 100 percent of the
loan, i.e., the loan is issued as a sole lending loan.6
2.3.3 The Credit Risk Effect
However, CDS initiation can have an additional potential effect on the lead arranger’s
pricing schedule beyond the diversification effect discussed above. In particular, CDS holders
who are not creditors may also have incentives to cause the borrower to default on its loans
(Soros, 2009; Stulz, 2010; Portes 2010;"Markose et al., 2012; Che and Sethi, 2013), which
increases the credit risk of loans in the lead arranger’s portfolio.7 Consistent with this
""""""""""""""""""""""""""""""""""""""""""""""""""""""""6 Another benefit of the lead arranger holding CDSs is that doing so can provide lenders the opportunity to reduce regulatory capital requirements (Gong et. al., 2013). If the lead arranger passes on this hedging benefit to the firm, then the firm may be able to take out loans at lower interest rates for each level of shares retained by the lead arranger (Cebenoyan and Strahan, 2004; Hirtle 2009). This implies that the diversification curve will shift to the right, which is consistent with the argument above. 7 To see this, consider the hypothetical example of insurers issuing homeowner policies that provide a payoff to the policyholder in the event of a house fire for a home not owned by the policyholder. Although CDS holders cannot necessarily directly cause a borrower to default on a loan (or, by analogy “burn down” a home), actions they take collectively in the credit markets—including “bear raiding” or spreading negative information about a borrower—

11"
possibility, Subrahmanyam et al. (2014) finds credit risk for borrowers increases following CDS
initiation. The increase in default risk on the lead arranger portfolio will shift the lead arranger’s
curve to the left, as it will want to diversify more for a given level of interest spread.8 Thus,
despite the potential benefits of diversification brought about by CDS initiation, it is possible that
the credit risk effect could result in the lead arranger’s curve actually shifting on net to the left,
which is illustrated as DLeadA_post_2 in Figure 3 (as indicated by the green demand curve).
Note that in contrast to the equilibrium associated with the diversification effect, E(1), the
equilibrium associated with the credit risk effect, E(2), is a smaller share retained by the lead
arranger but a greater loan spread faced by the borrower. That is E(1) and E(2) have opposite
effects on share retained by the lead arranger and loan spread when compared to E(0).
2.3.3 The New Equilibrium in the Syndicated Loan Market
Whether the resulting equilibrium following CDS initiation results in an increase or
decrease in the share of a loan retained by the lead arranger and an increase or decrease in the
loan spread depends on the net effect of the diversification and credit risk effects on the lead
arranger’s demand curve and on the relative magnitude of the adverse selection/moral hazard.
Figure 4 illustrates examples in which the adverse selection/moral hazard effect is sufficiently
large that it leads to an increase in share retained by the lead arranger and loan spread regardless
of whether the shift in the lead arranger’s demand curve is dominated by the diversification
effect (a shift to the right) or the credit risk effect (a shift to the left). That is, in Figure 4, for
both of the new equilibria, E(1) and E(2), share of a loan retained by the lead arranger and loan
spread are higher than are the amounts for E(0). In this case, although observing an increase in
"""""""""""""""""""""""""""""""""""""""""""""""""""""""""""""""""""""""""""""""""""""""""""""""""""""""""""""""""""""""""""""""""""""""""""""""""""""""""""""""""""""""""""""""""""can make it difficult for a borrower to secure future borrowing. Consistent with line of reasoning, Subrahmanyam et al. (2014) finds credit risk for borrowers increases following CDS initiation."8"Based"on"Ivashina (2009), which provides evidence that changes in default risk affect the lead arranger’s demand schedule and not the syndicate participants' demand schedule, we expect changes in default risk should have no effect on the DSynd curve."

12"
both share of a loan retained by the lead arranger and loan spread is possible if the lead
arranger’s curve shifts to the right or left, such an observation is not possible absent an adverse
selection/moral hazard effect causing a shift to the right in the syndicate participants’ demand
curve.
Figure 5 illustrates examples in which the impact of CDS initiation on share of loan
retained by the lead arranger and loan spread is not determined solely by the magnitude of the
adverse selection/moral hazard effect. In the case of the first equilibrium, E(1), the
diversification effect causes DLeadA to shift to the right that results in an increase in the share
retained by the lead arranger but a decrease in the borrower’s loan spread. Conversely, in the
case of the second equilibrium, E(2), the credit risk effect dominates the diversification effect,
causing DLeadA to shift to the right such that there is a decrease in the share retained by the lead
arranger but an increase in the borrower’s loan spread.
Taken together, Figures 4 and 5 illustrate that CDS initiation can lead to a variety of new
equilibrium combinations of changes in loan share retained by the lead arranger and loan
spread.9 However, two other observations based on the figures are noteworthy. First, as Figure
4 makes clear, observing an increase in both loan share retained and loan spread is not possible
without CDS initiation creating an economically significant adverse selection/moral hazard
effect. Second, observing an increase in loan spread is not sufficient for determining the impact
of CDS initiation on the share retained by the lead arranger. Alternatively stated, it is necessary
to observe share retained by the lead arranger changes in response to CDS initiation to have a
""""""""""""""""""""""""""""""""""""""""""""""""""""""""9 Equilibrium combinations not explicitly illustrated in Figures 4 and 5 also possible include shifts in the two demand curves such that there is no change in either loan share retained or loan spread. It is also possible that CDS initiation has no impact on either demand curse, in which case there will be no change in both loan share retained and loan spread.

13"
more complete understanding of how the various effects we identify interact to yield equilibrium
changes in the loan syndication market.
Although we cannot predict equilibrium changes in lead arranger loan share and borrower
loan spread for new loans issued following CDS initiation, we can make the following
conditional statements. First, empirically observing an increase in both loan share and loan
spread, then CDS initiation creates an adverse selection/moral hazard effect. Second, observing
an increase in loan share retained and a decrease in loan spread indicates that CDS initiation
creates a net diversification benefit, i.e., the diversification effect dominates the credit risk effect.
Third, observing an increase in loan spread but a decrease in loan share retained indicates that
CDS initiation creates a net credit risk cost, i.e., the credit risk effect dominates the
diversification effect. In our analysis we focus on subsequent loans because the pre-CDS
initiation borrowing decision provides us with a benchmark for expected syndicate structure.10
2.3.2 Effect of borrower transparency
In a related study, Ashcraft and Santos (2009) examines the impact of CDS initiation on
borrower loan spreads.11 The study finds that CDS initiation has no significant effect on loan
spread for the average sample firm.12 However, for the subsample of firms characterized as
being less transparent/more opaque, where transparency is measured based on a firm’s stock bid-
ask spread, analyst coverage, and analysts’ earnings forecast dispersion, Ashcraft and Santos
""""""""""""""""""""""""""""""""""""""""""""""""""""""""10 Another potential mechanism through which CDS trading may cause the loan syndication market to break down is reduced demand for loans. In particular, it is possible that parties other than the lead arranger could sell CDSs rather than participate in the syndicated loan to gain exposure to the borrower’s credit risk. In other words, CDSs and syndicated loans may be substitutes for potential lenders. However, this is unlikely to be the case because lenders have significant protections under the loan agreement and a CDS, by construction does not pay the level of interest payments that the loan pays. Therefore, it is unlikely that a CDS is a substitute for actual lending. Moreover, we are unaware of any theory or empirical evidence to support this potential source of reduced demand for loan syndication. "11"There is an extant literature examining the effects of CDS initiation on loan pricing and credit terms (e.g., Hirle, 2009; Ashcraft and Santos, 2009; Norden, Buston, and Wagner, 2011), although only Ashcraft and Santos (2009) directly examines directly how loan spreads of specific borrowers change with CDS initiation. "12 See footnote 16 below for additional discussion of the findings in Ashcraft and Santos (2009) and how they relate to the findings we report for loan spread.

14"
(2009) finds that CDS initiation leads to slightly higher loan spreads. This finding is consistent
with CDS initiation being more costly for less transparent borrowers and raises the question of
whether lower transparency also results in greater changes in the syndicate structure in the form
of a higher propensity of the lead arranger to hold a greater share of the syndicated loans.
To develop predictions of the role played by borrower transparency in affecting the link
between CDS initiation and syndicated loans, we turn again to the analysis of syndicated loans in
Ivashina (2009). Other things equal, if a borrower’s risks and activities are more transparent,
then the adverse selection problem is less severe and monitoring by lead arrangers is less
important to syndicate participants (Sufi, 2007; Ball et. al., 2008). As a result, the adverse
selection/moral hazard problem created by CDS trading is likely to be less severe for more
transparent firms. Thus, the initiation of CDS trading is less likely to have an adverse impact on
the loan syndication market and the syndicate structure for highly transparent firms. In the
context of the syndicate analysis in Figure 3, other things equal, for a transparent firm CDS
initiation is more likely to create a less severe empty creditor problem, leading to a smaller shift
to the right of the syndicate participants’ demand curve, DSynd, than for a less
transparency/more opaque borrower. Alternatively stated, we expect the adverse selection/moral
hazard effect following CDS initiation to be larger for more opaque borrowers. Conversely, we
do not expect a borrower’s transparency to play any role in affecting a lead arranger’s demand
schedule. Assuming the extent to which a lead arranger’s demand curve, DLeadA, shifts to the
left or right is independent of a borrower’s transparency, the greater adverse selection/moral
hazard effect for more opaque firms leads to us to predict that CDS initiation causes a higher
increase in share retained by lead arranger, a higher propensity for sole lending, and a higher
increase in loan spread for more opaque firms.

15"
3. Research Design
3.1 Syndicated loan market and CDS initiation
To test our first prediction that CDS initiation should lead to an increase in the share
retained by the lead arranger, we estimate the following linear regression model given by
equation (1):
LEAD_OWNit=α +β
1Post
it+β
2Traded
it+β
3Post
it×Traded
it+ controls+ε
it (1)
LEAD_OWN is percentage of a loan retained by lead arranger, is an indicator variable
that equals one if there is a CDS market for the firm’s debt at any time during the sample period,
and zero otherwise. is intended to capture time-invariant unobservable differences
between CDS and non-CDS firms. Post is an indicator that equals one if the loan is issued after
the CDS initiation date. This definition of Post is straightforward for CDS traded firms because
the actual CDS initiation date can be identified. However, it is necessary to create a pseudo Post
date for firms for which there is no CDS trading, henceforth non-CDS firms. We do this by
creating hypothetical “CDS initiation date” by randomly drawing a date after 2001 (when CDS
trading begins for our sample) for each non-CDS firm and assigning it as the CDS initiation date.
To test our related prediction that CDS initiation leads to a lower incidence of loan
syndication, or alternatively stated, that there is an increase in the probability that subsequent
debt issuances are arranged through sole lending, we estimate the following Probit regression
given by equation (2):
Pr(Non_ syndicationit= 1) = f (α + β
1Post
it+ β
2Traded
it+
β3Post
it×Traded
it+ controls+ ε
it) (2)
Tradedit
Traded

16"
equals one if there is only one lender on the loan, i.e., the loan is not
syndicated, and zero otherwise.
Equations (1) and (2) essentially employ a difference-in-difference research design,
whereby the coefficient of on , , reflects the incremental effect of CDS
initiation on the probability of non-syndication. Because the magnitude of interaction terms in
nonlinear models does not equal their marginal effect, we estimate the marginal effect of
to assess the impact of CDS trading using the Delta method to calculate the
standard error for the average marginal effect evaluated at each data point (Ai and Norton, 2003).
A positive marginal effect is evidence consistent with fewer incidences of loan sales after CDS
initiation.13
Equations (1) and (2) include a set of control variables for a variety of firm- and loan-
specific characteristics suggested by prior research to significantly affect loan terms and thus
likely are also to affect loan syndication. The firm characteristics include return on asset (ROA),
profit margin (Profit), the debt-to asset-ratio (Leverage), firm size (Log_asset), loss give default
(LGD), probability of default (Bsmprob), and credit rating (Rating). Loan characteristics include
the number of lenders (Lender_num), performance pricing provisions (PP), revolver lines
(Ltype), term loan B or below (Inst), and presence of guarantors (Guarantor). We also include in
the regressions a control for the market risk premium, the monthly market value-weighted excess
return. The appendix provides details of all variable definitions. We estimate the equations
""""""""""""""""""""""""""""""""""""""""""""""""""""""""13 We also estimate a linear probability model to assess the difference-in-difference effect of CDS initiation on loan syndication. Untabulated findings yield inferences identical to those based on tabulated findings. "
Non_ syndication
Traded × Post β3
Traded × Post

17"
including year and industry (based on 2-digit SIC code) fixed effects and also allow for
clustering of standard errors at the firm level.14
3.2 The effect of CDS trading on loan pricing
To examine the effect of CDS initiation on loan pricing, we employ a difference-in-
difference research design by estimating the following set of regression models:
(3)
The dependent variable, , is loan spread based on the all-in-drawn spreads
over LIBOR at issue date for loans issued to firm i in year t. Because loan spreads are highly
skewed, following prior studies (e.g., Graham and Qiu, 2008; Chava et al., 2009), we measure
as the natural logarithm of the actual loan spread. Based on our predictions in
section 2, we predict the Traded ×Post coefficient, , to be positive if the adverse
selection/moral hazard effect dominates following CDS initiation and to be negative if the
diversification effect dominates. Equation (3) includes the same set of control variables as those
in equations (1) and (2) and time and industry fixed effects. In addition, we also include in
equation (3) a set of loan non-price terms that could be affected by CDS initiation. These other
terms include, Log_loansize, the natural logarithm of the loan amount; Maturity, the number of
months of the loan issuance; NCOV, the number of financial covenants; and Securdum, an
indicator variable that equals one if a loan is secured and zero otherwise.15
""""""""""""""""""""""""""""""""""""""""""""""""""""""""14 Inferences are unaffected when the equations are estimated use quarter fixed effects and using the Fama-French (1997) 48 industry groupings."15 We also estimate versions of equations (3) in which we replace LoanSpread with each of the three non-price loan terms to examine whether there is any trade-off between price and non-price terms. For example, after CDS initiation borrowers may be charged a higher loan spread—CDS initiation is costly, but may be able to get expanded access to bank lending capital—CDS initiation is beneficial. If this is the case, then the effect of CDS initiation on loan contract terms is ambiguous. However, following prior research, we can interpret the effect of CDS initiation on loan pricing more definitively if the inferences are consistent across the LoanSpread and four non-price loan estimations. Untabulated findings indicate there is no evidence of any such trade-off between spreads and these non-price terms after CDS initiation.
LoanSpreadit =α + β1Tradedit + β2Postit + β3Tradedit × Postit +Controls + ε it
LoanSpread
LoanSpread
β3

18"
3.3 The effect of financial reporting transparency
To test our prediction that greater borrower transparency leads to a smaller increase in
shares retained by the lead arranger, a smaller increase in the probability that subsequent debt
issuances are arranged through sole lending, and a smaller increase in loan spreads, we estimate
equations (4a), (4b), and (4c):
LEAD_OWNit=α +β
1Traded
it+β
2Pos
itt +β
3Traded
it× Post +β
4DCV
it+
β5Traded ×DCV
it+β
6Post ×DCV
it+
β7Traded × Post ×DCV
it+ controls+ε
(4a)
(4b)
Equations (4a) and (4b) modify equations (1) and (2) by including a measure of financial
reporting transparency, , and its interactions with and . is the debt-
contracting value of borrowers’ accounting information developed in Ball, Bushman, and
Vasvari (2008) and extended by Dou (2012). is the Somers’ D-statistic derived from the
explanatory power of accounting variables (i.e., earnings, leverage, equity book value and
interest coverage) in a model of firm credit ratings and ranges from zero—low transparency—to
one—high transparency, and reflects the inherent ability of firms’ accounting amounts to capture
credit quality. If, as we predict, financial reporting transparency mitigates the adverse effect of
CDS trading on loan syndication, then there will be a negative marginal effect of the three-way
interaction term, , i.e., β7 < 0.
To test whether CDS initiation has different pricing effects on loan pricing as a function
of borrower transparency, we estimate the following loan spread equation:
Pr(Nonsyndicationit = 1) = F(α + β1Tradedit + β2Postit + β3DCVit+β4Tradedit × Postit + β5Tradedit × DCVit + β6Postit × DCVit+β7Tradedit × Postit × DCVit +Controls + ε it )
DCV Traded Post DCV
DCV
Traded × Post × DCV

19"
(4c)
Equation (4c) is an expanded version of equation (3) that includes and its interactions with
and . The key variable of interest is the three-way interaction,
, which reflects the incremental effect on loan spread associated with
financial reporting transparency. Finding the coefficient, , is negative
is evidence that higher transparency mitigates the effect of CDS initiation on loan spreads.
We use DCV, a measure of financial statement transparency, rather than equity bid-ask
spread or analysts’ coverage (Ashcraft and Santos, 2009) as our measure of transparency,
because it likely more directly relates to the information lenders receive when they initiate loans.
In addition, prior studies provide consistent evidence that accounting information plays an
important role in shaping the design of the debt contracts (e.g., Ball et al., 2008; Graham et al.,
2008; Armstrong et al., 2010; Amiram, 2013).16
3.4 Procedures to Address Endogeneity of Traded
A key assumption that the difference-in-difference regression approach represented by
equations (1) through (3) is that the timing of CDS introduction is exogenous, i.e.,
is randomly assigned. However, it is possible that the emergence of CDS
markets is simultaneously determined with the firm’s credit risk and loan terms. For example,
CDS trading could manifest in response to a change (deterioration) in the firm’s credit quality,
and this changed (deteriorated) credit quality determines loan terms. If this is the case, then CDS
initiation and change in credit quality are simultaneously determined, potentially introducing
""""""""""""""""""""""""""""""""""""""""""""""""""""""""16 In additional tests described below we estimate versions of equations (4a), (4b), and (4c) using bid-ask spread and analyst coverage. See section 5.3.
LoanSpreadit =α + β1Tradedit + β2Postit + β3DCVit +β4Tradedit × Postit + β5Tradedit × DCVit + β6Postit × DCVit +β7Tradedit × Postit × DCVit +Controls+ ε it
DCV
Traded Post
Traded × Post × DCV
Traded × Post × DCV β7
Post ×Traded

20"
endogeneity bias when estimating equations (1) through (3). To mitigate the effects of
endogeneity, when estimating equations (1) through (3) we also include controls for firm credit
risk used in prior literature: firm credit ratings, Rating; a market-based probability of firm
default, Bsmprob, that is measured on monthly basis; and estimates of loss given default, LGD,
default measured on quarterly basis. In addition, following prior research, we also include
and each of the four non-price loan terms, as appropriate. For example, when
estimating equations (3), we include LoanSpread and the other non-price loan terms.
We also use two additional approaches to address potential endogeneity bias when
assessing the effect of CDS initiation on loan pricing, propensity score matching and the
Heckman two-stage approach. Because each of these approaches, including the expanded
version of the primary regression approach that includes credit risk controls, rely on different
assumptions, finding a consistent result across the different approaches provides support for
inferences that we draw. We implement propensity score matching following Ashcraft and
Santo (2009) and Subrahmanyam et al. (2014). In particular, we match each CDS traded firm-
quarter beginning in 2001 until the first quarter when CDS trading is introduced with a non-CDS
traded firm-quarter. We do this by first estimating a Probit model with as the
dependent variable and the firm-specific variables as independent variables, and then using the
estimated model parameters to calculate propensity scores for each firm. We match each CDS
firm to the non-CDS trading firm whose propensity score is closest, doing so without
replacement.
The Heckman two-stage correction model treats the selection bias as an omitted variable
bias. In the first step, we estimate a selection model similar to that used in Ashcraft and Santos
(2009) and Subrahmanyam et al. (2014):
LoanSpread
Traded × Post

21"
, (5)
where Z is a set of explanatory variables that are assumed to determine the likelihood of CDS
trading. These include stock return volatility, firm size, leverage, profitability, credit ratings,
whether the firm has rated debt as of last loan before CDS initiation, proportion of tangible
assets, loss given default, probability of default, ROA and stock market excess return. In the
second step, we estimate equations (1), (2), and (3) but including the Inverse Mills ratio obtained
from the first step as an additional explanatory variable.
4. Data and Sample
We start by merging the quarterly CRSP-COMPUSTAT database with Dealscan to
identify a sample of US firms who have private loan information and accounting and price
information. We conduct our loan contract analyses at the facility level (individual level) to take
advantage of the heterogeneity within every loan package. This results in 26,871 facilities over
the period 1993-2011. We use the following steps to identify CDS initiations for the firms in our
sample. First, we identify all the firms in our merged sample that ever had a CDS traded on their
debt according to Markit. Next, for every firm we identify the first date in which a five-year-to
maturity, U.S.-dollar-denominated CDS contract is traded. We use this date as the date of the
onset of CDS trading. We eliminate all firms that have a CDS initiation date in January 2001
because the Markit database begins its coverage then and thus the CDS initiation date for these
firms is ambiguous. The resulting sample includes 734 CDS traded firms with 6,889 loans over
the period 1993-2011.17 This is the sample we use for estimation of equations (2) and (3).
""""""""""""""""""""""""""""""""""""""""""""""""""""""""17 To the extent that there are firms that drop out of the loan market following CDS initiation, our tests relating to the probability of non-syndication and loan spreads are biased in favor of the null. This is because their non-inclusion post-CDS initiation is evidence of non-syndication, and such firms likely faced higher loan spreads that caused them to drop out."
Pr(Traded × Postit = 1) = F(Zit−1 + ε it )

22"
To develop the sample for estimation of equation (1) we exclude observations for which
shares retained by the lead arranger are unavailable and for which loans are originated by sole
lenders. The resulting sample for the lead arranger’s ownership analysis contains 544 CDS
traded firms and 2,269 loans.
We obtain our control sample using all US private loans issued by non-CDS-traded firms
with available data in Dealscan. This results in a full sample of 20,780 loans from 4,403 unique
firms for the non-syndication and loan spread analyses, equations (2) and (3), and 6,099
syndicated loans from 2097 firms for the lead arranger’s ownership analysis, equation (1).
Table 1 presents mean and standard deviation statistics for the full sample, as well as
separate statistics for loans before and after CDSs trading for CDS traded firms. The average
natural logarithm of loan spread is 4.952 with standard deviation of 0.849. The average loan
amount is 0.308 billion with standard deviation of 0.484. Debt maturity has a mean of 45.123
months. The average number of financial covenants is 1.694, and 51.2% of the loans are secured.
21.6% of the loans are made by a single lender. Revolvers comprise 70.7% of the sample.
Comparing loans before and after CDS trading for CDS traded firms provides some
interesting observations, although we do not conduct any tests of differences in means. Firms’
credit ratings appear to improve slightly after CDS, but the probability of default and loss given
default both increase. Firms after CDS trading on average pay higher loan spreads. Average loan
size and average loan maturity increase. The number of financial covenants for a loan and the
likelihood of collateral also decrease. The incidence of single-lender loans seem to decrease.
5. Results
5.1 Syndicated loan market and CDS initiation

23"
Table 2 reports the regression summary statistics associated with estimation of equation
(1). The findings in the first (second) column are based on estimation that includes year and
industry (year and firm) fixed effects. The key finding in table 2 is that the Traded × Post
coefficients, 0.0484 and 0.0438, are significantly positive (t-statistics = 4.83 and 3.54). The
magnitudes of the coefficients are also economically significant. In particular, the
Traded × Post coefficients imply that the onset of CDS trading leads to an incremental increase
in" the percentage of the loan retained by the lead arranger in excess of 4%, which is nearly a
quarter of the sample mean for share of loan retained by CDS traded firms, 17%, before CDS
initiation. Finding that the coefficients are significantly positive and of the same
order of magnitude in both estimations suggests that the findings are less likely to be attributable
to some unobservable time-invariant omitted variable.
Table 3, panel A, reports Probit regression summary statistics associated with estimation
of equation (2). The first (second) pair of columns relates to the estimation that excludes
(includes) year and industry fixed effects. The key finding is that the coefficient on
is significantly positive in both estimations (coefficients = 0.194 and 0.205; t-
statistics = 1.97 and 2.07). In addition, the marginal effects, 0.036 and 0.038, are also significant
at less than the 5% level based on standard errors calculated using the Delta method. These
findings indicate that the probability of loan sales in the syndication market decreases by 3.6-
3.8% after the introduction of CDSs.
Table 3, Panel B presents the predicted probabilities of loan syndication from the fixed
effects model for four pairs of Traded and Post, (Traded = 0, Post = 0), (Traded = 0, Post = 1),
(Traded = 1, Post = 0), and (Traded = 1, Post = 1). The findings indicate that there is an increase
in the probability of non-syndication for CDS traded firms between the pre- and post-CDS
Traded × Post
Traded × Post

24"
initiation periods, 0.0255 (= 0.2419 – 0.2164), and a decrease in the probability in non-
syndication for non-CDS firms, 0.0126 (= 0.2188 – 0.2062), the difference of which is, of
course, 0.0381. These findings indicate that the relative increase in the probability of non-
syndication for CDS traded firms following CDS initiation is approximately 18%, i.e.,
0.0381/0.2164. This increase suggests that the effect of CDS initiation is not only statistically
significant, but that CDS initiation has an economically large effect on the loan syndication
market as well.
Taken together, the findings in tables 2 and 3 are consistent with CDS initiation increases
the loan share retained by the lead arranger and in the probability of sole lending. As explained
in the prior section, these increases after CDS imitation could reflect the positive effect of a more
efficient alternative diversification mechanism for the lead arranger or because the negative
effect of reducing the effectiveness of ownership in mitigating the adverse selection/moral
hazard problems. To identify which effect most likely accounts for such increases, we now turn
to observing the effect of CDS initiation on loan spreads.
5.2 The effect of CDS trading on loan pricing
Table 4 reports the regression summary statistics associated with estimation of equation
(3). The findings in the first (second) column are based on estimation that includes year and
industry (year and firm) fixed effects. The key finding table 4 is that the
coefficients, 0.136 and 0.170, are significantly positive (t-statistics = 5.48 and 5.80). The
magnitudes of the coefficients are also economically significant: the coefficients
imply that the onset of CDS trading leads to an increase of approximately 14-17% of loan
spreads. This implies that for a firm that faced a loan spread of 190bp before CDS initiation, the
average loan spread for firms in our sample, its loan spread increased to approximately 218.5bp
Traded × Post
Traded × Post

25"
after CDS initiation. Finding an increase in loan spread following CDS initiation, together with
the findings in tables 2 and 3 showing an increase in loan share retained by the lead arranger and
an increase in the likelihood of sole lending, indicates that there is a significant increase in
adverse-selection/moral hazard effect.18
The Traded coefficient in column (1), −0.099, is significantly negative, and suggests that
CDS traded firms, on average, are able to take out loans at a lower cost than non-CDS traded
firms before CDS initiation. The majority of the control variables’ coefficients are significant,
with signs that are largely consistent with prior research. For example, firms with high return on
assets, ROA, on average pay a lower cost of debt.19 In addition, the coefficients on our three
measures of credit risk, Rating, Bsmprob and LGD, are significantly positive, which is consistent
with riskier firms paying higher loan spreads; larger firms (Log_asset) and firms with more
tangible assets (Tangible) enjoy lower load spreads, and more highly leveraged firms (Leverage)
pay higher spreads; the significantly negative coefficient on Ltype and significantly positive
coefficient on Inst indicate that revolving credit line loans and term loans B or below face lower
and higher rates (Harjoto et al., 2004; Zhang, 2008; Nandy and Shao, 2010; Lim et al., 2013).
Regarding the four non-price loan terms, the Maturity coefficient is insignificant in
column (1) and (2). The findings also indicate there is a positive relation between the loan
spread and both collateral (Securedum) and number of covenants (NCOV) (Berger and Udell,
""""""""""""""""""""""""""""""""""""""""""""""""""""""""18"Although"Ashcraft and Santos (2009) does not examine the effect of CDS initiation on share retained by the lead arranger or the probability of sole lending, viewed in isolation the study’s finding of no effect of CDS on loan spreads for the average sample firm suggests that the adverse selection/moral hazard and diversification effects are, on average, offsetting. There are several sample and research design differences between Ashcraft and Santos (2009) and our study that likely account for different loan spread results. For example, relative to the sample used in our study, Ashcraft and Santos (2009) is limited to a smaller sample (approximately 1/10 our sample size) comprised of mostly larger borrowers that, other things equal, are relatively transparent."19"In contrast, the Profit coefficient is positive, indicating that firms with higher profitability appear to pay higher loan spreads. Note, however, that this result is incremental to the negative effect of ROA. Untabulated findings from estimations of equation (3) that omit ROA indicate that the Profit coefficient is significantly negative."

26"
1990; Bradley and Roberts, 2004), perhaps reflecting the endogenous determination of loan
contractual terms.20
5.3 The effect of reporting transparency
Tables 5, panels A, B, and C, reports the summary statistics associated with estimation of
equations (4a), (4b), and (4c). The key finding in table 5 is that the coefficients on the three-way
interaction,Traded × Post ×DCV , are significantly negative in all three estimations, which is
consistent with our prediction that transparency should have a moderating influence on the
adverse effect of CDS initiation on the loan syndication market.
Regarding share retained by the lead arranger, panel A reveals that the
Traded × Post ×DCV coefficient, −0.0622, is significantly negative (t-statistic = −2.03). This
finding implies that the onset of CDS trading leads to an increase in" the percentage of the loan
retained by the lead arranger that is 6.2% smaller for firms in the highest DCV decile relative to
those in the lowest decile.
Regarding the probability of non-syndication, panel B.1 reveals theTraded × Post ×DCV
coefficient and associated marginal effect, −0.8571 and −0.1617, are significantly negative (t-
statistic = −2.56 and p-value = 0.061). Consistent with these findings, panel B.2 indicates that
the marginal effect of Traded×Post evaluated at each DCV decile is significantly positive only
for the lowest four DCV deciles. These findings imply that the onset of CDS trading leads to an
increase in" the probability of sole lending is concentrated among those firms that are the least
transparent.
""""""""""""""""""""""""""""""""""""""""""""""""""""""""20"Untabulated findings from estimations of equation (3) that exclude the four non-price loan terms yield the same inference regarding the association between and loan spread, i.e., the coefficient is significantly positive. These additional findings are additional evidence in support of endogeneity not being the cause of the positive relation. Nonetheless, below we also address the endogeneity issue by estimating versions of equation (3), replacing loan spread with each of the four non-price terms to assess whether borrowers are compensated for the higher loan spread by getting more favorable non-price terms."
Traded × Post Traded × Post

27"
Finally, regarding loan spread, panel C reveals that the Traded × Post ×DCV coefficient,
−0.1544, is significantly negative (t-statistic = −2.14). This finding implies that the onset of
CDS trading leads to an increase in" loan spread that is 15.54% smaller for firms in the highest
DCV decile relative to those in the lowest decile.
We also estimated versions of equations (4a), (4b), and (4c) that use stock price bid-ask
spread, BA_spread, a measure of transparency used in Ashcraft and Santos (2009), in place of
DCV. Untabulated findings indicate that these two measures of transparency are less effective
than DCV in distinguishing whether transparency has a moderating influence on the adverse
effect of CDS initiation on the loan syndication market. In particular, BA_spread yields a
significantly negative coefficient for the three-way interaction variable only for the loan spread
estimation, equation (4c), which is consistent with the loan spread findings in Ashcraft and
Santos (2009), and the coefficient for the three-way interaction variable is insignificant using
analyst coverage. Finding that only DCV yields consistent evidence that transparency has a
moderating influence on the adverse effect of CDS initiation on the loan syndication market
supports the findings in prior research that lenders incorporate accounting information when
setting loan pricing terms.
5.4 Additional tests
5.4.1 The role of lead bank reputation
In this section, we investigate the role of lead arranger reputation in mediating the impact
of CDS initiation on loan syndication and loan pricing. Findings reported in tables 2 through 4
indicate that the adverse selection/moral hazard effect on average dominates the diversification
effect. One factor that possibly mitigates the adverse selection/moral hazard effect at the level of
the lead arranger is the reputational costs of the lead arranger. The syndicated loan market is one

28"
of repeated interactions, and most reputable lead arrangers may be able to overcome moral
hazard concerns. Indeed, Sufi (2007), among other studies, finds that lead arranger reputation
can serve as an effective mechanism in reducing moral hazard, even though it does not eliminate
it. Thus, because we expect lead arranger banks with higher reputation will be less likely to
reduce their monitoring effort and to push borrowers into bankruptcy, we predict that the
negative effect of CDS initiation on loan syndication and loan pricing is more pronounced for
lead arrangers with a less established reputation in the syndicated loan marketplace.
To test this prediction, we estimate versions of equations (1), (2), and (3) that include an
interaction of Traded and Post with a proxy for lead arranger reputation. Following Sufi (2007),
we measure lead arranger reputation, MKT_PCT, as the percentage market share of syndicated
loan amount initiated by the lead arranger in the prior calendar year.21 Table 7, panels A, B, and
C, reports the regression summary statistics relating to the three estimations.
For the lead bank share retention model, panel A reveals the
Traded × Post ×MKT _ PCT coefficient is insignificantly different from zero (t-statistic =
−0.36), which suggests that lead arranger reputation has no signification impact on share of loan
retention following CDS initiation. However, panel B.1 reveals that theTraded × Post ×DCV
coefficient and associated marginal effect, −0.0426 and −0.0071, are significantly negative (t-
statistic = −2.55 and p-value = 0.0024). As a way to interpret the economic magnitude of the
marginal effects, panel B.2, presents the marginal effects of for MKT_PCT values
ranging from 0.2 to 30, i.e., from low to high reputation. Two points regarding the findings are
noteworthy. First, the marginal effect of MKT_PCT is significant only for relatively low levels of
""""""""""""""""""""""""""""""""""""""""""""""""""""""""21 We also define lead arranger reputation as in indicator variable that equals one if the lead arranger is classified as a top 10 lead arranger in the U.S syndicated loan market in the year prior to when the deal is signed and zero otherwise. Inferences remain the same using this alternative measure of lead bank reputation. "
Traded × Post

29"
reputation, i.e., when MKT_PCT is 1.6 or lower. Second, the marginal effect of
is decreasing monotonically with higher levels of reputation. Taken together, the findings in
panels A and B indicate that lead arranger reputation moderates the adverse selection/moral
hazard effect of CDS initiation on the syndicated loan market structure in terms of reducing the
probability of sole lending for increasingly higher levels of lead arranger reputation.
Finally, regarding the loan spread estimation, Table 7, panel C indicates that the
coefficient on the three-way interaction variable, Traded×Post×MKT_PCT, is significantly
negative (coefficient = −0.0071; t-statistic = −2.06). This result indicates that higher lead bank
reputation mitigates the effect of CDS initiation on loans spreads, and is further evidence that
lead bank reputation reduces the adverse selection/moral hazard effect associated with CDS
initiation.
5.4.2 Propensity Score Matching and Heckman Two-Stage Estimation
Untabulated findings indicate that the effect of CDS initiation on the lead arranger’s
share of loan retention and the probability of non-syndication is robust to controlling for
endogeneity by using the propensity score matching and the two-stage Heckman correction for
the selection of firms with CDS traded. In particular, the coefficient is
significantly positive for both the lead arranger retention and probability of non-syndication
estimations, and inferences regarding the marginal effects of the coefficient are
the same as those based on findings reported in table 3. Taken together, these findings provide
additional support that the inferences we draw from the tables 2 and 3 findings—that CDS
initiation has adverse effects on the syndicated loan market—are not the result of the selection
bias associated with the onset of CDS trading for a firm.
Traded × Post
Traded × Post
Traded × Post

30"
Untabulated findings also indicate that the effect of CDS initiation on loan pricing is
robust to the propensity score matching and the two-stage Heckman-correction. In particular, the
coefficients on based on the propensity score matched sample and in the
Heckman second-stage regression are positive and significant. Taken together, these findings
also provide additional support that the inferences we draw from the table 4 findings—that CDS
initiation contributes to an increase in the cost of borrowing—are not caused by unobserved
omitted variables that drive both the selection of firms for CDS trading and loan pricing.
6. Summary and Concluding Remarks
CDS market initiation can create externalities in the syndicated loan market that can
increase or decrease lead arranger’s ownership of a syndicated loan. We find that, on average,
lead arrangers’ ownership in syndicated loans increased after CDS initiation. We find evidence
that this increase occurs because any potential diversification benefit lead arrangers enjoy
following CDS initiation is more than offset by CDS markets limiting the ability of lead
arrangers’ ownership to mitigate the adverse selection/moral hazard problems in loan
syndication. We conduct our analyses using a sample of 20,780 loan contracts from Dealscan
over the period 1993-2011, and test our predictions using a difference-in-difference research
design.
We corroborate the interpretation of these results by predicting and providing evidence
that the negative externality we document is moderated for firms with greater transparency and
for loans originated by a lead arranger with a strong reputation in this market.. Findings from
additional tests indicate that the adverse effects on the syndicated loan market also are less
pronounced for loans originated by lead arrangers with a strong reputation in the syndicated loan
Traded × Post

31"
market. In addition, inferences from our tests of the effects of CDS initiation are robust to using
propensity score matching and the Heckman two-stage correction for self-selection bias.
" "

32"
APPENDIX: Variable Definition
Variables Description
Loan characteristics Log_spread The natural logarithm of loan spread, which equals the spread
between the interest rate on the loan and the relevant Libor rate, per dollar of loan, measured in basis points.
FacilityAmt The loan dollar amount in billions. Log_logsize The natural logarithm of loan amount in dollars Maturity The term of the loan in months. NCOV The number of financial and net worth covenants reported on
Dealscan. If no data are available we assume the number of covenants in the contracts is zero. The variables are measured per facility.
Securedum An indicator variable equal to one if the debt is collateralized and zero otherwise, if missing collateral data, we treat it as 0.
Non_syndication An indicator variable equal to one if a loan is not syndicated (i.e., sold in the primary market), and zero otherwise. A loan is not syndicated if there is only one lender on the loan.
LEAD_OWN The fraction of the loan owned by the lead arranger. INST An indicator variable equal to one if the loan is term loan B, C D,
and zero otherwise; If INST is one then institutional investors are involved in the loan.
Ltype An indicator variable equal to one if the loan is a revolver, and zero otherwise.
PP An indicator variable equal to one if a loan has performance pricing provisions, and zero otherwise.
GUARANTOR An indicator variable equal to one when borrower has a guarantor, and zero otherwise.
Lender_num The number of lenders on a loan. MKT_PCT The percentage market share of syndicated loan amount initiated by
the lead arranger in the prior calendar year. Firm characteristics and others Traded An indicator variable equal to one if there is a CDS market for the
firm’s debt at any time during the sample period, and zero otherwise. Post An indicator variable equal to one if a loan is issued after the CDS
initiation date, and zero otherwise. For firms without CDS traded on their debt, we randomly draw a date after 2001 as their “CDS initiation date.”
(Continued)
33"
APPENDIX - continued
Variables Description ROA Return on assets. It is defined as operating income after depreciation
divided by beginning of period total assets. Profit Operating income after depreciation divided by beginning of period total
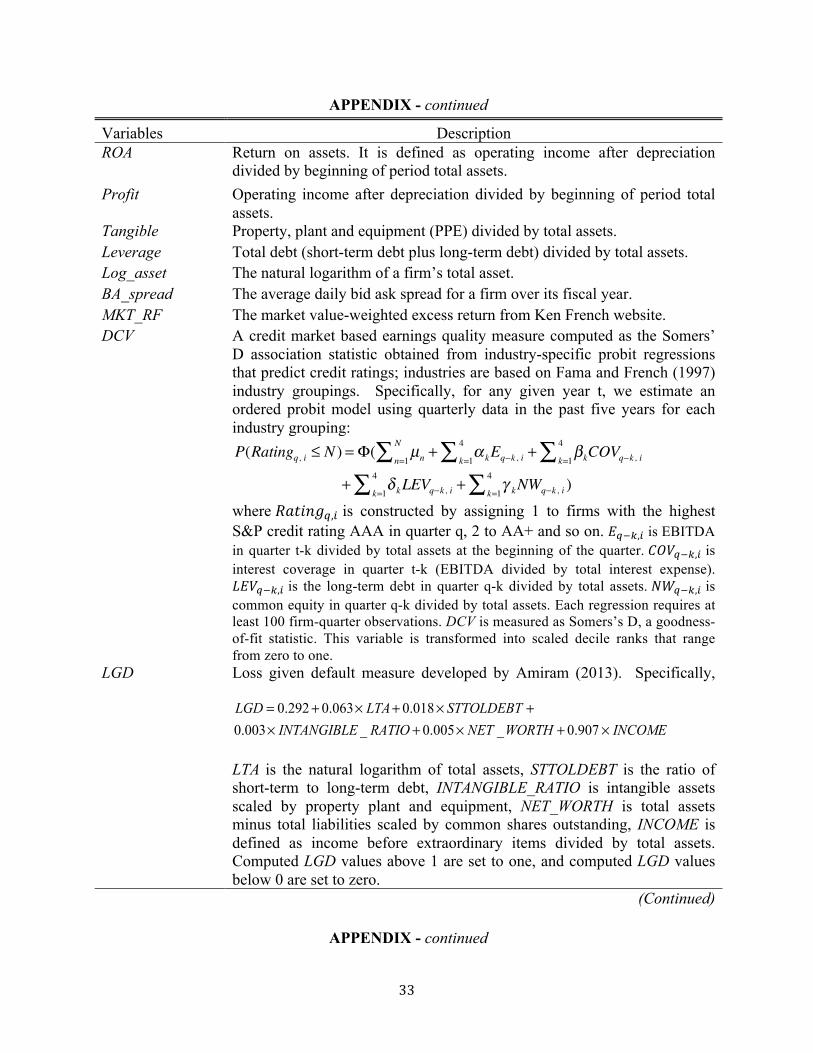
assets. Tangible Property, plant and equipment (PPE) divided by total assets. Leverage Total debt (short-term debt plus long-term debt) divided by total assets. Log_asset The natural logarithm of a firm’s total asset. BA_spread The average daily bid ask spread for a firm over its fiscal year. MKT_RF The market value-weighted excess return from Ken French website. DCV A credit market based earnings quality measure computed as the Somers’
D association statistic obtained from industry-specific probit regressions that predict credit ratings; industries are based on Fama and French (1997) industry groupings. Specifically, for any given year t, we estimate an ordered probit model using quarterly data in the past five years for each industry grouping:
P(Ratingq, i ≤ N ) = Φ( µnn=1
N∑ + α kk=1
4∑ Eq−k , i + βkk=1
4∑ COVq−k , i
+ δ kk=1
4∑ LEVq−k , i + γ kk=1
4∑ NWq−k , i )
where !"#$%&!,! is constructed by assigning 1 to firms with the highest S&P credit rating AAA in quarter q, 2 to AA+ and so on. !!!!,! is EBITDA in quarter t-k divided by total assets at the beginning of the quarter. !"#!!!,! is interest coverage in quarter t-k (EBITDA divided by total interest expense). !"#!!!,! is the long-term debt in quarter q-k divided by total assets. !"!!!,! is common equity in quarter q-k divided by total assets. Each regression requires at least 100 firm-quarter observations. DCV is measured as Somers’s D, a goodness-of-fit statistic. This variable is transformed into scaled decile ranks that range from zero to one.
LGD Loss given default measure developed by Amiram (2013). Specifically,
LGD = 0.292+ 0.063× LTA+ 0.018× STTOLDEBT +0.003× INTANGIBLE _ RATIO + 0.005× NET _WORTH + 0.907 × INCOME
LTA is the natural logarithm of total assets, STTOLDEBT is the ratio of short-term to long-term debt, INTANGIBLE_RATIO is intangible assets scaled by property plant and equipment, NET_WORTH is total assets minus total liabilities scaled by common shares outstanding, INCOME is defined as income before extraordinary items divided by total assets. Computed LGD values above 1 are set to one, and computed LGD values below 0 are set to zero.
(Continued)
APPENDIX - continued

34"
Variables Description Bsmprob Probability of default, which is the monthly estimated probability of
bankruptcy based on the Black Scholes Merton model. The estimation follows Hillegeist et al. (2004).
Rating A numeric rank of S&P credit ratings. We assign 1 to AAA, 2 to AA+, 3 to AA and etc. For firms without credit ratings, we follow the approach in Beaver et al (1998) to use accounting measures to generate credit ratings.
35"
References
Acharya, V., Johnson, T., 2007. Insider trading in credit derivatives, Journal of
Financial Economics 84: 110-141.
Amiram, D., 2013. Debt contracts and loss given default. Working Paper, Columbia University.
Ai, C., Norton, E., 2003. Interaction terms in logit and probit models. Economics letters 80: 123-
129.
Ashcraft, A., Santos, J., 2009. Has the CDS market lowered the cost of corporate debt?, Journal
of Monetary Economics 56: 514-523.
Armstrong, C., Guay, W., Weber, J., 2010. The role of information and financial reporting in
corporate governance and debt contracting. Journal of Accounting and Economics 50:
179-234.
Ball, R., Bushman, R., M., Vasvari, F., 2008. The Debt!Contracting Value of Accounting
Information and Loan Syndicate Structure. Journal of Accounting Research 46: 247-287.
Barth, M., Beaver, W., Landsman, W. 1998. Relative valuation roles of equity book value and
net income as a function of financial health. Journal of Accounting and Economics 25: 1-
34.
Berger, A., Udell, G., 1990. Collateral, loan quality and bank risk, Journal of Monetary
Economics 251: 21-42.
Bolton, P., Oehmke, M., 2011. Credit default swaps and the empty creditor problem. Review of
Financial Studies 24: 2617-2655.
Bradley, M., Roberts, M., 2004. The structure and pricing of corporate debt covenants, Working
Paper, University of Pennsylvania.
Cebenoyan, S., Strahan, P., 2004. Risk management, capital structure and lending at banks.
Journal of Banking & Finance 28: 19-43.
Chava, S., Livdan, D., Purnanandam, A., 2009. Do shareholder rights affect the cost of bank
loans?. Review of Financial Studies 22: 2973-3004.
Che, Y., Sethi, R., 2013. Credit Market Speculation and the Cost of Capital, Working paper,
Columbia University
Dou, Y., 2012. The Debt-Contracting Value of Accounting Numbers, Renegotiation, and
Investment Efficiency. Working paper, University of Toronto.

36"
Duffee, G., Zhou, C., 2001. Credit derivatives in banking: Useful tools for managing risk?.
Journal of Monetary Economics 48: 25-54.
Fama, E., French, K., 1997. Industry costs of equity. Journal of financial economics 43(2): 153-
193.
Fink, R., 2004. Credit default swaps: Who’s doing what? CFO.com, October 7.
Gong, G., Martin, X., Roychowdhury, S., 2013. Do Financial Market Developments Influence
Accounting Practices? Credit Default Swaps and Borrowers’ Reporting Conservatism.
Working paper, Temple University.
Graham, J., Si, L., Qiu, J., 2008. Corporate misreporting and bank loan contracting. Journal of
Financial Economics 89: 44-61.
Harjoto, M., Mullineaux, D., Yi H., 2006. Loan pricing at investment versus commercial banks,
Financial Management 35: 49-70.
Hillegeist, S., Keating, E., Cram, D., Lundstedt, K., 2004. Assessing the probability of
bankruptcy. Review of Accounting Studies 9: 5-34.
Hirtle, B., 2009. Credit derivatives and bank credit supply. Journal of Financial Intermediation
18: 125-150.
Hu, H., Black, B., 2008a. Debt, equity and hybrid decoupling: Governance and systemic risk
implications. European Financial Management 14: 663-709.
Hu, H., Black, B., 2008b, Equity and debt decoupling and empty voting II: Importance
and extensions, University of Pennsylvania Law Review 156: 625-739.
ISDA., 2013. Summaries of Market Survey Results. http://www.isda.org/statistics/recent.html
Ivashina, V., 2009. Asymmetric information effects on loan spreads. Journal of Financial
Economics, 92: 300-319.
Kim, J., Shroff, P., Vyas, D., Wittenberg M., 2014. Active CDS Trading and Managers’
Voluntary Disclosure. Working paper, University of Chicago.
Lim, J., Minton, B., and Weisbach, B., 2013. Syndicated Loan Spreads and the Composition of
the Syndicate. Working paper, Ohio State University
Markose, S., Giansante, S., Shaghaghi, A. R., 2012. ‘Too interconnected to fail’ financial
network of US CDS market: Topological fragility and systemic risk. Journal of
Economic Behavior & Organization, 83(3), 627-646.

37"
Morrison, A., 2005. Credit derivatives, disintermediation, and investment decisions, Journal of
Business 78: 621-47.
Nandy, D., Shao, P., 2010, Institutional investment in syndicated loans. Working Paper, York
University
Norden, L., Buston, C., Wagner, W., 2011. Banks’ use of credit derivatives and the pricing of
loans: What is the channel and does it persist under adverse economic conditions?,
Working paper, Tilburg University
Portes., R. 2010. “Ban Naked CDS,” Eurointelligence, March 18.
Saretto, A., Tookes, H., 2013. Corporate Leverage, Debt Maturity, and Credit Supply: The Role
of Credit Default Swaps. Review of Financial Studies 26: 1190-1247.
Soros, G., 2009. Soros"slams"'instruments"of"destruction'. http://money.cnn.com/2009/06/12/news/economy/soros_swaps.reut/index.htm"
Song, W., 2013. Do Credit Default Swaps Affect Lending Practices? Evidence from Syndicate
Structures and the London Whale Incident. Working paper, Louisiana State University.
Stulz, R., 2010. Credit Default Swaps and the Credit Crisis. Journal of Economic Perspectives
24 : 73-92.
Subrahmanyam, M., Tang, D., Wang, S., 2014. Does the tail wag the dog? The effect of credit
default swaps on credit risk. Review of Financial Studies, 27(10), 2927-2960.
Sufi, A. 2007. Information asymmetry and financing arrangements: Evidence from syndicated
loans. The Journal of Finance 62: 629-668.
Sustersic, J., 2012, Do traded credit default swaps impact lenders' monitoring activities?
Evidence from private loan agreements (Doctoral dissertation, The Ohio State
University).
Zhang, J., 2008, The contracting benefits of accounting conservatism to lenders and borrowers,
Journal of Accounting and Economics 45: 27-54.

38"
Figure 1 """""
Lead"bank’s"share""
Loan"spread"
0" 1"
Diversification"effect"(DLeadA)"
Adverse"selection/moral"hazard"effect"(DSynd)""
E"(0)"
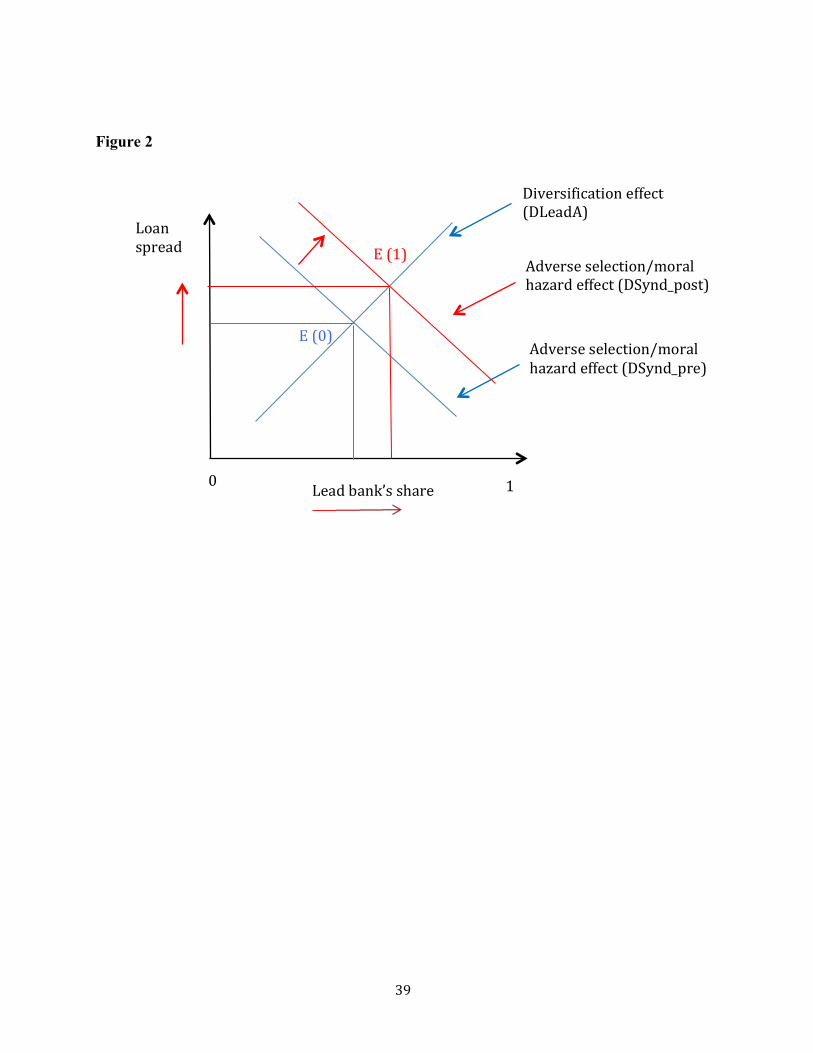
39"
Figure 2 """"""""" """""""""""
Loan"spread"
Lead"bank’s"share""
0" 1"
Adverse"selection/moral"hazard"effect"(DSynd_pre)"
Diversification"effect"(DLeadA)"
Adverse"selection/moral"hazard"effect"(DSynd_post)"
E"(1)"
E"(0)"

40"
Figure 3 """"""""""""""""""
Loan"spread"
0" 1"
Adverse"selection/moral"hazard"effect"(DSynd)"
Diversification"effect"(DLeadA_pre)"
Lead"bank’s"share""
Diversification"effect"(DLeadA_post_1)"
Credit"risk"effect"(DLeadA_post_2)"
E"(1)"
E"(2)"
E"(0)"

41"
Figure 4 """"""""""""""""""""
Loan"spread"
Lead"bank’s"share""
0" 1"
Adverse"selection/moral"hazard"effect"(DSynd)"
Diversification"effect"(DLeadA)"
E"(0)"
E"(1)"
E"(2)"
E"(0)"
Credit"risk"effect"(DLeadA_post_2)"
Diversification"effect"(DLeadA_post_1)"
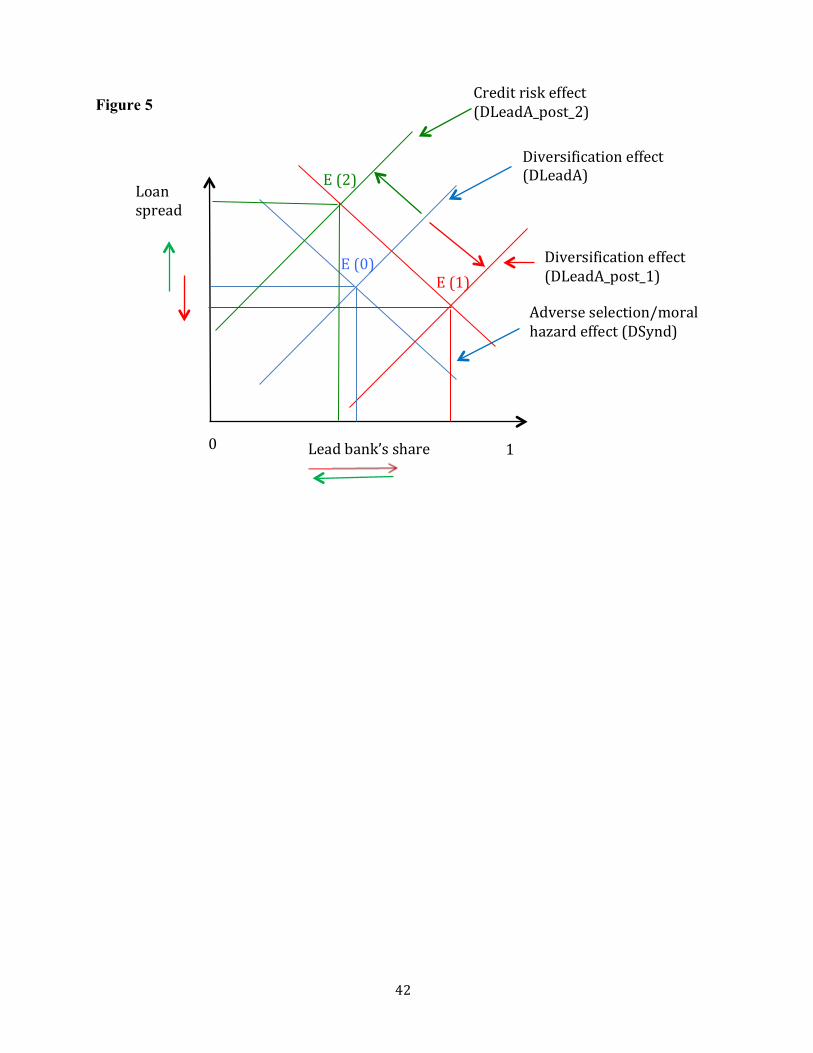
42"
Figure 5 """""""""""""""""""""
Loan"spread"
Lead"bank’s"share""
"
0" 1"
Adverse"selection/moral"hazard"effect"(DSynd)"
Diversification"effect"(DLeadA)"
E"(0)"E"(1)"
E"(2)"
Credit"risk"effect"(DLeadA_post_2)"
Diversification"effect"(DLeadA_post_1)"
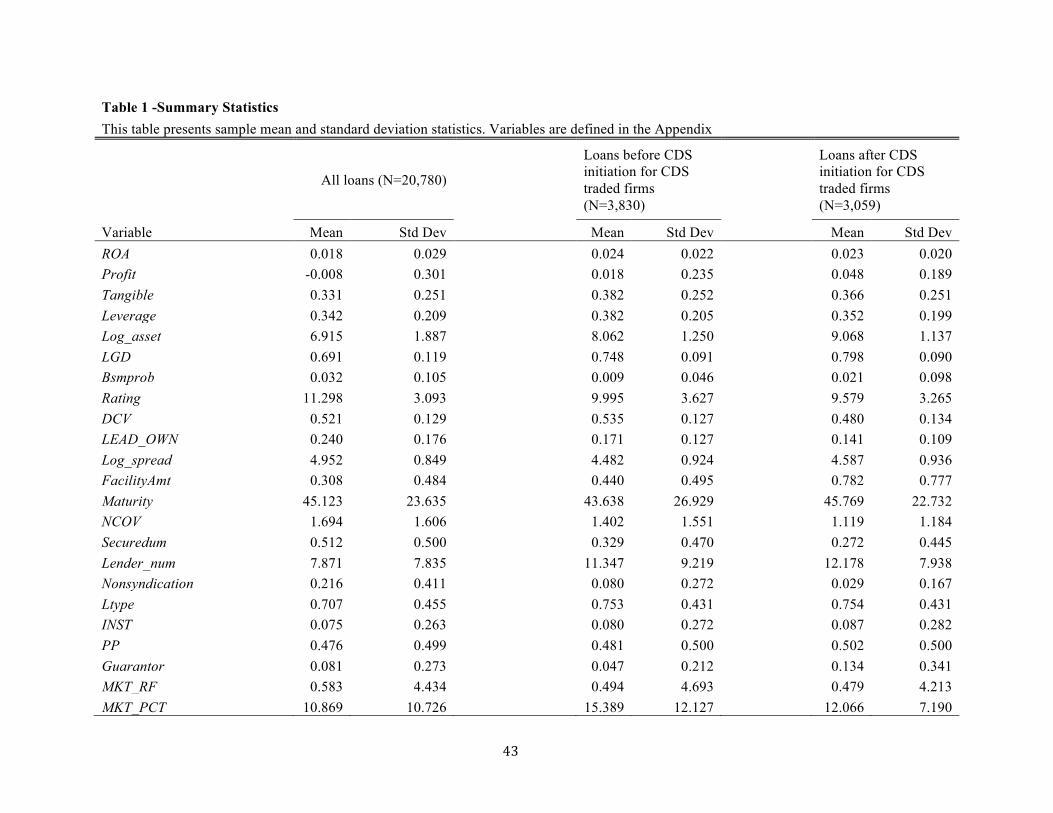
43#
Table 1 -Summary Statistics This table presents sample mean and standard deviation statistics. Variables are defined in the Appendix
All loans (N=20,780)
Loans before CDS initiation for CDS traded firms (N=3,830)
Loans after CDS initiation for CDS traded firms (N=3,059)
Variable Mean Std Dev Mean Std Dev Mean Std Dev ROA 0.018 0.029
0.024 0.022
0.023 0.020
Profit -0.008 0.301
0.018 0.235
0.048 0.189 Tangible 0.331 0.251
0.382 0.252
0.366 0.251
Leverage 0.342 0.209
0.382 0.205
0.352 0.199 Log_asset 6.915 1.887
8.062 1.250
9.068 1.137
LGD 0.691 0.119
0.748 0.091
0.798 0.090 Bsmprob 0.032 0.105
0.009 0.046
0.021 0.098
Rating 11.298 3.093
9.995 3.627
9.579 3.265 DCV 0.521 0.129
0.535 0.127
0.480 0.134
LEAD_OWN 0.240 0.176
0.171 0.127
0.141 0.109 Log_spread 4.952 0.849
4.482 0.924
4.587 0.936
FacilityAmt 0.308 0.484
0.440 0.495
0.782 0.777 Maturity 45.123 23.635
43.638 26.929
45.769 22.732
NCOV 1.694 1.606
1.402 1.551
1.119 1.184 Securedum 0.512 0.500
0.329 0.470
0.272 0.445
Lender_num 7.871 7.835
11.347 9.219
12.178 7.938 Nonsyndication 0.216 0.411
0.080 0.272
0.029 0.167
Ltype 0.707 0.455
0.753 0.431
0.754 0.431 INST 0.075 0.263
0.080 0.272
0.087 0.282
PP 0.476 0.499
0.481 0.500
0.502 0.500 Guarantor 0.081 0.273
0.047 0.212
0.134 0.341
MKT_RF 0.583 4.434
0.494 4.693
0.479 4.213 MKT_PCT 10.869 10.726 15.389 12.127 12.066 7.190
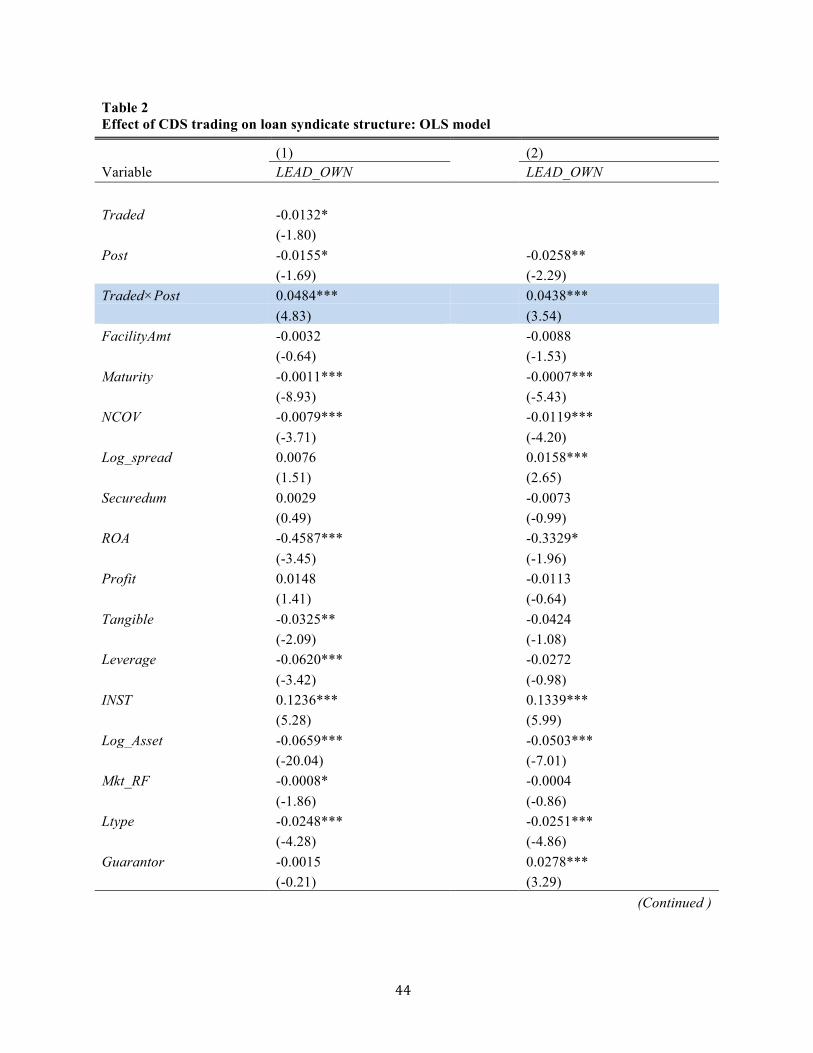
44"
Table 2 Effect of CDS trading on loan syndicate structure: OLS model
(1)
(2)
Variable LEAD_OWN LEAD_OWN
Traded -0.0132*
(-1.80)
Post -0.0155*
-0.0258**
(-1.69)
(-2.29)
Traded×Post 0.0484*** 0.0438*** (4.83) (3.54) FacilityAmt -0.0032
-0.0088
(-0.64)
(-1.53)
Maturity -0.0011***
-0.0007***
(-8.93)
(-5.43)
NCOV -0.0079***
-0.0119***
(-3.71)
(-4.20)
Log_spread 0.0076
0.0158***
(1.51)
(2.65)
Securedum 0.0029
-0.0073
(0.49)
(-0.99)
ROA -0.4587***
-0.3329*
(-3.45)
(-1.96)
Profit 0.0148
-0.0113
(1.41)
(-0.64)
Tangible -0.0325**
-0.0424
(-2.09)
(-1.08)
Leverage -0.0620***
-0.0272
(-3.42)
(-0.98)
INST 0.1236***
0.1339***
(5.28)
(5.99)
Log_Asset -0.0659***
-0.0503***
(-20.04)
(-7.01)
Mkt_RF -0.0008*
-0.0004
(-1.86)
(-0.86)
Ltype -0.0248***
-0.0251***
(-4.28)
(-4.86)
Guarantor -0.0015
0.0278*** (-0.21) (3.29)
(Continued )

45"
Table 2 (Continued) Bsmprob 0.1387***
0.0639
(3.22)
(0.96)
LGD -0.0069
0.0638
(-0.18)
(1.15)
Rating -0.0007
-0.0003
(-0.59)
(-0.21)
PP -0.0308***
-0.0343***
(-5.11)
(-4.80)
Constant 0.8191***
0.6488***
(18.56)
(8.21)
Fixed Effects Year/Industry
Year/Firm Observations 6099
6099
Adj R-squared 0.416 0.607 t-statistics in parentheses are based on standard errors clustered at firm level. *, ** and *** indicates significance at the 10%, 5% and 1% level, respectively. Variables are defined in the Appendix
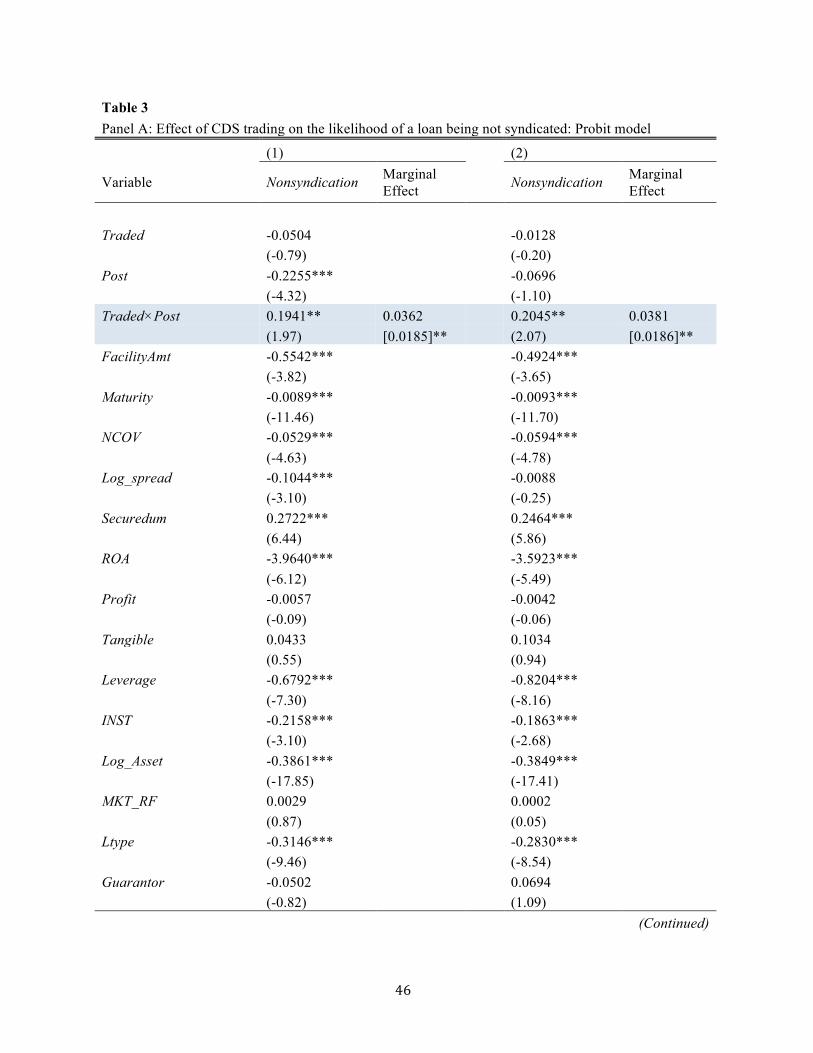
46"
Table 3 Panel A: Effect of CDS trading on the likelihood of a loan being not syndicated: Probit model
(1)
(2)
Variable Nonsyndication Marginal Effect Nonsyndication Marginal
Effect
Traded -0.0504
-0.0128
(-0.79)
(-0.20)
Post -0.2255***
-0.0696
(-4.32)
(-1.10)
Traded×Post 0.1941** 0.0362 0.2045** 0.0381 (1.97) [0.0185]** (2.07) [0.0186]** FacilityAmt -0.5542***
-0.4924***
(-3.82)
(-3.65) Maturity -0.0089***
-0.0093***
(-11.46)
(-11.70) NCOV -0.0529***
-0.0594***
(-4.63)
(-4.78) Log_spread -0.1044***
-0.0088
(-3.10)
(-0.25) Securedum 0.2722***
0.2464***
(6.44)
(5.86) ROA -3.9640***
-3.5923***
(-6.12)
(-5.49) Profit -0.0057
-0.0042
(-0.09)
(-0.06) Tangible 0.0433
0.1034
(0.55)
(0.94) Leverage -0.6792***
-0.8204***
(-7.30)
(-8.16) INST -0.2158***
-0.1863***
(-3.10)
(-2.68) Log_Asset -0.3861***
-0.3849***
(-17.85)
(-17.41) MKT_RF 0.0029
0.0002
(0.87)
(0.05) Ltype -0.3146***
-0.2830***
(-9.46)
(-8.54) Guarantor -0.0502
0.0694
(-0.82) (1.09)
(Continued)

47"
Table 3 (Continued) Bsmprob 0.8245***
0.9553***
(5.04)
(5.64) LGD 0.0397
0.1241
(0.19)
(0.57) Rating -0.0228***
-0.0137*
(-2.81)
(-1.75) PP -0.5531***
-0.5708***
(-15.14)
(-15.38) Constant 3.6242***
2.3597***
(15.62)
(5.26) Fixed Effects NO
Year/Industry
Observations 20780
20780 Pseudo R-squared 0.349 0.373
t-statistics in parentheses are based on standard errors clustered at firm level. Standard errors in brackets are calculated using the Delta method. *, ** and *** indicates significance at the 10%, 5% and 1% level, respectively. Variables are defined in the Appendix Table 3
Panel B: Predicted Prob of nonsyndication from multivariate probit regression. Traded=0 Post=0 0.2188***
[0.004]
Traded=0 Post=1 0.2062***
[0.010]
Traded=1 Post=0 0.2164***
[0.010]
Traded=1 Post=1 0.2419*** [0.017] Difference-in-Difference 0.0381** [0.019]
Standard errors in brackets are calculated using the Delta method. *, ** and *** indicates significance at the 10%, 5% and 1% level, respectively. Variables are defined in the Appendix
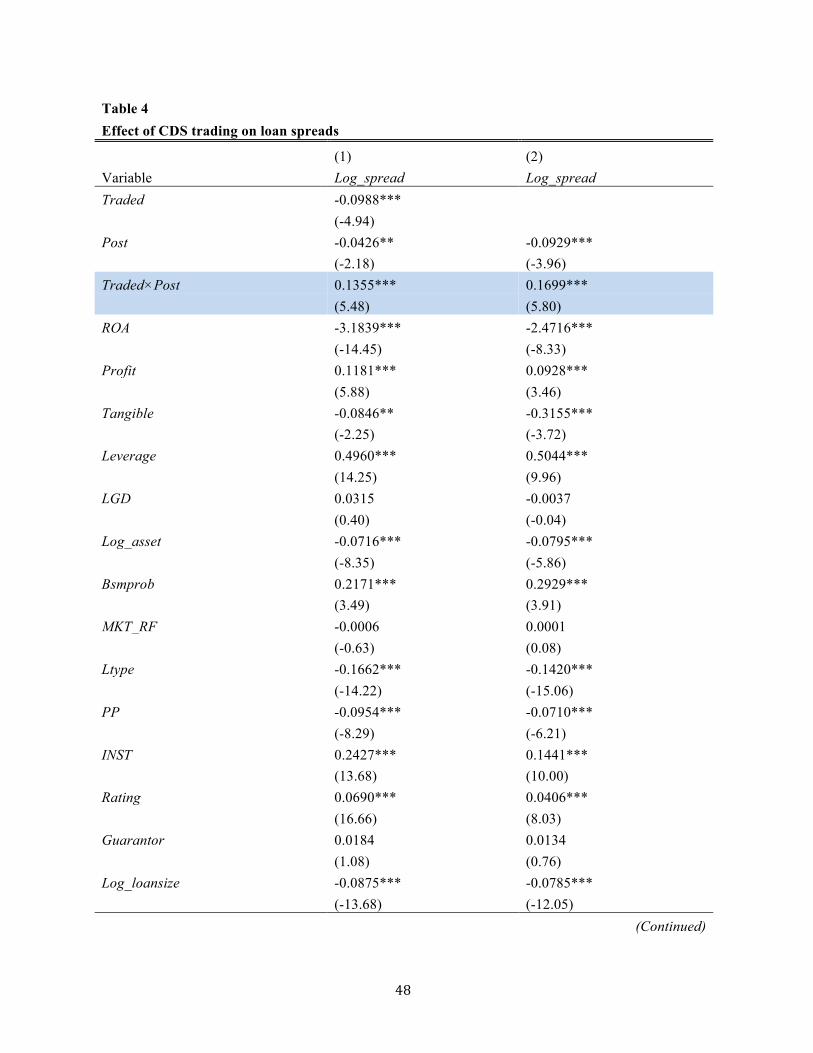
48"
Table 4 Effect of CDS trading on loan spreads
(1) (2)
Variable Log_spread Log_spread Traded -0.0988***
(-4.94) Post -0.0426** -0.0929***
(-2.18) (-3.96)
Traded×Post 0.1355*** 0.1699*** (5.48) (5.80) ROA -3.1839*** -2.4716***
(-14.45) (-8.33)
Profit 0.1181*** 0.0928***
(5.88) (3.46)
Tangible -0.0846** -0.3155***
(-2.25) (-3.72)
Leverage 0.4960*** 0.5044***
(14.25) (9.96)
LGD 0.0315 -0.0037
(0.40) (-0.04)
Log_asset -0.0716*** -0.0795***
(-8.35) (-5.86)
Bsmprob 0.2171*** 0.2929***
(3.49) (3.91)
MKT_RF -0.0006 0.0001
(-0.63) (0.08)
Ltype -0.1662*** -0.1420***
(-14.22) (-15.06)
PP -0.0954*** -0.0710***
(-8.29) (-6.21)
INST 0.2427*** 0.1441***
(13.68) (10.00)
Rating 0.0690*** 0.0406***
(16.66) (8.03)
Guarantor 0.0184 0.0134
(1.08) (0.76)
Log_loansize -0.0875*** -0.0785*** (-13.68) (-12.05)
(Continued)
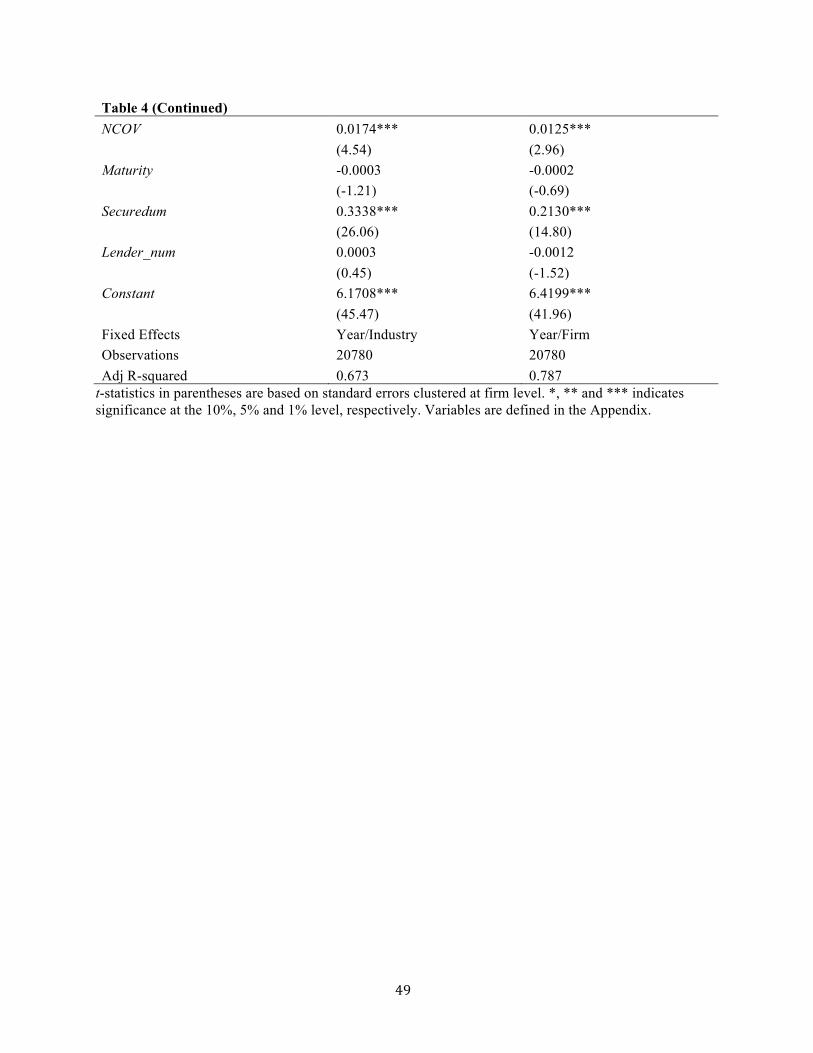
49"
Table 4 (Continued) NCOV 0.0174*** 0.0125***
(4.54) (2.96)
Maturity -0.0003 -0.0002
(-1.21) (-0.69)
Securedum 0.3338*** 0.2130***
(26.06) (14.80)
Lender_num 0.0003 -0.0012
(0.45) (-1.52)
Constant 6.1708*** 6.4199***
(45.47) (41.96)
Fixed Effects Year/Industry Year/Firm Observations 20780 20780 Adj R-squared 0.673 0.787
t-statistics in parentheses are based on standard errors clustered at firm level. *, ** and *** indicates significance at the 10%, 5% and 1% level, respectively. Variables are defined in the Appendix.

50"
Table 5 Panel A: Effect of CDS trading on shares retained by the lead arranger, does transparency matter
Variable LEAD_OWN
Traded
-0.0172
(-1.54)
Post
-0.0401***
(-2.74)
Traded×Post
0.0804***
(4.57)
DCV
-0.0063
(-0.51)
Traded×DCV
0.0051
(0.23)
Post×DCV
0.0461**
(2.11)
Traded×Post×DCV -0.0622** (-2.03) FacilityAmt
-0.0059
(-1.14)
Maturity
-0.0011***
(-8.87)
NCOV
-0.0087***
(-4.07)
Log_spread
0.0085*
(1.73)
Securedum
0.0056
(0.92)
ROA
-0.5198***
(-3.94)
Profit
0.0171
(1.64)
Tangible
-0.0243**
(-2.50)
Leverage
-0.0589***
(-3.40)
INST
0.1263***
(5.37)
Log_Asset
-0.0632*** (-19.62)
(Continued)

51"
Table 5 Panel A (continued) Mkt_RF
-0.0008*
(-1.73)
Ltype
-0.0262***
(-4.47)
Guarantor
-0.0032
(-0.42)
Bsmprob
0.1389***
(3.24)
LGD
-0.0121
(-0.31)
Rating
-0.0015
(-1.18)
PP
-0.0304***
(-4.99)
Constant
0.8215***
(19.65)
Fixed Effects
Year/Industry Observations
6099
Adjusted R-squared 0.412 t-statistics in parentheses are based on standard errors clustered at firm level. *, ** and *** indicates significance at the 10%, 5% and 1% level, respectively. Variables are defined in the Appendix. " "

52"
Table 5 Panel B.1: Effect of CDS trading on syndicated loan market, does transparency matter
Variable Nonsyndication Marginal Effect
Traded -0.1921*
(-1.73)
Post -0.0701
(-0.75)
Traded×Post 0.5529***
(3.24)
DCV -0.0518
(-0.66)
Traded×DCV 0.2738
(1.59)
Post×DCV 0.0563
(0.36)
Traded×Post×DCV -0.8571** -0.1617 (-2.56) [0.061]*** FacilityAmt -0.5676***
(-3.89) Maturity -0.0094***
(-11.95)
NCOV -0.0604***
(-4.89)
Log_spread -0.0315
(-0.90)
Securedum 0.2467***
(5.85)
ROA -3.7557***
(-5.74)
Profit 0.0297
(0.45)
Tangible 0.0339
(0.42)
Leverage -0.8179***
(-8.59)
INST -0.1841*** (-2.65)
(Continued )

53"
Table 5 Panel B.1 (Continued) Log_asset -0.3640***
(-16.17) Mkt_RF -0.0006
(-0.16)
Ltype -0.3041***
(-9.01)
Guarantor 0.0687
(1.09)
Bsmprob 0.9211***
(5.41)
LGD 0.0181
(0.08)
Rating -0.0184**
(-2.31)
PP -0.5778***
(-15.55)
Constant 2.9631***
(11.55)
Fixed Effects Year Observations 20780 Pseudo R-squared 0.362
t-statistics in parentheses are based on standard errors clustered at firm level. Standard errors in brackets are calculated using the Delta method. *, ** and *** indicates significance at the 10%, 5% and 1% level, respectively. Variables are defined in the Appendix.

54"
Table 5 Panel B.2: Marginal effect of Traded×Post at DCV=0 to 1 (i.e., Decile 1 to Decile 10)
DCV Decile 1 0.0898***
[0.028]
DCV Decile 2 0.0727***
[0.024]
DCV Decile 3 0.0559***
[0.021]
DCV Decile 4 0.0394**
[0.019]
DCV Decile 5 0.0231
[0.020]
DCV Decile 6 0.0072
[0.022]
DCV Decile 7 -0.0085
[0.025]
DCV Decile 8 -0.0239
[0.029]
DCV Decile 9 -0.0390
[0.034]
DCV Decile 10 -0.0538 [0.038]
Note: Cells report the marginal effect of the interaction Traded×Post at different levels of DCV (other variables are set at their mean). Standard errors in brackets are calculated using the Delta method.
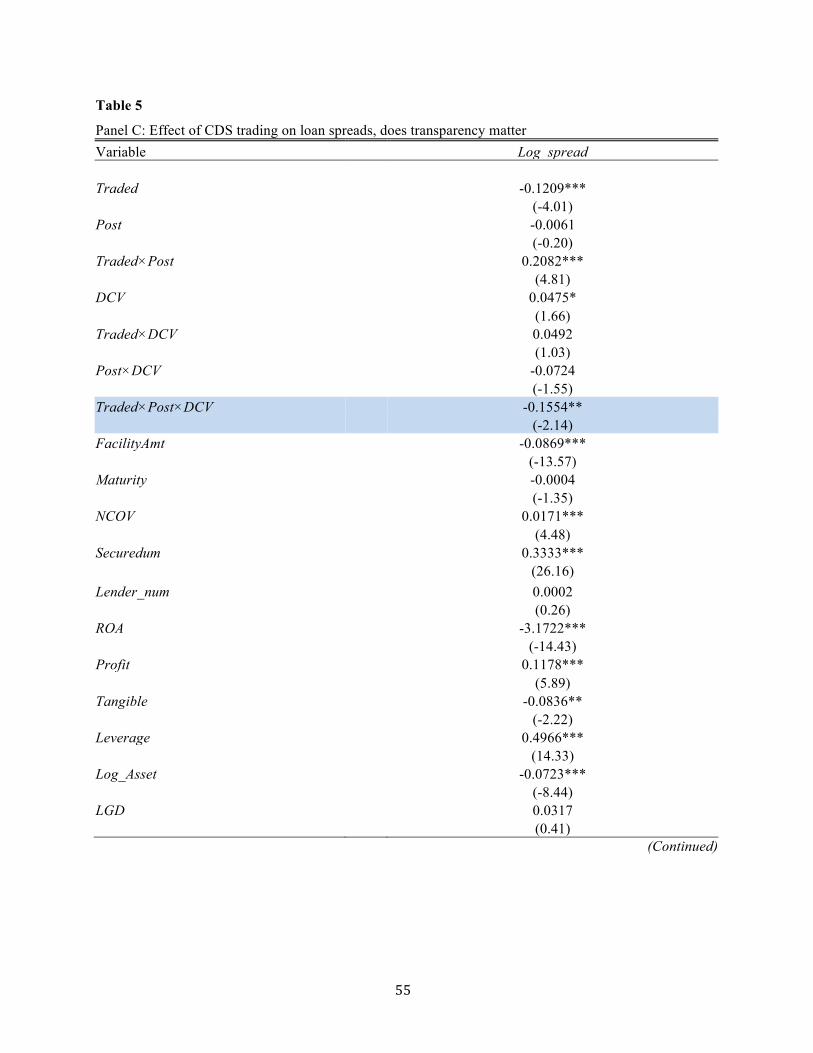
55"
Table 5 Panel C: Effect of CDS trading on loan spreads, does transparency matter
Variable Log_spread
Traded
-0.1209***
(-4.01)
Post
-0.0061
(-0.20)
Traded×Post
0.2082***
(4.81)
DCV
0.0475*
(1.66)
Traded×DCV
0.0492
(1.03)
Post×DCV
-0.0724
(-1.55)
Traded×Post×DCV -0.1554** (-2.14) FacilityAmt
-0.0869***
(-13.57)
Maturity
-0.0004
(-1.35)
NCOV
0.0171***
(4.48)
Securedum
0.3333***
(26.16)
Lender_num
0.0002
(0.26)
ROA
-3.1722***
(-14.43)
Profit
0.1178***
(5.89)
Tangible
-0.0836**
(-2.22)
Leverage
0.4966***
(14.33)
Log_Asset
-0.0723***
(-8.44)
LGD
0.0317 (0.41)
(Continued)

56"
Table 5 Panel C (continued) Bsmprob 0.2160***
(3.54)
MKT_RF
-0.0007
(-0.68)
Ltype
-0.1665***
(-14.24)
PP
-0.0944***
(-8.23)
INST
0.2425***
(13.67)
Rating
0.0688***
(16.76)
Guarantor
0.0182
(1.08)
Constant
6.1353***
(45.14)
Fixed Effects
Year Observations
20780
Adjusted R-squared 0.674 t-statistics in parentheses are based on standard errors clustered at firm level. *, ** and *** indicates significance at the 10%, 5% and 1% level, respectively. Variables are defined in the Appendix.

57"
Table 6 Panel A: Effect of CDS trading on loan syndicate structure for lead arrangers with higher Reputation
(i.e., the lead arranger's market shares in the syndicated loan market)
LEAD_OWN Traded -0.0180
(-1.60)
Post -0.0054
(-0.37)
Traded×Post 0.0548***
(3.07)
MKT_PCT -0.0016***
(-5.65)
Traded×MKT_PCT 0.0002
(0.40)
Post×MKT_PCT -0.0010
(-0.97)
Traded×Post×MKT_PCT -0.0004 (-0.36) FacilityAmt -0.0005
(-0.11)
Maturity -0.0010***
(-8.41)
NCOV -0.0083***
(-3.89)
Log_spread 0.0072
(1.46)
Securedum 0.0031
(0.51)
ROA -0.4724***
(-3.63)
Profit 0.0139
(1.34)
Tangible -0.0335**
(-2.20)
Leverage -0.0651***
(-3.66)
INST 0.1214***
(5.19)
Log_Asset -0.0650*** (-20.13)
(Continued)

58"
Table 6 Panel A (Continued) Mkt_RF -0.0007
(-1.51)
Ltype -0.0260***
(-4.52)
Guarantor -0.0034
(-0.46)
Bsmprob 0.1261***
(2.89)
LGD 0.0027
(0.07)
Rating -0.0008
(-0.67)
PP -0.0292***
(-4.88)
Constant 0.7976***
(19.42)
FE Year/Industry Observations 6099 Adj R-squared 0.419
t-statistics in parentheses are based on standard errors clustered at firm level. *, ** and *** indicates significance at the 10%, 5% and 1% level, respectively. Variables are defined in the Appendix. " "

59"
Table 6 Panel B.1: Effect of CDS trading on loan syndication for lead arrangers with higher Reputation (i.e., the
lead arranger's market shares in the syndicated loan market)
Nonsyndication Marginal Effect Traded -0.0081
(-0.10) Post 0.0613
(0.75)
Traded×Post 0.5433***
(3.47)
MKT_PCT -0.0150***
(-7.27)
Traded×MKT_PCT -0.0015
(-0.35)
Post×MKT_PCT -0.0198**
(-2.34)
Traded×Post×MKT_PCT -0.0426** -0.0071*** (-2.55) [0.0024] FacilityAmt -0.4057***
(-3.07) Maturity -0.0093***
(-11.82)
NCOV -0.0618***
(-4.89)
Log_spread -0.0274
(-0.80)
Securedum 0.2357***
(5.52)
ROA -3.6039***
(-5.45)
Profit 0.0129
(0.19)
Tangible 0.0811
(0.74)
Leverage -0.7943***
(-7.66)
INST -0.1652**
(-2.38)
Log_asset -0.3667*** (-16.32)
(Continued)

60"
Table 6 Panel B.1 (Continued) MKT_RF 0.0002
(0.06) Ltype -0.2707***
(-8.06)
Guarantor 0.0588
(0.92)
Bsmprob 0.9339***
(5.46)
LGD 0.0315
(0.14)
Rating -0.0154**
(-1.99)
PP -0.5469***
(-14.58)
Constant 2.9156***
(10.29)
Fixed Effects Year/Industry Observations 20780 Psuedo R-squared 0.3859
t-statistics in parentheses are based on standard errors clustered at firm level. Standard errors in brackets are calculated using the Delta method. *, ** and *** indicates significance at the 10%, 5% and 1% level, respectively. Variables are defined in the Appendix. Table 6
Panel B.2: Marginal effect of Traded×Post at MKT_PCT=0.2 to 30 MKT_PCT=0.2 0.1256***
[0.036]
MKT_PCT=1.6 0.1086***
[0.031]
MKT_PCT=10 0.0236
[0.021]
MKT_PCT=15 -0.0107
[0.025]
MKT_PCT=30 -0.0491 [0.031]
Note: Cells report the marginal effect of the interaction Traded×Post at different levels of MKT_PCT (other variables are set at their mean). Standard errors in brackets are calculated using the Delta method.

61"
Table 6
Panel C: Effect of CDS trading on loan spreads for lead arrangers with higher reputation (The lead arranger's market shares in the syndicated loan market)
Log_spread Traded -0.0732***
(-2.69)
Post -0.0696**
(-2.47)
Traded×Post 0.2276***
(5.41)
MKT_PCT -0.0016***
(-2.58)
Traded×MKT_PCT -0.0015
(-1.20)
Post×MKT_PCT 0.0021
(0.87)
Traded×Post×MKT_PCT -0.0071** (-2.06) ROA -2.8125***
(-12.63)
Profit 0.0862***
(4.22)
Tangible -0.1040***
(-2.69)
Leverage 0.5064***
(14.30)
LGD 0.2029**
(2.44)
Log_asset -0.1106***
(-12.95)
Bsmprob 0.1209*
(1.91)
MKT_RF -0.0003
(-0.30)
Ltype -0.2122***
(-17.99)
PP -0.0898***
(-7.70)
INST 0.2367*** (12.65)
(Continued)
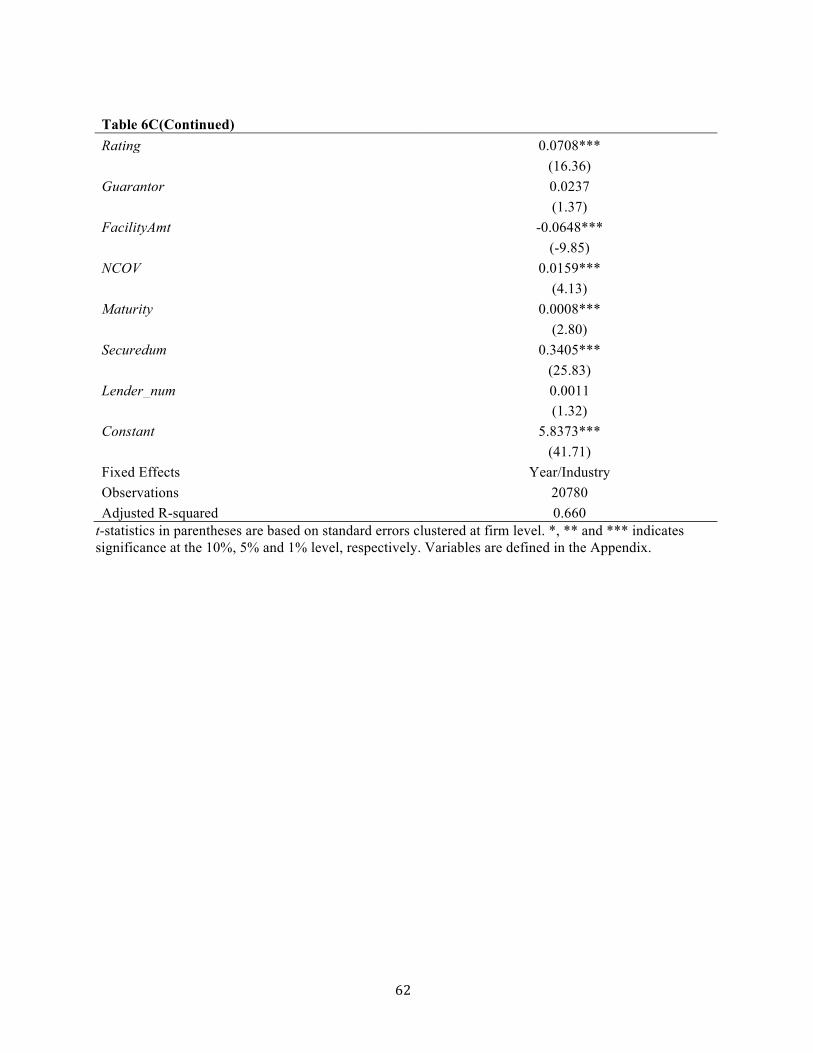
62"
Table 6C(Continued) Rating 0.0708***
(16.36)
Guarantor 0.0237
(1.37)
FacilityAmt -0.0648***
(-9.85)
NCOV 0.0159***
(4.13)
Maturity 0.0008***
(2.80)
Securedum 0.3405***
(25.83)
Lender_num 0.0011
(1.32)
Constant 5.8373***
(41.71)
Fixed Effects Year/Industry Observations 20780 Adjusted R-squared 0.660
t-statistics in parentheses are based on standard errors clustered at firm level. *, ** and *** indicates significance at the 10%, 5% and 1% level, respectively. Variables are defined in the Appendix.