cds trading and relationship lending dynamics jung koo
TRANSCRIPT

CDS Trading and Relationship Lending Dynamics
Jung Koo Kang
Marshall School of Business, University of Southern California
3670 Trousdale Pkwy, Los Angeles, CA 90089
Christopher D. Williams
Ross School of Business, University of Michigan
701 Tappan Street, Ann Arbor, MI 48109-1234
Regina Wittenberg-Moerman
Marshall School of Business, University of Southern California
3670 Trousdale Pkwy, Los Angeles, CA 90089
January 18, 2018
______________________________
We are grateful to Clive Lennox, K.R. Subramanyam, Eric Allen, Maria Ogneva and seminar participants at the
University of Michigan and the University of Southern California for helpful comments.

CDS Trading and Relationship Lending Dynamics
Abstract
We investigate how the development of the credit default swap (CDS) market affects lenders’
incentives to initiate new lending relationships. We predict that hedging loan exposure through
CDSs and the revelation of private information through CDS spreads reduce the adverse
selection that non-relationship lenders face when competing for loans. Consistent with our
expectations, we find that, following CDS initiation on a borrower’s debt, non-relationship lead
arrangers are more likely to originate its loans and non-relationship participants are more likely
to join loan syndicates. We also show that, following CDS initiation, non-relationship lenders
pursue new borrowers with high cross-selling potential and that lenders with low loan growth or
profitability are more likely to initiate new relationships. We further find that, relative to
relationship lead arrangers, non-relationship lead arrangers have lower monitoring incentives
following CDS initiation, as reflected by their weaker control rights and lower loan share
retained. As these lower monitoring incentives exacerbate agency problems within the syndicate,
the increase in the likelihood of a non-relationship participant joining the syndicate following
CDS initiation is attenuated if a loan is syndicated by a non-relationship lead arranger. Overall,
our findings shed light on how CDS trading affects the evolution of lending relationships.

1
1. Introduction
The development of the credit default swap (CDS) market is one of the most important
financial innovations of recent decades. CDSs offer lenders the chance to hedge borrowers’
credit risk while maintaining their lending relationships (e.g., Saretto and Tookes 2013).
However, hedging through CDSs reduces lenders’ incentives to monitor borrowers and may push
borrowers into inefficient bankruptcy (e.g., Hu and Black 2008; Ashcraft and Santos 2009;
Bolton and Oehmke 2011; Parlour and Winton 2013). Considering these positive and negative
attributes of CDS trading, we examine how the availability of CDSs influences the loan
origination and participation decisions in loan syndicates.
We predict that non-relationship lenders (i.e., lenders without a relationship with a
borrower before CDS initiation) are more likely to serve as lead arrangers or join loan syndicates
as participants once CDSs on a borrower’s debt become available. Non-relationship lenders
competing for a loan face adverse selection risk, as relationship lenders have a substantial
information advantage over them, due to prior experience with the borrower (Boot 2000).
Because relationship lenders exploit this advantage and bid for good loans while avoiding bad
ones, non-relationship lenders will compete less aggressively for a loan, which typically results
in them losing a loan to a better-informed incumbent lender (Rajan 1992). But once CDSs
become available, an opportunity to hedge against potential credit losses should significantly
mitigate non-relationship lenders’ adverse selection concerns. CDS spreads also often reveal
private information about a borrower, diminishing relationship lenders’ information advantage
(e.g., Acharya and Johnson 2007; Qiu and Yu 2012; Batta et al. 2016). We expect lower adverse
selection to increase the willingness of non-relationship lenders to bid for a loan, thus increasing
their probability of winning a deal. This reasoning applies to non-relationship lenders competing

2
with incumbent lead arrangers to serve as the lead arranger of a borrower’s loan as well as to
non-relationship lenders competing to join the syndicate with other participants that have
superior information about the borrower through prior lending.
Using staggered initiation of CDS trading across CDS firms, we employ a difference-in-
differences research design with firm and time fixed effects to explore our predictions. We find a
positive and significant effect of CDSs on non-relationship lending for both lead arrangers and
syndicate participants. The probability that a non-relationship lead arranger (syndicate
participant) arranges (joins) the loan syndicate is 1.39 (1.28) times higher following CDS trading
initiation on a borrower’s debt. These findings are robust when we perform short-window
analyses around CDS initiation, propensity-score match CDS firms with non-CDS firms, and
employ the instrumental variable approach. Overall, our analyses suggest that, due to CDS
hedging and the revelation of private information through CDS spreads, lenders are more likely
to initiate new lending relationships once CDSs become available.
To better understand the underlying mechanisms of non-relationship lending decisions
following CDS initiation, we next explore whether non-relationship lenders are more likely to
pursue borrowers with high cross-selling potential. Lending decisions are typically driven by the
overall profitability of the relationship with the borrower, including non-interest income
(Standard & Poor’s 2011). Lenders cross-sell various services, such as investment banking,
derivatives, and structured finance, generally aiming to serve as a “one-stop shop” of all financial
services for their borrowers (Fang et al. 2013). We predict that, because non-relationship lenders
are likely to hedge their loan exposure, thus reducing concerns regarding a borrower’s credit risk,
they focus more on commercial aspects of the lending relationship and pursue new borrowers
with high cross-selling potential. Substantial fees generated by cross-selling additional services

3
to the borrower also help compensate for the cost of purchasing CDS protection, further
reinforcing our prediction.
Because lenders’ expectations about borrowers’ future business needs are difficult to
assess, we use multiple measures of cross-selling potential: 1) media coverage of a borrower’s
activities, including public offerings, mergers and acquisitions (M&A), and investments; 2) a
borrower’s M&A after a loan’s issuance; 3) whether a borrower is in the aviation, ship building,
oil, refinery, gas, or telecommunication industries, which offer lenders opportunities to sell
structured finance products; 4) a borrower’s use of derivatives; and 5) the extent of a borrower’s
foreign operations. For all measures, we find that, following CDS initiation, lead arrangers are
more likely to enter into new lending relationships if a borrower has high cross-selling potential.
The likelihood of non-relationship participants joining the syndicate is also enhanced by cross-
selling potential, but to a lesser degree, which is likely explained by lead arrangers being the
primary beneficiaries of cross-selling opportunities (e.g., Ivashina and Kovner 2011).
To shed additional light on lenders’ incentives to initiate new lending relationships
following CDS initiation, we examine whether CDSs have a stronger effect on non-relationship
lenders that experience low loan growth, likely due to internal credit risk-management
restrictions or regulatory capital constraints. Since CDSs offer more flexible credit risk
management and alleviate capital constraints, we predict that these lenders are more likely to
seek new borrowers after the onset of CDS trading. We also expect lenders with low profitability
to have stronger incentives to initiate new relationships once they can hedge their exposure
through CDSs, as these relationships may boost profitability by generating additional interest
revenue and cross-selling fees. Consistent with these predictions, we find that low loan growth
and profitability amplify the effect of CDSs on the probability of initiating new relationships for

4
lead arrangers and syndicate participants.
We extend our analyses by testing non-relationship lenders’ monitoring incentives. These
analyses are based on lead arrangers’ relationship with the borrower, as lead arrangers perform
the primary monitoring of the borrower on behalf of syndicate participants. Although prior
studies show that CDSs diminish the strength of lead arranger monitoring (e.g., Subrahmanyam
et al. 2014; Martin and Roychowdhury 2015), we expect this adverse effect to be stronger for
non-relationship lead arrangers. Because non-relationship arrangers start syndicating loans to a
borrower only once CDSs become available, they are more likely to rely on CDS hedging, rather
than intensive monitoring, to protect themselves against credit risk. Weak monitoring may also
help non-relationship arrangers attract new borrowers, as well as give these borrowers flexibility
to pursue new business activities, which in turn creates further cross-selling opportunities.
We measure lenders’ monitoring incentives by the strength of their control rights, since
lenders retain stronger rights when they intend to monitor a borrower more closely (Roberts and
Sufi 2009a, 2009b; Roberts 2015). Loan contracts with a higher ratio of performance (income
statement-based) covenants to total financial covenants and those that incorporate interest-
increasing performance-pricing provisions give lenders stronger control rights (Roberts and Sufi
2009a; Christensen and Nikolaev 2012; Christensen et al. 2016). Consistent with our prediction,
we find that, following CDS initiation, non-relationship lead arrangers impose fewer
performance covenants relative to total financial covenants and are less likely to impose interest-
increasing provisions relative to relationship lead arrangers. Note that we find that lead arrangers
that had a relationship with the borrower before CDS initiation do not relinquish their control
rights afterward. This evidence indicates that the decrease in lenders’ control rights following
CDS initiation, documented previously (e.g., Shan et al. 2015; Chakraborty et al. 2015), stems

5
primarily from lenders that initiate a relationship with the borrower after CDS initiation.
Lead arrangers also have stronger monitoring incentives when they have more skin in the
game, i.e., retain a larger loan share (e.g., Sufi 2007; Ivashina 2009). Therefore, we predict that,
following CDS initiation, non-relationship lead arrangers retain a lower loan share relative to
relationship lead arrangers. We find strong support for this prediction. This evidence also
extends Amiram et al.’s (2017) findings of lead arrangers’ larger skin in the game following
CDS initiation, as we show that these findings are explained primarily by lenders who had
relationships with borrowers before CDS initiation.
Building on the stronger negative influence of CDSs on monitoring of non-relationship
relative to relationship lead arrangers, we expect syndicate participants to be concerned that the
former will shirk more on their monitoring duties. The agency problems within a syndicate are
mitigated if lenders with prior relationships with the borrower join the syndicate, since they are
more informed about the borrower’s performance and creditworthiness (e.g., Sufi 2007; Ivashina
2008). Thus, although we hypothesize and find that non-relationship participants are more likely
to join the syndicate following CDS initiation, we predict that this effect will be attenuated if a
non-relationship lead arranger syndicates a loan. We indeed find that, following CDS initiation,
the probability that a non-relationship participant joins a syndicate is lower if the loan is arranged
by a non-relationship relative to relationship lead arranger.
We conduct additional exploratory tests of the effect of CDSs on loan terms. To disrupt
existing lending relationships, non-relationship lenders may entice borrowers with favorable loan
terms, such as a low interest rate spread and large loan size. However, because hedging via CDSs
is costly, these terms may diminish the benefits of the new lending relationship. We find that,
following CDS initiation, non-relationship lead arrangers do not charge lower spreads but do

6
issue smaller loans, relative to relationship lead arrangers. Coupled with the significant impact of
cross-selling potential on non-relationship lenders’ decisions, this evidence suggests that, even
though these lenders provide new borrowers with less credit to reduce hedging costs, they still
get a mandate to provide them with additional financial services.
Our paper contributes to the literature on the influence of the CDS market on private
lending. Prior studies find a significant impact of CDSs on both borrowers’ access to credit and
the strength of lenders’ monitoring (e.g., Ashcraft and Santos 2009; Saretto and Tookes 2013;
Subrahmanyam et al. 2014; Martin and Roychowdhury 2015). These studies, however, mostly do
not differentiate between existing and new lending relationships.1 We extend this literature by
exploring how CDSs affect the formation of new relationships and the multifaceted lending
strategies of non-relationship lenders. We show that CDS trading increases the likelihood of
initiating new relationships for both lead arrangers and syndicate participants, especially when a
borrower has high cross-selling potential or lenders experience low loan growth and profitability.
Further, we supplement prior studies that examine the underlying mechanisms through which
CDSs affect lenders’ monitoring incentives, such as the loan share retained by the lead arranger
1 In a concurrent paper, Shan et al. (2016) also document higher likelihood of loans syndicated by non-relationship
lead arrangers following CDS initiation. They attribute this finding to borrowers switching to new lead arrangers
because borrower-lead arranger relationship is compromised by CDSs and becomes less valuable to the borrower. In
contrast, building on Rajan (1992), we suggest that CDSs decrease adverse selection between incumbent and non-
relationship lenders, thus increasing the willingness of the latter to compete for new borrowers and consequently the
likelihood of their winning a loan deal. Shan et al.’s (2016) proposition of compromised lead arranger-borrower
relationships cannot explain the majority of our findings, including 1) the effect of CDSs on the probability of non-
relationship participants joining syndicates; 2) the amplifying effect of lenders’ low loan growth and profitability on
initiating new lending relationships; and 3) the importance of a borrower’s cross-selling potential for lenders’
decisions to enter new lending relationships. Note, too, that our findings with respect to lead arrangers’ monitoring
incentives further undermine Shan et al.’s (2016) motivation. They argue that borrowers switch away from
relationship lenders primarily because they are concerned about these lenders’ monitoring incentives. In contrast, we
show that relationship lenders actually do not relinquish their control rights and increase their “skin in the game”
following CDS initiation, while non-relationship lenders monitor substantially less intensively than relationship
ones. In addition, our findings with respect to the interest spread differ from those of Shan et al. (2016), potentially
due to the fact that they do not employ a stringent difference-in-differences research design.

7
and lead arrangers’ control rights (e.g., Chakraborty et al. 2015; Shan et al. 2015; Amiram et al.
2017). We show that the influence of CDS trading on these mechanisms depends to a large
extent on whether lenders had an established relationship with a borrower before CDS initiation.
We also contribute to the large literature on relationship lending. While some studies show
important benefits to borrowers from established lending relationships (e.g., Petersen and Rajan
1994, 1995; Berger and Udell 1995; Brahrath et al. 2009), others emphasize its dark side, where
borrowers become locked in a relationship, due to the information advantage of incumbent
lenders (e.g., Sharpe 1990; Rajan 1992). We provide evidence consistent with CDS trading
fundamentally altering competition in the loan market by enhancing the willingness of non-
relationship lenders to compete for new borrowers. Relatedly, our findings underscore important
implications of financial innovation on the evolution of the lender-borrower relationship.
Finally, we add to the growing literature on the importance of noncredit revenue sources in
private lending. Prior studies show that lenders gain future underwriting of a borrower’s bonds
and equity (e.g., Yasuda 2005; Drucker and Puri 2005). There is also evidence that lenders price
in the loan spread a borrower’s cross-selling potential as well as its board network, as this
network offers an advantage in cross-selling services to other firms (e.g., Ivashina and Kovner
2011; Zhao 2017). We complement these studies by showing that a borrower’s cross-selling
potential is instrumental in lenders’ decisions to initiate new relationships.
The next section presents hypotheses development. Section 3 describes data and sample
selection. Section 4 reports our findings, and Section 5 concludes.
2. Related Literature and Hypothesis Development
2.1 CDS trading and non-relationship lending in the syndicated loan market
The introduction of CDSs significantly influenced the private debt market by offering

8
banks hedging opportunities to lay off borrowers’ credit risk, while maintaining lending
relationships (e.g., Saretto and Tookes 2013). Even if lenders do not hedge their loan exposure at
loan initiation, the existence of CDSs offers them a liquid resale option and thus increases their
willingness to extend credit. Further, CDSs allow lenders more flexible risk management and
provide them an opportunity to reduce regulatory capital requirements by substituting the risk
weight of the CDS counterparty (typically, a large financial institution) for that of the borrower
(Saretto and Tookes 2013; Streitz 2015; Martin and Roychowdhury 2015; Shan et al. 2016).
Yet CDSs also induce empty creditor problems as CDS-protected lenders become
intransigent in debt renegotiation or even push borrowers into inefficient liquidation (Hu and
Black 2008; Bolton and Oehmke 2011). CDSs reduce lenders’ monitoring incentives because
hedging their loan exposure may be less costly alternative to protect themselves against default
risk than intensive information collection and monitoring. Consistent with weaker monitoring,
prior studies find that, following CDS initiation, the cost of debt increases for risky and
informationally opaque borrowers, borrowers experience more credit rating downgrades and
bankruptcies and report less conservatively, and lenders impose looser financial covenants and
weaker restrictions after covenant violations (Ashcraft and Santos 2009; Subrahmanyam et al.
2014; Martin and Roychowdhury 2015; Chakraborty et al. 2015; Shan et al. 2015). Amiram et al.
(2017) show that syndicate participants, who largely delegate monitoring to the lead arranger,
require the arranger to have more skin in the game to compensate for the reduction in its
monitoring incentives after the initiation of CDS trading.
We extend these studies by examining how the availability of CDSs affects the likelihood
of lenders without a prior relationship with the borrower serving as the lead arranger or joining
its loan syndicate as a participant. Because relationship lenders have an information advantage,

9
due to their extensive knowledge of a borrower’s operations and creditworthiness, non-
relationship lenders competing for a borrowers’ loans face substantial adverse selection risk
(Boot 2000). This typically results in a non-relationship lender losing competition for a
borrower’s loan to a better-informed incumbent lender. Specifically, Rajan (1992) shows that
relationship lenders exploit their information advantage and bid for good loans while avoiding
bad ones. Because relationship lenders avoid bad loans, non-relationship lenders face significant
losses if they do bid. As a result, non-relationship lenders, being aware of the adverse selection
problem, compete less aggressively, which reduces the probability that they win the loan.
The availability of CDSs on a borrower’s debt mitigates adverse selection risk that non-
relationship lenders face because it allows them to hedge loan exposure, thus assuaging their
concerns regarding potential credit losses when initiating a new relationship. CDS spreads also
often reveal private information about a borrower, ahead of public disclosures and price
discovery in other markets, largely due to insider trading of informed financial institutions (e.g.,
The Financial Times 2005; Acharya and Johnson 2007; Qiu and Yu, 2013; Batta 2016). The
revelation of a substantial private information through CDSs should reduce relationship lenders’
information advantage, further alleviating non-relationship lenders’ adverse selection concerns.
This reasoning applies to lead arrangers as well as syndicate participants. Relationship
lenders and non-relationship lenders compete to serve as the lead arranger on a borrower’s loan.
Lower adverse selection, due to CDS availability, is expected to increase non-relationship lead
arrangers’ willingness to compete for a borrower’s loan, increasing the probability of their
winning the deal (Rajan 1992). Similarly, lenders compete to join syndicates. Syndication
represents an auction in which loan participants submit sealed bids to the lead arranger, and the
number of invitations extended to potential participants typically exceeds the number of lenders

10
who will fund the loan (Champagne and Kryzanowski 2007; Ivashina and Sun 2011). Lenders
with superior information about the borrower, because of prior lending relationships, are likely to
pursue participation in good loans, leaving bad ones to non-relationship participants. We expect
lower adverse selection, due to CDS hedging and the revelation of private information through
CDS spreads, to increase the willingness of non-relationship lenders to bid for loan participation.
Building on these argument, we state our first hypothesis as follows.
H1: The probability that a non-relationship lead arranger (syndicate participant) arranges
(joins) the loan syndicate is higher following the initiation of CDS trading on a borrower’s debt.
2.2 The Importance of Cross-selling Opportunities in Non-Relationship Lending
We next investigate whether a borrower’s cross-selling potential intensifies the effect of
CDS trading on non-relationship lending in the syndicated loan market. Lenders invest in loans
for more than just the interest income: they consider the overall profitability of the relationship,
including noncredit revenue (Standard & Poor’s 2011). In particular, lenders typically adopt a
portfolio-management approach, in which they allocate capital to borrowers based on the total
return generated by a relationship, relative to its risk.
Lenders cross-sell various services, including investment banking, derivatives, and
structured finance. Yasuda (2005) and Drucker and Puri (2005) show that serving as a lead
arranger helps banks to gain future underwriting of a borrower’s bonds and equity. Ivashina and
Kovner (2011) also show that lenders account for cross-selling potential when pricing leveraged
buyout loans. Fang et al. (2013) provide evidence consistent with banks aiming to serve as “one-
stop shop” for financial services for their borrowers.
Because non-relationship lenders initiate lending relationship only ones CDSs become
available, they are likely to hedge their exposure, thus diminishing concerns about a borrower’s

11
credit risk. Thus, we expect them to focus more on commercial aspects of the lending
relationship and pursue new borrowers with high cross-selling potential. Further, cross-sold
products are mostly fee based and entail minimal risk-weighted assets. Therefore, fees from
cross-selling help lenders compensate for the cost of purchasing CDS protection, while the
services sold impose only insignificant pressure on regulatory capital ratios. We state our second
hypothesis as follows.
H2: The increase in the probability that a non-relationship lead arranger (syndicate
participant) arranges (joins) the loan syndicate following the initiation of CDS trading on a
borrower’s debt is higher when the borrower has a high cross-selling potential.
2.3 Lender Characteristics and Non-Relationship Lending
To illuminate lenders’ incentives to initiate new relationships with borrowers after the
onset of CDS trading, we next investigate how lender characteristics affect the relation between
CDS trading and non-relationship lending. Lenders often cannot expand their loan portfolio,
because they are restricted by an internal credit risk management policy or face regulatory capital
constraints. CDS hedging offers them more flexible credit risk management strategies and
alleviate regulatory constraints (Streitz 2015; Shan et al. 2016). Therefore, we expect that lenders
experiencing low loan growth will be more likely to extend their loan portfolio and seek new
borrowers following CDS initiation.
We also expect CDS initiation to more strongly affect less profitable lenders. When
hedging via CDSs and information revelation through CDS spreads become available, these
lenders are likely to be eager to pursue new relationships to enhance profitability. By expanding
loan portfolios, they will benefit from higher interest income and fees from cross-selling
additional services to new borrowers. We state our third hypothesis as follows.

12
H3: The increase in the probability that a non-relationship lead arranger (syndicate
participant) arranges (joins) the loan syndicate following the initiation of CDS trading on a
borrower’s debt is higher for arrangers (participants) with low loan growth or profitability.
2.4 Non-relationship Lenders’ Monitoring Incentives
We further study how incentives and strategies of CDS-protected non-relationship
lenders affect their monitoring incentives. Here, we focus on lead arrangers of syndicates,
because they negotiate loan terms with the borrower and assume the primary screening and
monitoring responsibilities on behalf of syndicate participants (e.g., Lee and Mullineaux 2004;
Sufi 2007; Ivashina 2009). Even though prior studies document that CDSs undercut lenders’
monitoring incentives (e.g., Ashcraft and Santos 2009; Subrahmanyam et al. 2014; Martin and
Roychowdhury 2015; Amiram et al. 2017), we predict that this effect is stronger for non-
relationship lead arrangers. Because non-relationship arrangers initiate new relationships with the
borrowers only once CDSs become available, they are more likely to rely on CDSs, rather than
on borrower monitoring, to protect themselves against credit risk. Relative to relationship
arrangers, with their extensive knowledge of a borrower and deep channels of communication
with its managers, monitoring new borrowers will be also substantially costlier for non-
relationship arrangers. Moreover, if non-relationship lead arrangers monitor less intensively, this
may help them attract new borrowers, as borrowers prefer fewer constraints on their actions (e.g.,
Berlin and Mester 1992; Bradley and Roberts 2015). As non-relationship arrangers are likely to
cross-sell additional services to these borrowers, allowing them greater flexibility to engage in
new business activities would further benefit these lenders. Our fourth hypothesis is as follows.
H4: Following CDS initiation, non-relationship lead arrangers have weaker monitoring
incentives, relative to relationship lenders.

13
2.5 Agency Problems within the Loan Syndicate
Syndicate participants typically maintain an arm’s length relationship with a borrower and
delegate information collection, contractual negotiations, and borrower screening and monitoring
to the lead arranger. Therefore, participants face substantial agency issues when they join a
syndicate (e.g., Lee and Mullineaux 2004; Sufi 2007; Ivashina 2009). Building on our fourth
research hypothesis, we expect greater agency problems within the loan syndicate when it is
arranged by a non-relationship lead arranger after CDS initiation. A stronger decline in the
monitoring incentives of non-relationship relative to relationship lead arrangers should cause
syndicate participants to be concerned that the former will shirk more on their monitoring duties
(e.g., Sufi 2007; Ivashina 2009). These agency problems can be significantly mitigated if lenders
with prior relationships with the borrower become syndicate participants, because they are more
informed about the borrower’s performance and creditworthiness (Sufi 2007). Thus, although we
predict that non-relationship participants are more likely to join the syndicate after CDS
initiation, we expect that this effect will be weaker when a loan is syndicated by a non-
relationship lead arranger. Building on these arguments, we state our final hypothesis as follows.
H5: The increase in the probability that a non-relationship syndicate participant joins the
loan syndicate following the initiation of CDS trading on a borrower’s debt is lower if the loan is
arranged by a non-relationship lead arranger.
3. Sample, Data, and Descriptive Statistics
3.1 Data sources and sample selection
We obtain syndicated loan characteristics from DealScan and CDS data from Markit.
Borrowers’ characteristics are from Compustat and CRSP, and banks’ characteristics are from
Call Reports (Form Y-9C regulatory filings). We collect firm credit ratings from Compustat and

14
Mergent FISD, data on analyst coverage from I/B/E/S, data on media articles from RavenPack
News Analytics, and data on mergers and acquisitions from SDC.
We start sample selection with all syndicated loans issued from 1994 to 2015, as reported
in DealScan. There are 46,061 loan packages (deals) issued to US firms over this period. We
match this sample to Compustat and eliminate observations with insufficient loan and firm data,
resulting in 29,559 loan packages, issued to 6,956 firms. We match this sample to Markit and
identify firms with traded CDSs at any point over our sample period (CDS firms hereafter).
Following prior literature (e.g., Ashcraft and Santos 2009; Amiram et al. 2017), we identify the
date of CDS trading initiation as the first date when a CDS quote for a firm is provided by
Markit.2 In line with Amiram et al. (2017), we eliminate firms for which the first CDS trade date
falls in January 2001, the first month of Markit’s coverage, because of the ambiguity of the exact
date of initiation for these firms. We also require each CDS firm to have at least one loan issued
in both the pre- and post-CDS initiation periods and non-CDS firms to have at least one loan
issued starting in 2001, when CDS firms in our sample begin to have traded CDSs. Our final
sample contains 843 CDS firms and 2,814 non-CDS firms, corresponding to 23,316 loan
packages. This process yields 27,547 (177,936) arranger-loan (participant-loan) observations.
3.2 Descriptive statistics
Table 1 presents descriptive statistics of the main variables used in our test. The mean
value of No Relationship - Lead Arranger indicates that 38% of lead arrangers in our sample do
not have a prior relationship with the borrower. For lead arrangers that syndicate loans to CDS
firms following CDS initiation, we define the No Relationship - Lead Arranger indicator variable
2 Our main findings are unchanged when we identify CDS initiation date as the first date when the quote for a five-
year USD-denominated CDS contract is provided by Markit, following Ashcraft and Santos (2009). These contracts
are the most commonly traded in the CDS market.

15
to be equal to 1 if the lead arranger has not syndicated a borrower’s loans before the CDS
initiation date and 0 otherwise. For lead arrangers that syndicate loans to CDS firms prior to
CDS initiation or to non-CDS firms, we define No Relationship - Lead Arranger to be equal to 1
if the lead arranger has not syndicated a borrower’s loans before the issuance date of the loan
under consideration and 0 otherwise. The mean value of No Relationship - Participant indicates
that 44% of syndicate participants in our sample do not have prior relationships with the
borrower. For syndicate participants in loans to CDS firms following CDS initiation, we define
the No Relationship - Participant indicator variable to be equal to 1 if the participant has not
participated in a borrower’s loans before the CDS initiation date and 0 otherwise. For
participants in loans to CDS firms prior to CDS initiation or to non-CDS firms, we define No
Relationship - Participant to be equal to 1 if the participant has not participated in a borrower’s
loans before the issuance date of the loan under consideration and 0 otherwise.3
For both the lead arranger and participant samples, the firms are relatively large, as
reflected by the mean values of Assets, defined as the natural logarithm of total assets (detailed
variable definitions are reported in Appendix A). The average ratio of net income to total assets
(ROA) is 0.03 for both samples, and 21% (16%) of sample observations relate to firms
experiencing losses (Loss) for the lead arranger (participant) samples. The mean leverage ratio
(Leverage), measured by the ratio of total liabilities to total assets, is 0.64 (0.66), and the average
interest coverage ratio (Interest coverage), measured as EBIT divided by the interest expense, is
11.02 (9.65), while mean asset tangibility (Tangibility), measured as property, plant, and
equipment divided by total assets, is 0.60 (0.59) for the lead arranger (participant) sample. In
3 We acknowledge that defining No Relationship based on the CDS initiation date for CDS firm and based on loan
issuance date for non-CDS firms may raise a concern about the validity of our findings. In Section 4.2, we use
difference-in-differences approach, where we assign a pseudo-CDS initiation date to the matched non-CDS firms
using the initiation date of the paired CDS firms. This allows us to measure No Relationship over the same period
for each pair of CDS and matched non-CDS firms.

16
addition, 58% (72%) of the lead arranger (participant) sample observations relate to borrowers
that are rated (Rated) and 33% (42%) to borrowers with investment-grade ratings (Investment
Grade). We also report statistics for loan characteristics that serve as controls. For both samples,
the mean and median value of loan size (Amount), measured by natural logarithm of the loan
amount, suggest that sample observations relate to loans that are relatively large (Amount), have
an average maturity (Maturity) of approximately four years, and are subject to less than two
financial covenants (#Covenants). A majority of observations are characterized by performance
pricing provisions (PP), and 10% (11%) of them have a loan guarantor (Guarantor) for the lead
arranger (participant) sample.
4. Empirical Results
4.1 The effect of CDS Trading on Non-Relationship Lending
To examine our first hypothesis that lenders are more likely to issue loans to a new
borrower following the CDS trading initiation on the borrower’s debt, we estimate the following
logit model.
No Relationship = β 0 + β1POST + β2Assets + β3ROA + β4Loss + β5Leverage
+ β6Interest Coverage + β7Tangibility + β8Rated
+ β9Investment Grade + β10Amount + β11Maturity + β12Guarantor
+ γFixed Effects + ε,
(1)
where No Relationship is one of the two indicator variables — No Relationship-Lead Arranger
and No Relationship-Participant — defined as previously. Our main variable of interest is the
POST indicator variable, which equals to 1 if the loan is issued after the CDS trading initiation
date and 0 otherwise (this variable takes the value of 0 for all loans to non-CDS firms). If non-

17
relationship lending increases after CDS trading initiation on a borrower’s debt, we expect a
positive and significant coefficient on POST.
We control for firm and loan characteristics that can affect lenders’ decisions to initiate
new lending relationships, including a firm’s size, profitability, the incidence of losses, interest
coverage, tangibility and credit rating characteristics, as well as loan size, maturity and whether a
loan has a guarantor. All firm characteristics are defined as previously and measured in the year
preceding a loan’s issuance. For loan packages that contain more than one loan (facility), we
follow Ball et al. (2008) and Ivashina (2009) and use characteristics of the largest one. Our
findings are unchanged when we control for the weighted-average loan characteristics of all
loans in the package, where weights are based on loan (facility) size.4
To aid identification strategy, we include in Model (1) firm and year fixed effects, allowing
us to implement a difference-in-differences research design, because CDS initiation dates are
staggered across CDS firms. Firm fixed effects control for the time-invariant differences between
CDS and non-CDS firms, while year fixed effects control for the time-varying factors common
to all sample firms (e.g., Bertrand and Mullainathan 2003; Sapienza 2002; Valta 2012; Amiram
et al. 2017).5 We acknowledge that, because firms may issue loans in months both before and
after the initiation date during the CDS initiation year, employing year-month fixed effects is a
better strategy to identify initiation effects. Due to concerns regarding a large number of fixed
effects in nonlinear models (e.g., Maddalla 1987; Greene 2004), as an additional specification,
we estimate Model 1 with a linear probability model, where we substitute year fixed effects with
4 We do not control for the number of covenants and performance pricing provisions, as these characteristics are
typically determined during the loan negotiation and therefore cannot affect lenders’ choice of whether to start a new
lending relationship. In any case, in untabulated analyses, we find that our results are robust to the inclusion of these
variables. 5 In section 4.2 below, we propensity-score match CDS firm to non-CDS firm, which allows us to assign the CDS
initiation date to each matched non-CDS firm. Our results are robust to this standard difference-in-difference
approach.

18
year-month fixed effects. Moreover, as many of our subsequent analyses incorporate interaction
terms, linear probability estimations also mitigate concerns regarding the interpretation of
interaction terms in our nonlinear model estimations (e.g., Norton et al., 2004). To correct for
within-firm correlation in the error term, we cluster standard errors at the firm level.
We present our findings in Panel A of Table 2. In columns 1 and 2, we report the
estimation of Model (1) employing Logit and OLS models, respectively, for the lead arranger
sample. We find a positive and significant coefficient on POST for both Logit and OLS
specifications. Economically, based on the OLS specification, the probability that a non-
relationship lead arranger syndicates the loan is 1.39 times higher following the CDS trading
initiation (note that we measure economic significance based on the OLS specification for all
tests). We find similar results for syndicate participants, as reported in columns 3 and 4. The
probability that a participant with no relationship with the borrower joins the syndicate is 1.28
times higher once CDSs become available. These results are consistent with our primary
prediction that lenders are more likely to initiate a new lending relationship after the inception of
CDSs referencing the borrower’s debt.6
With respect to controls, the negative and significant coefficient on Leverage suggests that
higher leverage deters non-relationship lenders. The positive and significant coefficient on
Tangible for the lead arranger sample implies that higher asset tangibility attracts non-
relationship arrangers. When borrowers issue longer maturity loans and those with guarantors,
we find that it is more likely for these loans to be arranged by non-relationship lenders.
One concern that might arise when using our difference-in-differences research design is
whether the parallel trend assumption holds. To address it, we augment Model (1) with an
6 In untabulated analyses, we find that the effect of CDS trading on non-relationship lending is more pronounced for
lead arrangers than syndicate participants.

19
indicator variable Last Loan, which is equal to 1 for the last loan issued before the CDS initiation
date and 0 otherwise. If there exists a pre-tend of non-relationship lending before CDS initiation,
we expect to find a higher likelihood of non-relationship lending for the last loan before
initiation (Heider and Ljungqvist 2015; Amiram et al. 2017). As we report in Panel B, the
coefficients on Last Loan are insignificant and negative across all model specifications,
indicating that the likelihood of non-relationship lending is not higher for the last loan before
CDS initiation date relative to the loans preceding this loan. This evidence suggests that the
parallel trend assumption holds in our tests.
To further verify the robustness of our findings, we repeat our analyses using a short-
window sample that limits observations of CDS firms to three years before and after CDS
initiation. These analyses mitigate concerns that factors other than CDS initiation could drive our
results. We report these tests in Panel C. Consistent with our main findings, the coefficients on
POST is positive and significant for all lead arranger and participant specifications.
We provide additional support for our inferences by examining how the effect of CDSs on
non-relationship lending varies with a borrower’s information opacity. We expect hedging
through CDSs and private information revealed by CDS spreads to be more valuable for lenders
when they lend to opaque firms. To measure a borrower’s information opacity, we rely on its
analyst coverage, which is helpful for lenders in assessing borrower creditworthiness (Güntay
and Hackbarth 2010; Mansi et al., 2011). Low Coverage is an indicator variable equal to of 1 if
the number of equity analyst following the borrower is below the sample median in a year of a
loan’s issuance and 0 otherwise. We augment model (1) with Low Coverage and the interaction
term POST × Low Coverage. As we report in Appendix B, Table B1, the coefficient on POST ×
Low Coverage is positive and significant for the lead arranger specifications, suggesting that the

20
effect of CDSs on the likelihood of a non-relationship lead arranger syndicating a loan is more
pronounced for opaque borrowers. Following CDS initiation, lead arrangers are 1.21 times more
likely to initiate a new lending relationship with opaque borrowers relative to more transparent
borrowers.7 However, the coefficient on POST × Low Coverage is positive but insignificant for
the participant specifications. This evidence suggests that, because lead arrangers perform the
primary screening and monitoring of the borrower, they are likely to incur higher adverse
selection costs when initiating a new relationship with an opaque firm.
4.2 Addressing Endogeneity Concerns
Although Model (1) includes firm and time fixed effects, we next employ a PSM approach
to further assuage endogeniety concerns associated with fundamental differences between CDS
and non-CDS firms. Following Martin and Roychowdhury (2015), we employ the following
CDS initiation model to construct a matched sample of CDS and non-CDS firms.
CDS Initiation = β0 + β1Rated + β2Investment Grade + β3Assets + β4Leverage
+ β5Profit Margin + β6Return Volatility + β7MTB + ε,
(2)
where CDS Initiation is an indicator variable equal to 1 for the year of CDS initiation and 0
otherwise. Rated, Investment Grade, Assets, and Leverage are as previously defined. Profit
Margin is net income divided by sales. Return Volatility is the standard deviation of the firms’
monthly stock return over the year. MTB is the market value divided by the book value of equity.
All variables are measured in the year before the year under consideration. We tabulate the
7 Although our findings with respect to the coefficient on the POST × Low Coverage interaction term are consistent
across Logit and OLS specifications, to further address the concern regarding the interpretation of interaction terms
in non-linear models, we apply Buis’ (2010) methodology. We continue to find positive and significant coefficient
on POST × Low Coverage (untabulated). We perform this robustness test for all other analyses that include
interaction terms in non-linear models. We find that the direction and economic significance of coefficients on
interaction terms remains the same as in non-linear model estimations that we tabulate.

21
estimation results of the first stage PSM model in Appendix B, Table B2, Panel A. In line with
prior studies (Martin and Roychowdhury 2015; Kim et al. 2017), we find that the probability of
CDS initiation is higher when a firm is rated, has an investment grade rating, and is larger. This
probability is lower when a firm is more profitable.
Using the propensity score (“predicted probability of CDS initiation”) estimated by the
first-stage PSM model (2), we construct the one-to-one matched PSM sample by selecting for
each CDS firm a non-CDS firm having the closest propensity score. The matched sample enables
us to employ a standard difference-in-difference research design, because we can assign a
pseudo-CDS initiation date to the matched non-CDS firms using the initiation date of the paired
CDS firms. We allow non-CDS firms to be matched to multiple CDS firms to improve covariate
balancing and retain sample size (e.g., Saretto and Tookes 2013). Our final sample contains 719
CDS firms and 395 matched non-CDS firms (referring to 161,831 lender-loan observations). We
tabulate the results of the covariate balancing analyses in Panel B of Table B2. These analyses
suggest that the PSM matched samples are well balanced across the covariates for most CDS
initiation determinants. The CDS firms are larger than matched non-CDS firms at the 10%
significance level, but, economically, the difference in firm size is relatively small, given the
absolute firm size of the matched CDS and non-CDS firms (mean assets for CDS (non-CDS)
firms are USD 4,447 million (USD 3,944 million).
Panel A of Table 3 presents the estimation results based on the PSM sample. We augment
model (1) with POST × CDS Traded interaction term, where CDS Traded is equal to 1 for CDS
firms and 0 for non-CDS firms (the CDS Traded indicator variable is subsumed by firm fixed
effects). The coefficient on POST × CDS Traded is a difference-in-differences estimator and is
expected to be positive. Consistently, we find that positive and significant coefficients on POST

22
× CDS Traded for both lead arranger and syndicate participant specifications, supporting our
main hypothesis that non-relationship lenders are more likely to extend loans to new borrowers
once CDSs become available. Economically, a lead arranger (participant) is 1.17 (1.13) times
more likely to initiate non-relationship lending following CDS initiation. To further examine the
robustness of our findings, we conduct PSM analysis for a short-window sample that limits
observations to three years before and after CDS initiation date (pseudo-initiation date for non-
CDS firms). The results presented in Panel B corroborate our prior findings: coefficients on
POST × CDS Traded are significantly positive in all specifications.
Overall, the results in Table 3 support our primary findings of a significant effect of CDSs
on non-relationship lending. In addition to addressing endogeneity concerns, these analyses also
mitigate concerns associated with the measurement of non-relationship lending for CDS and
non-CDS firms in our primary analyses. While for loans of CDS firm issued following CDS
initiation we measure lending relationship relative to the CDS initiation date, because this date
cannot be defined for non-CDS firms, we define non-relationship lending for these firms based
on whether a lender had a relationship with the firm before the current loan’s issuance date. By
assigning a pseudo-CDS initiation date to non-CDS firms, a standard difference-in-differences
approach allows us to measure non-relationship lending over the same period for each pair of
CDS and matched non-CDS firms.
In additional analyses, we address a concern that the onset of CDS trading itself may be
endogenous. Following prior literature, we use lenders’ foreign exchange (FX) derivative
position as an instrument for CDS trading (e.g., Saretto and Tookes 2013; Subrahmanyam et al.
2014; Shan et al. 2015; Amiram et al. 2017). Because banks that hedge one component of their
portfolio are more likely to hedge others (e.g., Minton et al. 2009), we expect banks that hedge

23
foreign exchange risk to also hedge credit risk via CDSs. Further, lenders’ FX derivatives
position is a macro, rather than a firm-specific, hedge (e.g., Saretto and Tookes 2013). Thus,
while related to a bank’s general propensity to hedge, the decision to hedge foreign exchange
should be exogenous to a decision to start a lending relationship with a particular borrower.
To construct the Forex instrument, we collect notional amounts of FX derivatives from
Call Reports filed by bank holding companies. For banks with available data, Forex is defined as
the ratio of notional amounts of FX derivatives to total assets. We augment CDS initiation model
(2) with Forex and present, in Appendix B, Table B3, the results of the second-stage IV
regression estimated simultaneously with the first-stage model (2). For both specifications, the
coefficients on Post are positive and significant. Although we cannot be certain that the Forex
instrument is truly exogenous, the results of IV tests confirm that lead arrangers and participants
are more likely to enter into a new lending relationship when CDSs are available on the
borrower’s debt.8
4.3 Borrower Cross-Selling Potential
In this section, we examine whether non-relationship lenders are more likely to pursue
borrowers with higher cross-selling potential once CDSs become available. These analyses will
help illuminate whether CDS-protected lenders pursue commercial aspects of the lending
relationship when they initiate a new relationship. Since lenders’ expectations about borrowers’
future business needs are not directly observable, we employ multiple measures of high cross-
selling potential to test our prediction.
Our first measure of cross-selling potential is based on the media coverage of borrowers’
8 Due to Stata computational limitations, we cannot estimate the second-stage IV regression simultaneously with the
first-stage model (2) when the second stage is estimated as the non-liner model with firm and year fixed effects or an
OLS model with firm and month-year fixed effects. Therefore, to perform IV tests, we estimate the second-stage
model as OLS with firm and year fixed effects.

24
business activities, as media is an important information source to non-relationship lenders
(Bushman et al. 2016). We consider media articles that cover topics such as “public offering,”
“merger,” “acquisition,” and “investment” to relate to cross-selling opportunities. We focus on
these topics because lenders benefit from cross-selling security underwriting and M&A advisory
services, and receive significant originating fees if they syndicate loans to finance future
investments of the borrower (e.g., Drucker and Puri 2005; Yasuda 2005; Ivashina and Kovner
2011; Fang et al. 2013; Euromoney 2014). Our discussions with loan officers at several banks
suggest that lenders continuously monitor information in the media to gather information about
borrowers’ projected business activities and recent events, as these events may also indicate
future business opportunities. Therefore, we consider media articles to be related to a borrower’s
cross-selling potential if they cover both past and expected borrower activities.
For each borrower in our sample, we obtain media articles from Ravenpack, which
covers all news disseminated via Dow Jones Newswires. We limit media data to full-size articles
with a relevance score of 75 and above. The relevance score is assigned by RavenPack to
indicate when the firm is strongly related to the underlying news story (the scores range from 0
(low relevance) to 100 (high relevance)). We identify articles as cross-selling related if their
news type, as assigned by Ravenpack, is public offering, merger, acquisition, or investment. We
define the High CS Potential-Media indicator variable as equal to 1 if media articles about a
borrower cover cross-selling related topics within three years before a loan’s issuance date and 0
otherwise. We then augment model (1) with High CS Potential-Media and the interaction term
POST × High CS Potential-Media. Panel A of Table 4 presents our findings (we restrict these
analyses to the post-2000 period because of Ravenpack’s data availability). Consistent with our
prediction that following CDS initiation lead arrangers are more likely to enter into a new

25
lending relationships if a borrower has higher cross-selling potential, we find the positive and
significant coefficient on POST × High CS Potential-Media for the arranger specifications.
Economically, non-relationship arrangers are 1.12 times more likely to syndicate loans to new
borrowers with media coverage of cross-selling opportunities relative to borrowers without such
coverage. The coefficient on POST × High CS Potential-Media is insignificant in participant
specifications. This finding is likely to be explained by lead arrangers being the primary
beneficiaries of cross-selling opportunities (e.g., Ivashina and Kovner 2011), as they maintain the
direct relationship with the borrower.
Because M&A is a major line of business for investment banks, which offers lucrative
business opportunities, such as M&A advisory and related financial services (Liaw 2011), our
second measure of cross-selling potential further addresses a borrower’s M&A activity.
Although our media-based cross-selling potential measure reflects publicly available information
about these deals, lenders’ may also have private information concerning a borrower’s future
M&A transactions. Because we cannot capture lender’s private information, we focus on actual
M&A deals that occurred after loan issuance.
We define the High CS Potential-M&A indicator variable to be equal to 1 if a borrower
engages in M&A deals within three years following a loan’s issuance date and 0 otherwise. We
then augment model (1) with High CS Potential-M&A and the interaction term POST × High CS
Potential-M&A. We report the results in Panel B of Table 5. Similar to our findings in Panel A,
the coefficient on POST × High CS Potential-M&A is positive and significant for the lead
arranger specifications. Economically, following CDS initiation, non-relationship lead arrangers
are 1.23 times more likely to issue loans to new borrowers with M&A business opportunities
relative to borrowers without such opportunities. We do not find that cross-selling potential

26
influences whether non-relationship syndicate participants join the syndicate.
Our third measure of high cross-selling potential is based on a borrower’s industry, as
certain industries offer unique business opportunities related to structured finance. In particular,
the aviation, ship building, oil, refinery and gas, and telecom industries offer banks such
opportunities, which have higher fees/margins and lower risk due to high asset collateralization
(Oliver Wyman 2006). Lenders also enjoy additional cross-selling benefits by selling to
borrowers in these industries related derivatives products, such as commodity derivatives
(especially for oil, gas, and natural resources), interest rate derivatives, and foreign currency
derivatives. We define the industry-based measure of cross-selling potential — the High CS
Potential-Industry indicator variable — to be equal to 1 if a borrower is in one of the listed
industries and 0 otherwise.9 As we report in Panel C of Table 4, the coefficient on the interaction
term POST × High CS Potential-Industry is positive and significant for the lead arranger
specifications, but is insignificant for the participant specifications (note that High CS Potential-
Industry indicator is subsumed by firm fixed effects). Following CDS initiation, lead arrangers
are 1.23 times more likely to start a new lending relationship with borrowers in industries with
high cross-selling opportunities relative to borrowers in other industries. These findings reinforce
our inference that, post CDS initiation, non-relationship lead arrangers are more likely to initiate
lending relationship with borrowers that offer high cross-selling opportunities.
Our fourth measure of cross-selling potential is based on borrowers’ use of derivative-
related products, which also provide lenders with lucrative cross-selling business (e.g., Oliver
Wyman 2006; Euromoney 2014). Derivative transactions offer high margins, as lenders charge
borrowers significant fees while entering into offsetting positions with other counterparties,
which are typically less expensive than what borrowers are charged. Furthermore, derivative
9 We report in Appendix B, Table B4, four-digit SIC codes we used to classify these industries.

27
positions translate into lower risk-weighted assets, as actual exposures are much smaller than the
notional amounts, allowing lenders to reserve less capital for these transactions (e.g., Neilson et
al. 2017). To proxy for borrower future derivative needs, we presume that borrowers with high
demand for derivatives products are likely to have more derivative-related words in their 10-K
filings. We define the High CS Potential-Derivatives variable to be equal to 1 if the ratio of
derivative-related word counts (e.g., “derivative,” “hedging”) to total words count in the 10-K
filing in the year preceding a loan’s issuance is greater (less) than the sample median and zero
otherwise. We find that the coefficient on POST × High CS Potential-Derivatives is positive and
significant for both lead arrangers and participant specifications. Post CDS initiation, lead
arrangers (participants) are 1.14 (1.12) times more likely to initiate lending relationships with
borrowers having higher demand for derivative products relative to other borrowers (Panel D).
Our final measure of cross-selling potential addresses the extent of a borrower’s foreign
operations. Foreign operations provide lenders with transaction banking opportunities (e.g., trade
finance) as well as related foreign currency hedging demand from borrowers. We measure the
extent of foreign operations by an indicator variable High CS Potential-Foreign, which is equal
to 1 if the ratio of a number of a borrower’s foreign operating segments to its total number of
operating segments in the year preceding a loan’s issuance is greater than the sample median and
zero otherwise. As we report in Panel E, the coefficient on POST × High CS Potential-Foreign is
positive and significant for all specifications. Following CDS initiation, lead arrangers
(participants) are 1.15 (1.08) times more likely to initiate a new lending relationship with
borrowers having more extensive foreign operations relative to other borrowers.
Overall, the results reported in Table 4 suggest that once CDSs become available lead
arrangers and syndicate participants focus more on pursuing new borrowers with high cross-

28
selling potential. Our findings also imply that, while lead arrangers are likely to be the primary
beneficiaries from cross-selling of security underwriting, M&A advisory, and structured finance
products, participants may also enjoy some cross-selling opportunities, such as derivative and
foreign operation transactions.
4.4 Lender Loan Growth and Profitability
We next examine our prediction that CDSs have a stronger effect on non-relationship
lenders that experience low loan growth, as CDSs offer lenders more flexible credit risk
management and alleviate capital constraints. We define an indicator variable Low Loan Growth
to be equal to 1 if the lender’s average loan growth over the three years before a loan’s issuance
is below the sample median and 0 otherwise. We augment model (1) with Low Loan Growth and
the interaction term POST × Low Loan Growth. We present our findings in Panel A of Table 5
(these analyses are restricted for lenders with data available from call reports). Consistent with
our predictions, the coefficient on POST × Low Loan Growth is positive and significant for both
lead arranger and participant subsamples. CDS-protected arrangers (participants) are 1.23 (1.29)
times more likely to initiate non-relationship lending when they experience lower loan growth.
We also expect lenders with low profitability to have stronger incentives to pursue new
borrowers once CDS hedging become available, because they may benefit from both additional
interest revenue and cross-selling fees. We define an indicator variable Low Profitability to be
equal to 1 if the lender’s average ROE over the three years before a loan’s issuance is below the
sample median and 0 otherwise. We augment model (1) with Low Profitability and the
interaction term POST × Low Profitability. As we report in Panel B of Table 5, the coefficient on
POST × Low Profitability is positive and significant for all specifications, in line with our
prediction. Following CDS initiation, lead arrangers (participants) are 1.52 (1.49) times more

29
likely to issue loans to new borrowers when they experience low profitability. Overall, the results
presented in Table 5 suggest that lenders’ low loan growth and profitability amplify the effect of
CDSs on initiating lending relationships for both lead arrangers and syndicate participants.
4.5 Lenders’ Monitoring Incentives
We next investigate how non-relationship lenders’ incentives to initiate new relationships
in the post CDS-initiation period affect their monitoring incentives. We focus here on the lead
arranger-borrower relationships since lead arrangers monitor borrowers on behalf of syndicate
participants. Because non-relationship arrangers are likely to protect their credit exposure via
CDS hedging, while pursuing commercial aspects of new lending relationships, we predict that,
following CDS initiation, they have lower monitoring incentives relative to relationship lenders.
4.5.1 Lead Arrangers’ Control Right
Because lenders retain stronger control rights when they are planning to intensively
monitor a borrower, following prior literature, we measure monitoring incentives by the strength
of lenders’ control rights (Roberts and Sufi 2009a, 2009b; Roberts 2015; Kim et al. 2017).
Performance (income statement-based) covenants act as tripwires and are used primarily to
allocate control rights to lenders when a borrower underperforms, while capital (balance sheet-
based) covenants address agency conflicts by aligning ex-ante incentives of a borrower and
lenders (Christensen and Nikolaev 2012; Christensen et al. 2016). Therefore, the higher (lower)
proportion of performance covenants should be associated with lenders’ stronger (weaker)
control rights. We define Performance Covenants as the ratio of the number of performance
covenants to the sum of performance and capital covenants in a loan contract.10
10 In line with Christensen and Nikolaev (2012), we classify cash interest coverage ratio, debt service coverage ratio,
level of EBITDA, fixed charge coverage ratio, interest coverage ratio, ratio of debt to EBITDA, and ratio of senior
debt to EBITDA covenants as performance covenants, while quick ratio, current ratio, debt to equity ratio, loan to

30
Roberts and Sufi (2009a) also suggest that performance pricing provisions affect lenders’
control rights, by influencing the allocation of bargaining power between a borrower and lenders
in ex post renegotiations. Performance pricing provisions define a pricing grid, which links a
loan’s interest rate to a borrower’s performance (Asquith et al. 2005), where the interest rate
increases (decreases) when a borrower’s performance deteriorates (improves). Because the
interest rate increasing provision typically imposes a sharp increase in the interest rate when
performance deteriorates, borrowers are incentivized to renegotiate the loan contract, thus
allocating control rights to lenders. We define Interest Increasing PP to be equal to 1 if a loan
contract contains the interest rate increasing performance pricing provisions and 0 otherwise. We
estimate Interest Increasing PP based on the largest loan facility in the package.
We estimate the following model to examine the effect of CDS initiation on non-
relationship lead arrangers’ control rights.11
Control Rights = β 0 + β1POST + β2No Relationship-Lead Arranger
+ β3POST × No Relationship-Lead Arranger +β4Assets + β5ROA
+ β6Loss + β7Leverage + β8Interest Coverage + β9Tangibility
+ β10Rated + β11Investment Grade + β12Amount + β13Maturity
+ β14Guarantor + β15PP + β16#Covenants + γFixed Effects + ε,
(3)
where Control Rights is either Performance Covenants or Interest Rate Increasing PP, as
defined above. No Relationship-Lead Arranger and all control variables are defined as
previously. If non-relationship lead arrangers retain weaker control rights post CDS initiation, we
expect a negative and significant coefficient on the interaction term POST × No Relationship-
value ratio, ratio of debt to tangible net worth, leverage ratio, senior leverage ratio, and net worth requirement
covenants as capital covenants. Financial covenants are identical to all loan facilities in the package. 11 If loan package has more than one lead arranger (6.5% of sample packages), all lead arrangers are accounted for in
estimating model (3). Our results are unchanged when we exclude these deals from the analyses.

31
Lead Arranger. For covenant specifications, we estimate model 3 as Tobit (OLS) with firm and
year (firm and year-month) fixed effects. For performance pricing specifications, we estimate
model 3 as Logit (OLS) with firm and year (firms and year-month) fixed effects.12
As we report in columns 1 and 2 of Panel A, Table 6, the coefficient on POST × No
Relationship-Lead Arranger is negative and significant in both specifications for Performance
Covenants, indicating that non-relationship lead arrangers impose a lower proportion of
performance covenants following CDS initiation relative to relationship lenders. Economically,
in the post-CDS initiation period, the proportion of performance covenants is 0.89 times lower
when non-relationship lead arrangers syndicate a loan relative to when a loan is syndicated by
relationship lead arrangers. We continue to find negative and significant coefficients on POST ×
No Relationship-Lead Arranger for Interest Rate Increasing PP specifications in column 3 and
4, suggesting that CDS-protected non-relationship lead arrangers are less likely to impose
provisions that would increase the interest rate if a borrower underperforms. In the post-CDS
initiation period, non-relationship lead arrangers are 0.87 times less likely to impose the interest
rate increasing performance provisions relative to relationship lead arrangers. To support the
robustness of these findings, in columns 5 and 6 of Panel A, we perform the analyses for the
weighted average Interest Rate Increasing PP variable for all facilities in the deal, where weights
are based on loan (facility) size. We find very similar results.
Note that, in contrast to the negative and significant coefficients on POST × No
Relationship-Lead Arranger, the coefficients on Post, which captures the effect of CDSs on
control rights of relationship lenders, are insignificant in all specifications. We infer that lead
arrangers that had a prior relationship with the borrower do not relinquish their control rights
12 We exclude #Covenants (PP) from the model when we examine performance covenants (interest increasing
provisions), as it is highly correlated with the dependent variable.

32
after CDS initiation. This evidence is also noteworthy, as it relates to prior studies showing that
following CDS initiation lenders retain weaker control rights (e.g., Shan et al. 2015; Chakraborty
et al. 2015). We show that this result is actually attributed to lenders that initiate new
relationships following CDS initiation.
In untabulated analyses, we re-estimate model (3) with covenant slack as the dependent
variable, as covenant tightness also determines lenders’ control rights (e.g., Dichev and Skinner
2002). Because financial ratios used in covenant definitions are adjusted extensively by lenders
(e.g., Dichev and Skinner 2002; Li 2016; Li et al. 2016), we focus on the debt-to-EBITDA
covenant, which slack can be measured reliably based on the DealScan data (e.g., Demerjian and
Owens 2016). This covenant is also the most frequently used for our sample loans. We measure
covenant tightness as the difference between a borrower’s debt-to-EBITDA ratio in the year
preceding the loan issuance measure minus the covenant threshold, divided by standard deviation
of the debt to EBITDA ratio over the previous 12 quarters (e.g., Dichev and Skinner 2002). We
find that, following CDS initiations, non-relationship lenders impose looser debt-to-EBITDA
covenants, as indicated by the positive and significant (albeit at the 10% level) coefficient on
POST × No Relationship-Lead Arranger. This evidence further suggests that lenders retain
weaker control rights when entering into new lending relationships following CDS initiation.
4.5.2 Lead Arrangers’ Share
Prior studies show that having more skin in the game incentivizes the lead arranger to
monitor a borrower more intensively (e.g., Sufi 2007; Ball et al. 2008; Ivashina 2009). Therefore,
we supplement the analyses of lenders’ control rights by investigating whether non-relationship
lead arrangers retain a lower loan share relative to relationship lenders following CDS initiation.
Following prior studies (Ball et al. 2008; Ivashina 2009; Amiram et al. 2017), we perform

33
these analyses for the largest loan facility in the package and define Lead Arranger Share as the
proportion of the loan retained by the arranger. We re-estimate model (3) with Lead Arranger
Share as the dependent variables and report the results in column 1 of Panel B. Consistent with
our predictions, we find negative and significant coefficients on POST × No Relationship-Lead
Arranger. Economically, in the post-CDS initiation period, lead arranger share is 0.92 times
lower when non-relationship lead arrangers syndicate a loan relative to when loan is syndicated
by relationship lead arrangers. To support the robustness of these findings, in column 2 of Panel
B, we perform the analyses for the weighted average Lead Arranger Share for all facilities in the
deal, where weights are based on loan (facility) size. We find that our results are unchanged.
The analyses presented in Panel B also have interesting implications with respect to
Amiram et al.’s (2017) finding that lead arrangers increase their loan share following CDS
initiation to compensate syndicate participants for the reduction in their monitoring incentives. In
contrast to the negative and significant coefficient on POST × No Relationship-Lead Arranger,
the coefficient on Post, which reflects the effect of CDSs on the loan share of relationship
lenders, is positive and significant. This evidence indicates that Amiram et al.’s findings are
attributed primarily to the increase in the skin in the game of lenders who had an established
relationship with the borrower before CDS initiation.
Overall, the findings presented in Table 6 suggest that non-relationship arrangers have
lower monitoring incentives relative to relationship arrangers after CDS initiation, consistent
with these lenders relying more on credit protection via CDSs and taking more commercial
perspective when initiating lending relationships once CDSs become available.
4.6 Resolving Agency Problems within the Loan Syndicate
The stronger negative influence of CDSs on monitoring incentives of non-relationship lead

34
arrangers is expected to worsen agency problems between these arrangers and syndicate
participants. Because agency problems are typically less severe when participants had a prior
lending relationship with the borrower, we predict that the effect of CDSs on the syndicate
participation of non-relationship lenders is weaker when the loan is syndicated by a non-
relationship arranger. To test this prediction, we augment model (1) with No Relationship-Lead
Arranger and the interaction term POST × No Relationship-Lead Arranger. If non-relationship
participants are less likely to join the syndicate in the post-CDS initiation period when the loan is
syndicated by non-relationship lead arrangers relative to when it is syndicated by relationship
lead arrangers, we expect negative and significant coefficient on POST × No Relationship-Lead
Arranger. We report supporting evidence in Table 7. Non-relationship participants are 0.85 times
less likely to join syndicates arranged by non-relationship lead arrangers. Coupled with the
positive and significant coefficient on Post, as in previous analyses, these findings indicate that,
while non-relationship lenders are more likely to join the syndicate once CDSs become available,
this effect is attenuated when a loan is syndicated by a non-relationship lead arranger.13
Agency problems within the syndicate can also be mitigated if participants have a prior
relationship with the lead arranger (e.g., Sufi 2007; Bushman et al. 2017). In untabulated
analyses, we examine whether participants familiar with the lead arranger are more likely to join
the syndicate when the lead arranger initiates a lending relationship following CDS initiation.
Although we do not find supporting evidence, this result is generally consistent with Sufi (2007),
who shows that, when agency problems are severe, previous lead arranger-participant
relationships are much less important than the previous relationships between the borrower and
the participant.
13 Note that the sum of the coefficients on POST and POST × No Relationship – Lead Arranger is positive and
significant, suggesting that, even when a loan is syndicated by a non-relationship lead arranger, the probability of
non-relationship participants joining the syndicate is higher in the post- relative to the pre-CDS initiation period.

35
4.7 Supplementary Analyses
We supplement our analyses with exploratory tests of the effect of CDSs on the interest
rate and size of loans syndicated by non-relationship lead arrangers. On the one hand, these
arrangers may bid aggressively for a loan by offering a low spread or more credit. On the other
hand, hedging loan exposure via CDSs is costly. If non-relationship arrangers charge a low
spread or have a high loan exposure, the new relationship may not be profitable enough to
pursue.
We re-estimate model (3) with Interest Spread as the dependent variable and report the
results in Table 8. Interest Spread is the interest rate spread on the largest loan facility in the
package. For robustness, we also perform the analyses for the weighted average Interest Spread
for all facilities in the deal, where weights are based on loan (facility) size. The coefficient on the
interaction term POST × No Relationship-Lead Arranger is insignificant in the interest spread
specifications, suggesting that non-relationship lenders do not charge a lower spread relative to
relationship lenders following CDS initiation.
We next re-estimate model (3) with Amount as the dependent variables, where Amount is
the natural logarithm of the loan amount of the largest facility in the loan deal. We also perform
analyses for the Deal Amount variable, measured by the natural logarithm of loan deal (package)
amount. Interestingly, the coefficient on POST × No Relationship-Lead Arranger is negative and
significant in both loan amount specifications. Economically, in the post-CDS initiation period,
the size of the largest loan (deal) size is 0.92 (0.93) times lower when a non-relationship lead
arranger syndicates a loan relative to when it is syndicated by a relationship lead arranger. This
evidence indicates that CDS-protected non-relationship lead arrangers have lower exposures to
new borrowers, which allows them to reduce hedging costs via CDSs. Given our findings of a

36
substantial influence of cross-selling potential on lead arrangers’ decisions to enter new
relationships, we infer that, although these lenders have a lower exposure to new borrowers to
reduce hedging costs, borrowers still provide them with opportunities to serve their additional
financial needs.14
5. Conclusion
We examine how the development of the CDS market affects lenders’ incentives to initiate
new lending relationships. Due to the information advantage of incumbent relationship lenders,
non-relationship lenders face adverse selection problems when competing for a loan deal, which
inhibits their relationship with new borrowers (Rajan 1992). We predict that an opportunity to
hedge against credit losses and revelation of private information through CDS spreads
significantly mitigate non-relationship lenders’ adverse selection concerns, increasing their
willingness to compete for loans for new borrowers. Consistent with our prediction, we find that
both lead arrangers and syndicate participants are more likely to initiate new relationships once
CDSs become available. Our findings also highlight the importance of a borrower’s cross-selling
potential in initiating new lending relationship. CDS-protected non-relationship lenders pursue
commercial aspects of lending relationships and are more likely to enter into a new relationship
if a borrower has high cross-selling potential. Furthermore, we show that lenders with low loan
growth or profitability are more likely to initiate new lending relationships, because CDSs offer
more flexible credit risk management and new relationships can boost profitability by generating
additional interest revenue and cross-selling fees. We further find that, relative to relationship
lead arrangers, non-relationship lead arrangers have lower monitoring incentives following CDS
initiation, consistent with them protecting their credit exposure via CDS hedging, while focusing
14 We acknowledge that lower deal size may result in lower loan origination fees for lead arrangers, but expect
cross-selling fess to be substantially higher than the decrease in origination fees.

37
on providing additional noncredit services to the borrower. Lastly, we show that the increase in
the likelihood of non-relationship participants joining the syndicate following CDS initiation is
attenuated if a loan is syndicated by a non-relationship lead arranger, which mitigates agency
problems within the syndicate exacerbated by the lower monitoring incentives of non-
relationship lead arrangers.
Our paper contributes to the growing literature on the influence of the CDS market on
private lending by exploring how CDSs affect the formation of new lending relationships and
lending strategies of non-relationship lenders. We further contribute to the expansive literature
on relationship lending by showing that CDS availability increases the willingness of non-
relationship lenders to compete for new borrowers and thus enhances the competition in the loan
market. By documenting that a borrower’s cross-selling potential significantly affects lenders’
decisions to enter new relationships, we also add to the growing literature on the importance of
noncredit business opportunities in private lending.

38
References
Acharya, V., and T. Johnson (2007). Insider trading in credit derivatives. Journal of Financial
Economics, 84 (1), 110–141.
Amiram, D., W. Beaver, W. Landsman, and J. Zhao (2016). The effects of cds trading initiation
on the structure of syndicated loans. Journal of Financial Economics, 126 (2), 364-382.
Ashcraft, A., and J. Santos (2009). Has the cds market lowered the cost of corporate debt?
Journal of Monetary Economics, 56 (4), 514–523.
Asquith, P., A. Beatty, and J. Weber (2005). Performance pricing in bank debt contracts. Journal
of Accounting and Economics, 40 (1), 101-128.
Ball, R., R. Bushman, and F. Vasvari (2008). The debt contracting value of accounting
information and loan syndicate structure. Journal of Accounting Research, 46 (2), 247-287.
Batta, G., J. Qiu, and F. Yu (2016). Credit derivatives and analyst behavior. The Accounting
Review, 91 (5), 1315–1343.
Berger, A., and G. Udell (1995). Relationship lending and lines of credit in small firm finance.
Journal of Business, 68 (3), 351–381.
Berlin, M., and L. Mester (1992). Debt covenants and renegotiation. Journal of Financial
Intermediation, 2 (2), 95–133.
Bertrand, M., and S. Mullainathan (2003). Enjoying the quiet life? Corporate governance and
managerial preferences. Journal of Political Economy, 111 (5), 1043-1075.
Bharath, S., S. Dahiya, A. Saunders, and A. Srinivasan (2009). Lending relationships and loan
contract terms. The Review of Financial Studies, 24 (4), 1141–1203.
Bolton, P., and M. Oehmke (2011). Credit default swaps and the empty creditor problem.
Review of Financial Studies, 24 (8), 2617–2655.
Boot, A. (2000). Relationship banking: What do we know? Journal of Financial Intermediation,
9 (1), 7-25.
Bradley, M., and M. Roberts (2015). The structure and pricing of corporate debt covenants. The
Quarterly Journal of Finance, 5 (02), 1550001.
Buis, M.L. (2010). Stata tip 87: Interpretation of interactions in non-linear models. The Stata
Journal, 10 (2), 305-308.
Bushman, R., C. Williams, and R. Wittenberg Moerman (2017). The informational role of the
media in private lending. Journal of Accounting Research 55 (1), 115-152.
Chakraborty, I., S. Chava, and R. Ganduri (2015). Credit default swaps and moral hazard in bank
lending, Working paper, Georgia Institute of Technology.
Champagne, C., and L. Kryzanowski (2007). Are current syndicated loan alliances related to past
alliances? Journal of Banking and Finance, 31 (10), 3145-3161.
Christensen, H., and V. Nikolaev (2012). Capital versus performance covenants in debt
contracts. Journal of Accounting Research, 50 (1), 75–116.
Christensen, H., V. Nikolaev, and R. Wittenberg Moerman (2016). Accounting information in
financial contracting: The incomplete contract theory perspective. Journal of Accounting
Research, 54 (2), 397–435.
Demerjian, P., and E. Owens (2016). Measuring the probability of financial covenant violation in
private debt contracts. Journal of Accounting and Economics, 61 (2), 433-447.

39
Diamond, D. (1991). Monitoring and reputation: The choice between bank loans and directly
placed debt. Journal of Political Economy 99 (4), 689–721.
Dichev, I., and D. Skinner (2002). Large–sample evidence on the debt covenant hypothesis.
Journal of Accounting Research, 40 (4), 1091-1123.
Drucker, S., and M. Puri (2005). On the benefits of concurrent lending and underwriting. The
Journal of Finance, 60 (6), 2763–2799.
Euromoney. (2014). Why no amount of cross-selling can make corporate lending profitable.
February 26.
Greene, W. (2004). The behaviour of the maximum likelihood estimator of limited dependent
variable models in the presence of fixed effects. The Econometrics Journal, 7 (1), 98-119.
Gntay, L., and D. Hackbarth (2010). Corporate bond credit spreads and forecast dispersion.
Journal of Banking & Finance, 34 (10), 2328–2345.
Fang, L., V. Ivashina and J. Lerner (2013). Combining banking with private equity investing.
The Review of Financial Studies, 26 (9), 2139-2173.
Financial Times, 2005, Banks warned about insider trading in credit derivatives, April 25.
Heider, F., and A. Ljungqvist (2015). As certain as debt and taxes: Estimating the tax sensitivity
of leverage from state tax changes. Journal of Financial Economics 118 (3), 684–712.
Holmstrom, B., and J. Tirole (1997). Financial intermediation, loanable funds, and the real
sector. The Quarterly Journal of Economics, 112 (3), 663–691.
Hu, H., and B. Black (2008). Debt, equity and hybrid decoupling: Governance and systemic risk
implications. European Financial Management, 14 (4), 663– 709.
ISDA (2013). Summaries of market survey results, Available at:
http://www.isda.org/statistics/recent.html
Ivashina, V. (2009). Asymmetric information effects on loan spreads. Journal of Financial
Economics, 92 (2), 300–319.
Ivashina, V., and A. Kovner (2011). The private equity advantage: Leveraged buyout firms and
relationship banking. The Review of Financial Studies, 24 (7), 2462–2498.
Ivashina, V., and Z. Sun (2011). Institutional stock trading on loan market information. Journal
of Financial Economics, 100 (2), 284-303.
Kim, J., P. Shroff, D. Vyas, and R. Wittenberg Moerman (2017). Credit default swaps and
managers’ voluntary disclosure, Journal of Accounting Research, forthcoming.
Lee, S., and D. Mullineaux (2004). Monitoring, financial distress, and the structure of
commercial lending syndicates. Financial Management, 33 (3), 107-130.
Liaw, K. (2011). The business of investment banking: a comprehensive overview, New Jersey:
Wiley, 2011. pp. 1-7.
Li, N. (2016). Performance measures in earnings‐based financial covenants in debt contracts.
Journal of Accounting Research, 54 (5), 1149-1186.
Li, N., F. Vasvari and R. Wittenberg-Moerman (2016). Dynamic threshold values in earnings-
based covenants. Journal of Accounting and Economics, 61 (2), 605-6
Maddala, G. (1987). Limited dependent variable models using panel data. Journal of Human
Resources, 22 (3), 307-338.
Mansi, S., W. Maxwell, and D. Miller (2011). Analyst forecast characteristics and the cost of

40
debt. Review of Accounting Studies, 16 (1), 116–142.
Martin, X. and S. Roychowdhury (2015). Do financial market developments influence
accounting practices? Credit default swaps and borrowers reporting conservatism. Journal
of Accounting and Economics, 59 (1), 80–104.
Minton, B., R. Stulz, and R. Williamson (2009). How much do banks use credit derivatives to
hedge loans? Journal of Financial Services Research, 35 (1), 1–31.
Morrison, A. (2005). Credit derivatives, disintermediation, and investment decisions. The
Journal of Business, 78 (2), 621–648.
Neilson, J., K. Wang, C. Williams and B. Xie, (2017). Offsetable derivative exposures and
financial stability. Working Paper. University of Michigan.
Oliver Wyman (2006). Get smart or get out: structured finance, Available at:
http://www.oliverwyman.com/.
Parlour, C., and A. Winton (2013). Laying off credit risk: Loan sales versus credit default
swaps. Journal of Financial Economics, 107 (1), 25–45.
Petersen, M., and R. Rajan (1994). The benefits of lending relationships: Evidence from small
business data. The Journal of Finance, 49 (1), 3–37.
Petersen, M., and R. Rajan (1995). The effect of credit market competition on lending
relationships. The Quarterly Journal of Economics, 110 (2), 407–443.
Qiu, J., and F. Yu (2012). Endogenous liquidity in credit derivatives. Journal of Financial
Economics, 103 (3), 611-631.
Rajan, R. (1992). Insiders and outsiders: The choice between informed and arm’s length debt.
The Journal of Finance, 47 (4), 1367–1400.
Roberts, M., and A. Sufi (2009a). Renegotiation of financial contracts: Evidence from private
credit agreements. Journal of Financial Economics, 93 (2), 159–184.
Roberts, M., and A. Sufi (2009b). Control rights and capital structure: An empirical
investigation. The Journal of Finance, 64 (4), 1657–1695.
Roberts, M. (2015). The role of dynamic renegotiation and asymmetric information in financial
contracting. Journal of Financial Economics, 116 (1), 61-81.
Sapienza, P. (2002). The effects of banking mergers on loan contracts. The Journal of Finance,
57, 329-367.
Saretto, A., and H. Tookes (2013). Corporate leverage, debt maturity, and credit supply: The
role of credit default swaps. Review of Financial Studies, 26 (5), 1190–1247.
Shan, S., D. Tang, and A. Winton (2015). Do credit derivatives lower the value of creditor
control rights? Evidence from debt covenants. Working paper, University of Minnesota.
Shan, S., D. Tang, and H. Yan (2016). Regulation-induced financial innovation: The case of
credit default swaps and bank capital. Working paper, Shanghai University of Finance and
Economics.
Shan, S., D. Tang, and H. Yan (2016). How does CDS trading affect bank lending relationships,
Working paper, Shanghai University of Finance and Economics.
Sharpe, S. (1990). Asymmetric information, bank lending, and implicit contracts: A stylized
model of customer relationships. The Journal of Finance, 45 (4), 1069–1087.
Sapienza, P. (2002). The effects of banking mergers on loan contracts. The Journal of Finance,

41
57 (1), 329-367.
Standard&Poor’s (2011). A guide to the loan market. Standard&Poor’s New York.
Streitz, D. (2015). The impact of credit default swap trading on loan syndication. Review of
Finance, 20 (1), 265–286.
Subrahmanyam, M., D. Tang, and S. Wang (2014). Does the tail wag the dog?: The effect of
credit default swaps on credit risk. The Review of Financial Studies, 27 (10), 2927–2960.
Sufi, A. (2007). Information asymmetry and financing arrangements: Evidence from syndicated
loans. The Journal of Finance, 62 (2), 629–668.
Valta, P. (2012). Competition and the cost of debt. Journal of Financial Economics, 105, 661-
682.
Yasuda, A. (2005). Do bank relationships affect the firm’s underwriter choice in the corporate
bond underwriting market? The Journal of Finance, 60 (3), 1259– 1292.
Zhao, J. (2017). The economics of bank cross-firm selling: The value of borrower board
connectedness and opacity, Working paper, The University of North Carolina at Chapel
Hill.

42
APPENDIX A
Variable Definitions
Variable Definition
Amount = The natural logarithm of loan amounts of the largest facility in the loan
package (DealScan).
Assets = The natural logarithm of total assets, measured in the year preceding a
loan’s issuance (Compustat).
CDS Initiation = An indicator variable equal to 1 for the year of CDS initiation and 0
otherwise (Markit).
Deal Amount = The natural logarithm of the package amount (DealScan).
Forex = The ratio of notional amounts of FX derivatives to the lenders’ total assets,
measured in the year preceding a loan’s issuance. (Call Report).
Guarantor = An indicator variable equal to 1 if the loan is guaranteed and 0 otherwise
(DealScan).
High-CS Potential-Derivatives = An indicator variable equal to 1 if the ratio of derivative-related word count
to total words count in the 10-K filing in the year preceding a loan’s
issuance is greater than the sample median and 0 otherwise (10-K).
High-CS Potential-Foreign = An indicator variable equal to 1 if the ratio of a number of a borrower’s
foreign operating segments to its total number of operating segments in the
year preceding a loan’s issuance is greater than the sample median and 0
otherwise (Compustat).
High-CS Potential-Industry = An indicator variable equal to 1 if a borrower is in aviation, ship building,
oil, refinery, gas, and telecommunication industries and 0 otherwise
(Compustat).
High-CS Potential-M&A = An indicator variable equal to 1 if a borrower engages in M&A deals within
three year after a loan’s issuance and 0 otherwise (SDC).
High-CS Potential-Media = An indicator variable equal to 1 if a media covers topics related to cross-
selling opportunities (e.g., Public Offering, Merger, Acquisition and
Investment) within three years before a loan’s issuance, and 0 otherwise
(RavenPack).
Interest Coverage = The ratio of earnings before interest and taxes to interest expense, measured
in the year preceding a loan’s issuance. (Compustat).
Interest Spread = The natural logarithm of the all-in-drawn spread of the largest facility in the
package (DealScan).
Interest Spread
(weighted average)
= The natural logarithm of the weighted average all-in-drawn spread for all
facilities in the deal, where weights are based on loan (facility) size
(DealScan).
Interest Rate Increase PP = An indicator variable equal to 1 if a loan contains an interest rate increasing
performance pricing provision and 0 otherwise (DealScan).
Investment Grade = An indicator variable equal to 1 if a firm has an investment grade rating in
the year prior to a loan’s issuance and 0 otherwise (Compustat, Mergent
FISD).
Last Loan = An indicator variable equal to 1 for the last loan issued prior to a borrower's
CDS initiation date and 0 otherwise (DealScan, Markit).
Lead Arranger Share = The proportion (%) of the loan retained by the lead arranger, measured for
the largest facility in the loan package (DealScan).

43
APPENDIX A (continued)
Variable Definition
Lead Arranger Share
(weighted average)
= The weighted average Lead Arranger Share variable for all facilities in the
deal, where weights are based on loan (facility) size (DealScan).
Leverage = The ratio of total liabilities to total assets, measured in the year preceding a
loan’s issuance. (Compustat).
Loss = An indicator variable equal to 1 if a borrower’s net income in the year
preceding a loan’s issuance is less than zero, and otherwise (Compustat).
Low Coverage = An indicator variable equal to 1 if the number of equity analyst following a
borrower in the year of a loan’s issuance is less than the sample median and
0 otherwise (I/B/E/S).
Low Loan Growth = An indicator variable equal to 1 if the lender's average loan growth over the
three-year period prior to a loan’s issuance is below the sample median and
0 otherwise (Call Report).
Low ROE = An indicator variable equal to 1 if the lender's average ROE over the three-
year period prior to a loan issuance is below the sample median and 0
otherwise (Call Report).
Maturity = The maturity of a loan in months (DealScan).
MTB = The market value divided by the book value of equity, measured in a year
prior to the year under consideration (Compustat).
No Relationship-Lead Arranger = For lead arrangers that syndicate loans to CDS firms following CDS
initiation: an indicator variable equal to 1 if the lead arranger has not
syndicated a borrower’s loans prior to the CDS initiation date and 0
otherwise. For lead arrangers that syndicate loans to CDS firms prior to
CDS initiation or to non-CDS firms: an indicator variable equal to 1 if the
lead arranger has not syndicated a borrower’s loans prior to the issuance
date of the loan under consideration and 0 otherwise (DealScan, Markit).
No Relationship-Participant = For syndicate participants in loans to CDS firms following CDS initiation:
an indicator variable equal to 1 if the participant has not participated in a
borrower’s loans prior to the CDS initiation date and 0 otherwise. For
syndicate participants in loans to CDS firms prior to CDS initiation or to
non-CDS firms: an indicator variable equal to 1 if the participant has not
participated in a borrower’s loans prior to the issuance date of the loan
under consideration and 0 otherwise (DealScan, Markit).
:Performance Covenants = The ratio of the number of performance covenants divided the sum of
performance and capital covenants in a loan contract (DealScan).
POST = An indicator variable equal to 1 if the loan is issued after the CDS trading
initiation date and 0 otherwise (Markit).
PP = An indicator variable equal to 1 if the loan has a performance pricing
provision and 0 otherwise (DealScan).
Profit Margin = The ratio of net income to sales, measured in a year prior to the year under
consideration (Compustat).
Rated = An indicator variable equal to 1 if a firm is rated by S&P or Moody's in the
year prior to a loan’s issuance and 0 otherwise (Compustat, Mergent FISD).
Return Volatility = The standard deviation of a firm’s monthly stock return, measured in a year
prior to the year under consideration (Compustat, CRSP).

44
APPENDIX A (continued)
Variable Definition
ROA = The ratio of net income to total assets (Compustat).
Tangibility = The ratio of property, plant and equipment to total assets (Compustat).
#Covenants = The total number of financial covenants (DealScan).

45
Appendix B
Additional Analyses
TABLE B1
Borrower Information Opacity
This table examines whether the effect of CDS trading on non-relationship lending is more pronounced for more
opaque borrowers. Column 1 and 2 (3 and 4) report the analysis for the lead arranger (participant) specifications.
Column 1 and 3 (2 and 4) present results using Logit (OLS) model. We include firm and year (year-month) fixed
effects in Logit (OLS) model. t-statistics in parenthesis are based on standard errors clustered by firm level. ***, **,
* indicates significance at the 0.01, 0.05, 0.10 level respectively. All other variables are defined in Appendix A.
No Relationship
- Lead Arranger
No Relationship
- Participant
(1) (2) (3) (4)
POST 0.534*** 0.092***
0.499*** 0.112***
(3.86) (3.57)
(6.84) (7.09)
Low Coverage -0.179** -0.035**
-0.055 -0.012
(-2.43) (-2.33)
(-0.88) (-0.94)
POST*Low Coverage 0.338** 0.079***
0.092 0.018
(2.30) (2.82)
(1.16) (1.06)
Model Logit OLS
Logit OLS
Controls Yes Yes
Yes Yes
Firm FE Yes Yes
Yes Yes
Year FE Yes No
Yes No
Year-Month FE No Yes
No Yes
Observations 24,582 27,196
175,677 177,815
Adj. (Pseudo) 𝑅2 0.029 0.181
0.015 0.145
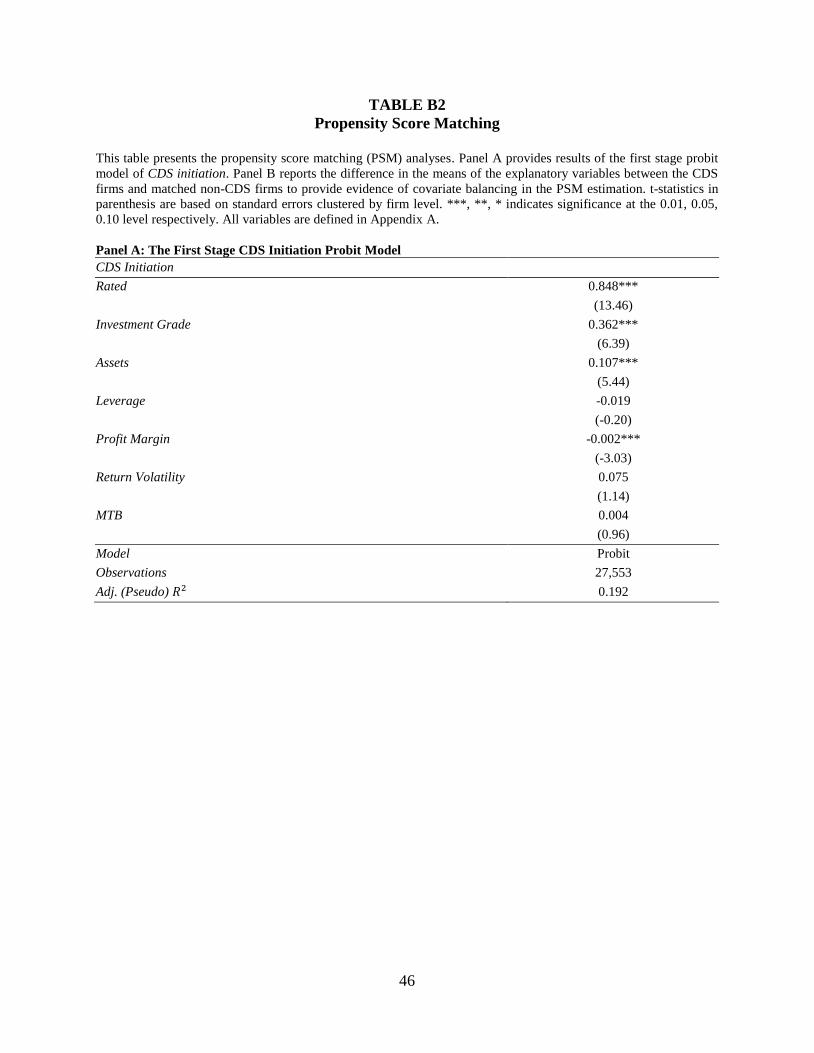
46
TABLE B2
Propensity Score Matching
This table presents the propensity score matching (PSM) analyses. Panel A provides results of the first stage probit
model of CDS initiation. Panel B reports the difference in the means of the explanatory variables between the CDS
firms and matched non-CDS firms to provide evidence of covariate balancing in the PSM estimation. t-statistics in
parenthesis are based on standard errors clustered by firm level. ***, **, * indicates significance at the 0.01, 0.05,
0.10 level respectively. All variables are defined in Appendix A.
Panel A: The First Stage CDS Initiation Probit Model
CDS Initiation
Rated 0.848***
(13.46)
Investment Grade 0.362***
(6.39)
Assets 0.107***
(5.44)
Leverage -0.019
(-0.20)
Profit Margin -0.002***
(-3.03)
Return Volatility 0.075
(1.14)
MTB 0.004
(0.96)
Model Probit
Observations 27,553
Adj. (Pseudo) 𝑅2 0.192

47
TABLE B2 (continued)
Propensity Score Matching
Panel B: Covariate Balancing
Means Difference in means
CDS firms non-CDS firms (t-stats)
Rated 0.910 0.901
0.009
(0.54)
Investment Grade 0.565 0.587
(0.022)
(-0.85)
Assets 8.407 8.283
0.124*
(1.77)
Leverage 0.647 0.651
(0.004)
(-0.41)
Profit Margin (1.446) (0.003)
(1.443)
(-0.98)
Return Volatility 0.043 0.041
0.002
(0.14)
MTB 3.020 3.090
(0.070)
(-0.30)
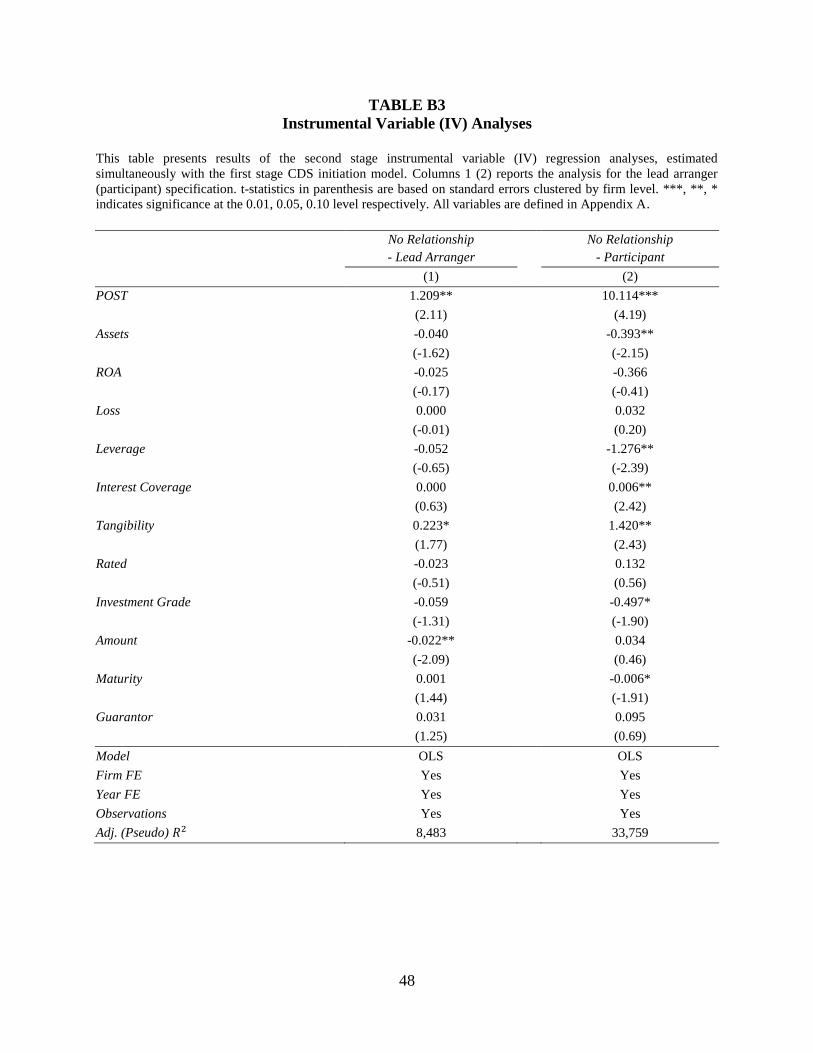
48
TABLE B3
Instrumental Variable (IV) Analyses
This table presents results of the second stage instrumental variable (IV) regression analyses, estimated
simultaneously with the first stage CDS initiation model. Columns 1 (2) reports the analysis for the lead arranger
(participant) specification. t-statistics in parenthesis are based on standard errors clustered by firm level. ***, **, *
indicates significance at the 0.01, 0.05, 0.10 level respectively. All variables are defined in Appendix A.
No Relationship
- Lead Arranger
No Relationship
- Participant
(1) (2)
POST 1.209**
10.114***
(2.11)
(4.19)
Assets -0.040
-0.393**
(-1.62)
(-2.15)
ROA -0.025
-0.366
(-0.17)
(-0.41)
Loss 0.000
0.032
(-0.01)
(0.20)
Leverage -0.052
-1.276**
(-0.65)
(-2.39)
Interest Coverage 0.000
0.006**
(0.63)
(2.42)
Tangibility 0.223*
1.420**
(1.77)
(2.43)
Rated -0.023
0.132
(-0.51)
(0.56)
Investment Grade -0.059
-0.497*
(-1.31)
(-1.90)
Amount -0.022**
0.034
(-2.09)
(0.46)
Maturity 0.001
-0.006*
(1.44)
(-1.91)
Guarantor 0.031
0.095
(1.25)
(0.69)
Model OLS
OLS
Firm FE Yes
Yes
Year FE Yes
Yes
Observations Yes
Yes
Adj. (Pseudo) 𝑅2 8,483
33,759

49
TABLE B4
High Cross-Selling Potential Industries
This table presents SIC codes of industries we classify as having high cross-selling potential.
Industry SIC code SIC Industry Name
Oil, Refinery and Gas
1311 CRUDE PETROLEUM & NATURAL GAS
1381 DRILLING OIL & GAS WELLS
1382 OIL & GAS FIELD EXPLORATION SERVICES
1389 OIL & GAS FIELD SERVICES, NEC
2911 PETROLEUM REFINING
4922 NATURAL GAS TRANSMISSION
4923 NATURAL GAS TRANSMISISON & DISTRIBUTION
4924 NATURAL GAS DISTRIBUTION
Aviation
3720 AIRCRAFT & PARTS
3721 AIRCRAFT
3724 AIRCRAFT ENGINES & ENGINE PARTS
3728 AIRCRAFT PARTS & AUXILIARY EQUIPMENT, NEC
4512 AIR TRANSPORTATION, SCHEDULED
4522 AIR TRANSPORTATION, NONSCHEDULED
Telecommunication 4813 TELEPHONE COMMUNICATIONS
Ship building 3730 SHIP & BOAT BUILDING & REPAIRING

50
TABLE 1
Descriptive Statistics
This table provides descriptive statistics for the lead arranger and participant samples. All variables are defined in
Appendix A.
Lead Arranger Sample Participant Sample
N Mean Median SD
N Mean Median SD
No Relationship 27,457 0.38 0.00 0.49
177,936 0.44 0.00 0.50
Assets 27,457 7.79 7.70 2.06
177,936 8.28 8.20 1.69
ROA 27,457 0.03 0.04 0.09
177,936 0.03 0.04 0.07
Loss 27,457 0.21 0.00 0.41
177,936 0.16 0.00 0.37
Leverage 27,457 0.64 0.63 0.23
177,936 0.66 0.65 0.21
Interest Coverage 27,457 11.02 3.55 26.81
177,936 9.65 3.79 22.36
Tangibility 27,457 0.60 0.56 0.40
177,936 0.59 0.55 0.40
Rated 27,457 0.58 0.00 0.49
177,936 0.72 1.00 0.45
Investment Grade 27,457 0.33 1.00 0.47
177,936 0.42 1.00 0.49
Amount 27,457 19.47 0.00 1.54
177,936 20.06 0.00 1.14
Maturity 27,457 46.69 19.52 25.65
177,936 48.33 20.03 23.40
Guarantor 27,457 0.10 55.00 0.30
177,936 0.11 60.00 0.31
PP 27,457 0.42 1.00 0.49
177,936 0.57 1.00 0.50
#Covenants 27,457 1.14 0.00 1.31
177,936 1.38 0.00 1.32

51
TABLE 2
The Effect of CDS trading on Non-Relationship Lending
This table examines the effect of CDSs on non-relationship lending. Panel A reports results of the primary tests.
Panel B reports results of the analysis that investigates whether the parallel trend assumption holds for our tests.
Panel C reports results for the short-window analysis, where observations of CDS firms are limited to 3 years before
and after CDS initiation. Columns 1 and 2 (3 and 4) report the analysis for the lead arranger (participant)
specifications. Columns 1 and 3 (2 and 4) present results using Logit (OLS) model. We include firm and year (year-
month) fixed effects in the Logit (OLS) model. t-statistics in parenthesis are based on standard errors clustered by
firm level. ***, **, * indicates significance at the 0.01, 0.05, 0.10 level respectively. All variables are defined in
Appendix A.
Panel A: Primary tests
No Relationship
- Lead Arranger
No Relationship
- Participant
(1) (2) (3) (4)
POST 0.778*** 0.149***
0.563*** 0.125***
(8.12) (8.46)
(10.79) (11.39)
Assets 0.011 0.003
-0.180*** -0.037***
(0.22) (0.31)
(-4.98) (-4.94)
ROA -0.053 -0.002
0.049 0.007
(-0.16) (-0.03)
(0.17) (0.11)
Loss 0.077 0.021
0.016 0.002
(1.19) (1.58)
(0.31) (0.21)
Leverage -0.263* -0.054*
-0.206* -0.039
(-1.81) (-1.87)
(-1.70) (-1.50)
Interest Coverage 0.000 0.000
0.001* 0.000**
(-0.24) (-0.37)
(1.86) (2.00)
Tangibility 0.505*** 0.103***
0.019 0.009
(3.02) (3.18)
(0.17) (0.38)
Rated -0.014 0.000
0.032 0.006
(-0.18) (0.01)
(0.53) (0.47)
Investment Grade 0.023 0.007
-0.128** -0.027**
(0.24) (0.39)
(-2.37) (-2.37)
Amount -0.157*** -0.033***
0.041* 0.008*
(-5.42) (-5.92)
(1.81) (1.69)
Maturity 0.008*** 0.002***
0.010*** 0.002***
(8.10) (8.80)
(14.12) (14.40)
Guarantor 0.230*** 0.047***
0.243*** 0.052***
(3.29) (3.40)
(5.12) (5.19)
Model Logit OLS
Logit OLS
Firm FE Yes Yes
Yes Yes
Year FE Yes No
Yes No
Year-Month FE No Yes
No Yes
Observations 24,582 27,196
175,677 177,815
Adj. (Pseudo) 𝑅2 0.029 0.181
0.015 0.145
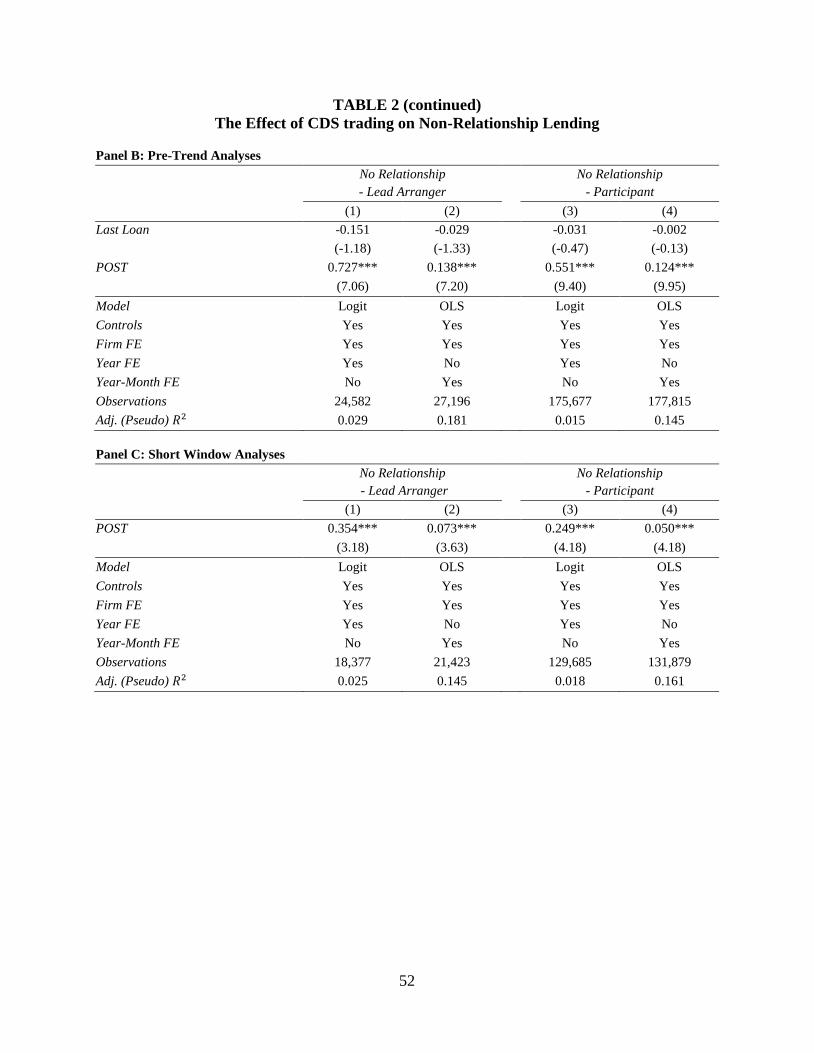
52
TABLE 2 (continued)
The Effect of CDS trading on Non-Relationship Lending
Panel B: Pre-Trend Analyses
No Relationship
- Lead Arranger
No Relationship
- Participant
(1) (2) (3) (4)
Last Loan -0.151 -0.029
-0.031 -0.002
(-1.18) (-1.33)
(-0.47) (-0.13)
POST 0.727*** 0.138***
0.551*** 0.124***
(7.06) (7.20)
(9.40) (9.95)
Model Logit OLS
Logit OLS
Controls Yes Yes
Yes Yes
Firm FE Yes Yes
Yes Yes
Year FE Yes No
Yes No
Year-Month FE No Yes
No Yes
Observations 24,582 27,196
175,677 177,815
Adj. (Pseudo) 𝑅2 0.029 0.181 0.015 0.145
Panel C: Short Window Analyses
No Relationship
- Lead Arranger
No Relationship
- Participant
(1) (2) (3) (4)
POST 0.354*** 0.073***
0.249*** 0.050***
(3.18) (3.63)
(4.18) (4.18)
Model Logit OLS
Logit OLS
Controls Yes Yes
Yes Yes
Firm FE Yes Yes
Yes Yes
Year FE Yes No
Yes No
Year-Month FE No Yes
No Yes
Observations 18,377 21,423
129,685 131,879
Adj. (Pseudo) 𝑅2 0.025 0.145 0.018 0.161
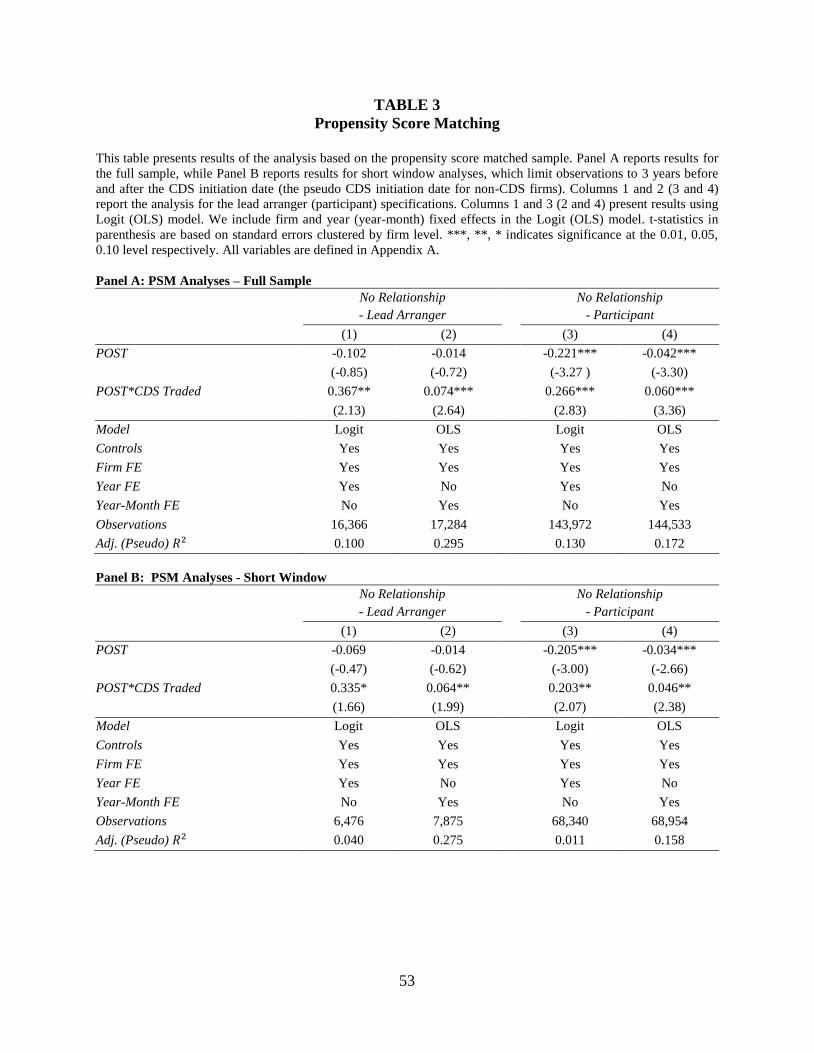
53
TABLE 3
Propensity Score Matching
This table presents results of the analysis based on the propensity score matched sample. Panel A reports results for
the full sample, while Panel B reports results for short window analyses, which limit observations to 3 years before
and after the CDS initiation date (the pseudo CDS initiation date for non-CDS firms). Columns 1 and 2 (3 and 4)
report the analysis for the lead arranger (participant) specifications. Columns 1 and 3 (2 and 4) present results using
Logit (OLS) model. We include firm and year (year-month) fixed effects in the Logit (OLS) model. t-statistics in
parenthesis are based on standard errors clustered by firm level. ***, **, * indicates significance at the 0.01, 0.05,
0.10 level respectively. All variables are defined in Appendix A.
Panel A: PSM Analyses – Full Sample
No Relationship
- Lead Arranger
No Relationship
- Participant
(1) (2) (3) (4)
POST -0.102 -0.014
-0.221*** -0.042***
(-0.85) (-0.72)
(-3.27 ) (-3.30)
POST*CDS Traded 0.367** 0.074***
0.266*** 0.060***
(2.13) (2.64)
(2.83) (3.36)
Model Logit OLS
Logit OLS
Controls Yes Yes
Yes Yes
Firm FE Yes Yes
Yes Yes
Year FE Yes No
Yes No
Year-Month FE No Yes
No Yes
Observations 16,366 17,284
143,972 144,533
Adj. (Pseudo) 𝑅2 0.100 0.295
0.130 0.172
Panel B: PSM Analyses - Short Window
No Relationship
- Lead Arranger
No Relationship
- Participant
(1) (2) (3) (4)
POST -0.069 -0.014
-0.205*** -0.034***
(-0.47) (-0.62)
(-3.00) (-2.66)
POST*CDS Traded 0.335* 0.064**
0.203** 0.046**
(1.66) (1.99)
(2.07) (2.38)
Model Logit OLS
Logit OLS
Controls Yes Yes
Yes Yes
Firm FE Yes Yes
Yes Yes
Year FE Yes No
Yes No
Year-Month FE No Yes
No Yes
Observations 6,476 7,875
68,340 68,954
Adj. (Pseudo) 𝑅2 0.040 0.275
0.011 0.158
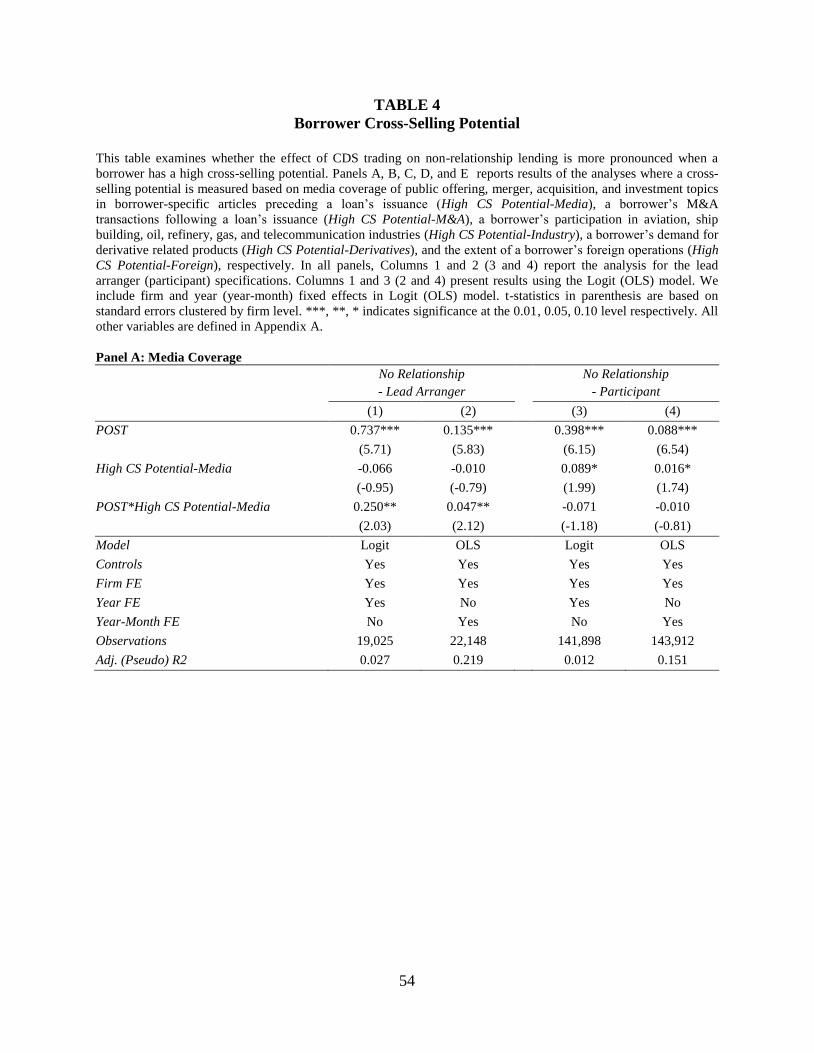
54
TABLE 4
Borrower Cross-Selling Potential
This table examines whether the effect of CDS trading on non-relationship lending is more pronounced when a
borrower has a high cross-selling potential. Panels A, B, C, D, and E reports results of the analyses where a cross-
selling potential is measured based on media coverage of public offering, merger, acquisition, and investment topics
in borrower-specific articles preceding a loan’s issuance (High CS Potential-Media), a borrower’s M&A
transactions following a loan’s issuance (High CS Potential-M&A), a borrower’s participation in aviation, ship
building, oil, refinery, gas, and telecommunication industries (High CS Potential-Industry), a borrower’s demand for
derivative related products (High CS Potential-Derivatives), and the extent of a borrower’s foreign operations (High
CS Potential-Foreign), respectively. In all panels, Columns 1 and 2 (3 and 4) report the analysis for the lead
arranger (participant) specifications. Columns 1 and 3 (2 and 4) present results using the Logit (OLS) model. We
include firm and year (year-month) fixed effects in Logit (OLS) model. t-statistics in parenthesis are based on
standard errors clustered by firm level. ***, **, * indicates significance at the 0.01, 0.05, 0.10 level respectively. All
other variables are defined in Appendix A.
Panel A: Media Coverage
No Relationship
- Lead Arranger
No Relationship
- Participant
(1) (2) (3) (4)
POST 0.737*** 0.135***
0.398*** 0.088***
(5.71) (5.83)
(6.15) (6.54)
High CS Potential-Media -0.066 -0.010
0.089* 0.016*
(-0.95) (-0.79)
(1.99) (1.74)
POST*High CS Potential-Media 0.250** 0.047**
-0.071 -0.010
(2.03) (2.12)
(-1.18) (-0.81)
Model Logit OLS
Logit OLS
Controls Yes Yes
Yes Yes
Firm FE Yes Yes
Yes Yes
Year FE Yes No
Yes No
Year-Month FE No Yes
No Yes
Observations 19,025 22,148
141,898 143,912
Adj. (Pseudo) R2 0.027 0.219
0.012 0.151

55
TABLE 4 (continued)
Borrower Cross-Selling Potential
Panel B: Mergers and Acquisitions
No Relationship
- Lead Arranger
No Relationship
- Participant
(1) (2) (3) (4)
POST 0.756*** 0.145***
0.572*** 0.127***
(7.84) (8.16)
(10.94) (11.52)
High CS Potential-M&A -0.152 -0.025
0.118 0.025
(-1.38) (-1.31)
(1.56) (1.64)
POST* High CS Potential-M&A 0.489** 0.087**
-0.142 -0.034
(2.13) (2.10)
(-1.03) (-1.13)
Model Logit OLS
Logit OLS
Controls Yes Yes
Yes Yes
Firm FE Yes Yes
Yes Yes
Year FE Yes No
Yes No
Year-Month FE No Yes
No Yes
Observations 24,582 27,196
175,677 177,815
Adj. (Pseudo) 𝑅2 0.029 0.181
0.015 0.145
Panel C: Industry Types
No Relationship
- Lead Arranger
No Relationship
- Participant
(1) (2) (3) (4)
POST 0.706*** 0.136***
0.538*** 0.119***
(7.10) (7.34)
(9.83) (10.42)
POST*High CS Potential-Industry 0.520** 0.089**
0.173 0.042
(2.11) (2.03)
(1.37) (1.51)
Model Logit OLS
Logit OLS
Controls Yes Yes
Yes Yes
Firm FE Yes Yes
Yes Yes
Year FE Yes No
Yes No
Year-Month FE No Yes
No Yes
Observations 24,582 27,196
175,677 177,815
Adj. (Pseudo) 𝑅2 0.029 0.181
0.015 0.145

56
TABLE 4 (continued)
Borrower Cross-Selling Potential
Panel D: Derivative Transactions
No Relationship
- Lead Arranger
No Relationship
- Participant
(1) (2) (3) (4)
POST 0.597*** 0.115***
0.395*** 0.089***
(4.81) (4.94)
(5.73) (6.02)
High CS Potential-Derivatives -0.027 -0.006
-0.014 -0.004
(-0.45) (-0.50)
(-0.34) (-0.43)
POST*High CS Potential-Derivatives 0.298** 0.055**
0.253*** 0.054***
(2.38) (2.31)
(3.78) (3.75)
Model Logit OLS
Logit OLS
Controls Yes Yes
Yes Yes
Firm FE Yes Yes
Yes Yes
Year FE Yes No
Yes No
Year-Month FE No Yes
No Yes
Observations 24,582 27,196
175,677 177,815
Adj. (Pseudo) 𝑅2 0.029 0.181
0.015 0.145
Panel E: Foreign Operations
No Relationship
- Lead Arranger
No Relationship
- Participant
(1) (2) (3) (4)
POST 0.667*** 0.128***
0.512*** 0.114***
(6.21) (6.29)
(9.17) (9.55)
High CS Potential-Foreign -0.107 -0.025*
-0.045 -0.009
(-1.46) (-1.77)
(-0.91) (-0.88)
POST*High CS Potential-Foreign 0.295** 0.056**
0.153** 0.034**
(2.07) (2.12)
(2.01) (2.09)
Model Logit OLS
Logit OLS
Controls Yes Yes
Yes Yes
Firm FE Yes Yes
Yes Yes
Year FE Yes No
Yes No
Year-Month FE No Yes
No Yes
Observations 24,582 27,196
175,677 177,815
Adj. (Pseudo) 𝑅2 0.029 0.181
0.015 0.145
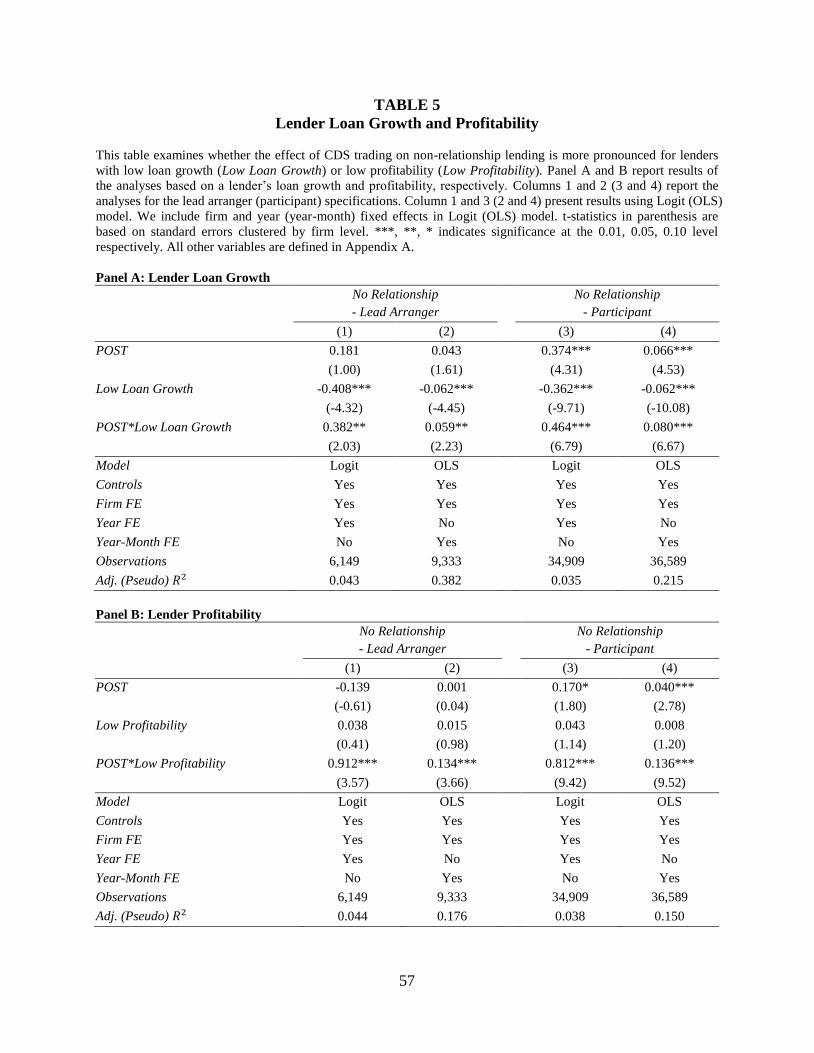
57
TABLE 5
Lender Loan Growth and Profitability
This table examines whether the effect of CDS trading on non-relationship lending is more pronounced for lenders
with low loan growth (Low Loan Growth) or low profitability (Low Profitability). Panel A and B report results of
the analyses based on a lender’s loan growth and profitability, respectively. Columns 1 and 2 (3 and 4) report the
analyses for the lead arranger (participant) specifications. Column 1 and 3 (2 and 4) present results using Logit (OLS)
model. We include firm and year (year-month) fixed effects in Logit (OLS) model. t-statistics in parenthesis are
based on standard errors clustered by firm level. ***, **, * indicates significance at the 0.01, 0.05, 0.10 level
respectively. All other variables are defined in Appendix A.
Panel A: Lender Loan Growth
No Relationship
- Lead Arranger
No Relationship
- Participant
(1) (2) (3) (4)
POST 0.181 0.043
0.374*** 0.066***
(1.00) (1.61)
(4.31) (4.53)
Low Loan Growth -0.408*** -0.062***
-0.362*** -0.062***
(-4.32) (-4.45)
(-9.71) (-10.08)
POST*Low Loan Growth 0.382** 0.059**
0.464*** 0.080***
(2.03) (2.23)
(6.79) (6.67)
Model Logit OLS
Logit OLS
Controls Yes Yes
Yes Yes
Firm FE Yes Yes
Yes Yes
Year FE Yes No
Yes No
Year-Month FE No Yes
No Yes
Observations 6,149 9,333
34,909 36,589
Adj. (Pseudo) 𝑅2 0.043 0.382
0.035 0.215
Panel B: Lender Profitability
No Relationship
- Lead Arranger
No Relationship
- Participant
(1) (2) (3) (4)
POST -0.139 0.001
0.170* 0.040***
(-0.61) (0.04)
(1.80) (2.78)
Low Profitability 0.038 0.015
0.043 0.008
(0.41) (0.98)
(1.14) (1.20)
POST*Low Profitability 0.912*** 0.134***
0.812*** 0.136***
(3.57) (3.66)
(9.42) (9.52)
Model Logit OLS
Logit OLS
Controls Yes Yes
Yes Yes
Firm FE Yes Yes
Yes Yes
Year FE Yes No
Yes No
Year-Month FE No Yes
No Yes
Observations 6,149 9,333
34,909 36,589
Adj. (Pseudo) 𝑅2 0.044 0.176
0.038 0.150

58
TABLE 6
Non-Relationship Lenders’ Monitoring Incentives
This table presents results of the analyses that examine non-relationship lead arrangers’ monitoring incentives
following CDS initiation. In Panel A, we measure monitoring incentives by the strength of lenders’ control rights,
where in columns (1) and (2) we examine the proportion of performance covenants in total of performance and
capital covenants (Performance Covenants) and in columns (3) - (6) the existence of the interest rate increasing
pricing provision (Interest Rate Increasing PP). In Panel B, we measure monitoring incentives by the share retained
by the lead arranger (Lead Arranger Share). We include firm and year (year-month) fixed effects in Logit and Tobit
(OLS) models. t-statistics in parenthesis are based on standard errors clustered by firm level. ***, **, * indicates
significance at the 0.01, 0.05, 0.10 level respectively. All variables are defined in Appendix A.

59
TABLE 6 (continued)
Non-Relationship Lenders’ Monitoring Incentives
Panel A: Lead Arrangers' Control Rights
Performance Covenants Interest Rate Increasing PP
Interest Rate Increasing PP
(weighted average)
(1) (2) (3) (4) (5) (6)
POST 0.081* -0.009
0.091 0.015
0.050 0.013
(1.88) (-0.65)
(0.82) (0.89)
(0.45) (0.81)
No Relationship -0.004 -0.003
0.008 0.000
0.052 0.002
- Lead Arranger (-0.16) (-0.49)
(0.15) (-0.07)
(0.99) (0.33)
POST*No Relationship -0.263*** -0.041***
-0.251** -0.039**
-0.238** -0.039**
- Lead Arranger (-4.98) (-2.98)
(-2.16) (-2.37)
(-2.06) (-2.42)
Assets -0.280*** -0.014*
-0.135** -0.015*
-0.114* -0.014
(-19.76) (-1.94)
(-2.13) (-1.72)
(-1.80) (-1.64)
ROA -0.077 -0.028
-0.767 -0.055
-0.581 -0.047
(-0.46) (-0.53)
(-1.53) (-0.82)
(-1.15) (-0.71)
Loss 0.163*** 0.026**
-0.258*** -0.030**
-0.251*** -0.031***
(4.67) (2.30)
(-2.93) (-2.45)
(-2.88) (-2.59)
Leverage 0.361*** 0.034
-1.502*** -0.173***
-1.474*** -0.172***
(6.13) (1.38)
(-7.01) (-6.37)
(-6.98) (-6.42)
Interest Coverage 0.002*** 0.000*
-0.001 0.000
-0.001 0.000
(5.17) (1.88)
(-0.80) (-0.75)
(-0.56) (-0.62)
Tangibility -0.351*** -0.007
0.030 -0.003
0.102 0.001
(-8.88) (-0.29)
(0.16) (-0.10)
(0.54) (0.04)
Rated 0.221*** 0.008
0.092 0.020
0.044 0.018
(6.48) (0.66)
(0.84) (1.28)
(0.41) (1.21)
Investment Grade -0.438*** -0.031**
0.415*** 0.072***
0.403*** 0.069***
(-10.80) (-2.04)
(3.99) (4.09)
(3.88) (4.02)
Amount 0.115*** 0.022***
0.448*** 0.056***
0.495*** 0.056***
(8.76) (5.54)
(11.36) (12.05)
(12.17) (12.38)
Maturity 0.004*** 0.001***
0.002 0.000
0.002 0.000
(8.15) (4.37)
(0.90) (1.63)
(1.13) (1.37)
Guarantor 0.681*** 0.158***
0.382*** 0.056***
0.414*** 0.056***
(19.47) (11.64)
(4.35) (4.01)
(4.74) (4.13)
PP 1.388*** 0.310***
(54.22) (36.74)
#Covenants
0.740*** 0.109***
0.768*** 0.109***
(27.11) (30.32)
(28.44) (31.00)
Model Tobit OLS
Logit OLS
Logit OLS
Firm FE Yes Yes
Yes Yes
Yes Yes
Year FE Yes No
Yes No
Yes No
Year-Month FE No Yes
No Yes
No Yes
Observations 27,457 27,196
20,819 27,196
21,159 27,196
Adj. (Pseudo) 𝑅2 N/A 0.517
0.164 0.298
0.180 0.307

60
TABLE 6 (continued)
Non-Relationship Lenders’ Monitoring Incentives
Panel B: Lead Arrangers’ “skin in the game”
Lead Arranger Share
Lead Arranger Share
(weighted average)
(1) (2)
POST 3.449***
5.018***
(3.63)
(5.26)
No Relationship 3.784***
2.871***
- Lead Arranger (6.59)
(4.51)
POST*No Relationship -3.334***
-3.532***
- Lead Arranger (-2.96)
(-3.29)
Assets -2.103***
-1.882**
(-3.12)
(-2.58)
ROA 1.359
0.880
(0.22)
(0.13)
Loss 3.246***
2.552**
(3.47)
(2.49)
Leverage 0.169
1.122
(0.06)
(0.40)
Interest Coverage 0.024*
0.033**
(1.72)
(2.06)
Tangibility -1.374
-1.880
(-0.64)
(-0.86)
Rated 0.884
2.337*
(0.71)
(1.86)
Investment Grade 0.862
1.977*
(0.77)
(1.79)
Amount -10.094***
-9.967***
(-19.08)
(-16.10)
Maturity -0.098***
-0.096***
(-6.20)
(-5.76)
Guarantor 1.128
0.760
(1.28)
(0.84)
PP -6.405***
-5.318***
(-8.29)
(-6.35)
#Covenants -0.230
-0.841**
(-0.67)
(-2.22)
Model OLS
OLS
Firm FE Yes
Yes
Year FE No
No
Year-Month FE Yes
Yes
Observations 8,398
8,398
Adj. (Pseudo) R^2 0.718
0.659
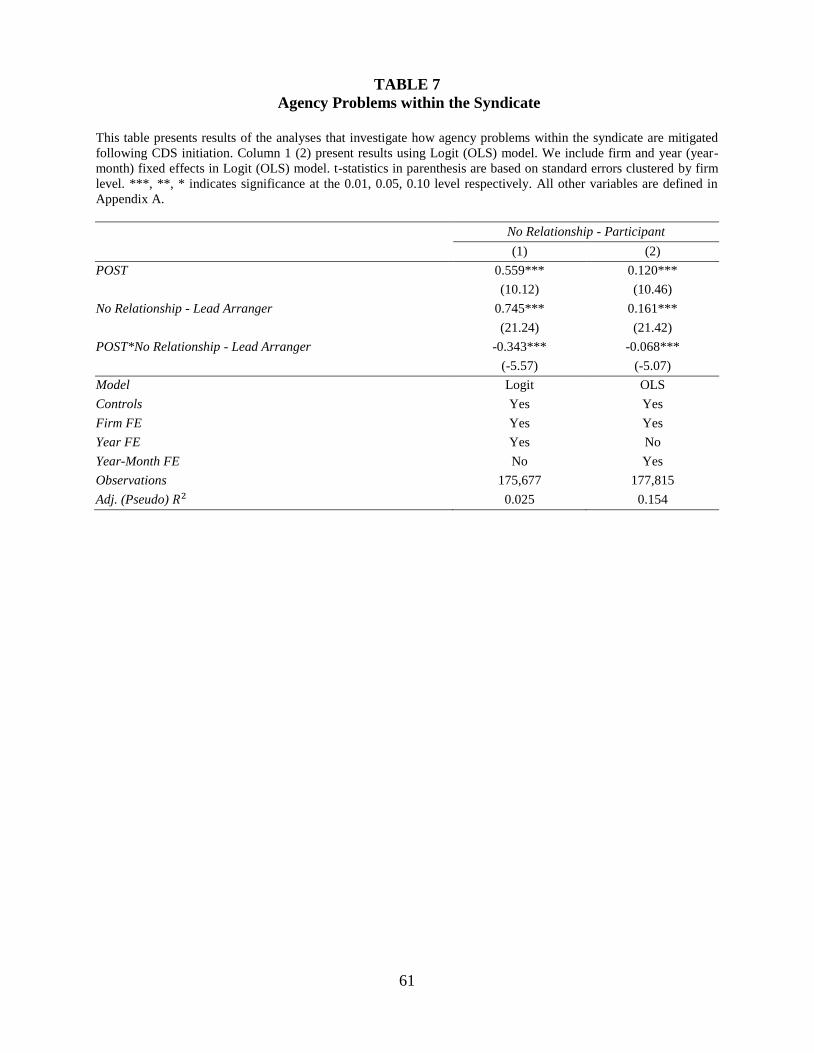
61
TABLE 7
Agency Problems within the Syndicate
This table presents results of the analyses that investigate how agency problems within the syndicate are mitigated
following CDS initiation. Column 1 (2) present results using Logit (OLS) model. We include firm and year (year-
month) fixed effects in Logit (OLS) model. t-statistics in parenthesis are based on standard errors clustered by firm
level. ***, **, * indicates significance at the 0.01, 0.05, 0.10 level respectively. All other variables are defined in
Appendix A.
No Relationship - Participant
(1) (2)
POST 0.559*** 0.120***
(10.12) (10.46)
No Relationship - Lead Arranger 0.745*** 0.161***
(21.24) (21.42)
POST*No Relationship - Lead Arranger -0.343*** -0.068***
(-5.57) (-5.07)
Model Logit OLS
Controls Yes Yes
Firm FE Yes Yes
Year FE Yes No
Year-Month FE No Yes
Observations 175,677 177,815
Adj. (Pseudo) 𝑅2 0.025 0.154

62
TABLE 8
Supplementary Analyses
This table presents results of the analyses that examine the effect of CDSs on the interest spread and size of loans
syndicated by non-relationship lead arrangers. In Column (1) and (2), we examine the interest spread (Interest
Spread) and in column (3) and (4), we examine the size of a loan (Amount, Deal Amount). Analyses include firm
and year-month fixed effects. t-statistics in parenthesis are based on standard errors clustered by firm level. ***, **,
* indicates significance at the 0.01, 0.05, 0.10 level respectively. All variables are defined in Appendix 1.
Loan Spread
Loan Spread
(weighted average) Amount Deal Amount
(1) (2) (3) (4)
POST 0.040
0.038
-0.030
-0.043
(1.55)
(1.49)
(-0.92)
(-1.26)
No Relationship 0.059***
0.058***
-0.058***
-0.038**
- Lead Arranger (5.81)
(5.75)
(-3.84)
(-2.41)
POST*No Relationship -0.020
-0.019
-0.084**
-0.077*
- Lead Arranger (-0.81)
(-0.79)
(-2.19)
(-1.95)
Assets -0.111***
-0.112***
0.462***
0.479***
(-8.72)
(-8.76)
(18.47)
(18.95)
ROA -0.468***
-0.454***
0.408**
0.441***
(-4.96)
(-4.97)
(2.49)
(2.59)
Loss 0.164***
0.164***
-0.077***
-0.070**
(8.02)
(8.03)
(-2.66)
(-2.36)
Leverage 0.313***
0.316***
0.020
0.081
(8.48)
(8.50)
(0.28)
(1.10)
Interest Coverage -0.001***
-0.001***
0.001***
0.001***
(-6.83)
(-6.96)
(2.61)
(2.89)
Tangibility -0.309***
-0.311***
-0.015
-0.003
(-6.89)
(-7.09)
(-0.20)
(-0.03)
Rated 0.040*
0.037*
-0.100***
-0.109***
(1.77)
(1.67)
(-3.61)
(-3.75)
Investment Grade -0.203***
-0.194***
0.029
-0.001
(-6.00)
(-6.20)
(0.76)
(-0.03)
Amount -0.060***
-0.057***
(-6.46)
(-6.16)
Maturity 0.000
0.000
0.004***
0.005***
(1.19)
(1.28)
(6.90)
(8.73)
Guarantor 0.013
0.017
-0.066**
-0.072**
(0.79)
(0.99)
(-2.36)
(-2.40)

63
Table 8 (continued)
PP -0.102***
-0.102***
0.214***
0.197***
(-7.10)
(-7.65)
(11.40)
(10.38)
#Covenants 0.055***
0.055***
0.031***
0.059***
(11.09)
(11.25)
(4.34)
(7.75)
Model OLS
OLS
OLS
OLS
Firm FE Yes
Yes
Yes
Yes
Year FE No
No
No
No
Year-Month FE Yes
Yes
Yes
Yes
Observations 27,196
27,196
27,196
27,196
Adj. (Pseudo) ) 𝑅2 0.756
0.76
0.790
0.774