the effect of ventilation and filtration - wpb-radon.com
TRANSCRIPT

THE EFFECT OF VENTILATION AND FILTRATION ON RADON DECAY PRODUCT MEASUREMENTS
Bill Brodhead
WPB Enterprises, Inc., 2844 Slifer Valley Rd., Riegelsville, PA USA [email protected] www.wpb-radon.com
ABSTRACT The author ran a series of continuous radon and radon decay product measurements with differing amounts of whole house, local ventilation and filtration taking place. The results of this data is compared to a previous paper presented by the author at the 1994 International Radon Conference in Atlantic City titled “Study of the Effect of Tampering and its Detection During Short-Term Tests”. The conclusion of the paper discusses the ease of altering the results of a radon decay product monitor versus altering the results of a continuous radon gas monitor.
INTRODUCTION From the late 1980’s to the mid 1990’s radon decay product (RDP) monitors were commonly used to determine the need for radon mitigation installations. The use of this type of instrument rapidly declined after this period because of the cost of the equipment, the extra care required to ensure the instrument was functioning properly and the ease of tampering with the instrument in order to obtain lower readings. A study to determine how easily and effectively tampering could take place was funded in 1993 by the Pennsylvania DER (now called the DEP). A paper of the results of that study was presented at the1994 International Radon Conference in Atlantic City titled “Study of the Effect of Tampering and its Detection During Short-Term Tests”. The study primarily measured the effectiveness of tampering by directly altering the radon monitoring equipment. The effect on the Radon Decay Product (RDP) concentration by filtering the air was only casually measured during this earlier study. This paper presents the findings of that research in regards to radon decay product monitors. The author also ran a series of measurements in which continuous radon monitors and continuous radon decay product monitors were operated at the same time in the same location. The affect of changes in ventilation rate, filtration and instrument tampering were compared.

INSTRUMENT CALIBRATION The radon and radon decay product (RDP) instruments used in the 1994 study were carefully calibrated using the DOE radon and RDP chamber facility in New York City. The measurements made for this study used four AB5 Pylon monitors. Two of the Pylons monitors (serial number 269 & 352) used passive head scintillation cells called PRD’s to determine the hour by hour radon levels. The other two Pylon monitors (serial number 598 & 617) used the Pylon AEP-47 filter holder to obtain the hour by hour RDP concentrations. The Pylon AEP-47 filter holders have a zinc sulfide surface behind the filter. When RDP’s are captured on the filter, a percentage of the alpha emissions from further decay strikes the zinc coating causing a flash which the Pylon PMT tube can detect and count. Three of the Pylons were initially adjusted for background counts and high voltage by exposing them to a Pylon source cell so that the high voltage setting could be adjusted to optimal counting efficiency. Two of the Pylons using the PRD heads also had the background determined in a low radon environment to obtain the background subtraction factor. The AB5 Pylon, number 269, with a PRD head was exposed in the Bowser-Morner chamber from 7/3/05 to 7/05/05. The calibration factor for the Pylon was then adjusted so that it matched the radon levels of the Bowser-Morner chamber.
Figure 1 – Pylon AB5 CRM with PRD & Pylon AB5 CWLM with AEP47

Health Physics Associates of Lenhartsville, PA provided one of the Pylons. They also provided calibration for the two CWLM’s using a Pylon calibration source, model 190, to expose a filter to a known concentration and then determining the efficiency of each Pylon using that exposed filter. The working level concentration was obtained by using the quasi-mode function of the Pylon that pumped air through the filter for ten minutes. The counts obtained from the ten minute filter loading are then counted in ten minute intervals for the next fifty minutes. This ten minute pumping cycle is repeated ever hour. The counts obtained in the fourth, fifth and sixth ten minute interval per hour are then entered into a spreadsheet that uses the kusnetz method for determining the RDP concentration. The WL is determined by the average WL of the three, ten minute intervals that are counted. Using the ten minute pump cycle option with the pylon limits the filter loading on the filter which could change the pump flow rate. The con is that the WL is being determined only for that 10 minute interval and not the average of the whole hour. There were a number of measurement periods when it was suspected that the 10 minute interval was not representative of the hour long average. All four Pylon monitors were then placed in the author’s basement. The radon mitigation system was turned off to allow radon levels to rise in the basement. The monitors recorded the radon and RDP concentration for two days. The Pylon monitor used to measure radon that was not exposed in the Bowser-Morner chamber was adjusted so that it’s calibration factor gave similar results as the recently calibrated monitor. See the graph below.
0.0
10.0
20.0
30.0
40.0
50.0
60.0
1 2 3 4 5 6 7 8 9 10 11 12 13 14 15 16 17 18 19 20 21 22 23 24 25 26 27 28 29 30 31 32 33 34 35 36 37 38 39 40 41 42 43 44 45 46 47
0.00
0.05
0.10
0.15
0.20
0.25
0.30
Rn-269
Rn-352
WL-617
WL-598
CRM 352 = 20.8 avgCRM 269 = 20.5 avg
CWLM 617 = 0.136 WLCWLM 598 = 0.127 WL
average ER = 0.65
WLpCi/L
Monitor Intercomparison
Figure 2 – Inter-comparison between all 4 Pylons

The graph shows how consistent the two CRM’s were with each other. They averaged within 2% of each other. The two CWLM’s were also reasonably consistent with each other and they averaged within 7% of each other.
PA DER TAMPER STUDY RESULTS OVERVIEW In the PA DER tamper study four residential homes were tested during three different periods. During each period, four test runs each of two-days duration were made for a total of twelve tests in each house. During each measurement period eight CRM’s, five CWLM, three RIPSU, and six passive radon detectors were exposed at the same time in the basement. Basement and outside temperature, basement humidity and CO2, inside to outside pressure and furnace run time were also recorded. A CRM and CWLM were also exposed on the first floor. After each detector was activated, the authors of the study would leave the building and PA DER officials would enter the basement and subject the detectors or the basement to tampering. The PA DER officials would then return before the end of the two-day measurement period and undue any tampering that had been done. The authors of the study would then return to the house to collect all the data. The authors would then try and determine what tampering had been done by the results of the data. At the end of the study the PA DER reported what tampering had actually been done in each test. A full study report was presented to the PA DER by the authors of the study. A summary of the key findings of the study was presented at the 1994 AARST International Radon Symposium. See Reference 1.
ORIGINAL TAMPER STUDY HOUSE TYPES There were four different house types during the tamper study.
(A) 1500 sq ft Ranch – partially finished basement – oil fired hot water – two window air conditioners on the main floor
(B) 2600 sq ft Colonial two story - walk out basement – Heat pump with gas back-up. An existing mitigation system was turned off for the study. (C) Combination 900 sq ft basement and attached slab on grade family room. Heat pump with gas back up (D) Split Level with a basement and attached slab on grade finished area. Oil fired hot air heating combined with central air conditioner.

EQUILIBRIUM RATIOS MEASURED DURING THE STUDY Out of the 48 measurement periods made in the four tamper study houses, 32 periods did not have any ventilation changes made to the room, exterior windows or to the furnace. In each of these runs a CRM and CWLM monitor that was not tampered with was chosen to determine the average equilibrium ratio. The graph below depicts the results of this data. The inside to outside temperature Delta-T in degrees Fahrenheit is depicted with the dotted line reference to the right side scale. The average equilibrium ratio (ER) between the radon levels and the RDP levels of all four homes was 0.37 ER in the basement and 0.39 in the first floor. This corresponds closely to the BEIR VI predicted national average of 0.40 ER. The split level house, D, had significantly lower ER in the basement with an average of 0.25 while the first floor had the highest ER first floor average. The author has no explanation for this factor. In two of the test house, A and C, there was no significant ER difference between warm periods with low in-out delta-T and colder periods with greater delta T. See the graph in Figure 4 below. The two heat pump houses however do seem to have lower ER during cooler periods of greater delta-T. This is likely due to the longer run time of heat pumps compared to other heating equipment.
Figure 3 – Tamper study CRM’s, CWLM’s, Passive detectors, RIPSU’s

0%
10%
20%
30%
40%
50%
60%
70%
aT
0
5
10
15
20
25
30
35
40
45
50
Bas ER 0.37 1st Floor ER 0.39 In-Out Delta T
Bas avg ER 0.401st Flr avg ER 0.39
Bas avg ER 0.451st Flr avg ER 0.41
Bas avg ER 0.391st Flr avg ER 0.33
Bas avg ER 0.251st Flr avg ER 0.42
Ranch A Colonial B Colonial C Split-Level DER Delta T
OPERATING THE AIR HANDLER 100% There was two test periods during the tamper study when the heat pump air handler was left continuously on. In both cases the equilibrium ratio (ER) decreased by a greater percentage on the first floor. In house B the basement ER decreased 26% and the first floor ER decreased 36%. In House C the continuous running of the heat pump air handler decreased the basement ER 25% however the first floor ER decreased by 59% compared to the non-tampered run.
Figure 4 – Equilibrium Ratios versus Delt-T in Tamper study houses
RUNNING A FAN IN TEST AREA DURING TAMPER STUDY
A standard 20” ventilation fan was operated in the test area seven different times during the tamper study. The average reduction in Equilibrium Ration (ER) was 34.3%. The table below lists the individual reductions. The operation of a fan in the test area did not reduce the radon concentrations in the room, only the RDP concentration.
Run Previous ER
ER with Fan
ER reduction
Ventilation Fan
A1/A2 54.3% 31.8% - 41% medium speed B1/B2 56.3% 42.2% - 25 % aimed at detectors C1/C2 63.9% 38.1% - 39% speed N/A D1/D2 25.0% 20.0% - 20% high speed E3/E4 39.3% 26.0% - 34% 2 fans G1/G2 48.0% 23.3% - 51% low speed H1/H2 28.9% 20.3% - 30% speed N/A
The least ER reduction of 20% between the D1 and D2 test runs happen during a period when the heating, ventilation and air conditioning (HVAC) fan was operating 73% of the time. It is assumed that the additional ventilation of the room fan made less difference because the air was already being circulated by the HVAC fan.
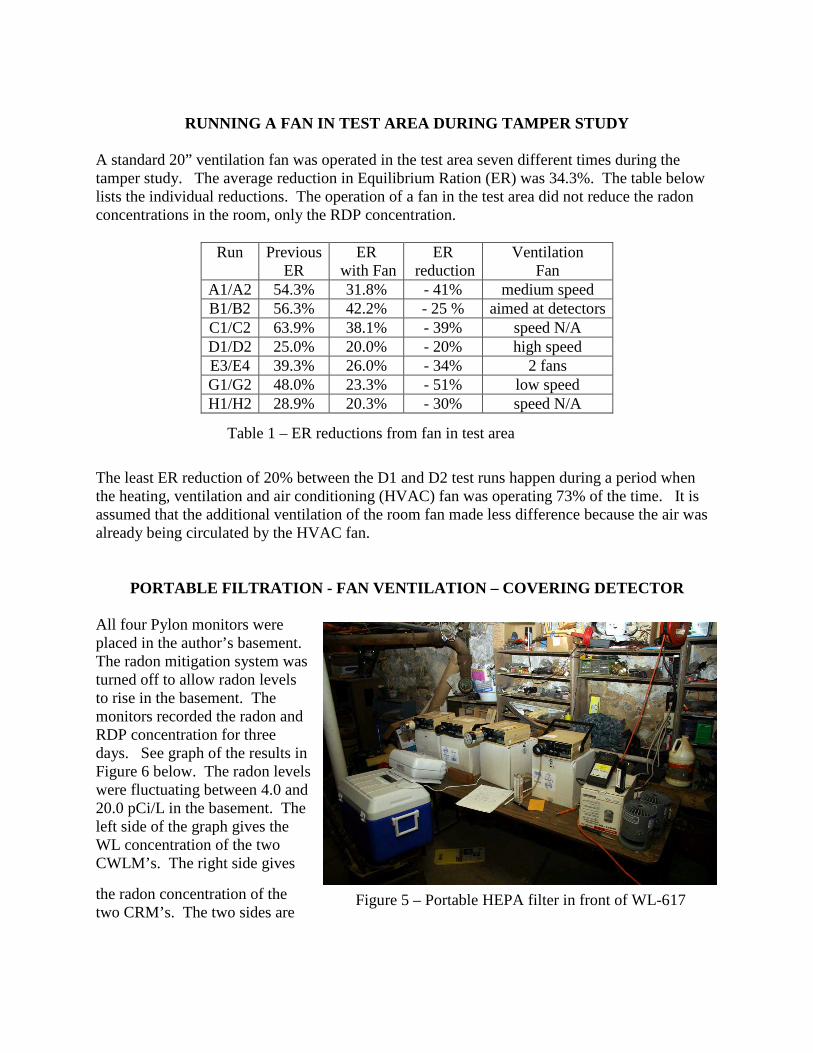
PORTABLE FILTRATION - FAN VENTILATION – COVERING DE TECTOR All four Pylon monitors were placed in the author’s basement. The radon mitigation system was turned off to allow radon levels to rise in the basement. The monitors recorded the radon and RDP concentration for three days. See graph of the results in Figure 6 below. The radon levels were fluctuating between 4.0 and 20.0 pCi/L in the basement. The left side of the graph gives the WL concentration of the two CWLM’s. The right side gives
the radon concentration of the two CRM’s. The two sides are
Table 1 – ER reductions from fan in test area
Figure 5 – Portable HEPA filter in front of WL-617

set so that a 0.5 equilibrium ratio exists horizontally across the graph . Any CWLM measurements below the CRM indicates an ER below 0.5. In the graph the first eleven hours had no tampering and the ER was about 0.5. The second twelve hours a common bath towel was placed over one of the CRM’s (352) and one of the CWLM’s (617). The ER dropped to about 0.25. The bath towel caused about a 50% reduction in the ER. The towel did not effect the performance of the CRM. For some unknown reason, however, the CWLM that was not being tampered also decreased 25%. The next 12 hours there was no tampering. The ER returned again to approximate 0.5 again. An inexpensive portable HEPA filter (Holmes HAP240) was purchased from Walmarts. See Figure 5. The actual cfm of the filter was not listed but the product information claimed it was effective for rooms up to 109 sq ft. It also claimed it could remove 99% of particles larger than 2.0 microns. The portable filter was placed directly in front of the WL-617. Both CWLM’s had decreased ER’s of about 35%. See the middle of the graph. The second CWLM was about 30 inches away. It appears that blowing the filtered air towards the CWLM did not cause any significant additional reduction in the ER.
0.00
0.02
0.04
0.06
0.08
0.10
0.12
1 3 5 7 9 11 13 15 17 19 21 23 25 27 29 31 33 35 37 39 41 43 45 47 49 51 53 55 57 59 61 63 65 67 69 71
0.0
4.0
8.0
12.0
16.0
20.0
24.0
WL-617
WL-598
Rn-269
Rn-352
RDP & Radon measurements 8/22 9:22 AM to 8/25 9:22 AM
No tamperingbath towel over
WL-617 & Rn-352
No tampering
Portable Hepa Filter on WL-617
No tamperingFan blowingon WL-617 & Rn 352
Fan blowingsideways
WL pCi/L
No tamper
CRM's
CWLM's
Figure 6 – Results from tampering with CWLM’s

The next no tampering section in the graph was only about 5 or 6 hours. The ER again returned to the 0.5 level. The last period a 12” portable fan was pointed directly at the CWLM-617. The radon levels happen to be climbing at that point while the RDP concentration remained the same for the CWLM-598. The CWLM-617 also began to climb with the two other CRM’s. It was determined that this was caused by the additional plate out from blowing basement air directly towards the exposed filter membrane of the CWLM-617. This kind of response would not likely occur with CWLM’s that had the filter protected from direct airflow. The 12” portable fan was then turned sideways to the CRM’s and CWLM’s. Both of the CWLM’s then began to perfectly tracking each other. The ER decreased 60%. It appears that a simple 12” portable fan operating in the same room as a CWLM provides almost twice the ER reduction of an inexpensive HEPA filter.
RDP REDUCTION FROM AIR HANDLER OPERATION
The author’s house has a central air conditioning system which has a Newtron electrostatic air filter. A short test run was performed with radon and RDP continuous radon monitors operating in different bedrooms on the second and third floor. See graph in Figure 8. During the first part of the run the air handler was turned off. The radon levels were very low and the equilibrium ratio was about 0.5. During the second part of the run the air handler was set to run
Figure 7 – Portable 12” fan blowing in front of WL-617
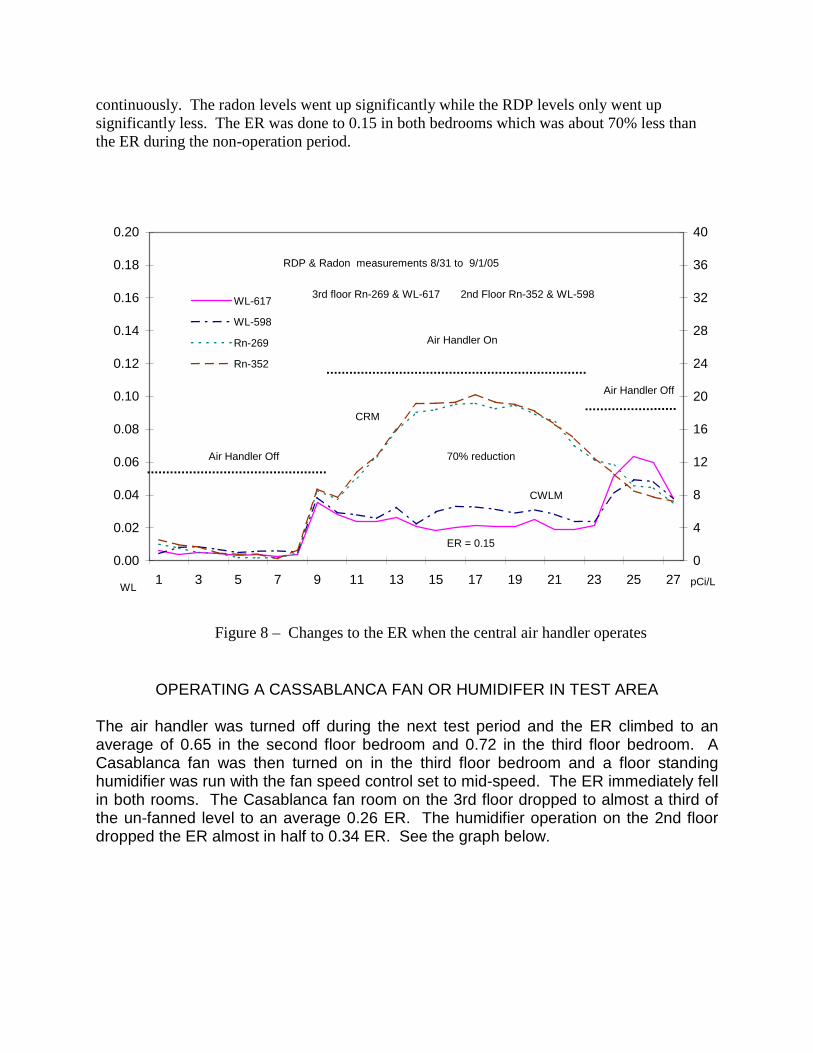
continuously. The radon levels went up significantly while the RDP levels only went up significantly less. The ER was done to 0.15 in both bedrooms which was about 70% less than the ER during the non-operation period.
0.00
0.02
0.04
0.06
0.08
0.10
0.12
0.14
0.16
0.18
0.20
1 3 5 7 9 11 13 15 17 19 21 23 25 270
4
8
12
16
20
24
28
32
36
40
WL-617
WL-598
Rn-269
Rn-352
RDP & Radon measurements 8/31 to 9/1/05
Air Handler Off
WL pCi/L
3rd floor Rn-269 & WL-617 2nd Floor Rn-352 & WL-598
Air Handler On
Air Handler Off
70% reduction
ER = 0.15
CRM
CWLM
OPERATING A CASSABLANCA FAN OR HUMIDIFER IN TEST AREA The air handler was turned off during the next test period and the ER climbed to an average of 0.65 in the second floor bedroom and 0.72 in the third floor bedroom. A Casablanca fan was then turned on in the third floor bedroom and a floor standing humidifier was run with the fan speed control set to mid-speed. The ER immediately fell in both rooms. The Casablanca fan room on the 3rd floor dropped to almost a third of the un-fanned level to an average 0.26 ER. The humidifier operation on the 2nd floor dropped the ER almost in half to 0.34 ER. See the graph below.
Figure 8 – Changes to the ER when the central air handler operates

CONCLUSIONS
Continuous Working Level Monitors are far more demanding, complicated, costly and easily influenced by changes in the testing environment than CRM’s. During both studies the pump flow rates had to be carefully checked at the start and end of each test run to ensure they were staying within tolerance. The filters used to collect the decay products must be only those filters designed for each unit and carefully installed. Both studies clearly show that any changes in the ventilation rate in the test area will tend to have large effects on any RDP measurements. A test period that includes significant central air handler run time will produce results that can be very different from other periods when the air handler is not being significantly used. The operation of any fan or filter system in the test area will also dramatically effect the RDP measurement. The location of the RDP monitor in a home with an air handling system can also have very different results compared to radon gas measurements depending on the air change rate in the test area induced by the central air handler operation. The possibility of someone purposely tampering with a radon test during a real estate transaction exists for both radon gas and radon decay product measurements. RDP measurements however are more easily tampered with because of their filter action. Any additional air movement in the test area whether it be a fan operation or a piece of equipment with an internal fan such as a de-humidifier would reduce the RDP concentration. Covering any RDP monitor can also significantly reduce the RDP measurement result. Activated carbon detectors are also
Figure 9 – Changes to the ER when the central air handler operates
0.00
0.20
0.40
0.60
0.80
1.00
1 2 3 4 5 6 7 8 9 10 11 12 13 14 15 16 17 18
ER
3rd Flr ER 617-269
2nd Flr ER 598-352
2nd Flr ER = 0.65
2nd floor Humidifer
3rd floorCasablanca fan
Air handler not on
2nd Flr ER = 0.34
3rd Flr ER = 0.26
3rd Flr ER = 0.72

significantly influenced by covering. CWLM may be able to detect this type of tampering from dramatic shifts in concentration. The RIPSU monitors, that only give a single average RDP concentration, would not be able to determine that the monitor had been covered.
REFERENCES FOR ADDITIONAL INFORMATION A. Reineking, K.H. Becker & J. Porstendorfer, Measurements for the unattached fractions of radon daughters in houses, Science of the Total Environment, 45, 261-270 (1985) J.C. Strong, The size of attached and unattached radon daughters in room air, Journal of Aerosol Science, 17, 873-879 (1988) M. Ramamurthi & P.K. Hopke, On improving the validity of wire screen “unattached” fraction Rn daughter measurements, 56, 1989-194, (1989) M. Ramamurthi & P.K. Hopke, An automated, semi-continuous system for measuring indoor radon progeny activity-weighted size distribution, dp 0.5-500 nm, Aerosol Science Technology, 14, 82-92 C.S. Li & P.K. Hopke, The Efficacy of Air Cleaners in Controlling Indoor Radon Decay Products, Health Physics, 61, 785-797 (1991) P.K. Hopke, Some thoughts on the “Unattached” Fraction of Radon Decay Products. Health Physics, 63, 209-212 (1992) C.S. Li & P.K. Hopke, Air Filtration and Radon Decay Product Mitigation, Indoor Air, 2, 84-100 (1992) P.K. Hopke, B. Jensen & N. Montassier, Evaluation of Several Air Cleaners for Reducing Indoor Radon Progeny, J.Aerosol Science Technology, vol25, No2 pp. 395-405, 1994 B. Brodhead & S. Porter, Jr, Study of the Effect of Tampering and its Detection during Short-Term Tests, AARST International Radon Conference, Atlantic City, NJ, 1994 P.K. Hopke, B. Jensen, N. Montassier, P. Wasiolek, Evaluation of Room Air Cleaners for the Reduction of Exposure and Dose to Indoor Radon Progeny, Radiation Protection Dosimetry, Vol 56, Nos 1-4, pp. 55-60 (1994) A. Reineking, & J. Porstendorfer, Radon: characteristics in air and dose conversion factors., Health Physics, Mar;76(3):300-5 (1999)

C. Huet, G. Tymen, D. Bouland, Size distribution, equilibrium ratio and unattached fraction of radon decay products under typical indoor domestic conditions, Science of the Total Environment, 2001 May 14;272(1-3):97-103 C. Huet, G. Tymen, D. Bouland, Long Term Measurements of Equilibrium Factor and Unattached Fraction of Short-Lived Radon Decay Products in a Dwelling-Comparison with PRADDO Model, Aerosol Science and Technology, vol 35, 1, July 2001