the effect of premature wall yield on creep testing of
TRANSCRIPT

1
The effect of premature wall yield on creep testing of strongly-
flocculated suspensions
Anthony D Stickland*,1, Ashish Kumar1, Tiara E Kusuma1, Peter J Scales1, Amy Tindley2,
Simon Biggs2 and Richard Buscall1,2,3 1Particulate Fluids Processing Centre, Department of Chemical and Biomolecular Engineering, The University of
Melbourne, Victoria 3010, Australia 2Institute of Particle Science and Engineering, School of Process, Environmental and Materials Engineering, The University
of Leeds, Leeds LS2 9JT, United Kingdom 3MSACT Research and Consulting, 34, Maritime Court, Haven Road, Exeter, EX2 8GP, United Kingdom
Abstract
Measuring yielding in cohesive suspensions is often hampered by slip at measurement
surfaces. This paper presents creep data for strongly-flocculated suspensions obtained using
vane-in-cup tools with differing cup-to-vane diameter ratios. The three suspensions were
titania and alumina aggregated at their isoelectric points and polymer-flocculated alumina.
The aim was to find the diameter ratio where slip or premature yielding at the cup wall had
no effect on the transient behaviour. The large diameter ratio results showed readily
understandable material behaviour comprising linear viscoelasticity at low stresses, strain-
softening close to yielding, time-dependent yield across a range of stresses and then viscous
flow. Tests in small ratio geometries however showed more complex responses. Effects
attributed to the cup wall included delayed softening, slip, multiple yielding and stick-slip
events, and unsteady flow. The conclusion was that cups have to be relatively large to
eliminate wall artefacts. A diameter ratio of three was sufficient in practice, although the
minimum ratio must be material dependent.
Keywords
Suspension rheology, creep, vane-in-cup, wall slip, strongly-flocculated suspension
*Tel.: +61 3 8344 3430; Fax: +61 3 8344 4153 Email address: [email protected].

2
1 Introduction
The rheological properties of industrial suspensions such as mineral tailings, biosludges,
pigments and ceramics, and household products including cosmetics, paints and foods, are
often the major factor determining their use and applicability. In the industrial setting, a
thorough understanding of suspension rheology allows for better prediction and optimisation
of transport and handling processes, such as pipelining, mixing, solid-liquid separation and
pumping. At some point, the suspension rheology limits the maximum particulate
concentration that can be processed. In other cases, the flow properties of suspensions are
formulated to produce a particular flow response such as when a toothpaste tube is squeezed
– toothpaste yields and flows onto the toothbrush but stops flowing on cessation of the
applied stress.
Flocculated suspensions, where the particles are attracted to each other, develop a
networked structure capable of withstanding an applied load at solids concentrations above
the gel point φg (Michaels and Bolger 1962; Rehbinder 1954). At sufficiently small loads or
deformations, such suspensions behave as viscoelastic solids. If a shear load is large enough,
the suspensions yield and flow viscously. φg can be much lower than random close packing –
as low as 1 volume percent for biosludges (Stickland et al. 2008), for example – such that the
yielding behaviour of strongly flocculated suspensions is important over a wide range of
concentrations.
In shear, it is common to extract parameters from the flow curves for strongly-flocculated
suspensions by fitting them to viscoplastic models such as Bingham (Bingham 1916) or
Herschel-Bulkley (Herschel and Bulkley 1926), where the strength of the network is
represented by the shear yield stress τy, which is a function of the density and distribution of
bonds in the system. The assumption embodied in these simple models and in yield stress as
an operational parameter is that, at some critical stress, the material converts instantaneously
from a perfectly rigid solid to a viscous liquid (Bird et al. 1982; Hartnett and Hu 1989;
Liddell and Boger 1995). This is unlikely to be true in reality, even if it suffices to model
many flow curves approximately. Hence, it comes as no surprise that experiments that probe
yielding itself show the transition to be more progressive and to have an intrinsic time-
dependence. For example, creep testing reveals viscoelasticity at stresses below yielding
followed by time-dependent yield over a range of stresses rather than at a single stress (Barrie
et al. 2004; Gibaud et al. 2010; Le Grand and Petekidis 2008; Uhlherr et al. 2005). Other
descriptions of yield such as critical strain energy Wy or yield strain γy may be more

3
appropriate for suspension behaviour (ten Brinke et al. 2008) compared to yield stress. For
example, yield may be described by sharp (but not instantaneous) strain thinning or strain
softening (Klein et al. 2007; Kobelev and Schweizer 2005; Kumar et al. 2012). In fact, as
demonstrated here, an elastic body can yield without any need for an explicit yield criterion if
the strain-softening of the modulus is strong enough.
The study of suspension viscoelastic and yielding properties and consequently the
development of strongly-flocculated suspension constitutive descriptions cannot proceed
without accurate measurement. Unfortunately, the accurate measurement of suspension
properties is inherently difficult due to complex inter-particle and hydrodynamic interactions.
The results from conventional rotational geometries such as cone-and-plate or cup-and-bob
(Couette) are influenced by wall effects. Adhesive yielding allows depletion and slip
(Buscall et al. 2009; Buscall et al. 1993). In addition, narrow gaps such as cone-and-plate are
not suitable due to particle bridging (Boger 1999).
Since the 1980’s, various authors (Barnes and Carnali 1990; Keentok et al. 1985; Nguyen
and Boger 1985a) have substituted the concentric cylinder system of a Couette geometry with
the vane-in-cup geometry (see in Figure 1) to alleviate the problem of slip at the surface of
the inner cylinder surface in suspension rheology (Barnes 1995; Nguyen and Boger 1983).
The vane also has the advantage of minimal structural disruption during testing (Barnes 1995;
Barnes and Carnali 1990). The flow start up at controlled shear-rate vane technique (Nguyen
and Boger 1983; 1985a) has been used in characterising a wide array of concentrated
networked suspensions, including for example titania (Uhlherr et al. 2005; Zhou et al. 2001),
alumina (Fisher et al. 2007; Johnson et al. 2000; Zhou et al. 2001; Zhou et al. 1999), brown
coal (Leong et al. 1995) and wastewater sludges (Baudez et al. 2011).

4
Figure 1: (a) Side and (b) Top views of the four-bladed vane-in-cup geometry with a wide gap. hv and dv
are the height and diameter of the vane while hc and dc are the height and diameter of the cup
The vane replaces the inner cylinder in a concentric cylinder arrangement and thus
alleviates slip at the inner surface. In a radial geometry, the stress and deformation decay
with radial position in the gap relative to the vane diameter. In most cases, vanes are used in
cup-to-vane diameter ratios of approximately 1.1 so that the deformation is approximately
linear and the transformation of angle to strain is straightforward. However, since the wall
yield stress of a suspension is typically less than the bulk yield stress (Buscall et al. 1993;
Grenard et al. 2014; Saak et al. 2001; Walls et al. 2003), small diameter ratios are subject to
slip at the cup wall. Whilst roughened surfaces have been employed with mixed success, the
vane-in-infinite-cup geometry alleviates all wall effects and has been shown (Fisher et al.
2007) to be a suitable method for determining the yield stress and steady-state flow behaviour
of strongly-flocculated particulate suspensions. However, the geometry has had limited use
studying the transient elastic deformation of suspensions prior to yielding or the time
dependencies of yielding and it is unclear what constitutes an infinite gap. Coussot and co-
workers (Coussot et al. 2006) used a 25 mm diameter six-bladed vane in a 36 mm cup (dc/dv
= 1.44) to study the creep behaviour of a networked bentonite suspension (along with Maille
mustard and Vivelle Dop hair gel as examples of a particulate suspension in an oil-in-water
emulsion and a Carbopol gel respectively). They too justified using a larger than normal
diameter ratio in order to minimise wall and edge effects; however, they did not vary the gap
to show if indeed this had been achieved.
dv
dc
vane
cup
dc
dv
vane
cup
hv hc
(a) Side view (b) Top view

5
The work in this paper compared the creep behaviour of strongly-flocculated alumina and
zirconia systems as functions of cup-to-vane diameter ratio, dc/dv. The expectation was that
there would be a critical dc/dv value above which the results would show no wall effects. A
constitutive description when there is first wall yield and then true yield is complicated. The
behaviours at the wall and in the bulk are both highly non-linear and hence it is difficult to
posit a constitutive equation in advance, except in very general terms. We have used a
power-law dependent model for the elastic modulus here, but in general, there is limited
discussion of a constitutive description for suspensions. Whilst this is vitally important and
the subject of current research (Buscall et al. 2014a; Buscall et al. 2014b; Lester et al. 2014),
the aim of this work was to qualitatively compare the measured data to show when there was
no influence of the cup wall. Development cannot proceed without data that is clear of wall
artefacts, otherwise material behaviour is attributed that is in fact due to the measurement.
Two types of strongly-flocculated particulate mineral oxide suspensions were tested in
this work. The term strongly-flocculated reflects that the strength of the inter-particle bonds
was greater than about 20 kT such that the suspensions were not influenced by Brownian
motion, compared to weakly-flocculated suspensions that show long-term fluctuations and
creep. The first type of suspension was either zirconia or alumina coagulated by van der
Waals forces at their respective iso-electric points (IEPs). The second type was alumina
flocculated with a high molecular weight polymer flocculant. The creep results from these
suspensions were compared to highlight the susceptibility of different systems to apparent
wall effects. In particular, the stresses where wall slip was observed in small diameter ratios
were used to determine the ratio of bulk to wall yield stresses. In addition, the elastic
deformation was analysed using an appropriate non-linear to show wall effects on suspension
strain softening.
2 Theory
Most rheometer geometries use a relatively small gap so that the shear stress τ is
approximately uniform and the shear strain γ is easy to calculate (Barnes et al. 1989). Using
the vane-in-infinite-cup geometry presents the problem of extracting stress-strain information
from the test results. The vane-in-infinite-cup is the vane analogy of the wide-gap concentric
cylinder geometry (Krieger and Maron 1952; 1954). The shear stress distribution as a
function of radial position r for concentric cylinders is given by setting the inertial and
viscous terms of the momentum balance to zero:

6
02 =+∂∂
rrττ …(1)
Integrating and evaluating the shear stress at the vane, τv = τ(rv), gives:
2
),( ⎟⎠⎞⎜
⎝⎛=rrtr v
vττ …(2)
Thus the shear stress diminishes with the radial position squared. The stress propagates
to the walls of the container and the cup-to-vane diameter ratio determines the magnitude of
the stress at the cup wall. If yielding at the wall is characterised by a critical wall yield stress
τy,wall and yielding in the bulk by τy,bulk, the critical diameter ratio at which premature yielding
will be observed is given by the square-root of the ratio of the bulk and wall yield stresses
(Buscall et al. 1993; Grenard et al. 2014; Saak et al. 2001; Walls et al. 2003):
wally
bulky
v
c
dd
,
,
minττ
=⎟⎟⎠
⎞⎜⎜⎝
⎛ …(3)
Thus, measurements in a relatively large gap to determine the bulk yield stress and in a
relatively small gap to determine the wall yield stress would give an estimate of the minimum
critical diameter ratio.
In the cylindrical geometry, the strain γ at position r and time t is defined as
r
r∂∂−= θγ …(4)
where θ(r,t) is the angular displacement. Since the stress varies as a function of radial
position in the wide gap, a constitutive relationship is required to combine equations 2 and 4
in order to convert displacement (or rotational rate) into strain (or strain-rate).
If the stress and stress-rate are linear functions with respect to strain and strain-rate then
the material is linear viscoelastic and the solution is relatively straight-forward. By way of
example of the expected variation with gap width for a linear material, the Standard Linear
Solid (Voigt form) (SLS) is solved under constant stress creep conditions. The SLS, also
known as the Zener model, is a Hookean spring with instantaneous elasticity Gi in series with
a Kelvin-Voigt element with a retarded elasticity Gr and retardation time, tr. The constitutive
equation for this arrangement is (Roylance 2001):
γγττ +=⎟⎟⎠
⎞⎜⎜⎝
⎛++ !! r
iri
r tGGG
t 11 …(5)
Under constant stress conditions (τ! = 0, τ = τ0) in Cartesian coordinates, the solution to
Eq. 5 is:

7
⎥⎥⎦
⎤
⎢⎢⎣
⎡⎥⎦
⎤⎢⎣
⎡⎟⎟⎠
⎞⎜⎜⎝
⎛−−+=
rri tt
GGt exp111)( 0τγ …(6)
In radial coordinates with the vane rotating (τ(rv,t) = τv, θ(rv,t) = θv) and the cup static
(θ(rc,t) = 0), the solution for θv(t) using Eqs 2, 4 and 5 is:
⎥⎥⎦
⎤
⎢⎢⎣
⎡⎥⎦
⎤⎢⎣
⎡⎟⎟⎠
⎞⎜⎜⎝
⎛−−+
⎥⎥⎦
⎤
⎢⎢⎣
⎡⎟⎟⎠
⎞⎜⎜⎝
⎛−=
rric
vvv t
tGGr
rt exp11112
)(2
τθ …(7)
The relationship between the rotation of the vane in a finite medium and in an infinite
medium θv,∞ is given by:
2
,
1 ⎟⎟⎠
⎞⎜⎜⎝
⎛−=
∞ c
v
v
v
rr
θθ …(8)
Figure 2: Variation of creep angle with time for various cup-to-vane diameter ratios for a Standard
Linear Solid (Gi = 1000 Pa, Gr = 100 Pa, tr = 10 s, τ = 100 Pa)
Thus, for a linear material, diameter ratio does not affect the time dependency of the
creep angle, just the magnitude. The creep angle θv(t) is plotted in Figure 2 using the cup-to-
vane diameter ratios used in the alumina experiments for arbitrary material properties. The
results show instantaneous compliance (1/Gi) followed by retarded compliance (1/Gr). For
the smallest gap the creep angle is only 8% of the value for the infinite gap. As the gap
0.001
0.01
0.1
1
0.1 1 10 100
Cre
ep A
ngle
, θv
(rad
)
Time, t (s)
Infinite Gap4.23.02.11.1
dc/dv

8
increases, the creep angle asymptotes towards the infinite solution. The 4.2 cup-to-vane
diameter ratio gives a creep angle of 94% of the infinite solution.
Comparing Eqs. (5) and (6) leads to the commonly used linear relationship between
strain and angle of rotation at the vane (Krieger and Maron 1954):
12
12
−
⎥⎥⎦
⎤
⎢⎢⎣
⎡⎟⎟⎠
⎞⎜⎜⎝
⎛−=
c
vvv r
rθγ …(9)
This relationship holds for all linear materials and in the small gap limit (when all
materials are approximately linear). To complicate matters, suspensions are non-linear, such
that the conversion between angle and strain is not straightforward. The steady-state angular
displacement or rotational rate can be converted to steady-state strain and strain-rate
respectively (Krieger and Maron 1952), but it is not possible to use the same method to
convert time-dependent data for non-linear materials since their deformation history is stress
and time dependent. For suspensions that yield, for example, it would be necessary to know
the radial position within the gap at which the suspension is yielding in order to define the
strain.
For creep data prior to yielding that is not time-dependent such as the initial or steady-
state elastic deformation (that is, either none or all of the stresses have relaxed), it is possible
to use a power-law approximation akin to Krieger and Maron to extract the non-linear strain
and strain modulus. For a power-law dependent modulus G(γ) = Aγn (where τ = G(γ)γ), the
conversion from angle to strain is given by: 1
12
1)1(
2−
+
⎥⎥⎥
⎦
⎤
⎢⎢⎢
⎣
⎡
⎟⎟⎠
⎞⎜⎜⎝
⎛−
+=
n
c
vvv r
rnθγ …(10)
The linear approximation (Eq. 9) can therefore be used to determine the local slope of the
power-law (calculated over 3 or 5 points, for example), which can then be used to calculate
the real strain and modulus.
The results herein generally showed a low shear modulus G0 followed by strain-softening
that asymptoted to a constant power-law index. This motivated using a modified Cross
equation (with modulus and strain instead of viscosity and strain-rate) to fit G(γ):
n
y
GG −
⎟⎟⎠
⎞⎜⎜⎝
⎛+
=
γγ
γ
1
)( 0 …(11)

9
where γy is the ‘yield strain’ when the modulus is ½G0. This equation gives a linear material
with modulus G0 for γ << γy and strain-softening varying with γn for γ >> γy. Note that at
large strains and if n ≤ -1 then the material softens as fast or faster than it can strain (the stress
τ = G(γ)γ shows a maximum). If n < -1, the stress is non-monotonic with strain.
There is no explicit solution for stress as a function of strain based on Eq. 11 such that it
is not possible to pose a direct analytical conversion from angle to strain. However, there is
an explicit solution in the special case where n = -1. In this case, the modulus can be written
as a function of stress:
⎟⎟⎠
⎞⎜⎜⎝
⎛−==
y
GGττ
γττ 1)( 0 …(12)
G(τ) asymptotes to a ‘yield stress’ τy where τy = G0γy. Integrating the combination of
G(τ), the stress as a function of radius (Eq. 2) and the definition of strain (Eq. 4) from θ(rv) =
θv(τv) to θ(rc) = 0 gives:
⎥⎥⎦
⎤
⎢⎢⎣
⎡⎟⎟⎠
⎞⎜⎜⎝
⎛−−⎟
⎟⎠
⎞⎜⎜⎝
⎛−=
y
v
c
v
y
vyvv r
rG τ
ττττ
τθ 1ln1ln2
)( 2
2
0
…(13)
Thus, for materials that have a zero strain modulus G0 and strain-soften with a slope of n
= -1, Eq. 13 provides an analytical equation that can be fitted directly to experimental data to
extract G0 and τy.
In order to get the conversion factor between γ and θ for n = -1, simply substitute τv(γv) =
G(γv)γv and rearrange in terms of γv(θv): 1
2
20
0
112
exp−
⎟⎟⎠
⎞⎜⎜⎝
⎛−
⎥⎥⎦
⎤
⎢⎢⎣
⎡−⎟
⎟⎠
⎞⎜⎜⎝
⎛=
c
v
y
vyv r
rGG τ
θτγ …(14)
3 Materials and Methods
All reagents used were analytical grade and used without further purification. All
reagents were prepared using Milli-Q water (Millipore™ Synergy®, 0.22 µm filter).
3.1 Coagulated Titania Suspensions
Rheological tests were performed using high purity anatase titania (ANX type-N,
Degussa) in the laboratory at Leeds University. The purity and lack of surface contamination
was verified using ion chromatography analysis (Thermo Dionex). The mean diameter D[4,3]

10
estimated from low angle laser light scattering data (Malvern Mastersizer 2000) was 1.96 µm.
The density was 3.78 g/cm3. The IEP was measured (Colloidal Dynamics Zeta probe,
Colloidal Dynamics Pty Ltd, Australia) as pH 6.5 (Biggs and Tindley 2007). The titania was
prepared at a volume fraction of 0.153 by dispersion into 0.01 M KNO3 at pH 3 using
vigorous agitation by hand for 5 mins. The samples were pH adjusted and allowed to age for
between 18 and 24 h to ensure chemical equilibrium. The pH was adjusted to the IEP and
allowed to equilibrate prior to measurement.
3.2 Coagulated Alumina Suspensions
Rheological tests were performed using alumina (AKP-30, Sumitomo Chemicals Pty.
Ltd, Japan) at The University of Melbourne. This system has been characterised in detail by
Zhou et al (Zhou et al. 2001; Zhou et al. 1999). The alumina was nearly spherical with a
density of 4.0 g/cm3 and a mean diameter of 360 nm (Malvern Mastersizer 2000).
Coagulated alumina suspensions were prepared at a solids volume fraction of 0.20 in a
0.01 M KNO3 background electrolyte solution. The mixture was acidified using 1 M HNO3 to
pH 5 (EZDO PL-600 pH meter with Sensorex Combination pH electrode, Denver Instrument
Company), at which the suspension was fully dispersed. The mixture was then sonicated with
a high intensity sonic probe (Misonix™ S4000 Sonicator, 12.5 mm horn, 20 kHz, 800 W) to
ensure complete dispersion and then left to rest for 24 to 48 hours to establish physical and
chemical equilibrium. Before measurements, the pH was adjusted using 1 M KOH to the
isoelectric point (IEP) of approximately pH 9.2 (Foong 2008; Zhou 2000) and allowed to rest
for a minimum of 2 hours. The sample had a nominal yield stress of 85 Pa, as measured
using the Nguyen and Boger (Nguyen and Boger 1983; 1985a) vane technique.
3.3 Flocculated Alumina Suspensions
Polymer-flocculated systems are known to be irreversibly shear-history dependent.
Therefore, an experimental protocol was implemented here that minimised shear degradation.
Dispersed alumina suspensions were prepared at a volume fraction of 0.03 at pH 5 by
dispersing the alumina powder in Milli-Q water and then sonicating, as above. Suspensions
were then transferred to specially designed cylinders (see Figure 3) for flocculation.
The flocculant was an anionic, high MW polyacrylate / polyacrylamide copolymer
flocculant (AN934SH, SNF Australia, 30% anionic). Stock polymer solutions were prepared
at 2 g/L and agitated overnight on a rotary shaker. Stock bottles were covered with
aluminium foil and kept refrigerated to minimise polymer degradation; unused stock was
11
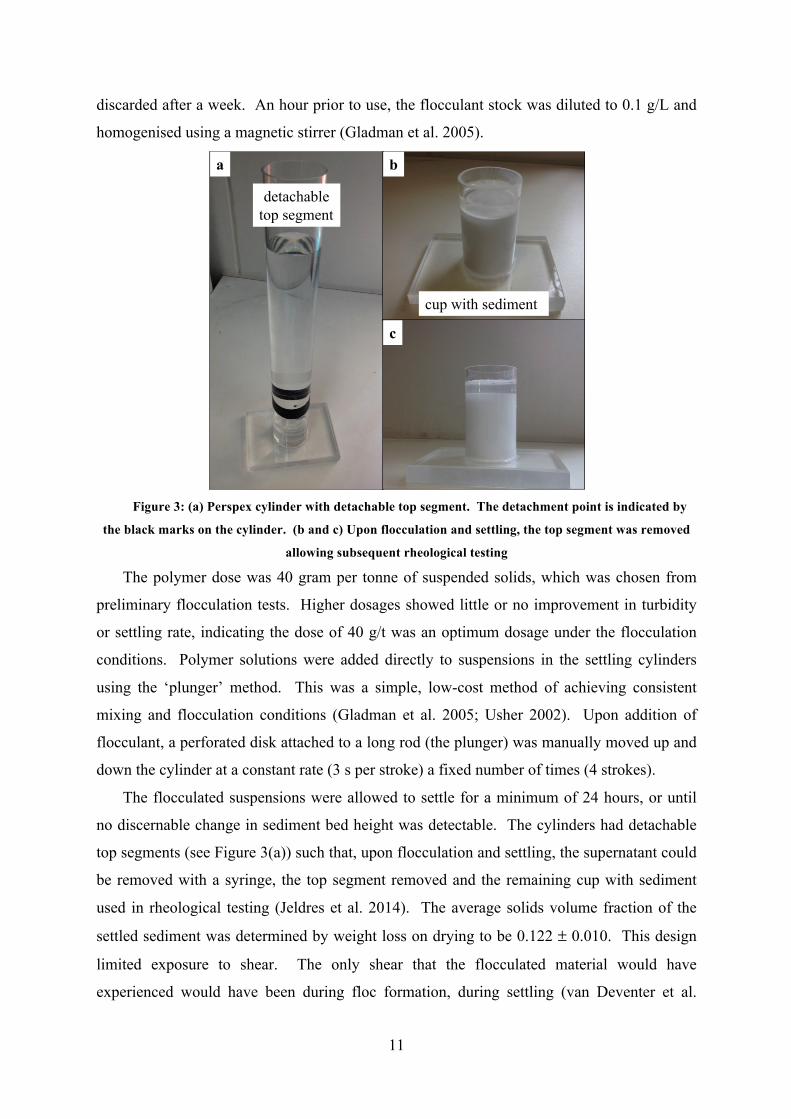
discarded after a week. An hour prior to use, the flocculant stock was diluted to 0.1 g/L and
homogenised using a magnetic stirrer (Gladman et al. 2005).
Figure 3: (a) Perspex cylinder with detachable top segment. The detachment point is indicated by
the black marks on the cylinder. (b and c) Upon flocculation and settling, the top segment was removed
allowing subsequent rheological testing
The polymer dose was 40 gram per tonne of suspended solids, which was chosen from
preliminary flocculation tests. Higher dosages showed little or no improvement in turbidity
or settling rate, indicating the dose of 40 g/t was an optimum dosage under the flocculation
conditions. Polymer solutions were added directly to suspensions in the settling cylinders
using the ‘plunger’ method. This was a simple, low-cost method of achieving consistent
mixing and flocculation conditions (Gladman et al. 2005; Usher 2002). Upon addition of
flocculant, a perforated disk attached to a long rod (the plunger) was manually moved up and
down the cylinder at a constant rate (3 s per stroke) a fixed number of times (4 strokes).
The flocculated suspensions were allowed to settle for a minimum of 24 hours, or until
no discernable change in sediment bed height was detectable. The cylinders had detachable
top segments (see Figure 3(a)) such that, upon flocculation and settling, the supernatant could
be removed with a syringe, the top segment removed and the remaining cup with sediment
used in rheological testing (Jeldres et al. 2014). The average solids volume fraction of the
settled sediment was determined by weight loss on drying to be 0.122 ± 0.010. This design
limited exposure to shear. The only shear that the flocculated material would have
experienced would have been during floc formation, during settling (van Deventer et al.
a b
c
detachabletop segment
cup with sediment

12
2011) and during insertion of the vane (although the vane does minimise sample disturbance
compared to other rheometer geometries (Nguyen and Boger 1985b)). This experimental
protocol was ‘single-use’ based on the premise that the flocculated samples were irreversibly
changed by the rheological test.
3.4 Rheology
Constant stress creep experiments were performed using stress-controlled rheometers at
Leeds University (C-VOR, Bohlin) and at The University of Melbourne (AR-G2, TA
Instruments). The vane-in-cup geometry was used with a combination of vanes and cups to
provide the range of dc/dv ratios shown in Table 1. The tests on coagulated titania used two
cup sizes with the same vane (combinations A and B), leading to cup-to-vane diameter ratios
of 1.1 and 2.0 respectively. The creep tests were performed over a range of stresses for 50 s.
The tests on coagulated alumina involved four different cup sizes with the same vane, leading
to the ratios of 1.1, 2.1, 3.0 and 4.2 (combinations C to F). The polymer-flocculated tests
involved the same cup (see Figure 3) with progressively smaller vanes (combinations G, H
and I). The 10 mm vane was the smallest available, so a larger cup was used to give the ratio
of 4.2 (combination J). The vanes were inserted into the middle of the sample with the same
distance from the vane to the top of the sample and from the vane to the bottom of the cup.
During the creep test, a constant torque T was applied and the creep angle, θ, measured as
a function of time. The torque was converted to shear stress using the relationship (Nguyen
and Boger 1983):
τπ⎟⎟⎠
⎞⎜⎜⎝
⎛+=31
2
3
v
vv
dhdT …(15)

13
Table 1. Vane-and-cup combinations with associated gap widths and cup-to-vane diameter ratios, dc/dv.
Combination Vane dimensions Cup dimensions Gap width
dc/dv hv (mm) dv (mm) hv (mm) dv (mm) (mm)
A 30 14 47 15 1 1.1
B 30 14 60 28 7 2.0
C 42 28 80 30 1 1.1
D 42 28 105 60 16 2.1 E 42 28 95 85 28.5 3.0
F 42 28 200 118 45 4.2
G 42 28 78 32 2 1.1
H 50 15 78 32 8.5 2.1 I 40 10 78 32 11 3.2
J 40 10 80 41.5 15.8 4.2
In the case of coagulated titania, the samples were pre-sheared for 60 s at 100 s-1
followed by a 300 s rest period. Between successive applied stresses, the coagulated alumina
samples were sheared vigorously by hand with a spatula and then tapped on the bench to
remove air bubbles before inserting the vane and waiting 20 minutes to reach thermal
equilibration. Flocculated suspensions were replaced with new samples between each
applied stress.
4 Results and Discussion
The creep results for the coagulated titania with two diameter ratios are presented first,
followed by the results for coagulated and flocculated alumina in four different diameter
ratios.
4.1 Coagulated Titania
Large Diameter Ratio (dc/dv = 2.0)
The raw data of creep angle as a function of time for applied stresses between 30 and 80
Pa for the coagulated titania sample is presented in Figure 4(a), with the corresponding plot
of rotational rate versus time shown in Figure 4(b) (the rotational rate was calculated from a
3-point running average over the angular displacement data). The coagulated titania in the
2.0 diameter ratio showed instantaneous elasticity convoluted with inertia (as signified by θ
∝ t2) up to about 0.2 s, followed by retarded elastic deformation. The retarded elasticity
became less pronounced at stresses closer to yielding (for example the 50 and 55 Pa angles

14
only increased by 30% beyond 0.3 s compared with 160% at 30 Pa). At stresses less than 55
Pa, the samples did not yield within the experimental timeframe of 50 s, although there was
some creeping flow at the higher two stresses (50 and 55 Pa) – this could have been wall slip
perhaps, albeit much diminished in effect because of the wide gap. Above 60 Pa, the material
showed instantaneous viscous flow. In the narrow stress range between 56 and 60 Pa, the
material exhibited time-dependent yielding, with a maximum measured yield time of about
20 s at 56 Pa.
Small Diameter Ratio (dc/dv = 1.1)
The coagulated titania was also tested using a small diameter ratio geometry as
recommended by rheometer manufacturers. The vane diameter was the same as above (dv =
14 mm) but the cup was smaller (dc = 15.4 mm), leading to a cup-to-vane diameter ratio of
1.1. The creep angle and rotational rate results for the coagulated titania in the narrow gap
are shown in Figure 5. A linear plot of angle is shown in Figure 6 for an alternative
perspective.
Since the cup was not roughened, it was expected to see evidence of slip at the cup wall
and it was immediately apparent that the small diameter ratio results were more complicated
than the large ratio results.
- The initial inertia and instantaneous deformation were much reduced.
- At the lowest stress (30 Pa), the titania had solid-like retarded viscoelasticity, similar
to the Standard Linear Solid behaviour in Figure 2.
- Next, at 40 to 46 Pa, the samples flowed at very slow rates, which was likely due to
wall slip.

15
Figure 4: (a) Angular displacement and (b) Rotational rate as functions of time for creep testing of
coagulated titania in a cup-to-vane diameter ratio of 2.0
0.001
0.01
0.1
1
10
100
0.01 0.1 1 10 100
Ang
ular
Dis
plac
emen
t, θ
(rad
)
Time, t (s)
1:1
2:1
0.00001
0.0001
0.001
0.01
0.1
1
10
100
0.01 0.1 1 10 100
Rot
atio
nal R
ate,
ω(r
ad/s
)
Time, t (s)
1:1
(a)
(b)

16
Figure 5: (a) Angular displacement and (b) Rotational rate as functions of time for creep testing of
coagulated titania in a cup-to-vane diameter ratio of 1.1
0.0001
0.001
0.01
0.1
1
10
100
0.01 0.1 1 10 100
Ang
ular
Dis
plac
emen
t, θ
(rad
)
Time, t (s)
1:1
2:1
(a)
0.0001
0.001
0.01
0.1
1
0.01 0.1 1 10 100
Rot
atio
nal R
ate,
ω(r
ad/s
)
Time, t (s)
1:1
(b)

17
- Above that (47 to 52 Pa), there were various stick-slip events combined with
viscoelasticity. The slope at longer times was less than 1 on a logarithmic plot,
indicating that steady-state viscous flow was not achieved.
- For stresses between 53 and 60 Pa, the coagulated titania initially showed retarded
viscoelasticity before a sudden increase in displacement from about 0.08 rad to 0.5
rad at some time between 1 and 10 s. However, the material did not continue to flow,
instead returning to retarded viscoelastic behaviour. The tests then showed
subsequent yielding and stick-slip events. Presumably the suspension was yielding at
the wall rather than in the bulk.
- For stresses 65 Pa and above, the suspension yielding almost instantaneously,
although the rotational rate was not steady.
Figure 6: Linear plot of angular displacement as a function of time for creep testing of coagulated
titania in a cup-to-vane diameter ratio of 1.1
Comparison between cup-to-vane diameter ratios
In order to account for the different geometries, the linear approximation given by Eq. 9
was used to calculate the apparent strain, which was divided by the stress to give the apparent
compliance. A selection of results between 40 and 60 Pa are shown in Figure 7. There was
stress dependence to the compliance such that the suspension rheology was non-linear at
0
0.2
0.4
0.6
0.8
1
1.2
1.4
1.6
1.8
2
0 10 20 30 40 50
Ang
ular
Dis
plac
emen
t, θ
(rad
)
Time, t (s)
80 Pa70 Pa65 Pa60 Pa59 Pa58 Pa57 Pa56 Pa55 Pa54 Pa53 Pa52 Pa50 Pa49 Pa48 Pa47 Pa46 Pa45 Pa40 Pa30 Pa

18
these stresses. Whilst this contradicted the use of the linear approximation, the linear
conversion at least gave a first-order comparison of the narrow and wide gaps.
Figure 7: Apparent compliance for a selection of creep stresses for coagulated titania in both small and
large diameter ratios
The large diameter ratio creep behaviour was relatively straightforward for this sample,
with instantaneous deformation followed by retarded elasticity at low stresses (40, 50 and 55
Pa) and instantaneous and retarded elasticity followed by time dependent yield over a narrow
stress range (56 to 60 Pa). The small diameter ratio creep behaviour was much more
complicated with limited instantaneous elasticity, extended retarded viscoelasticity and long-
term flow at low stresses (40 Pa). Stresses 47 Pa and above showed multiple yielding events
followed by retarded deformation.
56 Pa was the lowest stress that showed yielding in the large cup, whereas the behaviour
was consistent with yielding or slipping at the cup wall at 47 Pa vane stress for the small
diameter ratio. Based on the 1/r2 dependency for stress, the wall stress in the narrow gap was
41 Pa for a vane stress of 47 Pa. Thus, the apparent adhesive to cohesive yield stress ratio
was 0.73, which was consistent with the notion of wall yielding or adhesive failure occurring
at significantly lower stresses than within the bulk (or cohesive failure) (Buscall et al. 1993;
Grenard et al. 2014; Saak et al. 2001; Walls et al. 2003). Applying Eq. 3 gave a critical cup-
to-vane diameter ratio of 1.17.
0.0001
0.001
0.01
0.1
1
10
0.01 0.1 1 10 100
App
aren
t Com
plia
nce,
J(t)
(1/P
a)
Time, t (s)
1.1x 60 Pa2.0x 60 Pa1.1x 56 Pa2.0x 56 Pa1.1x 55 Pa2.0x 55 Pa1.1x 50 Pa2.0x 50 Pa1.1x 40 Pa2.0x 40 Pa
dc/dv

19
4.2 Coagulated Alumina
Creep testing of the coagulated alumina was performed using four different cup sizes
over stresses ranging from 1 to 150 Pa. The tests at 1 Pa were at the limit of sensitivity and
were removed from the graphs here for the sake of clarity. The apparent compliance was
calculated from J(t) = γ(t)/τ, where the apparent linear strain was given by Eq. 10. Due to a
higher data collection rate compared to the previous coagulated titania results, the rotational
rate was calculated using a running average over 11 points. Rotational data for early time
creep ringing at low stresses have been removed.
dc/dv = 4.2
The apparent compliance and rotational rate results for coagulated alumina in the largest
diameter ratio are presented in Figure 8(a) and (b) respectively.
- At the lower stresses from 5 to 70 Pa, the results initially showed creep ringing (up to
about 3 s for). The ringing was followed by retarded viscoelastic behaviour. The
results at 5, 10 and 25 Pa were very similar, suggesting linear behaviour (that is, no
stress dependence of the compliance). Non-linearity, through softening of the
retarded elasticity, began to appear at 40 Pa.
- At higher stresses but still below yielding (85 to 113 Pa), the samples showed greater
instantaneous deformation followed by gradual retarded deformation, with the creep
angle roughly doubling compared to orders of ten times bigger at lower stresses. The
instantaneous deformation was convoluted with inertia, as signified by J ∝ t2 and ω ∝
t, which extended to about 0.05 s. Interestingly, the 110 and 113 Pa tests looked like
they were about to yield between 100 to 200 s, showing an increase in rate, but they
did not yield and continued to show solid-like creep. This may have been due to rate-
dependent hardening of the suspension at decreasing strain-rates (Buscall et al.
2014a).
- At 115 Pa and greater, the results showed instantaneous deformation, some retarded
deformation and then time-dependent yield to steady-state flow. By 150 Pa, the yield
was essentially instantaneous. The rotational rate showed a gradual increase over the
experimental timeframe and did not reach steady-state within 1000 s.

20
Figure 8: (a) Apparent compliance and (b) Rotational rate as functions of time for creep testing of
coagulated alumina in a wide gap (dc/dv = 4.2)
0.0000001
0.000001
0.00001
0.0001
0.001
0.01
0.1
1
10
100
0.001 0.01 0.1 1 10 100 1000
Rot
atio
nal R
ate,
ω(r
ad/s
)
Time, t (s)
1:1
0.000001
0.00001
0.0001
0.001
0.01
0.1
1
10
100
0.001 0.01 0.1 1 10 100 1000
App
aren
t Com
plia
nce,
J(1
/Pa)
Time, t (s)
1:1
2:1
(a)
(b)

21
dc/dv = 3.0
The creep behaviour in the 3.0x diameter ratio was very similar to the 4.2x ratio and is
therefore not presented for brevity. The same non-linear softening began to appear at 40 Pa.
Time-dependent yield was observed at 113 Pa compared with 115 Pa in 4.2x ratio. There
was no evidence of slip.
dc/dv = 2.1
The results for coagulated alumina in a cup-to-vane diameter ratio of 2.1 began to show
notable differences compared to the 3.0x and 4.2x ratios (see Figure 9).
- The low stress results from 5 to 85 Pa showed the same creep ringing and retarded
viscoelasticity as the wider gaps. However, the 2.1x ratio results were linear to
higher stresses (up to 55 Pa).
- The 85 and 100 Pa results for the 2.1x ratio did not show the same increased
instantaneous deformation and softening of the retardation as observed in the larger
diameter ratios.
- At 115, 120 and 130 Pa, the suspension continued to show significant retarded
deformation prior to time-dependent yielding. The retarded deformation was similar
to inertia with J ∝ t2, but only after an initial delay.
dc/dv = 1.1
The apparent compliance and rotational rate results for the coagulated alumina in the
smallest cup-to-vane diameter ratio are shown in Figure 10(a) and (b) respectively. The tests
included two repeat measurements at 110 and 100 Pa.
- The low stresses (5 to 85 Pa) showed creep ringing (up to 3 s for 5 Pa) followed by
retarded viscoelasticity. The results started to become non-linear at 40 Pa.
- The tests at 95 Pa, 97 Pa and 100 Pa (2) exhibited similar behaviour to 100 Pa for the
2.1x ratio with reduced instantaneous deformation compared to the wider gaps.

22
Figure 9: (a) Apparent compliance and (b) Rotational rate as functions of time for creep testing of
coagulated alumina in a wide gap (dc/dv = 2.1)
0.0000001
0.000001
0.00001
0.0001
0.001
0.01
0.1
1
10
100
0.001 0.01 0.1 1 10 100 1000
Rot
atio
nal R
ate,
ω(r
ad/s
)
Time, t (s)
1:1
0.000001
0.00001
0.0001
0.001
0.01
0.1
1
10
100A
ppar
ent C
ompl
ianc
e, J
(1/P
a)1:1
2:1
(a)
(b)

23
Figure 10: Apparent compliance as a function of time for creep testing of coagulated alumina in a narrow
gap (dc/dv = 1.1). (1) and (2) refer to repeats at the same stress
0.0000001
0.000001
0.00001
0.0001
0.001
0.01
0.1
1
10
100
0.001 0.01 0.1 1 10 100 1000
Rot
atio
nal R
ate,
ω(ra
d/s)
Time, t (s)
1:1
0.000001
0.00001
0.0001
0.001
0.01
0.1
1
10
100
1000A
ppar
ent C
ompl
ianc
e, J
(1/P
a)1:1
2:1
(a)
(b)

24
- The material yielded at 100 Pa and above. This was significantly lower than the 113
– 115 Pa measured in the larger diameter ratios and consistent with slip at the cup
wall. The transient behaviour was also phenomenologically different to the wider
gaps. There were no clear yielding events, rather reduced instantaneous deformation
followed by un-steady flow. The delayed deformation suggested that slip had to
occur at the cup wall before the suspension could flow. The rate for 105 Pa appeared
to jam briefly at around 20 s, which could have been a wall artefact. Only the 120 Pa
and 150 Pa tests reached steady-state.
It was difficult to get reproducible measurements in the small diameter ratio geometry, as
evidenced by the repeated experiments at 100 and 110 Pa. The sample yielded for one test at
100 Pa (1) but not for the other (2). Likewise, the two tests at 110 Pa showed variable
behaviour. This is in contrast to the larger ratio results that showed excellent progression
through the stresses. All possible precautions were made to minimise experimental
variability including concentration changes due to evaporation.
The coagulated alumina in the smaller two diameter ratios showed the same delayed
deformation seen in the narrow gap results for the coagulated titania, although there was not
the same dramatic oscillation in the rotational rate upon slipping. There were only small
indications of the stick-slip behaviour in the alumina data that were so pronounced in the
titania results. Likewise the low stress results did not show long term creep, although this
may have been the short time scale of the titania experiments. In both cases, the cup wall was
clearly influencing the suspension behaviour before and upon yielding.
Analysis of Coagulated Alumina Data
Given a wall yield stress of 100 x (14/15)2 = 87 Pa and a bulk yield stress of 115 Pa, the
ratio of the adhesive to cohesive yield stresses was 0.76 for the coagulated alumina. The
critical cup-to-vane diameter ratio given by Eq. 3 was 1.15. This was similar to the 1.17 for
the coagulated titania. However, one of the trends identified in the coagulated alumina data
was that the 2.1x ratio had significantly reduced instantaneous deformation at stresses closer
to yielding, suggesting the cup wall was not only affecting the yielding behaviour, but also
the viscoelastic behaviour prior to yielding.
To illustrate, the creep angles at the start and finish of the experiments were extracted
from the results. The early time, chosen to represent the instantaneous deformation θi, was
selected as 0.1 s, a time where the quadratic dependency due to inertia was diminished. The
25
angle at 1000 s was assumed to be the steady-state creep angle θ∞. The time-dependency of
the creep tests was characterised by a retardation time, tr, which was determined empirically
from the ‘half-life’ t½ taken to reach half the deformation between the instantaneous and
steady-state deformations, i.e. tr = t½/ln(2), where θ(t½) = ½(θi + θ∞).
The apparent linear strain and moduli were calculated using the linear approximation
(Eq. 9). A running 3 point average power-law index was then calculated, allowing the real
strain and moduli to be calculated using Eq. 10. This was then fitted using the modified
Cross model (Eq. 11), giving G0, γy (or τy) and n. In order to then demonstrate the accuracy
of the extracted parameters, the model was used in a finite difference numerical scheme to re-
predict the creep angle.
For the smaller two diameter ratios, the analysis gave a modulus with an asymptotic
index of close to -1 (± 0.05). In these cases, it was much simpler to fit the exact solution for
creep angle as a function of stress for n = -1 (see Eq. 13) and directly extract G0 and γy (or τy).
The results for the instantaneous deformation are shown in Figure 11 with the modified
Cross model parameters given in Table 2. The creep angle data was initially linear with
stress, as illustrated by the dotted lines. The fitted zero strain moduli G0,i varied from 90 to
270 kPa, although the low strain data were somewhat suspect due to experimental sensitivity
and creep ringing. Gi was not expected to increase with strain for the 2.1x ratio, for example.

26
Figure 11: (a) Instantaneous creep angle θ i = θ(0.1 s) as a function of stress and (b) instantaneous
modulus as a function of instantaneous strain for coagulated alumina in various cup-to-vane diameter
ratios. The modified Cross model had either variable n or fixed n = -1.
0.000001
0.00001
0.0001
0.001
0.01
0.1
1
1 10 100 1000
Inst
anta
neou
s C
reep
Ang
le, θ
i(ra
d)
Creep Stress, τv (Pa)
4.2 @ 0.1 s4.2 Gi (n = -0.90)3.0 @ 0.1 s3.0 Gi (n = -0.89)2.1 @ 0.1 s2.1 Gi (n = -1)1.1 @ 0.1 s1.1 Gi (n = -1)
dc/dv
Linear @ Low stress
Strain softening
Yielding and
Inertia
10
100
1000
10000
100000
1000000
0.00
001
0.00
01
0.00
1
0.01 0.1 1 10
Inst
anta
neou
s M
odul
us, G
i(P
a)
Instantaneous Strain, γi (-)
(a)
(b)

27
Table 2: Modified Cross model fit parameters (see Eq. 11) for instantaneous modulus as a function of
instantaneous strain for coagulated alumina in various cup-to-vane diameter ratios
dc/dv G0,i (Pa) γy,i τy,i (Pa) ni
1.1 92224 1.05 x 10⁻³ 97.1 -1
2.1 271648 4.05 x 10⁻⁴ 110 -1
3.0 172774 2.69 x 10⁻⁴ 46.5 -0.887
4.2 267516 1.42 x 10⁻⁴ 38.1 -0.896
As the strain increased, inter-particle bonds started being broken rather than just stretched
or compressed and the modulus began to decrease. The onset of strain softening differed for
the 4.2x and 3.0x diameter ratios compared to the 2.1x and 1.1x ratios. The 4.2x and 3.0x
ratios showed critical strains about 0.0002 (corresponding to stresses about 40 Pa) followed
by asymptotic power-law behaviour with an index of -0.9, whereas the 1.1x and 2.1x data
began softening at higher stresses and strains with a strain softening slope of -1. In the
softening region, the smaller two diameter ratios appeared stiffer with a higher modulus than
the larger ratios up until a strain of 1.
This material yielded at strains of order 1, indicating ‘cage melting’ or steric hindrance as
the yielding mechanism (Koumakis and Petekidis 2011; Pham et al. 2008) compared with
bond breaking, which would lead to yielding at much lower strains. Strains greater than 1
were typical for the highest stresses that had presumably yielded instantaneously (< 0.1 s) and
the deformation was no longer governed by just the material elasticity; the data in these cases
were not included in the model fitting.
The suspensions deformed viscoelastically with time. The steady-state deformation
results taken at 1000 s are shown in Figure 12 with the model parameters given in Table 3.
The steady-state modulus showed similar trends to the instantaneous modulus, with the
smaller diameter ratios having a higher modulus than the larger ratios up until strains of about
1. The strain softening indices for the larger diameter ratios were -0.83 and -0.9 whereas the
smaller ratios were still at -1.

28
Figure 12: (a) Steady-state creep angle θ∞ = θ(1000 s) as a function of stress and (b) steady-state modulus
as a function of steady-state strain for coagulated alumina in various cup-to-vane diameter ratios. The
modified Cross model had either variable n or fixed n = -1
0.00001
0.0001
0.001
0.01
0.1
1
1 10 100 1000
Ste
ady-
stat
e C
reep
Ang
le, θ
(rad
)
Creep Stress, τv (Pa)
4.2 @ 1000 s4.2 Ginf (n = -0.90)3.0 @ 1000 s3.0 Ginf (n = -0.83)2.1 @ 1000 s2.1 Ginf (n = -1)1.1 @ 1000 s1.1 Ginf (n = -1)
dc/dv
10
100
1000
10000
0.00
01
0.00
1
0.01 0.1 1 10
Ste
ady-
Sta
te M
odul
us, G
∞(P
a)
Steady-State Strain, γ∞ (-)
(a)
(b)
29
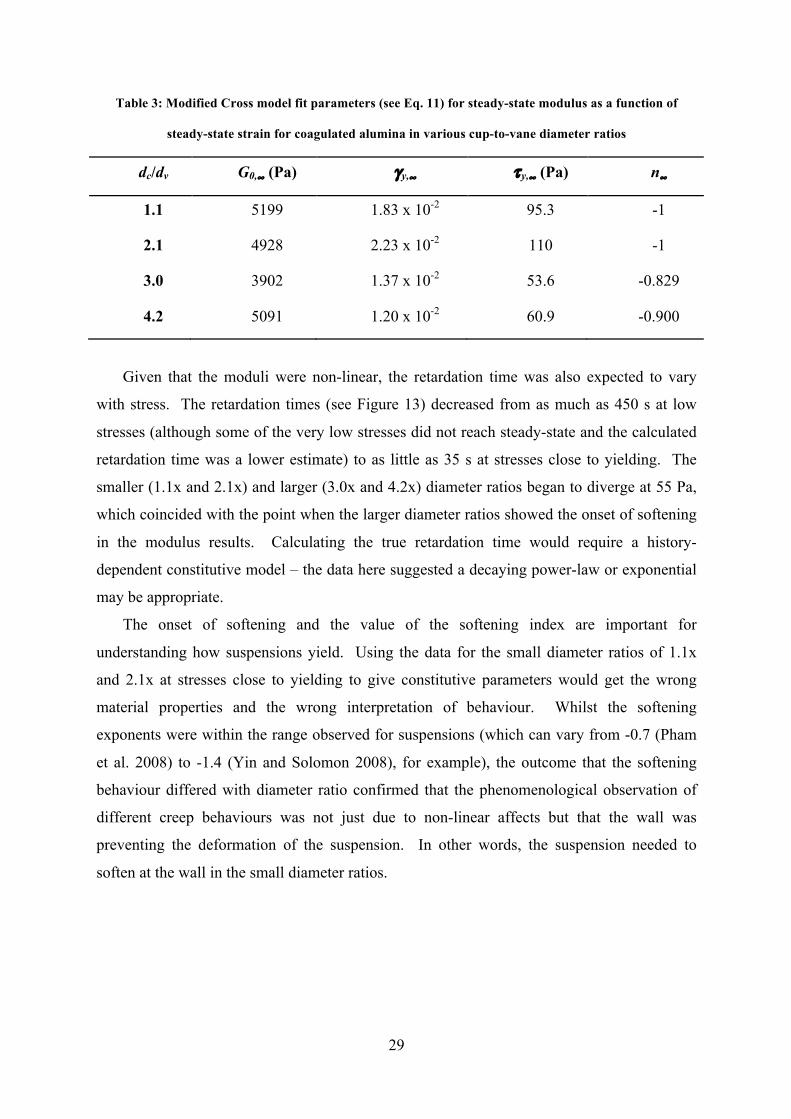
Table 3: Modified Cross model fit parameters (see Eq. 11) for steady-state modulus as a function of
steady-state strain for coagulated alumina in various cup-to-vane diameter ratios
dc/dv G0,∞ (Pa) γy,∞ τy,∞ (Pa) n∞
1.1 5199 1.83 x 10⁻² 95.3 -1
2.1 4928 2.23 x 10⁻² 110 -1
3.0 3902 1.37 x 10⁻² 53.6 -0.829
4.2 5091 1.20 x 10⁻² 60.9 -0.900
Given that the moduli were non-linear, the retardation time was also expected to vary
with stress. The retardation times (see Figure 13) decreased from as much as 450 s at low
stresses (although some of the very low stresses did not reach steady-state and the calculated
retardation time was a lower estimate) to as little as 35 s at stresses close to yielding. The
smaller (1.1x and 2.1x) and larger (3.0x and 4.2x) diameter ratios began to diverge at 55 Pa,
which coincided with the point when the larger diameter ratios showed the onset of softening
in the modulus results. Calculating the true retardation time would require a history-
dependent constitutive model – the data here suggested a decaying power-law or exponential
may be appropriate.
The onset of softening and the value of the softening index are important for
understanding how suspensions yield. Using the data for the small diameter ratios of 1.1x
and 2.1x at stresses close to yielding to give constitutive parameters would get the wrong
material properties and the wrong interpretation of behaviour. Whilst the softening
exponents were within the range observed for suspensions (which can vary from -0.7 (Pham
et al. 2008) to -1.4 (Yin and Solomon 2008), for example), the outcome that the softening
behaviour differed with diameter ratio confirmed that the phenomenological observation of
different creep behaviours was not just due to non-linear affects but that the wall was
preventing the deformation of the suspension. In other words, the suspension needed to
soften at the wall in the small diameter ratios.

30
Figure 13: Retardation times for coagulated alumina in various cup-to-vane diameter ratios
(calculated from the half-life of the decay from 0.1 s to 1000 s)
4.3 Polymer-Flocculated Alumina
Creep tests were performed on polymer-flocculated alumina in order to investigate if a
different category of strongly-flocculated suspension behaved in a similar manner as the ‘pH’
coagulated systems. A separate settling experiment was performed to prepare the sample in
each case to minimise shear degradation. The tests were performed at four different cup-to-
vane diameter ratios at stresses of 10, 50 and 80 Pa, with each test requiring a separate batch
settling experiment due to the shear-sensitive network.
The angular displacement results are shown in Figure 14. Although the 80 Pa tests did
pass relatively large angles, which suggested they were close to yielding, the stresses were all
below yielding. The tests showed inertia and creep ringing in some cases, then retarded
viscoelastic behaviour. A difference between the cup-to-vane diameter ratios emerged at 80
Pa. The two larger diameter ratios showed significant instantaneous deformation followed by
long-term creep, whereas the 1.1x and 2.1x diameter ratios did not show the same increase in
instantaneous deformation. The ratios of the creep angles at 1000 s and 0.1 s are shown in
Figure 15, along with the retardation time as calculated from the half-life. The larger
diameter ratios had smaller relative retardation. For example, the angle ratio at 80 Pain the
4.2x case was 9.97 whereas it was 105 in the 2.1x test, more than an order of magnitude
10
100
1000
1 10 100 1000
Ret
arda
tion
Tim
e, t r
(s)
Creep Stress, τv (Pa)
4.23.02.11.1
dc/dv

31
different. The retardation time generally decreased with increasing stress, with shorter times
for the larger diameter ratios at 80 Pa. There was an anomalous result that the 3.0x angular
displacement was greater than for the 4.2x, which may be a reflection of the difficulty of
preparing polymers solutions at the same state of ageing.
With only three values for each diameter ratio, analysis using the modified Cross model
was difficult and very subjective. Therefore, the analysis was limited to the simpler linear
approximation. The apparent linear moduli were calculated as a function of strain from the
angles at 0.1 s and 1000 s (see Figure 16). The results for all the diameter ratios except 1.1x
were in good agreement, except Gi at 80 Pa for 2.1x. The 1.1x diameter ratio had higher
instantaneous moduli, suggesting that it was stiffer than it should have been. The slopes at
larger strains were Gi ∝ γ-0.877 and G∞ ∝ γ-0.806, although there was not enough data to
conclude whether these values were asymptotic or whether there was a difference between
the diameter ratios. The steady-state strains at 80 Pa approached order 1, which suggested
polymer-flocculated systems also had ‘cage-melting’ yielding.
Thus, the limited data for the polymer-flocculated alumina showed some of the same
trends as the coagulated alumina sample at stresses below yielding, with increased
instantaneous deformation followed by faster and relatively smaller retarded deformation for
the larger diameter ratios. This indicates that wall effects on pre-yield viscoelasticity may
manifest for all strongly-flocculated suspensions.
It was noted that each creep test on the flocculated alumina settled slightly by the end of
the test (< 1 mm). Since the suspension had already settled to equilibrium, the additional
settling after the application of shear stress indicated synaereses of the flocculated network,
similar to the shear-densification seen in flocs at concentrations below the gel point (van
Deventer et al. 2011). The shear stress was insufficient to yield the suspension in shear but
large enough to locally densify the network.

32
Figure 14: Angular displacement as a function of time for creep testing of polymer flocculated
alumina in four cup-to-vane diameter ratios
0.00001
0.0001
0.001
0.01
0.1
1
0.00
01
0.00
1
0.01 0.1 1 10 100
1000
1000
0
Ang
ular
Dis
plac
emen
t, θ
(rad)
Time, t (s)
80 Pa50 Pa10 Pa
τv
(d) dc/dv = 4.2
0.00001
0.0001
0.001
0.01
0.1
1
0.00
01
0.00
1
0.01 0.1 1 10 100
1000
1000
0
Ang
ular
Dis
plac
emen
t, θ
(rad
)
Time, t (s)
80 Pa50 Pa10 Pa
τv
(c) dc/dv = 3.2
80 Pa50 Pa10 Pa
(b) dc/dv = 2.1
τv
0.00001
0.0001
0.001
0.01
0.1
1A
ngul
ar D
ispl
acem
ent, θ
(rad
)
80 Pa50 Pa10 Pa
τv
(a) dc/dv = 1.1

33
Figure 15: Retardation times and ratios of infinite to instantaneous creep angles for polymer-flocculated
alumina in various cup-to-vane diameter ratios. θ i = θ(0.1 s), θ∞ = θ(1000 s), θ(t½) = ½(θ i + θ∞)
Figure 16: Instantaneous and infinite moduli and strain for polymer-flocculated alumina in various
cup-to-vane diameter ratios. Gi and γ i were calculated from θ(0.1 s) while G∞ and γ∞ were calculated
from θ(1000 s), both using a linear approximation
1
10
100
1000
0 50 100
Ret
arda
tion
Tim
e, t r
(s)
or A
ngle
Rat
io, θ
∞/θi(
-)
Creep Stress, τv (Pa)
4.2 tr3.2 tr2.1 tr1.1 tr4.2 angle ratio3.2 angle ratio2.1 angle ratio1.1 angle ratio
dc/dv
tr
θ∞ / θi
10
100
1000
10000
100000
1000000
10000000
0.00
0001
0.00
001
0.00
01
0.00
1
0.01 0.1 1 10
Line
ar M
odul
us, G
(Pa)
Linear Strain, γ (-)
4.2 Gi
3.2 Gi
2.1 Gi
1.1 Gi
4.2 Ginf
3.2 Ginf
2.1 Ginf
1.1 Ginf
dc/dv
n = -0.88
n = -0.81

34
5 Conclusions
Understanding the shear rheology of strongly-flocculated suspensions and improving
current viscoplastic constitutive descriptions are important steps for improved prediction of
suspension processing. In order to provide an enriched constitutive description, it is vital to
have experimental data that are free from artefacts caused by the measurement geometry.
The vane-in-infinite-cup geometry minimises wall effects by design. The aim of this work
was to investigate the ratio of cup to vane diameter at which wall effects were minimised.
The results in this exploratory work showed consistent behaviour in larger diameter ratios
across all three model systems, with linear viscoelasticity at low stresses, increased
instantaneous compliance or non-linear strain softening at stresses closer to yielding, time-
dependent yield over a range of stresses and finally instantaneous flow.
In contrast to the large diameter ratio results, the small diameter ratios showed a range of
behaviours attributed to anomalous suspension behaviour at or near the cup wall. The
coagulated titania and alumina at a diameter ratio of 1.1x showed yielding and subsequent
slip at the wall, which indicated that the adhesive or wall yield stress was less than the
cohesive or bulk yield stress. The apparent adhesive to cohesive yield stress ratios of 0.73
and 0.76 for the two coagulated suspensions here were used to estimate critical cup-to-vane
diameter ratios of 1.17 and 1.15 to avoid wall slip. It is very important to realise though that
the adhesive to cohesive yield stress ratio is likely to vary from one suspension to another and
to depend upon the nature of the wall. For example, plastic walls might give lower adhesive
to cohesive yield stress ratios and higher critical diameter ratios for aqueous mineral systems
compared to metal walls, perhaps.
In addition to slip, the cup wall was observed to affect the pre-yield viscoelastic
behaviour at cup-to-vane diameter ratios of 2.0x and 2.1x for the coagulated and polymer-
flocculated alumina. In general, the suspensions appeared stiffer at stresses closer to yielding
in the smaller diameter ratios. Analysis of the instantaneous and steady-state moduli for the
coagulated alumina system using a modified Cross equation showed that the softening
exponents decreased whereas the ratio of creep angles increased. Use of the small diameter
ratio results to extract viscoelastic parameters (Gi, Gr and tr from the SLS model as a
minimum) would be incorrect by over an order of magnitude and mislead efforts to
understand suspension rheology.
The strain softening behaviour of suspensions would not be expected to show constant
softening index behaviour across all strains due to complex interactions at multiple length
35
scales. For example, non-linear stretching and compression of inter-particle bonds could lead
to strain hardening between the linear and softening regions. At higher deformations, rate-
dependent viscous forces must also come into play. However, for a simple model with only
three parameters, the modified Cross equation (especially the exact solution for n = -1)
provided a good method of analysing the non-linear behaviour of the instantaneous and
steady-state data.
The conclusion from this work was that artefact-free experimental results for studying the
yielding behaviour of strongly flocculated suspensions required a vane-in-cup geometry with
a minimum cup-to-vane diameter ratio of 3, although this value is conservative and must be
dependent on the material. Based on this, existing creep results in the literature using a range
of configurations with smaller diameter ratios and smooth tools may require reinterpretation.
Although premature or adhesive wall yielding and slip can be eliminated by means of
wide gaps, their use is far from ideal in other regards as data analysis or inversion is then
problematic, given non-linear viscoelasticity. It would be preferable arguably to use
roughened cylinders and narrow gaps, although the problem then is to determine how rough
the outer surface needs be to in order to cope with any material of interest. There is a need
for more systematic work clearly, which could for example involve the use of splined outer
cylinders in combination with a range of inner geometries, including a splined cylinder, a
vane and a series of smooth cylinders of differing materials of construction. From data
obtained using such it should then be possible to reconstruct what would be expected with a
vane in wide and narrow smooth cylinders. More generally, the aim would be to determine
the adhesive to cohesive yield stress ratio for a range of suspensions and materials in order to
see how much it varies typically.
Notation
Latin alphabet
d Diameter, m
h Height, m
G Modulus, Pa
r Radial position, m
t Time, s
Greek alphabet

36
γ Strain, -
θ Angular displacement, rad
τ Shear stress, Pa
ω Rotational rate, rad/s
Subscripts
c Cup
i Instantaneous
r Retarded
v Vane
∞ Infinity
Acknowledgements
The authors thank Daniel Lester for insightful discussions. Ashish Kumar was supported
in this work by an Australian Postgraduate Award through the Australian Research Council.
Tiara Kusuma was funded by a Melbourne International Research Scholarship through The
University of Melbourne. Infrastructure support at Melbourne was provided by the Particulate
Fluids Processing Centre, a Special Research Centre of the Australian Research Council.
Simon Biggs acknowledges the support of the Nexia Solutions University Research Alliance
for Particle Science and Technology and the University of Leeds. Simon Biggs and Amy
Tindley were supported in this work as part of the TSEC programme KNOO and are grateful
to the EPSRC for funding under grant EP/C549465/1.
References
Barnes HA (1995) A review of the slip (wall depletion) of polymer-solutions, emulsions and
particle suspensions in viscometers - its cause, character, and cure. J Non-Newtonian
Fluid Mech 56: 221-251.

37
Barnes HA, Carnali JO (1990) The vane-in-cup as a novel rheometer geometry for shear
thinning and thixotropic materials. J Rheology 34: 841-866.
Barnes HA, Hutton JF, Walters K (1989) An Introduction to Rheology. Elsevier, Amsterdam
Barrie CL, Griffiths PC, Abbott RJ, Grillo I, Kudryashov E, Smyth C (2004) Rheology of
aqueous carbon black dispersions. J Colloid Interface Sci 272: 210-217.
Baudez JC, Markis F, Eshtiaghi N, Slatter PT (2011) The rheological behaviour of digested
sludge. Water Res 45: 5675-5680.
Biggs S, Tindley A (2007) The rheology of oxide dispersions and the role of concentrated
electrolyte solutions. ICEM2007: Proceedings of the 11th International Conference on
Environmental Remediation and Radioactive Waste Management. Bruges, Belgium,
2-6 Sept 2007. 249-254
Bingham EC (1916) An investigation of the laws of plastic flow. US Bureau of Standards
Bulletin 13: 309-353.
Bird RB, Dai G, Yarusso BJ (1982) The rheology and flow of viscoplastic materials. Rev
Chem Eng 1: 1-70.
Boger DV (1999) Rheology and the minerals industry. Miner Process Extract Metall Rev 20:
1-25.
Buscall R, Choudhury TH, Faers MA, Goodwin JW, Luckham PA, Partridge SJ (2009)
Towards rationalising collapse times for the delayed sedimentation of weakly-
aggregated colloidal gels. Soft Matter 5: 1345-1349.
Buscall R, Kusuma TE, Stickland AD, Rubasingha S, Scales PJ, Teo HE, Worrall GL
(2014a) The non-monotonic shear-thinning flow of two strongly cohesive
concentrated suspensions. J Non-Newtonian Fluid Mech (in press, available online 28
Sept).
38
Buscall R, McGowan JI, Morton-Jones AJ (1993) The rheology of concentrated dispersions
of weakly attracting colloidal particles with and without wall slip. J Rheology 37:
621-641.
Buscall R, Scales PJ, Stickland AD, Teo HE, Lester DR (2014b) Dynamic and rate-
dependent yielding in model cohesive suspensions. J Non-Newtonian Fluid Mech
(submitted Sept 2014) arxiv.org/abs/1410.0179.
Coussot P, Tabuteau H, Chateau X, Tocquer L, Ovarlez G (2006) Aging and solid or liquid
behavior in pastes. J Rheology 50: 975-994.
Fisher DT, Clayton SA, Boger DV, Scales PJ (2007) The bucket rheometer for shear stress-
shear rate measurement of industrial suspensions. J Rheology 51: 821-831.
Foong J (2008) PhD Thesis: Yielding, linear and non-linear viscoelastic behaviour of
concentrated coagulated suspensions. The University of Melbourne, Melbourne, pp
385
Gibaud T, Frelat D, Manneville S (2010) Heterogeneous yielding dynamics in a colloidal gel.
Soft Matter 6: 3482-3488.
Gladman B, de Kretser RG, Rudman M, Scales PJ (2005) Effect of shear on particulate
suspension dewatering. Chem Eng Res Des 83: 933-936.
Grenard V, Divoux T, Taberlet N, Manneville S (2014) Timescales in creep and yielding of
attractive gels. Soft Matter 10: 1555-1571.
Hartnett JP, Hu RYZ (1989) Technical note: The yield stress - an engineering reality. J
Rheology 33: 671-679.
Herschel W, Bulkley R (1926) Konsistenzmessungen von Gummi-Benzollösungen. Colloid
Polymer Sci 39: 291-300.

39
Jeldres RI, Toledo PG, Concha F, Stickland AD, Usher SP, Scales PJ (2014) Impact of
seawater salts on the viscoelastic behavior of flocculated mineral suspensions.
Colloids Surf, A 461: 295-302.
Johnson SB, Franks GV, Scales PJ, Boger DV, Healy TW (2000) Surface chemistry-rheology
relationships in concentrated mineral suspensions. Int J Miner Proc 58: 267-304.
Keentok M, Milthorpe JF, Odonovan E (1985) On the shearing zone around rotating vanes in
plastic liquids - theory and experiment. J Non-Newtonian Fluid Mech 17: 23-35.
Klein CO, Spiess HW, Calin A, Balan C, Wilhelm M (2007) Separation of the nonlinear
oscillatory response into a superposition of linear, strain hardening, strain softening,
and wall slip response. Macromolecules 40: 4250-4259.
Kobelev V, Schweizer KS (2005) Strain softening, yielding, and shear thinning in glassy
colloidal suspensions. Phys Rev E 71.
Koumakis N, Petekidis G (2011) Two step yielding in attractive colloids: transition from gels
to attractive glasses. Soft Matter 7: 2456-2470.
Krieger IM, Maron SH (1952) Direct determination of the flow curves of non-Newtonian
fluids. J Appl Phys 23: 147-149.
Krieger IM, Maron SH (1954) Direct determination of the flow curves of non-newtonian
fluids. III. Standardized treatment of viscometric data. J Appl Phys 25: 72-75.
Kumar A, Stickland AD, Scales PJ (2012) Viscoelasticity of coagulated alumina suspensions.
Korea-Australia Rheology J 24: 105-111.
Le Grand A, Petekidis G (2008) Effects of particle softness on the rheology and yielding of
colloidal glasses. Rheol Acta 47: 579-590.
Leong YK, Scales PJ, Healy TW, Boger DV (1995) Effect of particle-size on colloidal
zirconia rheology at the isoelectric point. J Am Ceram Soc 78: 2209-2213.

40
Lester DR, Buscall R, Stickland AD, Scales PJ (2014) Wall adhesion and constitutive
modeling of strong colloidal gels. J Rheology 58: 1247-1276.
Liddell PV, Boger DV (1995) Yield stress measurement with the vane. J Non-Newtonian
Fluid Mech 63: 235-261.
Michaels AS, Bolger JC (1962) Plastic flow behavior of flocculated kaolin suspensions. Ind
Eng Chem Fundamen 1: 153-162.
Nguyen QD, Boger DV (1983) Yield stress measurement for concentrated suspensions. J
Rheology 27: 321-349.
Nguyen QD, Boger DV (1985a) Direct yield stress measurement with the vane method. J
Rheology 29: 335-347.
Nguyen QD, Boger DV (1985b) Thixotropic behavior of concentrated bauxite residue
suspensions. Rheol Acta 24: 427-437.
Pham K, Petekidis G, Vlassopoulos D, Egelhaaf S, Poon W, Pusey P (2008) Yielding
behavior of repulsion-and attraction-dominated colloidal glasses. Journal of Rheology
(1978-present) 52: 649-676.
Rehbinder P (1954) Coagulation and thixotropic structures. Discuss Faraday Soc 18: 151-
160.
Roylance D (2001) Engineering viscoelasticity. MIT Press, Cambridge, MA
Saak AW, Jennings HM, Shah SP (2001) The influence of wall slip on yield stress and
viscoelastic measurements of cement paste. Cement Concrete Res 31: 205-212.
Stickland AD, Burgess C, Dixon DR, Harbour PJ, Scales PJ, Studer LJ, Usher SP (2008)
Fundamental dewatering properties of wastewater treatment sludges from filtration
and sedimentation testing. Chem Eng Sci 63: 5283-5290.
ten Brinke AJW, Bailey L, Lekkerkerker HNW, Maitland GC (2008) Rheology modification
in mixed shape colloidal dispersions. Part II: mixtures. Soft Matter 4: 337-348.
41
Uhlherr PHT, Guo J, Tiu C, Zhang XM, Zhou JZQ, Fang TN (2005) The shear-induced solid-
liquid transition in yield stress materials with chemically different structures. J Non-
Newtonian Fluid Mech 125: 101-119.
Usher SP (2002) PhD Thesis: Suspension Dewatering: Characterisation and Optimisation.
Department of Chemical Engineering. The University of Melbourne, Melbourne
van Deventer BBG, Usher SP, Kumar A, Rudman M, Scales PJ (2011) Aggregate
densification and batch settling. Chem Eng J 171: 141-151.
Walls HJ, Caines SB, Sanchez AM, Khan SA (2003) Yield stress and wall slip phenomena in
colloidal silica gels. J Rheology 47: 847-868.
Yin G, Solomon MJ (2008) Soft glassy rheology model applied to stress relaxation of a
thermoreversible colloidal gel. J Rheology 52: 785-800.
Zhou ZW (2000) PhD Thesis: Rheology of metal oxide suspensions. Department of Chemcial
Engineering. The University of Melbourne, Melbourne
Zhou ZW, Scales PJ, Boger DV (2001) Chemical and physical control of the rheology of
concentrated metal oxide suspensions. Chem Eng Sci 56: 2901-2920.
Zhou ZW, Solomon MJ, Scales PJ, Boger DV (1999) The yield stress of concentrated
flocculated suspensions of size distributed particles. J Rheology 43: 651-671.