the des moines metropolitan organization - · pdf file · 2015-03-30the des moines...
TRANSCRIPT

The Des Moines Metropolitan Organization
Rail Market Analysis
January 31, 2014

Table of Contents
Project Overview ........................................................................................................ 1 Market Overview ........................................................................................................ 1 Overview of Des Moines and Iowa Market ................................................................. 2 Current Infrastructure ................................................................................................. 3
Rail Service Fundamentals. ................................................................................... 7 Transloading Design Fundamentals ....................................................................... 8
Rail Market Evaluation ............................................................................................... 9 Facility Design Parameters ...................................................................................... 15 Conclusion and Next Steps ...................................................................................... 17 Appendices .............................................................................................................. 18
Freight Analysis Framework Data ........................................................................ 18
1 ` `
Project Overview The objectives of the Des Moines Metropolitan Organization, or “the DMPO” are to evaluate and support the development of cost-competitive logistics infrastructure projects in the community in order to meet the following four goals:
1. Improve the overall freight capacity and options in the metropolitan area, 2. Develop rail centric transportation options for existing businesses, 3. Expand existing transportation options to attract new industries to the region and
support economic development, and, 4. Focus the southeast area of Des Moines to support Industrial Development, in par-
ticular its manufacturing base. More specifically, the Project team has been tasked to perform a logistical and freight movement analysis of the DMPO’s region. From this study, the volume and the value of po-tential freight will be determined, regardless of carrier or transportation mode. In order to meet this objective, the Project Team has worked closely with the DMPO to study the exist-ing freight flows by mode into and out of the region as well as evaluating actions to increase rail-served freight options for the manufacturing base and new industries.
Market Overview The first phase of the Market Analysis was a physical survey of the shippers and commodi-ties in the DMPO region, a survey of the existing rail transloads and their characteristics, and an assessment of Class 1 and Regional Railroad service, location and size. The Pro-ject Team also developed the following Goal, Strategy and Tactic for the Partnership to fo-cus market assessment efforts: Goal: Ensure economic growth for the City and Region through enhanced transpor-
tation infrastructure, if necessary, Strategy: Develop an efficient multi-modal set of transportation options for Industries in
the City and Region, Tactic: Evaluate the feasibility and construction of a Transload Facility that supports
the increased use of rail by providing competitive rail access to non-rail served Industries.
The first step in the project was to assess the existing and future market for rail logistics re-quirements in the region. Next, we determined whether the needs of existing and future rail-served businesses could be met with the existing infrastructure and, finally, if determined the existing infrastructure does not meet existing or and future demands, we will develop rec-ommendations for next steps to ensure this market need could be met, including the type of facility services which will attract the identified commodities.
2 ` `
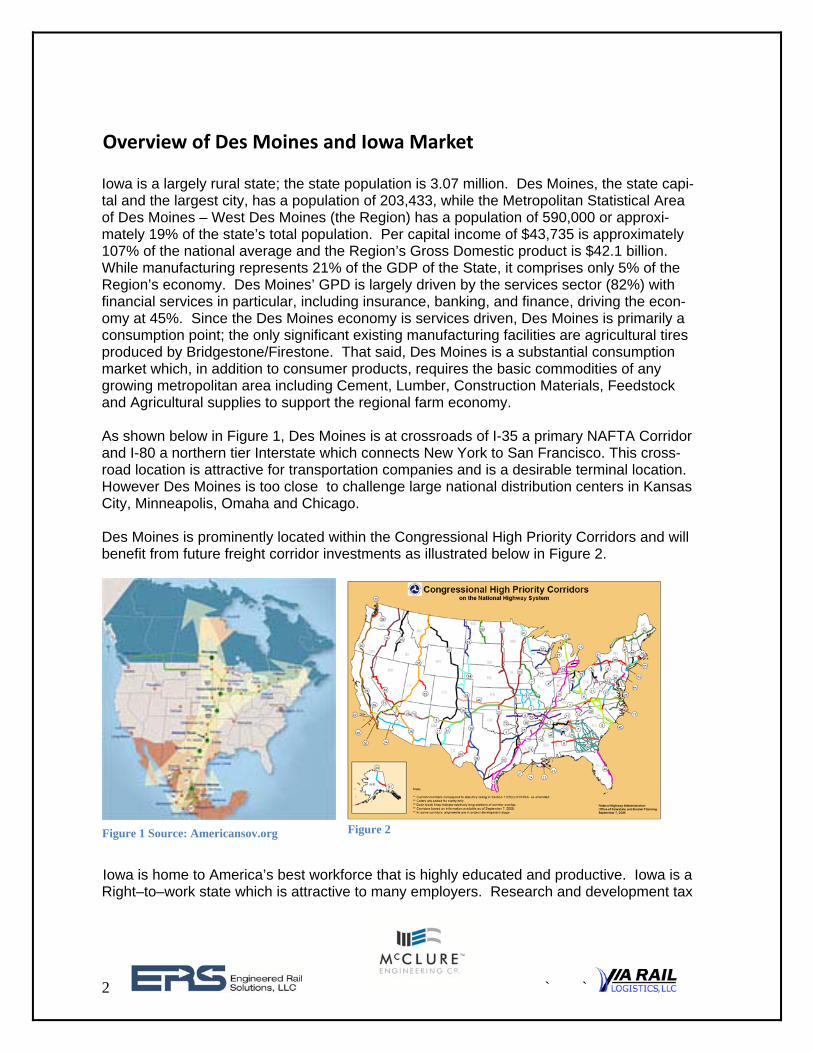
Overview of Des Moines and Iowa Market Iowa is a largely rural state; the state population is 3.07 million. Des Moines, the state capi-tal and the largest city, has a population of 203,433, while the Metropolitan Statistical Area of Des Moines – West Des Moines (the Region) has a population of 590,000 or approxi-mately 19% of the state’s total population. Per capital income of $43,735 is approximately 107% of the national average and the Region’s Gross Domestic product is $42.1 billion. While manufacturing represents 21% of the GDP of the State, it comprises only 5% of the Region’s economy. Des Moines’ GPD is largely driven by the services sector (82%) with financial services in particular, including insurance, banking, and finance, driving the econ-omy at 45%. Since the Des Moines economy is services driven, Des Moines is primarily a consumption point; the only significant existing manufacturing facilities are agricultural tires produced by Bridgestone/Firestone. That said, Des Moines is a substantial consumption market which, in addition to consumer products, requires the basic commodities of any growing metropolitan area including Cement, Lumber, Construction Materials, Feedstock and Agricultural supplies to support the regional farm economy. As shown below in Figure 1, Des Moines is at crossroads of I-35 a primary NAFTA Corridor and I-80 a northern tier Interstate which connects New York to San Francisco. This cross-road location is attractive for transportation companies and is a desirable terminal location. However Des Moines is too close to challenge large national distribution centers in Kansas City, Minneapolis, Omaha and Chicago. Des Moines is prominently located within the Congressional High Priority Corridors and will benefit from future freight corridor investments as illustrated below in Figure 2.
Figure 2
Iowa is home to America’s best workforce that is highly educated and productive. Iowa is a Right–to–work state which is attractive to many employers. Research and development tax
Figure 1 Source: Americansov.org

3 ` `
credits are available along with tax increment financing. Iowa has a favorable tax structure which is especially attractive to manufacturing start-ups. There are no sales taxes or use taxes on machinery or equipment, no property tax on new industrial machinery and equip-ment and no personal property (inventory) taxes. These favorable business climate features will help Iowa support the burgeoning manufacturing renaissance in North America.
Current Infrastructure The map on the below in Figure 3 illustrates tonnage and commodity flows along the U.S. highways, rails and waterways. Iowa is a critical state for long haul traffic, much of which passes through the state.
Figure 3
Commodity movements are a response to changing economic conditions and must be sup-ported by infrastructure which is cost competitive. Competitive infrastructure includes ade-quate service and capacities for the modes that are or could provide the Region’s industries with transportation. Transloads rely on trucking service to connect users to the rail network.

4 ` `
It is important to understand how any transload location is connected to the local and state highway network. Transloads often act as a buffer allowing users to truck product to a facili-ty where rail equipment can be loaded to maximum weight or cubic capacity loading configu-rations. Since most bulk commodities such as cereal grains, gravel, animal feed, coal or nonmetallic mineral products (Iowa’s top commodities by tonnage) are sold by the ton, recognition of truck size and weight regulations, heavy haul and oversize dimensional load corridors are important considerations for facility location. The maps following in Figure 4 illustrates Des Moines designated truck routes and posted bridges.
Figure 4
To understand the current rail transload infrastructure in the market, we evaluated the “As Is” state of rail to truck and truck to rail transload facilities in the Des Moines market, which

5 ` `
we expanded to include the entire state. Figure 5 above depicts the existing facilities throughout the state
Map of Rail Transloads – State of Iowa
Figure 5
The characteristics of the rail transload facilities included in the map on the above are fur-ther described in Table 1 on the following page:

6 ` `
Summary of Iowa Rail Transload Facilities Table 1
Currently, there is only one rail transload located in Des Moines. This facility has certain limitations due to three key issues:
1) Limited trackage is available for customers and shippers, 2) UP owns and serves the facility (no rail competition), 3) Single bulk product, plastic pellets.
City Rail Service Distance Car Spots Commodity
Burlington, IA BNSF 166 miles Southeast N/A N/A
Clinton, IA Union Pacific (UP) 198 miles East 80 Bulk
Council Bluffs, IA UP 130 miles West N/A N/A
Davenport, IA Canadian Pacific (CP) 165 miles East 25 N/A
Des Moines, IA UP 0 60 Bulk
Dubuque, IA Canadian National (CN) 200 miles East N/A Bulk
Manly, IA Iowa Northern 130 miles North 300 Bulk
Mason City, IA UP/CP 120 miles North N/A Bulk
Mount Pleasant, IA BNSF 135 miles Southeast N/A N/A
Newton, IA Iowa Interstate 40 miles East 30 Bulk
Ottumwa, IA CP 85 miles Southeast N/A N/A
Ottumwa, IA BNSF 85 miles East 23 Bulk
Waterloo, IA Iowa Northern 110 miles Northeast 15 Bulk
Sioux City, IA BNSF/UP/CN 200 miles west 50 Food products

7 ` `
These issues, the type of rail service available, the single Class 1 railroad (UP) which serves the facility and accommodation for only a single commodity all represent considerable con-straints to the Region’s shippers and create a cost disadvantage from a rail logistics per-spective as further described below:
Type of Service to UP Transload: Due to the limited track space available, only block sized trains (of 20 cars) or manifest service (fewer than 20 cars) is available. In other words, no unit train service is available because unit size train (100 cars) cannot fit into the facility. This prohibits the use of unit trains to reduce costs, in particular, for bulk commodities. Single Serving Railroad: In order to serve the region in the most economical way, rail service provided by more than one Class 1 carrier is desirable as it can provide the shippers with leverage to reduce their rates with the railroad by creating competition as well as having direct service nationwide. Multi Commodity: The facility is not a multi commodity transload. A general purpose transload can offer service to multiple industries and multiple commodities.
Based on the rail transload facilities which are currently available, the rail transload service infrastructure within Des Moines is limited and does not provided shippers with cost competi-tive rail transloading.
Rail Service Fundamentals.
The next step in our study evaluated the “as is” traffic flows by mode into and out of the market. Consideration of the type of commodities that will use and be attracted to a multi carrier served transload facility is critical to develop a design and operating plan. In parallel, it is important to know the commodity volumes to design the correct layout with adequate storage and switching capacity. Too little capability to handle a certain commodity might cause delays in unloading railcars and service degradation for the shipper and the serving Carrier. Long term service degradation and capacity constraints will reduce the attractive-ness of the facility to potential shippers. This study, completed in early 2014, summarizes current commodity distribution patterns and facilities in Des Moines and develops potential options for the Partnership to consider to meet its objectives. When a facility has only one railroad service and access, it is “closed” or “captive” and only that railroad will provide rates and service. When you “open” access, this allows multiple railroads the ability to offer service to a facility and generate a broader market reach and the possibility of competitive rail pricing. Although railroads freely interchange traffic amongst themselves nationwide, when multiple rail carriers are involved in the “line” movement of a railcar, the overall rail shipping charges are historically higher and service levels are histori-cally reduced due to extra handling of the railcar. This combination results in higher costs to the shipper, both for the rail charges and additional inventory carrying costs while the rail car is in transit. With a fixed fee to switch railcars into an “open” facility, railroads can offer much quicker pricing and competitive service for their customers.

8 ` `
Transloading Design Fundamentals
The New Transload Facility (NTF) is a greenfield site. We recommended that its design op-timize the three operations of three different industries, rail, trucking, and warehousing and considers the overall capital and operating costs of the facility. Discussions with the four serving carriers in Des Moines on a reciprocal switch arrangement must be conducted to determine interest in serving a multi carrier served facility and how the service will be per-formed, i.e., who will do the actual switching of the facility and where will railcars be inter-changed and for what Fee. The Project Team’s extensive experience in developing and op-erating transload facilities in other parts of the country provides the background for develop-ing a successful design. Ultimately, the design proposed to the Partnership will be guided by the research contained in this report, identifying the commodities and their volumes most likely to use the facility. This report is to provide an overview of the market conditions. There are also additional considerations in combination with the market analysis which drive the facility’s design. Some of these additional items are:
Integrating the objectives of the DMPO, Developing an understanding of criteria and tradeoffs in commodity handling and fa-
cility design, Reviewing commodity shipping patterns for industries in DMPO region, Identification of user support, seasonal shipping patterns and total expected volume
throughput. Potential funding partnerships Identifying the critical physical constraints and infrastructure (including surrounding
highway capacity, weight limited bridges and bridge condition, height and turning ra-dius requirements and signaling for highway access) requirements of the facility,
Assessing the integration of the different rail layouts onto the site, Developing agreement with the rail carriers serving the Region on allowing open ac-
cess to the facility Reaching agreements on service and pricing for switching Reviewing Railroad switching criteria, Reviewing support facility needs.
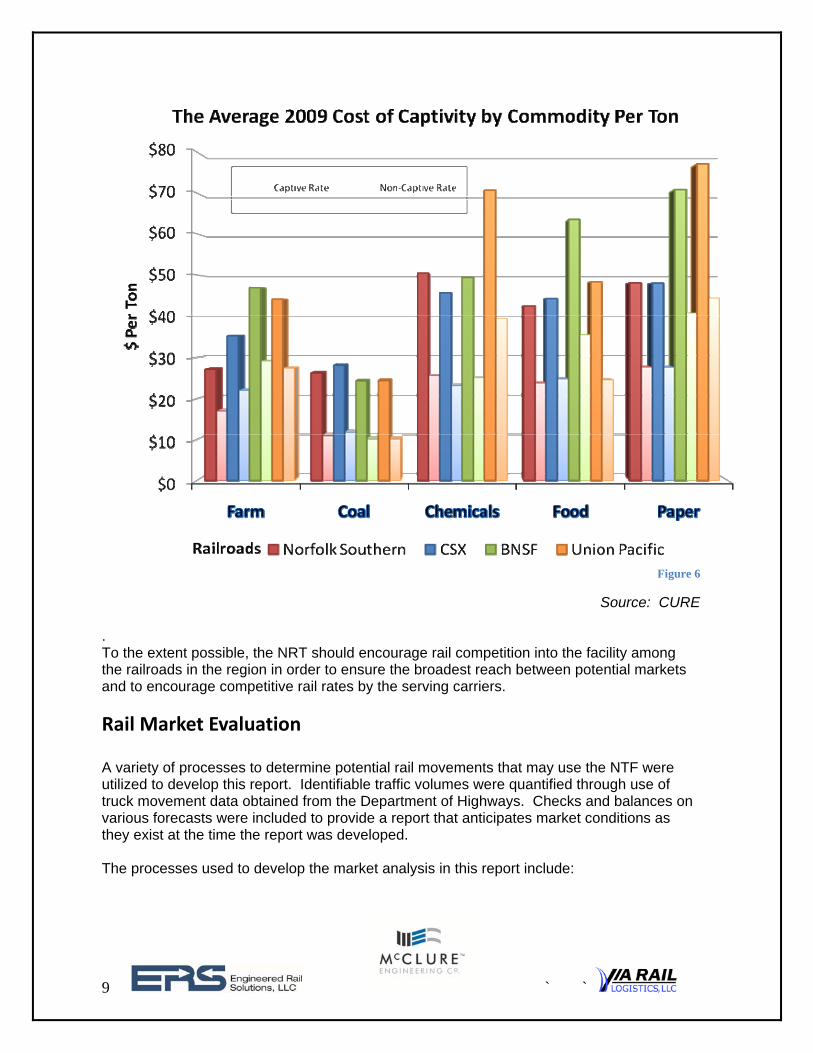
One of the key elements of a successful rail transload facility is that, where possible, it is not captive to a single railroad. A well known study “Regulatory and Legislative Developments and Opportunities Involving Shippers, Railroads, Surface Transportation Board, and Other Federal Agencies,” completed by CURE and presented to the Southeast Association of Rail Shippers in Savannah, GA in March 2011 shows that the cost of being captive on one rail-road in many cases doubles the rail freight rate, creating significant competitive disad-vantages to converting truck to rail-truck through a transload. The Project Team’s experi-ence suggested that a multi served transload facility is the optimal option if the Des Moines Rail Transload facility is to grow and prosper. This is shown in Figure 6 below.
9 ` `
Figure 6
Source: CURE . To the extent possible, the NRT should encourage rail competition into the facility among the railroads in the region in order to ensure the broadest reach between potential markets and to encourage competitive rail rates by the serving carriers.
Rail Market Evaluation A variety of processes to determine potential rail movements that may use the NTF were utilized to develop this report. Identifiable traffic volumes were quantified through use of truck movement data obtained from the Department of Highways. Checks and balances on various forecasts were included to provide a report that anticipates market conditions as they exist at the time the report was developed. The processes used to develop the market analysis in this report include:

10 ` `
Visual Inspections o Visually inspecting distribution facilities o Review other available transload facilities in the region
Interviews and Surveys
o Interview distribution businesses for potential truck to rail diversion Farm implements Lumber yards Concrete consumption Steel products
o Interview manufacturers with serving railroads to determine local needs for additional transportation
o Interview local transportation experts
Historical Freight Movement Analysis o Utilize Freight Analysis Framework data to analyze market data on the poten-
tial market shift from truck to rail
Visual Inspections The first phase of the review, often referred to as “just driving around,” provides a good starting point for this study. Although the majority of data regarding what has been shipped in the past and by what transportation mode can be found in various databases, this step allows for a better understanding of the local economy and its industrial network. Computer data cannot show the interconnectivity of industries, such as steel distribution centers sup-plying steel to local fabricators that use the raw steel to create sub-assemblies for use by local manufacturing firms. The Des Moines region has largely a service economy. In order to support the diversification of the economy, the DMPO is interested in addition of a new transportation option for existing and future shippers. The City of Des Moines is also very interested in adding a new transportation option for existing and future industrial companies.

11 ` `
Interviews and Surveys The Project Team performed a statistical analysis of truck shipments in the region. In addi-tion, we interviewed a variety of experts in the region including members of the regional Economic Development Corporation, members of Industrial Development firms, representa-tives from Consulting Engineer firms and members of the local Chamber(s) of Commerce. Based on these interviews, we were pointed toward certain shippers. We interviewed these shippers regarding the materials they shipped, their satisfaction with their existing rail ser-vice and, what changes, if any, they would request to the regional rail infrastructure, in par-ticular, a rail to truck transload facility. The DMPO provided the Project Team with a summary of the top 100 employers in the re-gion. Using the list as a starting point, the Project Team performed telephone surveys with the employers who are either existing or potential rail shippers. Of the several discussions we had, only one employer, John Deere, showed significant interest in a facility (as de-scribed below). Two other employers, Titan and Bridgestone, indicated to us that they are not a good candidate for rail transloading because their process is too labor intensive. Sev-eral calls and contacts are still open and the Project Team will continue to evaluate the mar-ket for interested candidates for the facility. The result of these personal interviews was an excited interest in the ability to utilize a rail to truck transload facility by John Deere, especially one that will be served by competing rail-roads. The results of our interviews are summarized in the table below.
Customer-Specific Research Shipper Materials Status Requires New
Rail? Bridgestone/Firestone
Outbound tires/Inbound Feedstock
Pleased with existing service
No
John Deere/Des Moines Works
Finished goods for do-mestics and export via Galveston/Baltimore
Interested in BNSF Service or IAIS/NS
Strong Possibility
Inbound
None Noted
N/A
N/A

12 ` `
Historical Freight Movement Analysis The Freight Analysis Framework (FAF) integrates actual freight movement data from a va-riety of sources to create a comprehensive picture of freight movement among states and major metropolitan areas by all modes of transportation. This data is compiled from waybill samples from the trucking, rail and maritime industries and is publicly collected by various Federal Agencies. See appendix for further details. This data contains information from the latest year available at the time of this report, the Commodity Flow Survey. Additional analysis has been performed on this data to produce the FAF version 3 (FAF3), providing estimates for freight movements by tonnage and value, by commodity type, mode, origin, and destination for 2007 with forecasts through 2040. Al-so included are truck flows assigned to the highway network for 2007 and 2040. Because significant changes in method affect comparability of statistics, FAF3 and FAF2 estimates may not be used together. The data utilized for trucking was from the State of Iowa so the level of granularity is difficult statistically. As such, the best analytical data is research by market as well as having a team that has extensive experience in the Iowa freight network. Dr. John Hoegemeier, a well-respected authority on rail transportation movement analysis, developed a matrix of truck traffic that meets all the acceptable parameters for truck to rail diversion. Some of the criteria utilized were; length of freight movement (the longer the bet-ter for rail), density of product (the heavier the better for rail), known capability to move commodity by rail and trucks (historically successful examples of transloading the commodi-ty in other parts of the country), and the quantities consumed by one customer or by multiple customers in the region. Currently, the outbound data in the region is a statistically mini-mum volume which could contribute up to 250 additional cars per year. The inbound data is more robust than the outbound data since Iowa is a consumption area, especially for chemi-cals, minerals, and fertilizers. These are ideal commodities for a truck to rail conversion. Volumes at the minimum diversion rate approach 650 rail cars per year with a three year expectation of 2,000 rail cars per year. Combining the inbound and outbound conversions, starting with a minimum of a 5% diversion rate in Year 1, 10% in Year 2, and 15% in Year 3, we estimate the following rail cars volume for inbound, outbound and total in Years 1 – 3 as shown below in Table 2. Table 2
In addition, there have been significant inquiries into the movement of containers direct to Des Moines instead of being trucked from Chicago, Kansas City or Omaha. The US Freight Railroad Intermodal/Container network is a series of large terminals on the West coast op-
Annual Rail Cars Inbound Outbound Total
Year 1 686 131 817
Year 2 1,372 262 1,634
Year 3 2,058 393 2,451
13 ` `
erating trains from Los Angeles, Oakland and Tacoma to distribution centers in Omaha, Kansas City, Dallas/Fort Worth, Chicagoland and Minneapolis/St Paul. These trains are up to 10,000 feet in length. At destination distribution centers, the containers are normally trucked out up to a 250250 mile radius*(per Vann Cunningham BNSF). However this catch-ment areas can vary based on size and weight of container, chassie ownership and availablity and new hours of service laws. The greatest rail efficiencies are the ability to run point to point without stopping en route at small terminals. Also, the containers are loaded to a destination market on five-pack cars that have 10 containers per car. This efficient de-sign allows for the best utilization of equipment, assuming all containers are loaded to con-forming interstate weight levels. When ag backhauls are loaded to 57,000 lbs per container this weight can cause rail carriers to match up empties with overweight loads in each well of the stack train car. . Even if there were equipment and capacity at a Transload Terminal in Des Moines for con-tainers, it would be very inefficient and, therefore, expensive, to try and stop one of the large trains to set out one car for local delivery. This is due to the fact Des Moines is not on either the UP or BNSF mainlines from the west coast to the Midwest. An “out of route” movement would have to be made to stop in Des Moines. Another option is to move a container from a terminal such as Chicago or Kansas City via local train service to an area like Des Moines instead of trucking it. This would take several days to move and be much more costly than the existing truck drayage rates. The railroad’s intermodal model is designed to move a large train to a destination distribution terminal and have containers trucked to local destina-tions. This is the most efficient mode as well as the lowest cost. In this analysis, containers being unloaded in the proposed facility are not being considered as it is not in either the Un-ion Pacific or the BNSF Railways operating plan. The map on the following page (Figure 7) represents a forecast of 2035 projected rail vol-umes and the current rail capacity. By 2035, the forecast for available Class 1 rail capacity in Iowa will be extremely constrained in all but the southeastern portions of the state. This means that any switching activities or train movements which would slow, delay or stop through train movements would have a very negative impact on the railroad operations. Dur-ing these constrained conditions most rail carriers will require unit train assembly and movement to access the rail market. Short lines can help Class 1 carriers increase efficiency by gathering freight and aggregating individual carload shipments into more efficient blocks of traffic, which reduces Class 1 car-riers time switching individual freight industries.

14 ` `
Figure 7
The rail network has relied on the lessons learned from the airline industry, a few large cen-tral hubs that then have feeder airlines serving the smaller markets. In the case of rail in-termodal, the railroads serve the large intermodal hubs and trucks serve the smaller mar-kets. Each industry is then utilized to its maximum efficiency. Direct intermodal service to Des Moines would more expensive than the current intermodal/drayage combination due to the reduced volumes and higher rail service costs. While not the answer desired, the free market has developed the most cost effective solution for moving containers into Des Moines.
15 ` `
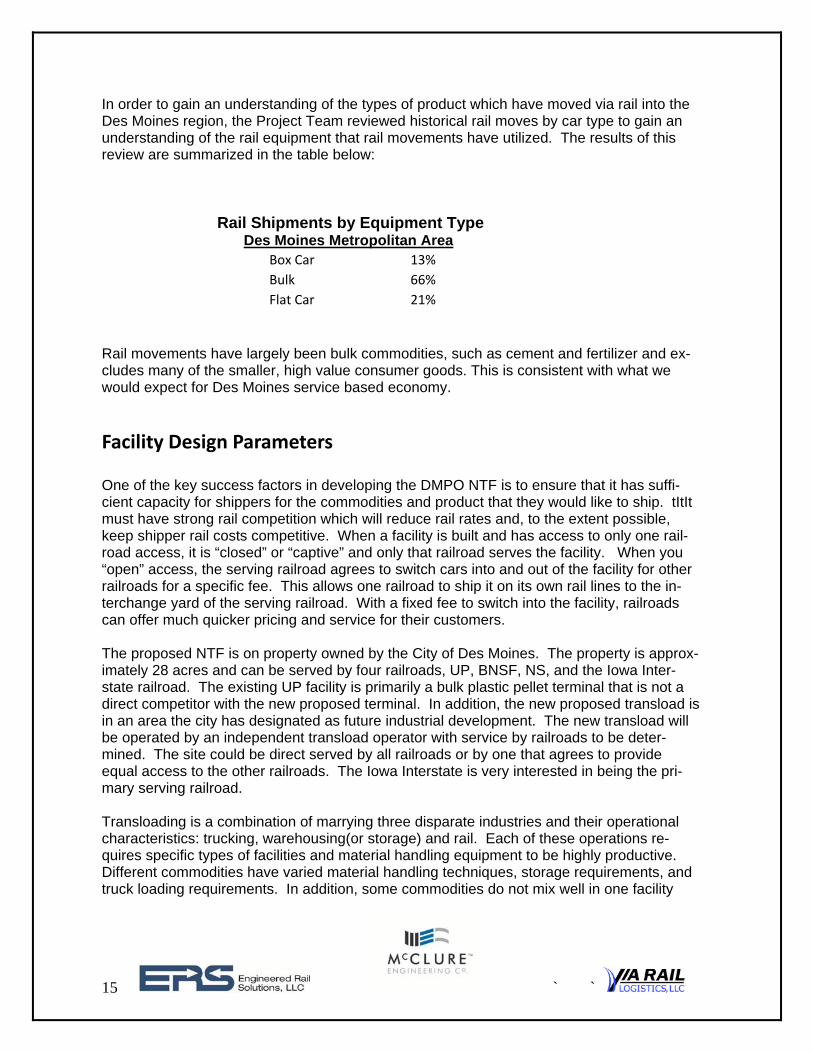
In order to gain an understanding of the types of product which have moved via rail into the Des Moines region, the Project Team reviewed historical rail moves by car type to gain an understanding of the rail equipment that rail movements have utilized. The results of this review are summarized in the table below: Rail Shipments by Equipment Type Des Moines Metropolitan Area
Box Car 13%
Bulk 66%
Flat Car 21%
Rail movements have largely been bulk commodities, such as cement and fertilizer and ex-cludes many of the smaller, high value consumer goods. This is consistent with what we would expect for Des Moines service based economy.
Facility Design Parameters One of the key success factors in developing the DMPO NTF is to ensure that it has suffi-cient capacity for shippers for the commodities and product that they would like to ship. tItIt must have strong rail competition which will reduce rail rates and, to the extent possible, keep shipper rail costs competitive. When a facility is built and has access to only one rail-road access, it is “closed” or “captive” and only that railroad serves the facility. When you “open” access, the serving railroad agrees to switch cars into and out of the facility for other railroads for a specific fee. This allows one railroad to ship it on its own rail lines to the in-terchange yard of the serving railroad. With a fixed fee to switch into the facility, railroads can offer much quicker pricing and service for their customers. The proposed NTF is on property owned by the City of Des Moines. The property is approx-imately 28 acres and can be served by four railroads, UP, BNSF, NS, and the Iowa Inter-state railroad. The existing UP facility is primarily a bulk plastic pellet terminal that is not a direct competitor with the new proposed terminal. In addition, the new proposed transload is in an area the city has designated as future industrial development. The new transload will be operated by an independent transload operator with service by railroads to be deter-mined. The site could be direct served by all railroads or by one that agrees to provide equal access to the other railroads. The Iowa Interstate is very interested in being the pri-mary serving railroad. Transloading is a combination of marrying three disparate industries and their operational characteristics: trucking, warehousing(or storage) and rail. Each of these operations re-quires specific types of facilities and material handling equipment to be highly productive. Different commodities have varied material handling techniques, storage requirements, and truck loading requirements. In addition, some commodities do not mix well in one facility

16 ` `
due to potential contamination and damage issues. In today’s transportation environment the ability to load large trains quickly will translate into cost savings for the shipper. The abil-ity to warehouse, store or stage product to quickly and efficiently load and “turn trains” is es-sential to economic competitiveness. NTF is a greenfield site and should be designed around the optimization of the three opera-tions and in consideration of the overall cost of the facility. The Project Team’s extensive experience in developing and operating transload facilities in other parts of the country, has provided the background for developing this design. Ultimately, the design which will be proposed to the DMPO will, among other things, be guided by the research contained in this report including identifying the commodities and their volumes most likely to use the facility. An initial, high level facility design shown on the following page as Figure 8, is based on the results of the market analysis. The facility is designed to accommodate the commodities that are identified as potential rail moves in Table 1. The facility will measure approximately 1500’ by 600’ in size. It will include infrastructure including side ramps and an end ramp for both box car and flat car loading. Any required bulk commodity loading may be performed on an open track alongside the railcar.

17 ` `
Figure 8
Pre Market Analysis Conceptual Design for Des Moines, for exhibit purposes only
The proposed facility design will be revised in the next phase of the project. Potential neigh-borhood impacts and suggested mitigation options will also be discussed.
Conclusion and Next Steps The Project Team has completed a logistical and freight movement analysis of the DMPO’s region. In the study, the volume and the value of potential rail freight has been determined, freight flows by mode into and out of the region were studied, and existing rail transloading facilities were surveyed in order to evaluate actions which could increase rail-served freight options for the existing manufacturing base as well as new industries. Based on our analy-sis, we believe there is a potential market for expanded rail transloading options in the re-gion. This “new” rail market includes truck to rail diversions, including significant rail-served business with John Deere. In order to develop a cost competitive “long term” solution, we conclude that the Des Moines region should move ahead with defining the type of facility that best suits the potential traffic mix in the development of a cost-competitive transloading facility (NTF).
18 ` `
Appendices
Freight Analysis Framework Data
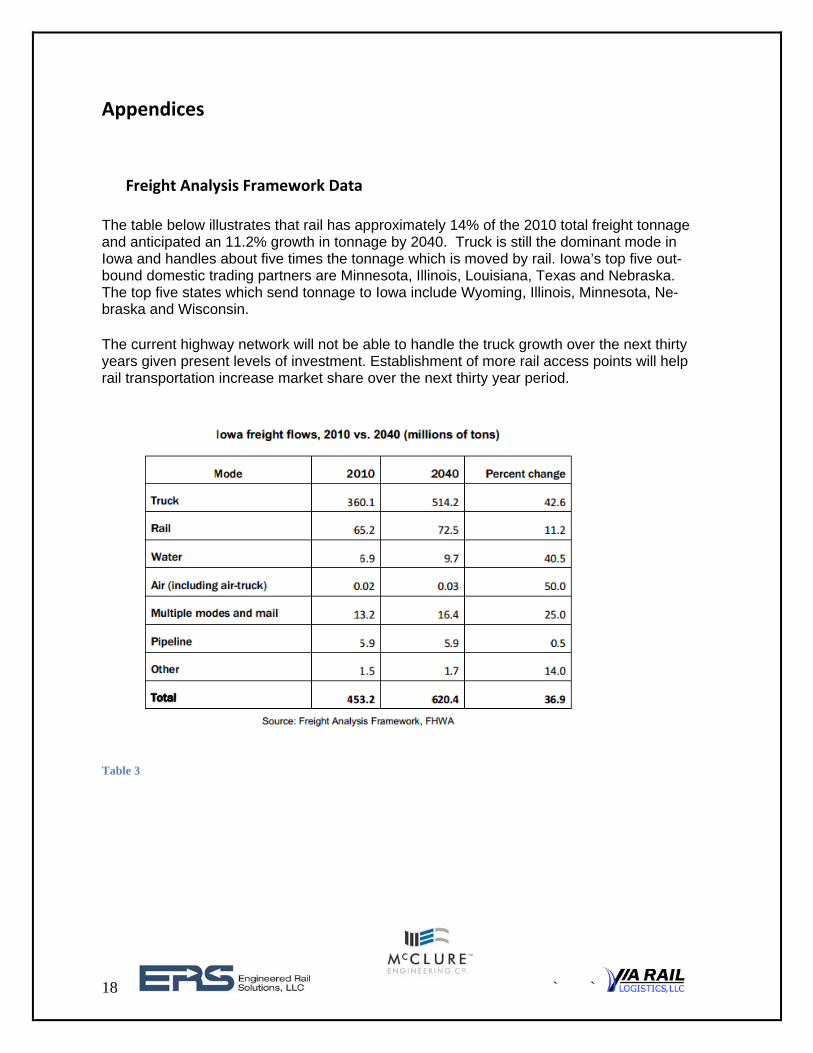
The table below illustrates that rail has approximately 14% of the 2010 total freight tonnage and anticipated an 11.2% growth in tonnage by 2040. Truck is still the dominant mode in Iowa and handles about five times the tonnage which is moved by rail. Iowa’s top five out-bound domestic trading partners are Minnesota, Illinois, Louisiana, Texas and Nebraska. The top five states which send tonnage to Iowa include Wyoming, Illinois, Minnesota, Ne-braska and Wisconsin. The current highway network will not be able to handle the truck growth over the next thirty years given present levels of investment. Establishment of more rail access points will help rail transportation increase market share over the next thirty year period.
Table 3