the culture of hospitality: from anecdote to evidence
TRANSCRIPT
1
This is a preprint version of the article, self-archived in compliance with the publisher’s archiving
policy (https://www.elsevier.com/about/policies/sharing#definitions). The published version of the
manuscript is available at: https://doi.org/10.1016/j.annals.2019.102789
The culture of hospitality: From anecdote to evidence
Tijana Radojevica,
, Nemanja Stanisicb, Nenad Stanic
c
aFaculty of Tourism and Hospitality Management, Singidunum University, Belgrade, Serbia
bFaculty of Business Economics, Singidunum University, Belgrade, Serbia
cFaculty of Computer Science, Singidunum University, Belgrade, Serbia
Abstract
We examine the nature, magnitude, and generalisability of the effects of the cultural
values of hotel guests and hotel workers, as approximated by their countries‟ scores on
Hofstede‟s six cultural dimensions, on the satisfaction with hotel services, as perceived and
reported by hotel guests. The main and interactive effects of the cultural dimensions are
modelled and estimated within a multivariate multilevel Bayesian regression model using an
empirical data set of 30.000 customer reviews collected from TripAdvisor. The results indicate
that cultural dimensions named Indulgence, Individualism, and Power Distance, substantially
affect the way in which hotel services are rendered as well as perceived. Focusing more on the
estimated effects of the cultural values of hotel workers, which can be managed in practice, the
results suggest that hotel workers from countries scoring low on individualism and indulgence
seem to be particularly gifted for rendering high quality hotel services. Interestingly, many Asian
countries, including Japan, China, Hong Kong, Thailand, Singapore and Vietnam have
advantageous values on these two cultural dimensions, which may partly explain the rapid
contemporary expansion of their hotel industries. On the other hand, numerous Western world
countries, such as Canada, the United States, the United Kingdom, Australia, New Zealand,
Switzerland, Belgium, Malta and Scandinavian countries score relatively highly on these two
dimensions, which suggests that they may be relatively less culturally disposed to providing
high-quality hotel services. The insights presented in this study have important implications for
the processes of staff recruitment and training in the global hotel industry.
Keywords: culture; hotel services; service quality; customer satisfaction; Hofstede‟s
cultural dimensions
Corresponding author. Danijelova 32, Belgrade, Serbia. Tel.: +381 11 30 93 220; fax: +381 11 30 93 294.
E-mail addresses: [email protected] (T. Radojevic), [email protected] (N. Stanisic),
[email protected] (N. Stanic)

2
1. Introduction The notion that the national identities and cultures of the parties involved in hotel service
encounters have an effect on the way in which services are rendered and evaluated, has been
studied repeatedly in the literature (Hope, 2004; Jahandideh, Golmohammadi, Meng, O„Gorman
& Taheri, 2014; Mok & Armstrong, 1998; Torres, Fu & Lehto, 2014). Most research has been
focused on the evaluation side of the encounter, demonstrating that guests from different cultures
have different requirements from hotel staff (Prayag & Ryan, 2012), demonstrate different
complaint behaviour (Jahandideh et al., 2014; Yuksel, Kilinc & Yuksel, 2006) and tend to
evaluate similar hotel services differently (Gao, Li, Liu & Fang, 2018; Radojevic, Stanisic &
Stanic, 2017; Radojevic, Stanisic, Stanic & Davidson, 2018). The effects that a hotel worker‟s
national culture has on the quality of services rendered by them, for the most part, remains
unclear. The aim of this study is to offer solid and credible empirical evidence on this important
issue.
Accordingly, the first question tackled in this study is whether the cultural characteristics of
hotel workers systematically affect reported levels of satisfaction with the quality of hotel
services they provide. Answering this question appropriately is remarkably challenging with
regards to the methodological approach that needs to be employed, since it requires:
1. An empirical data sample of adequate size and geographical scope to ensure the
reliability and generalisability of the findings;
2. Appropriate operationalisation of the cultural values of the location of the hotels, as
well as that of the countries of origin of the hotel guests;
3. Modelling the effects of all potentially relevant dimensions of culture, along with their
pairwise interactions;
4. The use of the appropriate modelling framework (i.e. multilevel regression instead of
simple regression);
5. Considering the possibility that cultural dimensions affect various aspects of hotel
service differently, and
6. Focusing on the reported levels of satisfaction with the quality of service rendered,
rather than on the reported levels of overall satisfaction, as studies typically do.
In consideration of the requirements listed above, we use a publicly available and sizable
empirical dataset based on TripAdvisor‟s online surveys of customer satisfaction with hotel
services, compiled by Radojevic, Stanisic and Stanic (2016), operationalise the concept of
culture using the widely accepted cultural dimension framework developed by Geert Hofstede
(1980), and build a multivariate multilevel model to draw conclusions about the nature of the
effects of interest.
Based on the estimates of the main and interactive effects of Hofstede‟s six cultural
dimensions, we proceed to answer the second major question tackled in this study, which is
whether certain nations, or clusters of nations, can be regarded as particularly culturally disposed
to providing high-quality hotel services.
Understanding the implications of a hotel employee‟s national culture on the (perceived)
quality of services they render is not only valuable to researchers, but is of utmost importance to
3
hotel managers globally, who can use this knowledge to develop a recruitment strategy that will
enhance their guest‟s satisfaction.
2. Literature review
2.1. Culture
For an immense period of time, the human race was widely dispersed over the globe in
the form of relatively isolated tribal groups. This circumstance played a crucial role in creating
and maintaining a rich diversity of languages and cultures (Lowie, 1917), many of which are in
evidence today. As a product of history, culture is built up over time largely through processes
which are beyond the awareness of individuals (Oberg, 1960). For this reason, it is considered
“superindividual” (Murdock, 1932) and defined as “the collective programming of the mind”
(Hofstede, Hofstede & Minkov, 2010). It includes knowledge, beliefs, art, morals, laws, customs,
and any other abilities and habits that people acquire as members of a society (Tylor, 1871).
These are passed on from parents to children, and reinforced by major social institutions -
schools, churches, businesses, and governments (Kotler & Keller, 2009).
2.1.1. The operationalisation of national culture: Hofstede’s framework
The first step towards the development of cultural constructs at the national level was taken
by Inkeles and Levinson (1969). Based on an extensive review of then-existing sociological and
anthropological literature, they proposed three “standard analytic issues”. These analytic issues
(nowadays called cultural dimensions) were later confirmed by Geert Hofstede (1980) in his
highly influential work “Culture's Consequences”. Over the past few decades, Hofstede has
further defined, shaped, and promoted the concept of cultural dimensions through subsequent
research efforts. His work has inspired much of the cross-cultural research done over the past
decades. Of the many currently competing cultural dimensions frameworks (Schwartz, 2006;
Inglehart & Baker, 2000), that presented by Hofstede remains the most widely utilised.
The current version of his theoretical framework recognises six distinct cultural dimensions
which are, in brief:
1. Power distance – the extent to which less powerful members of society expect and accept
that power is distributed unequally;
2. Individualism – the extent of preference for a loosely-knit social framework in which
individuals are expected to take care of only themselves and their immediate families;
3. Masculinity – the extent to which emotional gender roles are clearly distinct: men are
supposed to be assertive, tough, and focused on material success, whereas women are
supposed to be more modest, tender, and concerned with the quality of life;
4. Uncertainty avoidance – the extent to which the members of a culture feel threatened by
ambiguous or unknown situations;
5. Long term orientation – the extent to which members of a culture foster virtues oriented
toward future rewards – in particular, perseverance and thrift, and
6. Indulgence – the extent to which the gratification of basic and natural human desires
related to enjoying life and having fun is freely allowed.

4
Based on his empirical research, Hofstede estimated scores for these cultural dimensions
for a number of countries, allowing researchers to operationalise the concept of culture. The
availability of the empirical scores, along with the framework‟s clarity, parsimony, and
resonance with managers (Kirkman, Lowe & Gibson, 2006), has meant that it has been widely
adopted in cross-cultural studies within the fields of tourism and hospitality (Li, 2012).
2.2 The role of culture in the hotel industry
In the hotel industry, guest satisfaction is achieved when perceived service performance
exceeds the expectations (often referred to as „desired service‟ in the literature) that guests have
developed in the “before-travel” stage (Manrai & Manrai, 2011). Culture, as suggested by the
literature, can affect both the expectations of hotel service encounters by shaping a guest‟s wants
and expectations, and performance by imbuing hotel workers with various characteristics that
may be relevant for rendering of services (Chen, Cheung & Law, 2012).
According to Kotler and Keller (2009), culture has the broadest and deepest effect of all
factors that determine a person‟s wants.1 The finding that visitors from different countries report
different average satisfaction levels after visiting the very same destination is consistent with this
premise (Crotts & Erdmann, 2000; Kozak, 2001). Furrer, Liu and Sudharshan (2000) have,
furthermore, shown that the relative importance of the dimensions in the SERVQUAL model
varies significantly across cultures, with these variations being associated with Hofstede's
cultural dimensions. The premise that a customer‟s cultural background shapes their expectations
and evaluation of services is strongly supported by empirical research in the hotel industry
(Matzler, Renzl & Rothenberger, 2006; Mok & Armstrong, 1998; Torres et al., 2014).
On the other side, evidence to show that a hotel worker‟s cultural background affects their
performance in the context of the hotel service industry is relatively limited. While the research
has repeatedly demonstrated that organisational and personal characteristics play an important
role in the development of hospitality culture (Dawson, Abbott & Shoemaker, 2011; Tepeci &
Bartlett, 2002), such a solid evidence of the impact of national culture. The rare studies that use
estimates of hotel workers‟ scores on Hofstede‟s cultural dimensions as explanatory variables
have either focused on general customer satisfaction with all aspects hotel services (e.g.
Radojevic et al., 2017, 2018) or on organisational performance (e.g. Nazarian, Atkinson &
Foroudi, 2017) as outcomes to be explained, which tells us little about their effects on the
perceived quality of service as specifically provided by workers.
In addition to exerting their main effects, the values of hotel guests and hotel workers are
also expected to interact to create both positive and negative outcomes regarding a guest‟s
satisfaction. Clearly, a significant cultural distance between the two parties can compromise the
ability of the management and staff to correctly assess a guest‟s expectations and wants, which is
crucial for the successful provision of a service (Saleh & Ryan, 1991), otherwise causing
negative emotions and dissatisfaction in guests (Stauss & Mang, 1999).2 Some of the culturally-
1 The other two groups of factors are social and personal.
2 In addition to the risk that the performance of the local service provider does not meet the expectations of the
foreign customer (the term “intercultural provider performance gap” is used), Stauss and Mang (1999) recognise the

5
imbued differences that may manifest and negatively affect a guest‟s satisfaction with hotel
services are those related to greetings, politeness and the acceptable volume of interaction, gift-
giving, tipping, eating and drinking, and a guest‟s entertainment. It can also be argued that the
very same differences may also be perceived by a guest as exotic and charming and thus cause
positive reactions. Indeed, empirical studies (Radojevic et al., 2017, 2018) have found that
cultural distances in certain of Hofstede‟s dimensions have significant positive effects on
reported levels of satisfaction with hotel service, while the others appear to have nil or a
significant negative effect.
The literature review demonstrates that there is not yet any reliable evidence of the effect of a
hotel worker‟s national culture on the quality of services they render, motivating us to tackle this
important issue and, thus, fill the existing knowledge gap. Both theory and the available
empirical evidence also suggest that, to properly isolate the effect of a hotel worker‟s culture on
the quality of services they render, the statistical model needs to simultaneously account for the
effects of the cultural backgrounds of guests, and the potential interactive effects that the cultural
characteristics of the two parties may have on service evaluation.
2. Methodology
2.1. Data
For this study, we used a publicly available dataset (Radojevic et al., 2016) based on
TripAdvisor‟s online surveys of customer satisfaction with hotel services. The initial dataset
comprised 3,488,473 customer ratings, provided by 2,233,671 unique registered TripAdvisor
users of 210 different nationalities, and related to 13,410 hotels located in 80 capital cities
around the globe. The ratings represent self-reported encounter-specific customer satisfaction
with hotel services and take one of the following numerical values and corresponding descriptive
labels: 1 – „terrible‟, 2 – „poor‟, 3 – „average‟, 4 – „very good‟ and 5 – „excellent‟. In addition to
assigning an overall satisfaction score, reviewers may also evaluate the hotel service against six
criteria: „location‟, „cleanliness‟, „rooms‟, „service‟, „sleep quality‟ and „value‟. They also report
the type of travel during the specific encounter as: „business‟, „couple‟, „family‟, „friends‟ and
„solo‟. The ratings in the sample were all provided between 31 August 2002 and 15 May 2015.
Most importantly for this research, the dataset also contains Geert Hofstede‟s cultural
dimension scores for the 80 countries (for both destination countries and the reviewer‟s country
of origin) for which scores on all the six dimensions are available on his official website
(Hofstede, 2010).
For an in-depth description of the initial dataset see Radojevic, Stanisic and Stanic
(2017).
2.2. Model
To achieve the goals of this study, we specified and fitted a Bayesian multivariate
multilevel regression model. The choice of the modelling technique was motivated by the aim of
possibility that service cannot be fulfilled at the usual performance level because foreign customers do not maintain
the role behaviour expected by the domestic supplier, resulting in an “intercultural customer performance gap”.
6
the research and the characteristics of the data. The multilevel modelling approach allowed us to
include Hofstede‟s cultural dimension scores in the model in a way that accounts for the fact that
they are only available at the national level. This was crucial for obtaining unbiased estimates of
the effects of the cultural dimensions, which are the explanatory variables of main interest in this
research. Employing an ordinary (OLS) linear regression instead would, inappropriately, force
the projection of Hofstede‟s national scores onto the level of the individual encounter, as if both
a visitor‟s cultural values and the cultural values prevalent at the destination were measured
separately for each encounter. This approach would produce disaggregation error (Brewer &
Venaik, 2014; Van de Vijver & Poortinga, 2002) and the estimates of the effects of the cultural
dimension scores obtained from such a model would be biased.
The multilevel framework also allowed us to control for the four major systematic effects
shown to affect the satisfaction scores: 1) the reviewer, 2) the hotel, 3) the reviewer‟s nationality
and 4) the destination in which the hotel is situated. All four influences are modelled as random
effects, as recommended by Radojevic, Stanisic and Stanic (2017). Other factors that are
controlled for in the model are the date of review (to account for temporal trends of increases in
the scores), and trip type (to account for the fact that for-leisure encounters are rated more
favourably than for-business encounters, as found by Radojevic et al. [2018]).
The multivariate approach to multilevel modelling has been chosen to account for the fact
that encounter-level satisfaction scores on different criteria are mutually dependent. Namely,
during the evaluation process, the overall impression of the quality of hotel services is
unsystematically spilled-over across the rating criteria, resulting in highly correlated (mutually
contaminated in a sense) rating scores.3 To obtain unbiased estimates of the effects, it was thus
necessary to model the values of all scores and the correlations simultaneously.
The multivariate approach also allows for the possibility that the explanatory variables
may affect each rating criterion in a different way - the cultural values may be highly relevant for
customer satisfaction on some criteria (e.g. Quality of Service, Cleanliness), while being nearly
irrelevant for others (e.g. Quality of Sleep). Generally, the effects of culture are most likely to
manifest in human interactions, and therefore we primarily focus on interpreting the effects of
the cultural dimension on the „Quality of Service‟ dependent variable.
The model is specified using the „classification notation‟ (Browne, Goldstein & Rasbash,
2001) as follows:
3 The spill-over effect is described in (Radojevic et al., 2017). If there were no spill-over effect, conclusions on the
levels of service quality by country and region could be drawn based solely on the average values of ratings on the
corresponding evaluation criteria.

7
where subscripts c and i denote individual criteria and encounters, respectively; is the
multivariate response (the seven satisfaction scores) variable, refers to the fixed part of the
model, inclusive of the intercepts, the control variables (date of review and trip type) and the
individual effects of cultural dimensions and their pairwise interactions, and stands for a
random effect (a random intercept or a random slope).
Given the complexity of the model specified and the computational intensity inherent in
Bayesian methods, the model was fit on a random subsample of 30,000 observations drawn from
the initial dataset. R software environment for statistical computing (R Core Team, 2018) and its
associated software package for Bayesian Multilevel Models Using Stan named brms (Bürkner,
2017) were used for model fitting. To facilitate interpretation of the results, scores on each
cultural dimension were rescaled to 0-1 range (0 indicating minimal, and 1 indicating maximal
observed values among all countries for the corresponding dimensions). According to the
potential scale reduction factor (PSRF), a convergence diagnostic recommended by Gelman and
Rubin (1992), all 413 model parameters successfully converged after 60,000 iterations. The
complete output of the model, including the model syntax and the estimates of the parameters,
can be accessed through the following link:
https://www.dropbox.com/s/qyiufotpne5bett/Complete%20model%20output.pdf?dl=0

8
3. Results and discussion
3.1. Model output
For the reasons stated in the previous section, we will primarily focus on the regression coefficients pertaining to the Quality of
Service dependent variable. These coefficients are presented in Table 1.
Table 1 - Model estimates of fixed effects for the Service response variable
Effect Estimate Est. Error l-95% CI u-95% CI Eff. Sample PSRF
Control
variables
Date of review 0.07 0.01 0.06 0.08 400 1
Trip type: Solo 0.06 0.03 0.01 0.11 320 1.01
Trip type: Friends 0.02 0.02 -0.02 0.06 400 1
Trip type: Couple 0.17 0.02 0.14 0.21 400 1
Trip type: Family 0.12 0.02 0.08 0.16 400 1
PDI
Visitor's country PDI 0.35* 0.11 0.14 0.55 400 1
Destination country PDI -0.09 0.1 -0.28 0.13 400 1
Visitor's country PDI × Destination country PDI -0.44* 0.16 -0.76 -0.12 400 1
IDV
Visitor's country IDV 0.27* 0.08 0.12 0.43 290 1
Destination country IDV -0.27* 0.09 -0.43 -0.12 400 1.01
Visitor's country IDV × Destination country IDV 0.02 0.1 -0.17 0.22 392 1
MAS
Visitor's country MAS -0.12 0.1 -0.32 0.06 389 1
Destination country MAS 0.13 0.1 -0.09 0.33 400 1.01
Visitor's country MAS × Destination country MAS 0.02 0.15 -0.3 0.33 400 1
UAI
Visitor's country UAI 0.07 0.08 -0.08 0.22 400 1
Destination country UAI 0.07 0.08 -0.08 0.23 388 1
Visitor's country UAI × Destination country UAI -0.17 0.12 -0.39 0.06 400 1
LTO
Visitor's country LTO 0.04 0.1 -0.15 0.26 400 1
Destination country LTO 0.12 0.1 -0.1 0.3 400 1
Visitor's country LTO × Destination country LTO -0.2 0.17 -0.51 0.12 400 1
IVR
Visitor's country IVR 0.01 0.13 -0.27 0.25 400 1.01
Destination country IVR -0.65* 0.14 -0.91 -0.37 400 1
Visitor's country IVR × Destination country IVR 0.52* 0.22 0.06 0.95 400 1
9
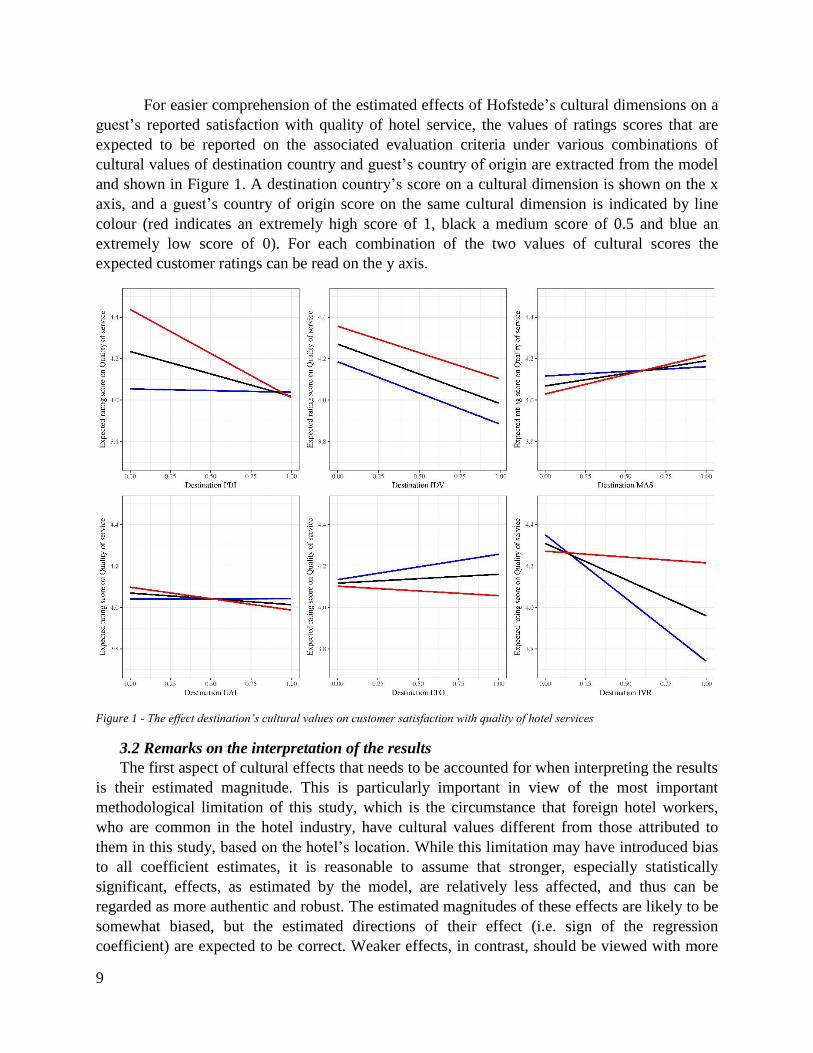
For easier comprehension of the estimated effects of Hofstede‟s cultural dimensions on a
guest‟s reported satisfaction with quality of hotel service, the values of ratings scores that are
expected to be reported on the associated evaluation criteria under various combinations of
cultural values of destination country and guest‟s country of origin are extracted from the model
and shown in Figure 1. A destination country‟s score on a cultural dimension is shown on the x
axis, and a guest‟s country of origin score on the same cultural dimension is indicated by line
colour (red indicates an extremely high score of 1, black a medium score of 0.5 and blue an
extremely low score of 0). For each combination of the two values of cultural scores the
expected customer ratings can be read on the y axis.
Figure 1 - The effect destination’s cultural values on customer satisfaction with quality of hotel services
3.2 Remarks on the interpretation of the results
The first aspect of cultural effects that needs to be accounted for when interpreting the results
is their estimated magnitude. This is particularly important in view of the most important
methodological limitation of this study, which is the circumstance that foreign hotel workers,
who are common in the hotel industry, have cultural values different from those attributed to
them in this study, based on the hotel‟s location. While this limitation may have introduced bias
to all coefficient estimates, it is reasonable to assume that stronger, especially statistically
significant, effects, as estimated by the model, are relatively less affected, and thus can be
regarded as more authentic and robust. The estimated magnitudes of these effects are likely to be
somewhat biased, but the estimated directions of their effect (i.e. sign of the regression
coefficient) are expected to be correct. Weaker effects, in contrast, should be viewed with more

10
scepticism, since their estimated magnitudes may be biased to a degree where the direction of the
influence is incorrect, and therefore we will focus mainly on strong effects while interpreting the
results.
Another aspect of the effects that needs to be taken into consideration when interpreting the
results is their consistency. We define consistency as the quality of the direction of effect of a
cultural dimension of the destination country being unchanged regardless of the value of a guest‟
s country of origin score on the corresponding cultural dimension. An effect can have a
significant interaction and still be consistent if the sign of the effects is not affected by the
interaction. Consistent effects are prioritised over inconsistent effects, since the nature of their
influence is clearer and can be generalised over all possible combinations of cultural values,
which is crucial given the aim of our study.
Pronounced individualism exerts the most consistent effect of a destination‟s culture on
customer satisfaction with the quality of hotel services. The higher the individualism of the hotel
workers, the lower the reported level of a guest‟s satisfaction, regardless of how individualistic
the guests are themselves. Everything else being equal, a hypothetical destination‟s cultural
transformation from pronounced collectivism to pronounced individualism, would be expected to
result in a pervasive decrease in satisfaction with hotel service quality of around 0.27 (on a 1
through 5 scale), which is, definitely, of practical significance.
Pronounced indulgence at destination is a consistently negative, and conditionally very
strong effect. The magnitude of the effect varies from a dramatic reduction of 0.65, for guests
from restrained cultures, to a moderate reduction of 0.13, for guests from high indulgence
cultures, indicating that the values of the two parties on this dimension interact.
Pronounced power distance at destination is a consistently negative, and conditionally strong
effect. It slightly reduces satisfaction by 0.09, when a guest‟s power distance is low, but causes a
substantial drop in satisfaction by 0.53, when guest‟s power distance is extremely high, which,
again, indicates a significant interaction.
Finally, pronounced masculinity and uncertainty avoidance appear to exert consistent
(positive and negative, respectively), but insignificant effects on guest satisfaction, whereas
pronounced long-term orientation seems to be capable of slightly affecting a guest‟s perception
of the quality of hotel services, both positively and negatively, depending on their own degree of
long-term orientation (the effect is positive for guests with a low and medium degree of long-
term orientation, and negative for guests from countries characterised by a high degree of long-
term orientation). Considering their relatively small magnitudes, along with their questionable
authenticity, the effects of masculinity, uncertainty avoidance and long-term orientation do not
call for elaborate interpretation.
3.2.1 Interpretation of the effects of hotel worker’s Individualism, Indulgence and Power
Distance on the quality of hotel services they render
The finding that collectivistic culture is advantageous for providing high-quality hotel
services is highly consistent with the observations offered in the literature.

11
Yilmaz, Alpkan and Ergun (2005, p.1342) offer the following explanation for this
phenomenon:
“Unlike individualistic cultures, which value independence and competition,
collectivist cultures encourage the subordination of personal interests to the goals of a larger
work group and put more emphasis on sharing and cooperation (Yilmaz & Hunt, 2001).
Collectivist cultures give priority to supportive organisational practices, interpersonal
connectedness, group solidarity, joint responsibility, and harmony (Doney, Cannon &
Mullen, 1998; Newman & Nollen, 1996). Out of this cohesion grows a greater proclivity
(than individualistic cultures) to exchange information and ideas, (2) support and assist each
other, (3) discuss problems openly and constructively (Chen, Meindl & Hui, 1998), and (4)
develop commitment to the organisation (Wasti, 2002).”
Similarly, Reisinger and Dimanche (2010) observe that, in collectivistic societies, “customer
satisfaction often depends on trust, caring, shared duty and long-term commitment, such as
provision of services beyond contract terms, attending to all concerns, expressing gratitude for
the relationships and rewards loyalty, and placing customer interests at times above those of the
firm“.
Manrai and Manrai (2011) suggest that collectivistic societies put relatively more
emphasis on courtesy and consideration, whereas individualistic societies are less focused on
these aspects of service.
Another important circumstance that needs to be considered is that individualism is the
dimension that has the highest positive correlation with national affluence (Hofstede et al.,
2010). Because of the relatively greater job opportunities that individuals living in rich countries
have, hotels operating there may struggle to attract and retain high quality employees.
Conversely, a job in the hotel industry may be much more attractive, lucrative (e.g. tips received
from foreigners) and even prestigious for individuals living in poor countries. Seen as a gateway
to a better life, the hotel industries operating in poor countries can afford to be highly selective
when recruiting staff. Highly motivated and rigorously selected employees may be a significant
competitive advantage for countries that score low on individualism.
Koc, Ar and Aydin (2017, p.4) suggest that workers from indulgence-oriented cultures
should be better disposed to providing high quality services, because they are more involved in
leisure and pleasure activities themselves, and thus can better internalise customer expectations,
and should have a deeper understanding of their needs, wants and expectations. People from
more restrained cultures, they suggest, may have difficulties understanding and internalising
hedonic leisure activities and are, thus, expected to underperform when organising such activities
for others. Quite contrary to this proposition, our results demonstrate that, along with
collectivism, a culture of restraint, characterised by a high degree of professionalism and work
ethics, strong discipline, preference for order and focus on job duties (Hofstede, 2010), is
actually the most valuable cultural asset when it comes to providing high quality hotel services.
Individuals from cultures of pronounced indulgence, due to their probable lack of the above
characteristics, coupled with their strong preferences for leisure and having fun and a tendency to
12
be overly informal in communication, are, clearly, relatively less gifted at providing hotel
services. The strong and significant interactive effect also suggests that a cultural combination of
hotel workers being from pronounced indulgence countries and guests from restrained cultures is
the single worst possible combination in all six dimensions. The negative interaction,
conceivably, occurs because of the likely failure of high indulgence workers to meet the
particularly high expectations of service quality that individuals from restrained cultures tend to
have.
According to the literature, a pronounced power distance culture among hotel workers is,
believed to be disadvantageous with regard to the quality of services they provide, as it leads to
unbalanced organisational structure (Nazarian et al., 2017), a less participative stance in decision
making, greater reliance on rules and procedures, excessively high levels of subordinate
submissiveness, reluctance to take responsibilities outside the immediate scope of one‟s job and
a lack of informal communication (Yilmaz et al., 2005). Our results, however, suggest that,
unlike the effects of individualism and indulgence, which seem to directly affect the quality of
service, the effect of power distance mainly operates in a guest‟s perception-/evaluation.
Specifically, while a hotel worker's score on power distance is almost completely irrelevant for
guests from low power distance cultures, high power distance guests have a strong preference for
low power distance hotel workers. The non-bureaucratic and considerate attitude of low power
distance workers may impress guests from high power distance cultures. Even though the effect
is irrelevant on some occasions, it is well worth noting that, in most intercultural combinations,
service provided by low power distance hotel workers will be perceived and evaluated as
superior to that provided by high power distance workers. For that reason, along with
collectivism and restraint, low power distance may be regarded as advantageous for providing
high-quality hotel services.
3.2.2 Assessing culturally-induced human capacity to provide high-quality hotel
services
Based on the results above, we proceed to infer the extent to which individual nations may be
considered culturally disposed to providing high quality hotel services. To account for the
possible measurement error present in the Hofstede‟s scores, we rely on estimated directions of
the effects, rather than on their raw estimates of magnitudes. Specifically, each individual
cultural dimension score for a destination is characterised as being either on the advantageous or
on the disadvantageous side of the related dimension‟s spectrum, as implied by the model
estimates.
Moreover, to reflect the different levels of scepticism that a researcher may have about the
authenticity, generalisability, and practical significance of the estimated effects, we have
constructed three different country scores, which are counts of defined criteria met by individual
countries. The first score involves two criteria evaluating the two strongest effects originating in
performance (individualism is below mid-range and indulgence is below mid-range), the second
score includes an additional criteria that evaluates the score on power distance (power distance is
below mid-range, individualism is below mid-range and indulgence is below mid-range), and the
third score includes one criterion for each of the six Hofstede‟s dimensions (power distance is

13
below mid-range, individualism is below mid-range, masculinity is above mid-range, uncertainty
avoidance is below mid-range, long-term orientation is above mid-range and indulgence is below
mid-range).
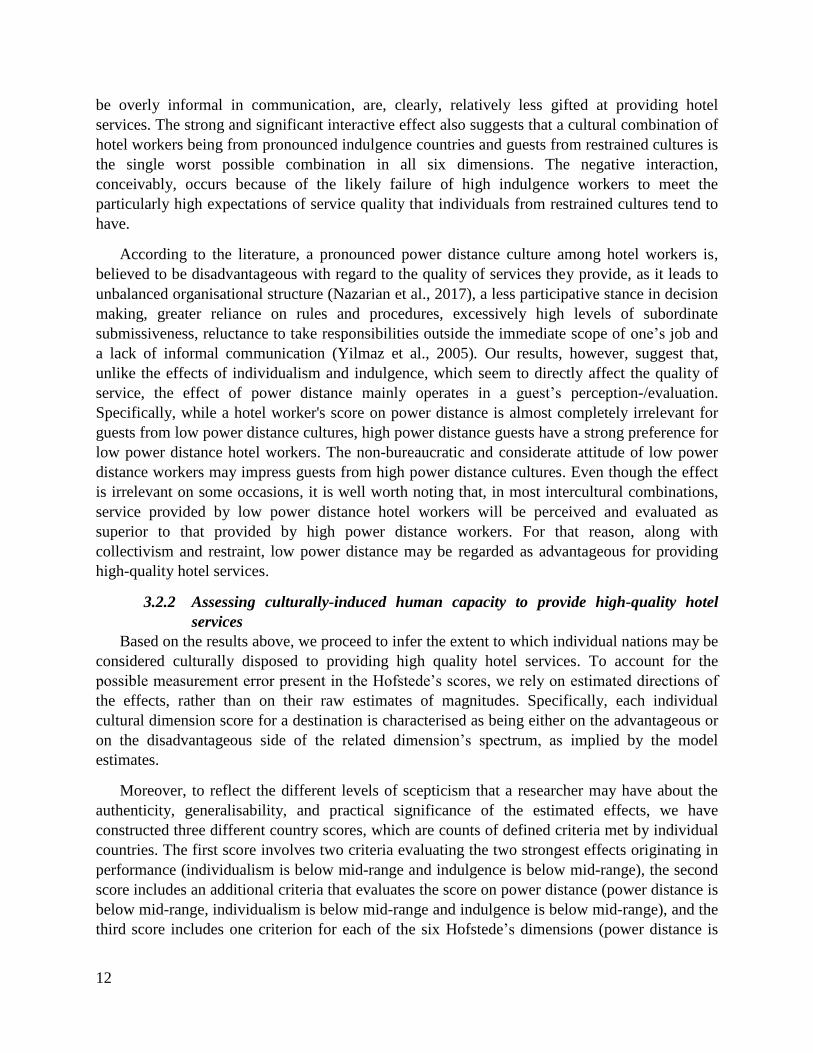
Hofstede‟s scores rescaled to a 0-1 scale and number of conditions met for the countries in
the sample are presented in Table 2. Countries are ranked by the first score, within the first score
by the second score and lastly by the third score.

14
Table 2 - Countries in the sample sorted by their culturally-imbued human capacity for providing high-quality hotel services, as implied by the results of the model
Hofstede’s scores rescaled to 0-1 range Criteria and no. of conditions met (the scores)
Rank Country PDI
IDV
MAS UAI LTO
IVR
IDV LOW (<0.5)
IVR LOW (<0.5)
PDI LOW (<0.5)
IDV LOW (<0.5)
IVR LOW (<0.5)
PDI LOW (<0.5)
IDV LOW (<0.5)
MAS HIGH (>0.5)
UAI LOW (<0.5)
LTO HIGH (>0.5)
IVR LOW (<0.5)
1 Japan 0.48 0.43 0.95 0.91 0.88 0.42 2 3 5
2 Pakistan 0.49 0.03 0.47 0.67 0.48 0.00 2 3 3
3 Hong Kong 0.64 0.16 0.55 0.23 0.59 0.17 2 2 5
4 China 0.78 0.10 0.64 0.24 0.86 0.24 2 2 5
5 Lebanon 0.72 0.35 0.63 0.46 0.10 0.25 2 2 4
6 India 0.74 0.46 0.54 0.35 0.49 0.26 2 2 4
7 Philippines 0.93 0.25 0.62 0.39 0.24 0.42 2 2 4
8 Albania 0.89 0.10 0.79 0.67 0.59 0.15 2 2 4
9 Indonesia 0.75 0.03 0.43 0.43 0.60 0.38 2 2 4
10 Vietnam 0.66 0.10 0.37 0.24 0.55 0.35 2 2 4
11 Singapore 0.71 0.10 0.45 0.00 0.71 0.46 2 2 4
12 Iraq 0.94 0.23 0.68 0.84 0.22 0.17 2 2 3
13 Morocco 0.66 0.43 0.51 0.65 0.10 0.25 2 2 3
14 Bangladesh 0.78 0.10 0.53 0.57 0.45 0.20 2 2 3
15 Zambia 0.55 0.29 0.37 0.46 0.27 0.42 2 2 3
16 Tanzania 0.66 0.16 0.37 0.46 0.31 0.38 2 2 3
17 Greece 0.55 0.29 0.55 1.00 0.43 0.50 2 2 3
18 South Korea 0.55 0.08 0.36 0.84 1.00 0.29 2 2 3
19 Bulgaria 0.66 0.23 0.37 0.84 0.68 0.16 2 2 3
20 Taiwan 0.53 0.06 0.42 0.66 0.93 0.49 2 2 3
21 Russia 0.92 0.34 0.33 0.95 0.80 0.20 2 2 3
22 Croatia 0.70 0.27 0.37 0.78 0.56 0.33 2 2 3
23 Portugal 0.58 0.19 0.27 0.99 0.25 0.33 2 2 2
24 Spain 0.52 0.49 0.39 0.85 0.46 0.44 2 2 2
25 Egypt 0.66 0.16 0.42 0.78 0.03 0.04 2 2 2
26 Peru 0.60 0.05 0.39 0.86 0.22 0.46 2 2 2
27 Turkey 0.62 0.32 0.42 0.84 0.44 0.49 2 2 2
15
28 Serbia 0.84 0.16 0.40 0.91 0.50 0.28 2 2 2
29 Slovenia 0.67 0.19 0.15 0.87 0.47 0.48 2 2 2
30 Romania 0.89 0.23 0.39 0.89 0.50 0.20 2 2 2
31 Burkina Faso 0.66 0.04 0.47 0.51 0.24 0.18 2 2 2
32 Thailand 0.60 0.10 0.31 0.61 0.29 0.45 2 2 2
33 Iran 0.53 0.37 0.40 0.55 0.10 0.40 2 2 2
34 Jordan 0.66 0.23 0.42 0.62 0.13 0.43 2 2 2
35 Libya 0.78 0.33 0.49 0.65 0.20 0.34 2 2 2
36 Hungary 0.39 0.86 0.87 0.80 0.56 0.31 1 2 4
37 Germany 0.27 0.70 0.64 0.62 0.82 0.40 1 2 4
38 Italy 0.44 0.81 0.68 0.73 0.59 0.30 1 2 4
39 Argentina 0.43 0.43 0.54 0.85 0.17 0.62 1 2 3
40 Trinidad and Tobago 0.40 0.05 0.56 0.51 0.09 0.80 1 2 3
41 Lithuania 0.35 0.61 0.15 0.62 0.81 0.16 1 2 3
42 Estonia 0.33 0.61 0.26 0.57 0.81 0.16 1 2 3
43 Latvia 0.37 0.73 0.04 0.60 0.68 0.13 1 2 3
44 Slovakia 1.00 0.51 1.00 0.47 0.76 0.28 1 1 4
45 Dominican Republic 0.61 0.23 0.63 0.40 0.09 0.54 1 1 3
46 Czech Republic 0.52 0.58 0.55 0.72 0.69 0.29 1 1 3
47 Poland 0.64 0.61 0.62 0.92 0.35 0.29 1 1 2
48 Colombia 0.63 0.01 0.62 0.78 0.09 0.83 1 1 2
49 Saudi Arabia 0.94 0.16 0.58 0.78 0.33 0.52 1 1 2
50 Mexico 0.79 0.23 0.67 0.80 0.21 0.97 1 1 2
51 Venezuela 0.79 0.00 0.72 0.74 0.13 1.00 1 1 2
52 Nigeria 0.78 0.23 0.58 0.51 0.09 0.84 1 1 2
53 Mozambique 0.83 0.04 0.35 0.39 0.07 0.80 1 1 2
54 Cape Verde 0.72 0.10 0.11 0.35 0.08 0.83 1 1 2
55 Malaysia 1.00 0.18 0.47 0.30 0.39 0.57 1 1 2
56 France 0.64 0.75 0.40 0.85 0.61 0.48 1 1 2
57 Uruguay 0.56 0.30 0.35 0.99 0.23 0.53 1 1 1
58 Chile 0.58 0.14 0.24 0.85 0.28 0.68 1 1 1
59 El Salvador 0.62 0.09 0.37 0.93 0.17 0.89 1 1 1
60 Brazil 0.65 0.33 0.46 0.74 0.42 0.59 1 1 1
61 Ghana 0.78 0.04 0.37 0.62 0.00 0.72 1 1 1
62 Angola 0.81 0.08 0.16 0.57 0.11 0.83 1 1 1

16
63 New Zealand 0.12 0.85 0.56 0.45 0.30 0.75 0 1 3
64 Ireland 0.19 0.73 0.66 0.29 0.21 0.65 0 1 3
65 Australia 0.28 0.99 0.59 0.47 0.18 0.71 0 1 3
66 South Africa 0.43 0.67 0.61 0.45 0.31 0.63 0 1 3
67 United Kingdom 0.27 0.97 0.64 0.29 0.49 0.69 0 1 3
68 United States 0.33 1.00 0.60 0.41 0.23 0.68 0 1 3
69 Austria 0.00 0.54 0.78 0.67 0.58 0.63 0 1 3
70 Switzerland 0.26 0.71 0.68 0.54 0.73 0.66 0 1 3
71 Netherlands 0.30 0.86 0.09 0.49 0.66 0.68 0 1 3
72 Sweden 0.22 0.75 0.00 0.23 0.51 0.78 0 1 3
73 Norway 0.22 0.72 0.03 0.46 0.32 0.55 0 1 2
74 Iceland 0.21 0.61 0.05 0.46 0.25 0.67 0 1 2
75 Canada 0.31 0.86 0.49 0.43 0.33 0.68 0 1 2
76 Denmark 0.08 0.78 0.12 0.16 0.32 0.70 0 1 2
77 Luxembourg 0.33 0.61 0.47 0.67 0.63 0.56 0 1 2
78 Finland 0.25 0.65 0.22 0.55 0.35 0.57 0 1 1
79 Belgium 0.61 0.80 0.52 0.93 0.81 0.57 0 0 2
80 Malta 0.51 0.59 0.44 0.96 0.45 0.66 0 0 0
17
Remarkably, the first seven places are held exclusively by Asian countries. Moreover, out
of the 15 top countries, 12 are in Asia, and out of the 25 bottom countries, none are in Asia. This
is a direct result of the circumstance that Asian countries, overall, score low on individualism
and indulgence, having an advantageous combination of the average scores on these two
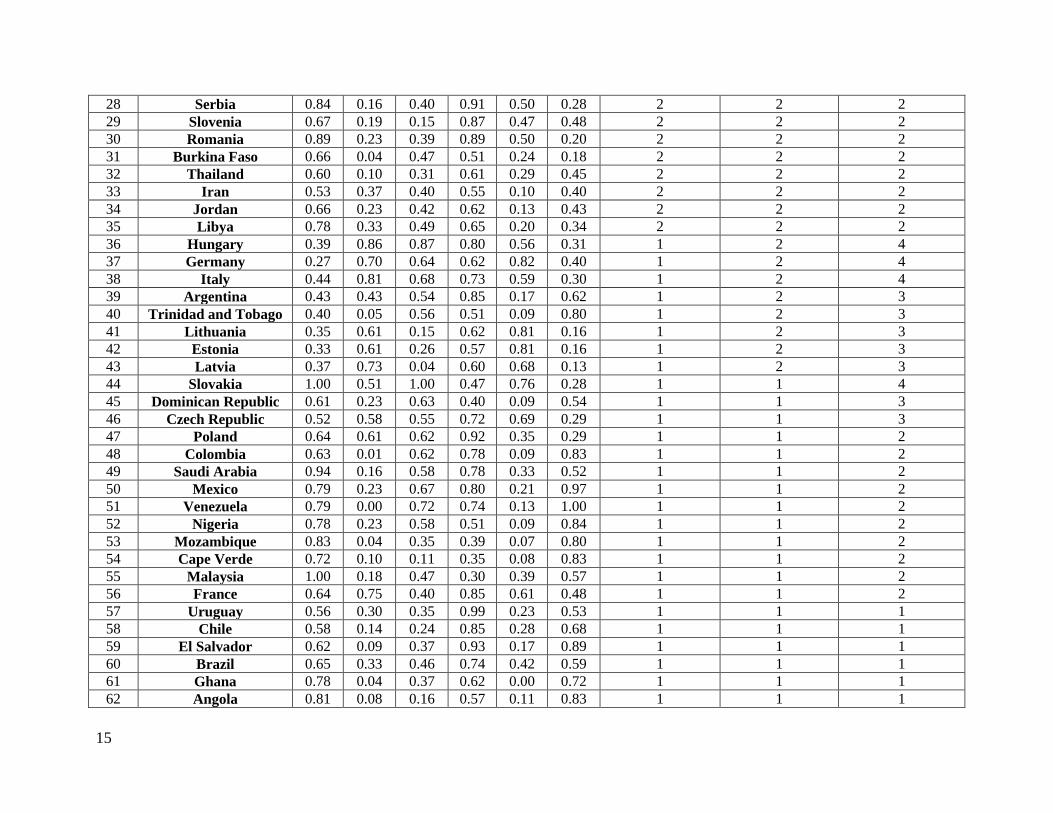
dimensions when compared to the rest of the world (see Figure 2). In contrast, due to their
cultural combination of high individualism and high indulgence, Western world‟s countries
occupy the very bottom of the table and are not represented among the top 15 countries.
Figure 2 - Average values of scores on the six Hofstede's cultural dimensions by continent
The literature repeatedly reports a delineation between hospitality culture in Asia and the
Western world (Manrai & Manrai, 2011; Tsang & Ap, 2007), whereby the Asian hospitality
culture consistently receives compliments for the excellence of its hotel service (Piuchan &
Pang, 2015; Sucher, Pusiran & Chon, 2013; Tan, Cherapanukorn, Kim & Chon, 2014). Some
practitioners, including McBride (2010), even claim that „good service is in Asia‟s DNA‟. The
results presented herein suggest that the delineation between Asia and the West, which may have
been perceived by some readers as overly stereotypical and based primarily on anecdotal, rather
than empirical evidence, is indeed highly relevant in the context of the hotel services industry.
We also note that the rankings of the individual countries are consistent with their
respective portrayals in the scientific and professional literature. For instance, Japan, as the top
ranked nation, is well known for their unique approach to hospitality, termed „omotenashi‟
(Ikeda, 2012, p. 145). Omotenashi implies an employee‟s intrinsic motivation (Sato & Al-
alsheikh, 2014, p. 1) to provide fantastic service, from the core of the heart without expectation
of any return (Belal, Shirahada & Kosaka, 2013, p. 29), making guests feel relaxed without
interruption (World Tourism Organisation and Korea Culture & Tourism Institute, 2016, p. 76).

18
3.3. Justification of the modelling approach in the light of the results
At this point, we can additionally clarify the need to employ the complex statistical
model described in the methodology section, as a pragmatic reader may be wondering whether
the conclusions about the levels of service quality by country and region could have been drawn
based solely on the average values of ratings on the corresponding evaluation criteria. Such a
comparison of average values is inappropriate because of the presence of the spill-over effect
described in Section 3.3. For instance, Asian countries, aggregately, have a lower average score
on the service quality criteria than Australia, European and North American countries (4.08 as
compared to 4.10, 4.17 and 4.20, respectively). This observation is misleading, however, since
the average scores for service quality for the later regions are inflated by the satisfaction spill-
over from their relatively higher scores on other evaluation criteria, primarily from location,
cleanliness and value. Similarly, it can be noted from looking at the average values of rating
scores on service quality criterion by country that Japan, which is identified as the most gifted
nation for providing high quality hotel services, nominally ranks just above the average for this
criterion, well below Malta, which is identified as the least disposed nation. This simple method
doesn‟t make it obvious that Japan‟s score on service quality is considerably lowered by its low
scores on other criteria, mainly the quality of rooms (e.g. „ryokan‟ and „minshuku‟ are unique
and authentic Japanese types of accommodation that may be considered overly basic by
international guests), while Malta‟s score on the same criteria is inflated by spill-over by
generally relatively high scores on all other criteria, especially location and sleep quality criteria
(Valletta occupies a small geographical area, with most hotels within walking distance of the city
centre).
4. Conclusions The main finding of the study is that, after accounting for all major factors affecting a
guest‟s satisfaction, the services of hotel staff in countries characterised by pronounced
collectivism and restraint consistently receive more favourable guest ratings that those provided
in countries characterised by pronounced individualism and indulgence. Assuming that hotel
workers are mainly locals, this finding translates into the proposition that individuals raised in
the collectivistic and restrained societies which prevail in most Asian countries, are relatively
more culturally disposed to providing high-quality hotel services than individuals from the
Western world. While this proposition has been repeatedly deliberated in the literature, it has
been mainly supported by personal experience or anecdotal evidence. This study is the first to
provide solid and credible empirical evidence for such a proposition.
4.1. Implications for practitioners
Our findings have important implications for hotel HR managers. Specifically, the
findings suggest that hotels operating in countries that have high economic standards, but are not
particularly culturally disposed to providing high-quality hotel services (the UK, US,
Switzerland, Belgium, Finland, Luxemburg, France, Denmark, Canada, Norway, Sweden etc.)
should aim to hire more workers from the less developed countries that have a cultural edge as
regards providing hotel services (Pakistan, China, India, Lebanon, Philippines, Albania,
Indonesia, Vietnam). On the other hand, hotels operating in highly developed countries where
individuals are culturally disposed for providing high quality hotel services, such as Japan, Hong
19
Kong or Singapore should mainly rely on local workers and resist the temptation to hire less
costly staff from countries that are not particularly disposed to this type of job, because the
savings in labour costs may be outweighed by a decrease in revenue caused by a reduction in the
quality of services provided.
We should also note that our findings are by no means limited to national cultures. HR
managers working in the hotel industry can use questionnaires to identify and hire the candidates
who score highly on collectivism and restraint, regardless of their national culture, to boost the
quality of their services.
In addition to these two criteria, hotels with a significant proportion of guests from
countries characterised by pronounced power distance, such as Slovakia, Malaysia, Iraq, Saudi
Arabia, Philippines, or Russia should, due to the observed negative interaction in the power
distance dimension, preferentially hire workers not originating from these countries, or workers
with less pronounced power distance in general, to avoid potential problems in communication
between the two parties.
4.2. Limitations and recommendations for future research
The key methodological limitation of our study is the assumption that employees of the
hotels are locals. While this assumption may hold for some countries, for most developed
countries it is violated to the extent which may significantly affect the reliability of the results
presented in this study. To improve the reliability of the results, future studies should consider
assigning country-specific weights within the regression model that would be equal to the
estimated percentages of domestic workers in the hotel industries of their respective capital
cities.
Finally, the results presented in this study are likely to be specific to the non-managerial
staff in the hotel industry. Managerial positions in the hotel industry may require a different
combination of cultural and personal characteristics. At best, the results may be applicable to the
hospitality industry, but certainly should not be generalised to assess a nation‟s culturally-
induced disposition for providing high-quality services in other industries. For instance, as noted
by Nazarian et al. (2017), the UK‟s national culture is characterised by a low power distance,
which empowers employees, high individualism, which encourages individual responsibility and
innovation, high masculinity, which indicates a high level of commitment to work and drive for
success, and low uncertainty avoidance, which is associated with an employee‟s propensity to try
new things, which is likely to make their organisations extremely agile and allow their
employees to provide superb service in numerous service industries where those qualities are
advantageous, such as the financial industry or education.

20
Bibliography
Belal, H. M., Shirahada, K. & Kosaka, M. (2013). Value co-creation with customer through
recursive approach based on Japanese Omotenashi service. International Journal of Business
Administration, 4(1), 1923–4007. http://doi.org/10.5430/ijba.v4n1p28
Brewer, P. & Venaik, S. (2014). The ecological fallacy in national culture research. Organization
Studies, 35(7), 1063–1086. http://doi.org/10.1177/0170840613517602
Browne, W. J., Goldstein, H. & Rasbash, J. (2001). Multiple membership multiple classification
(MMMC) models. Statistical Modelling, 1(2), 103–124.
http://doi.org/10.1191/147108201128113
Bürkner, P.-C. (2017). brms: An R package for Bayesian multilevel models using Stan. Journal
of Statistical Software, 80(1), 1–28. http://doi.org/10.18637/jss.v080.i01
Chen, C. C., Meindl, J. R. & Hui, H. (1998). Deciding on equity or parity: A test of situational,
cultural, and individual factors. Journal of Organizational Behavior, 19(2), 115-129.
http://doi.org/10.1002/(SICI)1099-1379(199803)19:2<115::AID-JOB867>3.0.CO;2-J
Chen, R. X. Y., Cheung, C. & Law, R. (2012). A review of the literature on culture in hotel
management research: What is the future? International Journal of Hospitality Management,
31(1), 52–65. http://doi.org/10.1016/j.ijhm.2011.06.010
Crotts, J. C. & Erdmann, R. (2000). Does national culture influence consumers‟ evaluation of
travel services? A test of Hofstede‟s model of cross-cultural differences. Managing Service
Quality, 10(6), 410–419. http://doi.org/10.1108/09604520010351167
Dawson, M., Abbott, J. A. & Shoemaker, S. (2011). The Hospitality Culture Scale: A measure
organizational culture and personal attributes. International Journal of Hospitality
Management, 30(2), 290–300. http://doi.org/10.1016/j.ijhm.2010.10.002
Doney, P. M., Cannon, J. P. & Mullen, M. R. (1998). Understanding the influence of national
culture on the development of trust. Academy of Management Review, 23(3), 601-620.
http://doi.org/10.5465/AMR.1998.926629
Furrer, O., Liu, B. S.-C. & Sudharshan, D. (2000). The relationships between culture and service
quality perceptions: Basis for cross-cultural market segmentation and resource allocation.
Journal of Service Research, 2(4), 355–371. http://doi.org/10.1177/109467050024004
Gao, B., Li, X., Liu, S. & Fang, D. (2018). How power distance affects online hotel ratings: The
positive moderating roles of hotel chain and reviewers‟ travel experience. Tourism
Management, 65, 176–186. http://doi.org/10.1016/J.TOURMAN.2017.10.007
Gelman, A. & Rubin, D. B. (1992). Inference from iterative simulation using multiple sequences.
Statistical Science, 7(4), 457–472. http://doi.org/10.1214/ss/1177011136
Hofstede, G. (1980). Culture‟s consequences. Beverly Hills, CA: Sage Publications.

21
Hofstede, G. (2010). Hofstede dimension data matrix. Retrieved January 1, 2016, from
http://geerthofstede.com/research-and-vsm/dimension-data-matrix/
Hofstede, G., Hofstede, G. J. & Minkov, M. (2010). Cultures and organizations (3rd ed.). New
York: McGraw Hill.
Hofstede, G. J. (2010). Synthetic culture script for indulgence. Retrieved from
https://geerthofstede.com/wp-content/uploads/2016/08/sixth-dimension-synthetic-culture-
profiles.doc
Hope, C. A. (2004). The impact of national culture on the transfer of “best practice operations
management” in hotels in St. Lucia. Tourism Management, 25(1), 45–59.
http://doi.org/10.1016/S0261-5177(03)00059-1
Ikeda, N. (2012). Omotenashi: Japanese hospitality as the global standard. In M. Yasuhiro, I.
Noriyuki, T. Matsuo & N. Yamaguchi (Eds.), Management of Service Businesses in Japan
(pp. 145–154). Singapore: World Scientific Publishing.
http://doi.org/10.1142/9789814374675_0010
Inglehart, R. & Baker, W. E. (2000). Modernization, Cultural Change, and the Persistence of
Traditional Values. American Sociological Review, 65(1), 19.
http://doi.org/10.2307/2657288
Inkeles, A. & Levinson, J. (1969). National character: The study of modal personality and
sociocultural systems. In G. Lindzey & E. Aronson (Eds.), The handbook of social
psychology (Vol. 4, pp. 418–506). Reading, MA: Addison-Wesley.
Jahandideh, B., Golmohammadi, A., Meng, F., O„Gorman, K. D. & Taheri, B. (2014). Cross-
cultural comparison of Chinese and Arab consumer complaint behavior in the hotel context.
International Journal of Hospitality Management, 41, 67–76.
http://doi.org/10.1016/j.ijhm.2014.04.011
Kirkman, B. L., Lowe, K. B. & Gibson, C. B. (2006). A quarter century of Culture‟s
Consequences: A review of empirical research incorporating Hofstede‟s cultural values
framework. Journal of International Business Studies, 37(3), 285–320.
http://doi.org/10.1057/palgrave.jibs.8400202
Koc, E., Ar, A. A. & Aydin, G. (2017). The potential implications of indulgence and restraint on
service. Ecoforum, 6(3), 2013–2018.
Kotler, P. R. & Keller, K. L. (2009). Marketing management (13th ed.). Upper Saddle River,
N.J.: Prentice Hall.
Kozak, M. (2001). Comparative assessment of tourist satisfaction with destinations across two
nationalities. Tourism Management, 22(4), 391–401. http://doi.org/10.1016/S0261-
5177(00)00064-9
Li, M. (2012). Cross-cultural tourist research: A meta-analysis. Journal of Hospitality & Tourism
Research, 38(1), 40–77. http://doi.org/10.1177/1096348012442542

22
Lowie, R. H. (1917). Culture and Ethnology. New York: Douglas C. McMurtrie.
Manrai, L. A. & Manrai, A. K. (2011). Hofstede‟s Cultural Dimensions and Tourist Behaviors:
A review and conceptual framework. Journal of Economics, Finance and Administrative
Science, 16(31), 23–47. Retrieved from http://ideas.repec.org/a/ris/joefas/0033.html
Matzler, K., Renzl, B. & Rothenberger, S. (2006). Measuring the relative importance of service
dimensions in the formation of price satisfaction and service satisfaction: A case study in the
hotel industry. Scandinavian Journal of Hospitality and Tourism, 6(3), 179–196.
http://doi.org/10.1080/15022250600872850
McBride, J. (2010). Is Asian hospitality geared up for tomorrow‟s travelers? | CNN Travel.
Retrieved from http://travel.cnn.com/explorations/life/tell-me-about-it/asian-service-geared-
travelers-tomorrow-671162/
Mok, C. & Armstrong, R. W. (1998). Expectations for hotel service quality: Do they differ from
culture to culture? Journal of Vacation Marketing, 4(4), 381–391.
http://doi.org/10.1177/135676679800400406
Mok, C. & Armstrong, R. W. (1998). Expectations for hotel service quality: Do they differ from
culture to culture? Journal of Vacation Marketing, 4(4), 381–391.
http://doi.org/10.1177/135676679800400406
Murdock, G. P. (1932). The science of culture. American Anthropologist, 34(2), 200–215.
http://doi.org/10.1525/aa.1932.34.2.02a00020
Nazarian, A., Atkinson, P. & Foroudi, P. (2017). Influence of national culture and balanced
organizational culture on the hotel industry‟s performance. International Journal of
Hospitality Management, 63, 22–32. http://doi.org/10.1016/j.ijhm.2017.01.003
Newman, K. L. & Nollen, S. D. (1996). Culture and congruence: The fit between management
practices and national culture. Journal of International Business Studies, 27(4), 753-779.
http://doi.org/10.1057/palgrave.jibs.8490152
Oberg, K. (1960). Cultural shock: Adjustment to new cultural environments. Practical
Anthropologist, 7, 177–182.
Piuchan, M. & Pang, L. (2015). Service experience dimensions in Asian hospitality : A case
study of hotels in Thailand and Hong Kong. In EuroCHRIE Conference 2015. Manchester,
UK: Manchester Metropolitan University. Retrieved from
https://www.researchgate.net/publication/283445388
Prayag, G. & Ryan, C. (2012). Visitor interactions with hotel employees: The role of nationality.
International Journal of Culture, Tourism and Hospitality Research, 6(2), 173–185.
http://doi.org/10.1108/17506181211233090
R Core Team. (2018). R: A language and environment for statistical computing. Vienna, Austria:
R Foundation for Statistical Computing. Retrieved from http://www.r-project.org
23
Radojevic, T., Stanisic, N. & Stanic, N. (2016). Inside the Rating Scores: A Multilevel Analysis
of the Factors Influencing Customer Satisfaction in the Hotel Industry, Mendeley Data, v1.
http://doi.org/10.17632/kwsrxshf9x.1
Radojevic, T., Stanisic, N. & Stanic, N. (2017). Inside the rating scores: A multilevel analysis of
the factors influencing customer satisfaction in the hotel industry. Cornell Hospitality
Quarterly, 58(2), 134-164. http://doi.org/10.1177/1938965516686114
Radojevic, T., Stanisic, N., Stanic, N. & Davidson, R. (2018). The effects of traveling for
business on customer satisfaction with hotel services. Tourism Management, 67, 326–341.
http://doi.org/10.1016/j.tourman.2018.02.007
Reisinger, Y. & Dimanche, F. (2010). International tourism (1st ed.). London: Routledge.
Saleh, F. & Ryan, C. (1991). Analysing service quality in the hospitality industry using the
SERVQUAL model. Service Industries Journal, 11(3), 324–345.
Sato, Y. & Al-alsheikh, A. (2014). Comparative analysis of the western hospitality and the
Japanese Omotenashi : Case study research of the hotel industry. Retrieved from
http://www.kwansei-ac.jp/iba/assets/pdf/journal/BandA_review_December_14p1-16.pdf
Schwartz, S. (2006). A theory of cultural value orientations: Explication and applications.
Comparative Sociology, 5(2), 137–182. http://doi.org/10.1163/156913306778667357
Stauss, B. & Mang, P. (1999). “Culture shocks” in inter-cultural service encounters? Journal of
Services Marketing, 13(4/5), 329–346. http://doi.org/10.1108/08876049910282583
Sucher, W., Pusiran, A. K. & Chon, K. (2013). The influence of Asian cultural values in the
Asian hospitality services. In The 11th APacCHRIE Conference. Macau SAR, China.
Retrieved from https://www.researchgate.net/publication/281280171
Tan, E., Cherapanukorn, V., Kim, H. H. & Chon, K. (2014). The art of service in Asia : A
conceptual framework through a case study of hospitality industry in Thailand. In
Proceedings of the Global Tourism and Hospitality Conference and 11th Asia Tourism
Forum (pp. 1217–1244). Hong Kong, SAR, China: School of Hotel and Tourism
Management, The Hong Kong Polytechnic University.
Tepeci, M. & Bartlett, A. L. B. (2002). The hospitality industry culture profile: A measure of
individual values, organizational culture, and person–organization fit as predictors of job
satisfaction and behavioral intentions. International Journal of Hospitality Management,
21(2), 151–170. http://doi.org/10.1016/S0278-4319(01)00035-4
Torres, E. N., Fu, X. & Lehto, X. (2014). Examining key drivers of customer delight in a hotel
experience: A cross-cultural perspective. International Journal of Hospitality Management,
36, 255–262. http://doi.org/10.1016/j.ijhm.2013.09.007
Tsang, N. K.-F. & Ap, J. (2007). Tourists‟ perceptions of relational quality service attributes: A
cross-cultural study. Journal of Travel Research, 45(3), 355–363.
http://doi.org/10.1177/0047287506295911

24
Tylor, E. B. (1871). Primitive culture: Researches into the development of mythology,
philosophy, religion, art, and custom, Volume 1. London: John Murray. Retrieved from
http://books.google.com/books?hl=en&lr=&id=wslaAAAAcAAJ&oi=fnd&pg=PA40&dq=t
ylor+definition+of+culture+1871&ots=lUTzhZzPBV&sig=SBK1wnHdiswv3bFIhVlvAPZJi
vk
Van de Vijver, F. J. R. & Poortinga, Y. H. (2002). Structural equivalence in multilevel research.
Journal of Cross-Cultural Psychology, 33(2), 141–156.
http://doi.org/10.1177/0022022102033002002
Wasti, S. A. (2002). Affective and continuance commitment to the organization: Test of an
integrated model in the Turkish context. International Journal of Intercultural Relations.
http://doi.org/10.1016/S0147-1767(02)00032-9
World Tourism Organization and Korea Culture & Tourism Institute. (2016). Case studies of
traditional cultural accommodations in the Republic of Korea, Japan and China. Madrid:
UNWTO.
Yilmaz, C., Alpkan, L. & Ergun, E. (2005). Cultural determinants of customer- and learning-
oriented value systems and their joint effects on firm performance. Journal of Business
Research, 58(10), 1340–1352. http://doi.org/10.1016/j.jbusres.2004.06.002
Yilmaz, C. & Hunt, S. D. (2001). Salesperson Cooperation: The influence of relational, task,
organizational, and personal factors. Journal of the Academy of Marketing Science, 29(4),
335–357. Retrieved from http://sdh.ba.ttu.edu/JAMS 2001 - Salesperson Cooperation.pdf
Yuksel, A., Kilinc, U. & Yuksel, F. (2006). Cross-national analysis of hotel customers‟ attitudes
toward complaining and their complaining behaviours. Tourism Management, 27(1), 11–24.
http://doi.org/10.1016/j.tourman.2004.07.007