the cost of road crashes: a review of key issues · the cost of road crashes: a review of key...
TRANSCRIPT
The cost of road crashes: A review of key issues
Dr Richard Tooth 2010

Cost of road crashes i
About LECG
LECG is a global expert services firm with highly credentialed experts and professional staff with specialist knowledge in regulation, economics, financial and statistical theories and analysis, as well as in-depth knowledge of specific markets and industries. The company's experts provide independent testimony, original authoritative studies and strategic advice to both public and private sector clients including legislative, judicial, regulatory, policy and business decision-makers. LECG is listed on the NASDAQ Stock Exchange and has approximately 700 experts and professional staff worldwide. These experts are renowned academics, former senior government officials, experienced industry leaders and seasoned consultants. CANBERRA
Level 6, 39 London Circuit
PO Box 266
Canberra City ACT 2601, Australia
Ph: (61 2) 6263 5941
Fax: (61 2) 6230 5269
SYDNEY
Level 14, 68 Pitt Street
GPO Box 220
Sydney NSW 2001, Australia
Ph: (61 2) 9234 0200
Fax: (61 2) 9234 0201
MELBOURNE
Level 2, 65 Southbank Boulevard
Southbank VIC 3000, Australia
Ph: (61 3) 9626 4333
Fax: (61 3) 9626 4321
WELLINGTON
Level 9, Axon House, 1 Willeston Street
PO Box 587, Wellington 6001
Ph: (64 4) 472 0590
Fax: (64 4) 472 0596
AUCKLAND
Level 17, West Plaza Building
3-5 Albert Street
Auckland 1010
Ph: (64 9) 913 6240
Fax: (64 9) 913 4650
HONG KONG
3505-06 Tower Two, Lippo Centre
89 Queensway
Admiralty, Hong Kong
Ph: (852) 2106 3800
Fax: (852) 2106 3999
For information on this report please contact:
Name: Dr Richard Tooth
Telephone: (02) 9234 0216
Email: [email protected]
Cost of road crashes ii
Table of Contents
Executive Summary ........................................................................................... 1
1 Introduction ............................................................................................ 5
2 Background ............................................................................................ 6
3 Estimating the cost of road crashes in Australia ................................. 8
3.1 Overview of road crash costs .................................................................... 8
3.2 The loss of life and quality of life ............................................................. 10
3.3 Extensions to existing estimates ............................................................. 14
3.4 VSL approaches and values used around the world............................... 18
3.5 The cost of road crashes using the WTP approach ................................ 23
4 The internalisation of road crash costs .............................................. 25
4.1 Internalisation of costs by the driver at fault ............................................ 25
4.2 Other external costs associated with vehicle use ................................... 27
5 Conclusion ............................................................................................ 29
References ....................................................................................................... 32
Cost of road crashes 1
Executive Summary
Introduction
Road crashes are a significant issue for Australia. Each year over a thousand people die and tens of thousands of people are seriously injured on our roads.
An understanding of the road crash costs is important in guiding policies towards greater road safety and influencing planning and policy across all transport modes. The Bureau of Infrastructure Transport and Regional Economics (BITRE) recently published a study (BITRE study) that estimated the social road crash costs at $17.85 billion in 2006. Like the similar study conducted 10 years before, the study acknowledges the headline estimate is conservative and offers alternative estimates. However there is a risk that, as with the previous study, the conservative estimate will become the basis for analysis of road crash costs in Australia.
This paper re-evaluates, from a public policy perspective, the costs of road crashes and the extent to which these amounts are borne by the users who contribute to them.
The approach to valuing life
The loss of life and quality of life provides a challenge to estimating the costs of road crashes. A vehicle can be replaced (at a market determined price) — a life cannot.
Policy analysis is forward looking. As such we do not need to value lives lost but rather the benefit of reducing further risk to life. This is achievable. Everyday people make decisions that trade-off risks to their lives against other benefits and in doing so, exhibit a willingness to pay (WTP) for risk reduction. With information on this WTP, policy makers may estimate the value of preventing a fatality (VPF) also more commonly referred to as a value of a statistical life (VSL).
Government agencies around the world have adopted alternative approaches to estimating VSL. The human capital approach, a variant of which is used in the BITRE 2010 study, essentially involves estimating the value of productive output of people over their remaining lifetime. Applications of the human capital approach (including proposed hybrid alternatives) have largely excluded benefits of life (e.g. leisure) not associated with production and thus underestimated the value derived from life.
More direct estimates of VSL are obtained from studies using a ‘WTP approach’ based on peoples’ stated preferences (i.e. surveys) or revealed preferences (i.e. observed behaviour) on WTP for reduced risks. The results of these studies have confirmed that the human capital approach has led to a significant underestimate of the VSL.
While, the WTP approach has been criticised for having great variation in results, it is largely accepted as the preferred basis for policy analysis. Transport and other
Cost of road crashes 2
government agencies in the United States, UK, Canada, New Zealand and Europe now all promote the use of the WTP approach to estimating VSL.
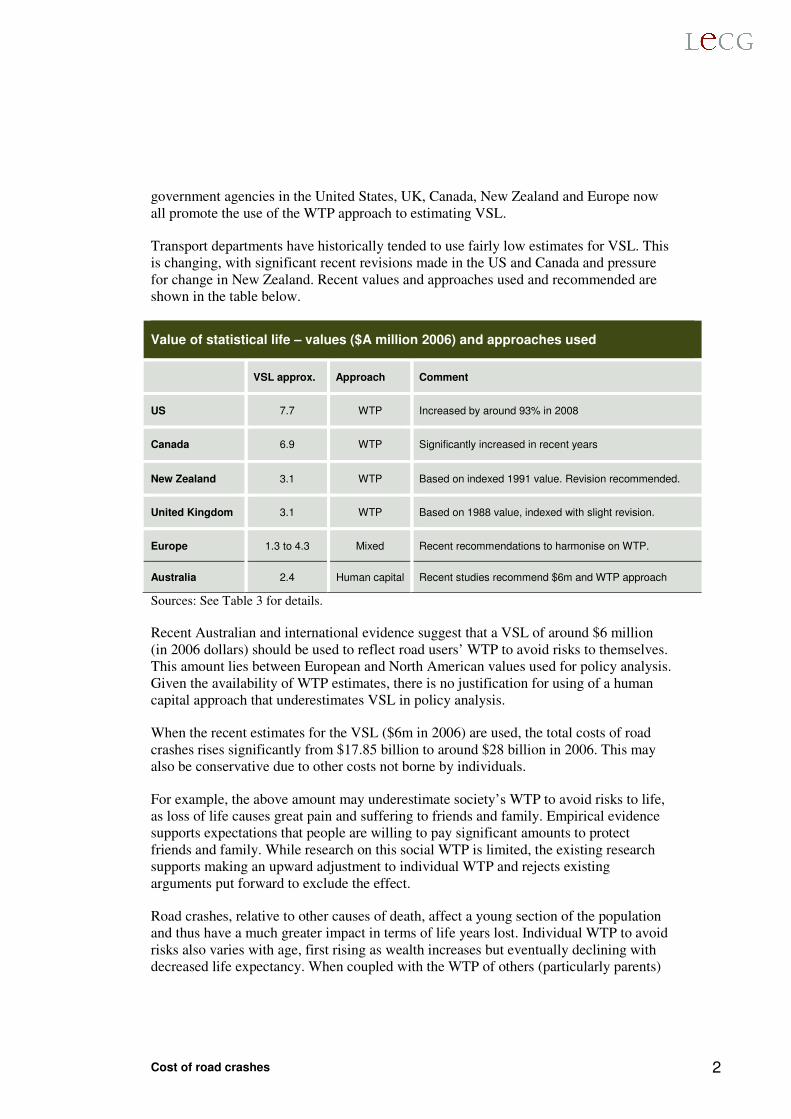
Transport departments have historically tended to use fairly low estimates for VSL. This is changing, with significant recent revisions made in the US and Canada and pressure for change in New Zealand. Recent values and approaches used and recommended are shown in the table below.
Value of statistical life – values ($A million 2006) and approaches used
VSL approx. Approach Comment
US 7.7 WTP Increased by around 93% in 2008
Canada 6.9 WTP Significantly increased in recent years
New Zealand 3.1 WTP Based on indexed 1991 value. Revision recommended.
United Kingdom 3.1 WTP Based on 1988 value, indexed with slight revision.
Europe 1.3 to 4.3 Mixed Recent recommendations to harmonise on WTP.
Australia 2.4 Human capital Recent studies recommend $6m and WTP approach
Sources: See Table 3 for details.
Recent Australian and international evidence suggest that a VSL of around $6 million (in 2006 dollars) should be used to reflect road users’ WTP to avoid risks to themselves. This amount lies between European and North American values used for policy analysis. Given the availability of WTP estimates, there is no justification for using of a human capital approach that underestimates VSL in policy analysis.
When the recent estimates for the VSL ($6m in 2006) are used, the total costs of road crashes rises significantly from $17.85 billion to around $28 billion in 2006. This may also be conservative due to other costs not borne by individuals.
For example, the above amount may underestimate society’s WTP to avoid risks to life, as loss of life causes great pain and suffering to friends and family. Empirical evidence supports expectations that people are willing to pay significant amounts to protect friends and family. While research on this social WTP is limited, the existing research supports making an upward adjustment to individual WTP and rejects existing arguments put forward to exclude the effect.
Road crashes, relative to other causes of death, affect a young section of the population and thus have a much greater impact in terms of life years lost. Individual WTP to avoid risks also varies with age, first rising as wealth increases but eventually declining with decreased life expectancy. When coupled with the WTP of others (particularly parents)
Cost of road crashes 3
for risk reduction for an individual, it seems likely that the social WTP for risk reduction will be largely declining with age of the individual. In such case the VSL for prevention of road crash fatalities would be relatively high compared to other causes of death.
The external costs of road crashes
The external costs of an activity are those not borne by the party undertaking the activity. External costs of road use have generally been estimated as being a small proportion of the total social costs. An increase in the human costs of road crashes would cause a significant upward revision to the estimate of external costs as much of the human cost is not borne by the road-users responsible for crashes.
An additional issue for road crash policy is that people are overconfident. On average people overestimate their driving ability and underestimate their risk of an accident. The implication of this is that drivers do not internalise all their own costs. Given that the human costs of road crashes can be estimated in tens of billions of dollars, a small underestimate of risk can have significant implications for the size of the costs that are not internalised.
External costs associated with vehicle size
In a two vehicle collision, the occupants of the smaller vehicle are far more likely to be killed or seriously injured than those in the larger vehicle. A key implication is that by their mere presence, heavy vehicles impose external costs on other road users. These costs include the additional severity of accidents, the additional discomfort to drivers of light vehicles and distortions in people’s choice of vehicle and road use.
Recent increases in the size of vehicles appear have led to increased concerns about the safety of users of conventional vehicles and other road users such as pedestrians, cyclists and motor-cyclists. Furthermore there is some evidence that increased vehicle size is associated with more aggressive driving behaviour.
The presence of larger vehicles encourages consumers, in the interest of their own safety, to themselves purchase larger vehicles. This effect has been described as an ‘arms race’ for larger vehicles which results in increased private spending on larger vehicles and running costs and greater social costs associated with emissions and congestion.
The problem of vehicle size is an increasingly important issue that demands further attention. It should be possible to estimate the impact of replacing large vehicles with smaller vehicles or other forms of transport. Such analysis has been undertaken for the United States where it has been estimated that the safety benefits of replacing sports utility vehicles with smaller cars is in excess of A$300 per vehicle per year.
Cost of road crashes 4
Conclusions
The key conclusions from this review are:
• The significance of road crash costs in Australia has been consistently underestimated, both in terms of the overall cost and the extent to which these costs are incorporated (i.e. internalised) in road-users’ decisions.
• Based on recent research, the total road crash costs in Australia are more than what has been commonly reported. This increase relates to costs of loss of life and quality of life, much of which is not borne by the road-users responsible.
• The value of risk to life is a key issue. For policy analysis in all transport modes, values used should reflect the WTP-based approach rather than the human-capital approach that undervalues life. The WTP-based approach is now common practice in other areas and other developed countries.
• The impact on friends and family should be further investigated and should be considered in policy analysis.
• Greater consideration should also be given to the problem of (passenger and freight) vehicle size and the external costs that larger vehicles impose on other road users.
• Overconfidence causes road-users to not fully internalise the costs to themselves as they underestimate their likelihood of being involved in a road crash.
Cost of road crashes 5
1 Introduction
No-one would deny that road crashes are a significant issue in Australia. Each year there are over a thousand people killed and tens of thousands of people seriously injured on our roads. However, there is substantial debate as to the social costs of road crashes and the extent to which these are borne by the road-users who contribute to them. An understanding of these costs is important in evaluating the policies aimed at improving road safety.
This paper examines issues in the debate over road crash costs. The objective of this study is not to provide an estimate of the costs or to recommend policies, but rather to review and clarify a number of important issues relating to road crash costs and the extent to which these are incorporated into people’s decisions.
The paper is divided into four additional sections. Section 2 provides some background as to the costs associated with road crashes and how costs are used in policy formation.
Section 3 examines the costs of road crashes in more detail. A key focus of this section is the debate on costs associated with loss of life, including the approaches and estimates used in other countries.
Section 4 examines the extent to which the costs of road crashes are internalised, that is borne by the road users who contribute to these costs and incorporated into their decision making.
Section 5 concludes with a brief discussion of implications.
Cost of road crashes 6
2 Background
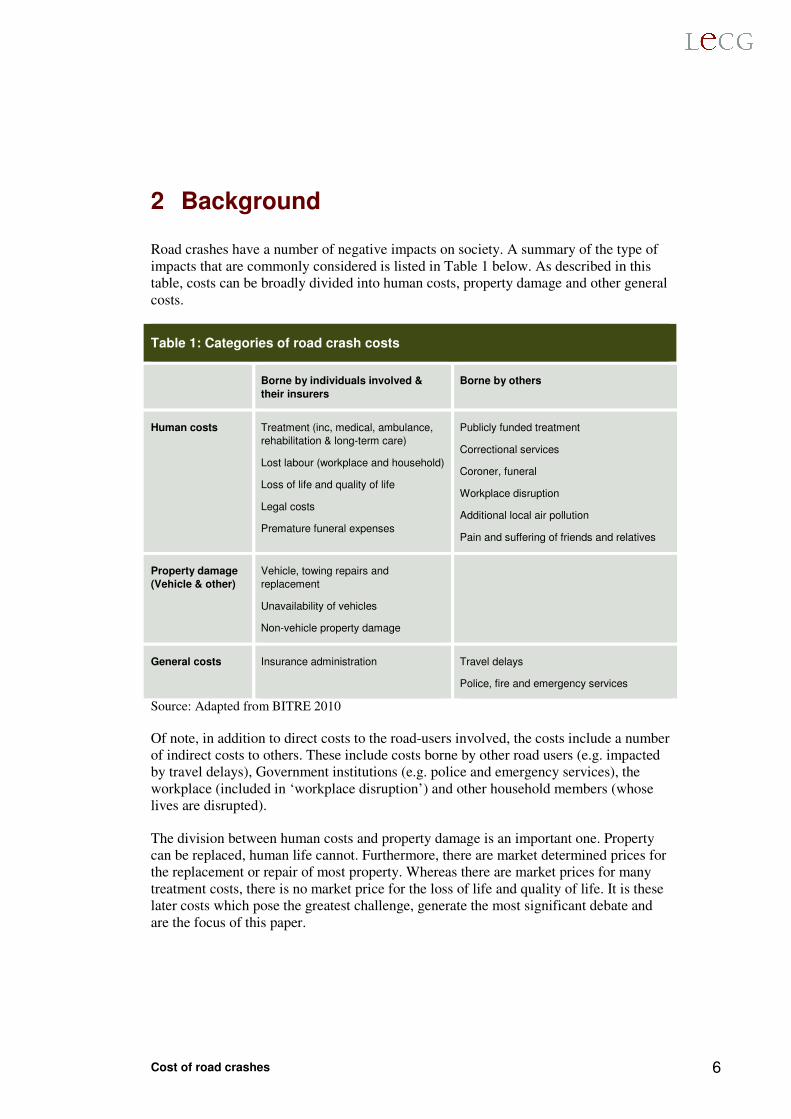
Road crashes have a number of negative impacts on society. A summary of the type of impacts that are commonly considered is listed in Table 1 below. As described in this table, costs can be broadly divided into human costs, property damage and other general costs.
Table 1: Categories of road crash costs
Borne by individuals involved &
their insurers
Borne by others
Human costs Treatment (inc, medical, ambulance,
rehabilitation & long-term care)
Lost labour (workplace and household)
Loss of life and quality of life
Legal costs
Premature funeral expenses
Publicly funded treatment
Correctional services
Coroner, funeral
Workplace disruption
Additional local air pollution
Pain and suffering of friends and relatives
Property damage
(Vehicle & other)
Vehicle, towing repairs and
replacement
Unavailability of vehicles
Non-vehicle property damage
General costs Insurance administration
Travel delays
Police, fire and emergency services
Source: Adapted from BITRE 2010
Of note, in addition to direct costs to the road-users involved, the costs include a number of indirect costs to others. These include costs borne by other road users (e.g. impacted by travel delays), Government institutions (e.g. police and emergency services), the workplace (included in ‘workplace disruption’) and other household members (whose lives are disrupted).
The division between human costs and property damage is an important one. Property can be replaced, human life cannot. Furthermore, there are market determined prices for the replacement or repair of most property. Whereas there are market prices for many treatment costs, there is no market price for the loss of life and quality of life. It is these later costs which pose the greatest challenge, generate the most significant debate and are the focus of this paper.
Cost of road crashes 7
The appropriate method for valuing costs depends on the purpose. There are a number of reasons why we might be interested in the costs of road crashes. These include:
• To determine compensation for those impacted by a road crash.
• To forecast the impact of road crashes on key measures such as productivity.
• To assess policies and activities that might change the likelihood of crashes.
For some categories the valuation will be similar regardless of the purpose of valuation. This is the case for goods and services that are easily replaced at established prices in the market. For example, the pre-crash market value of a vehicle lost during a crash provides a good estimate of the insurance cover a vehicle owner obtains, the loss to productivity and the benefit to society of preventing the vehicle’s loss.
In the case of loss of life or quality of life, the purpose for the analysis is important. For example, people with no dependents may pay significant sums to reduce risk to their lives but have no need for compensation once dead.
This paper examines the costs of road crashes for the purposes of policy analysis i.e. so as to evaluate the costs and benefits of alternative policies. For this purpose we are not interested in the cost of road crashes that have occurred but rather the benefits of reducing the likelihood and severity of road crashes in the future.
Taking a forward looking approach to costing simplifies the problem of estimating human costs. We do not wish to value life but rather to value a change in the risk to life. This is achievable. Every day people make decisions that trade-off risk to their lives against other benefits. For example, people may choose to pay more to fly on a safer airline, or take more time crossing a road by crossing at a safer location. In making these decisions, people exhibit a willingness to pay (or willingness to accept) for a change in the risk to their life.
Thus, as Kip Viscusi, a leading academic and policy adviser on valuing of life, says most succinctly:
… if we go back to first principles, the economic value of the benefit of any
policy outcome is society’s willingness to pay for the benefit.
Viscusi (2008)
The challenge of determining what society would be willing to pay (WTP) for the benefit of reducing the likelihood of accidents is discussed in the following section.
For the purposes of policy analysis we are also interested in the extent that costs of road crashes are incorporated into road-users’ decision making. If the costs were fully incorporated then, assuming well-functioning markets, there would be little justification for government intervention into road safety. However, many costs are external to the decisions of road uses who contribute to them. As shown in Table 1 there are many costs not borne by the individuals involved (and their insurers).
Cost of road crashes 8
Although this paper focuses on the cost of road crashes and not specific policies, some comment on policy analysis is appropriate.
The existence of external costs or other market failures do not by themselves justify policy intervention. The benefits of any intervention need to be weighed against the costs, particularly in light of changes in behaviour resulting from the policy.
For policy analysis we are often interested in costs associated with an activity (e.g. an additional road use) and in particular the marginal cost of the activity. The marginal cost of an activity is the additional cost caused by a small increase in the level of that activity. Generally it is much easier to measure total and average costs than marginal costs. It is not clear to what extent this is an issue with regards to road crashes. For example, increased road use could lead to an increased rate (per level of road use) of road crashes but a decreased rate of fatalities due to lower speeds.
For most transport policy analysis, it is also necessary to consider alternative transport modes. Some of the issues raised, particularly in Section 3, also apply to other costs of transportation and other transport modes. For example, similar arguments are also applicable to issues related to air pollution caused by transport and the cost of incidents that occur at railway level crossings. Due to the relatively high incidence of road crashes, the issues raised are far more significant to road use than other modes such as rail.
The valuation approaches adopted should be consistent across all transport modes. No one transport mode cannot be considered in isolation of other modes as, for example:
• Policy in one mode affects other modes through competition and modal integration.
• Different modes interact, for example via incidents at railway level crossings.
• Different modes compete for funding, such as for safety improvements.
3 Estimating the cost of road crashes in Australia
3.1 Overview of road crash costs
An important reference point for studying the costs of road crashes in Australia is the study by Bureau of Infrastructure Transport and Regional Economics (BITRE) titled ‘Cost of road crashes in Australia 2006’ (“the BITRE study”). The study (BITRE 2010) was a comprehensive examination of the costs of road crashes and has since been the basis of many estimates of the total and external costs of road crashes.
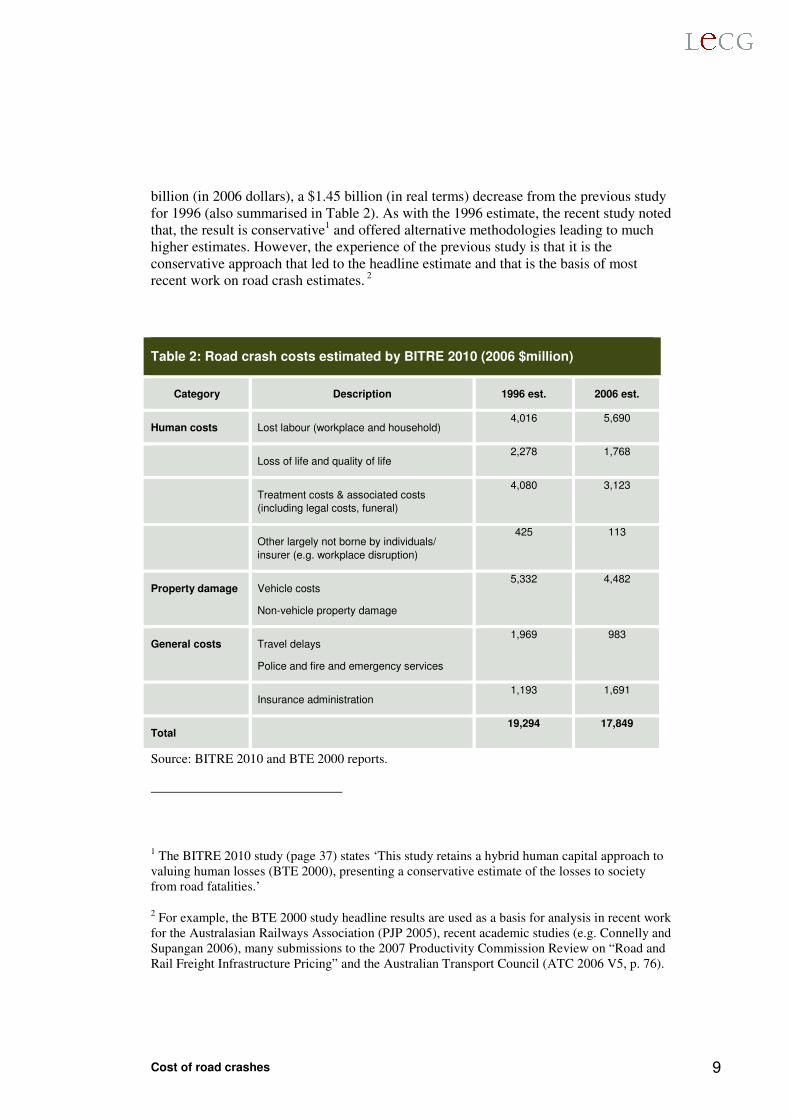
The main results of the study are summarised in Table 2 below. The headline result of this study was that road crash costs in Australia in 2006 were estimated around $17.85
Cost of road crashes 9
billion (in 2006 dollars), a $1.45 billion (in real terms) decrease from the previous study for 1996 (also summarised in Table 2). As with the 1996 estimate, the recent study noted that, the result is conservative1 and offered alternative methodologies leading to much higher estimates. However, the experience of the previous study is that it is the conservative approach that led to the headline estimate and that is the basis of most recent work on road crash estimates. 2
Table 2: Road crash costs estimated by BITRE 2010 (2006 $million)
Category Description 1996 est. 2006 est.
Human costs Lost labour (workplace and household) 4,016 5,690
Loss of life and quality of life 2,278 1,768
Treatment costs & associated costs
(including legal costs, funeral)
4,080 3,123
Other largely not borne by individuals/
insurer (e.g. workplace disruption)
425 113
Property damage Vehicle costs
Non-vehicle property damage
5,332 4,482
General costs Travel delays
Police and fire and emergency services
1,969 983
Insurance administration 1,193 1,691
Total 19,294 17,849
Source: BITRE 2010 and BTE 2000 reports.
1 The BITRE 2010 study (page 37) states ‘This study retains a hybrid human capital approach to valuing human losses (BTE 2000), presenting a conservative estimate of the losses to society from road fatalities.’
2 For example, the BTE 2000 study headline results are used as a basis for analysis in recent work for the Australasian Railways Association (PJP 2005), recent academic studies (e.g. Connelly and Supangan 2006), many submissions to the 2007 Productivity Commission Review on “Road and Rail Freight Infrastructure Pricing” and the Australian Transport Council (ATC 2006 V5, p. 76).
Cost of road crashes 10
Most of the costs (such as property damage) are fairly non-controversial in their estimation. The most controversial aspect of the study is the amount associated with human costs and in particular that relating to the loss of life and quality of life. These amounts are of greater interest because, as is discussed in this paper, they can be very significant and can represent a large amount of the external costs of road crashes.
Many of the other costs recorded in Table 2 are costs borne by the individuals at fault or their insurer. These include the property damage, some of the lost labour productivity and the insurer’s costs for medical treatment and the loss of their own life and quality of life.
3.2 The loss of life and quality of life
As noted above, for policy analysis of road crashes, it is society’s willingness to pay (WTP) to reduce the risk of loss of life and quality of life that is relevant.3 For ease of use, policy makers use an amount in terms of the expected value of preventing a single future unknown fatality. This value is most commonly described as a value of statistical
life (VSL) but it is perhaps more easily understood as the equivalent term value of a
preventable fatality (VPF) or value of risk reduction (VRR). This paper uses the common term VSL.
The VSL is then estimated by dividing the WTP by the likelihood of a risk. Thus, for example, if we find people are willing to pay $50 to reduce the risk of death by 1 in 100,000, the VSL is estimated as $5 million (equal to $50 x 100,000).
Of note, for purposes of road crash analysis (and most other analysis) WTP and VSL reflect small levels of risk to life. Thus, for example, the VSL cannot be interpreted as the amount someone would pay to avoid a certain death. Rather VSL is simply an amount reflecting the sum of the WTP of a large number of individuals to reduce small risks to their lives.
The issues relating to the value of preventing injuries, loss of life, and loss of quality of life are similar. Road crash injuries are far more frequent than fatalities and represent a significant proportion of the costs estimated in Table 2 above.
It is common for researchers to estimate the value of risks to quality of life as a proportion of VSL. For example, the BTE 2000 study estimated that, for loss of quality of life, the value for risk reduction of a serious injury was 11% of that for a life. In further analysis that examined variations to the VSL the study assumed that this proportion was maintained.
3 As discussed in the report, willingness to accept (WTA) a change in risk may also be relevant.
Cost of road crashes 11
There are a number of approaches to estimating VSL. The two most common approaches are described as the ‘human capital’ approach and the WTP approach. These are discussed below.
Human capital and other approaches
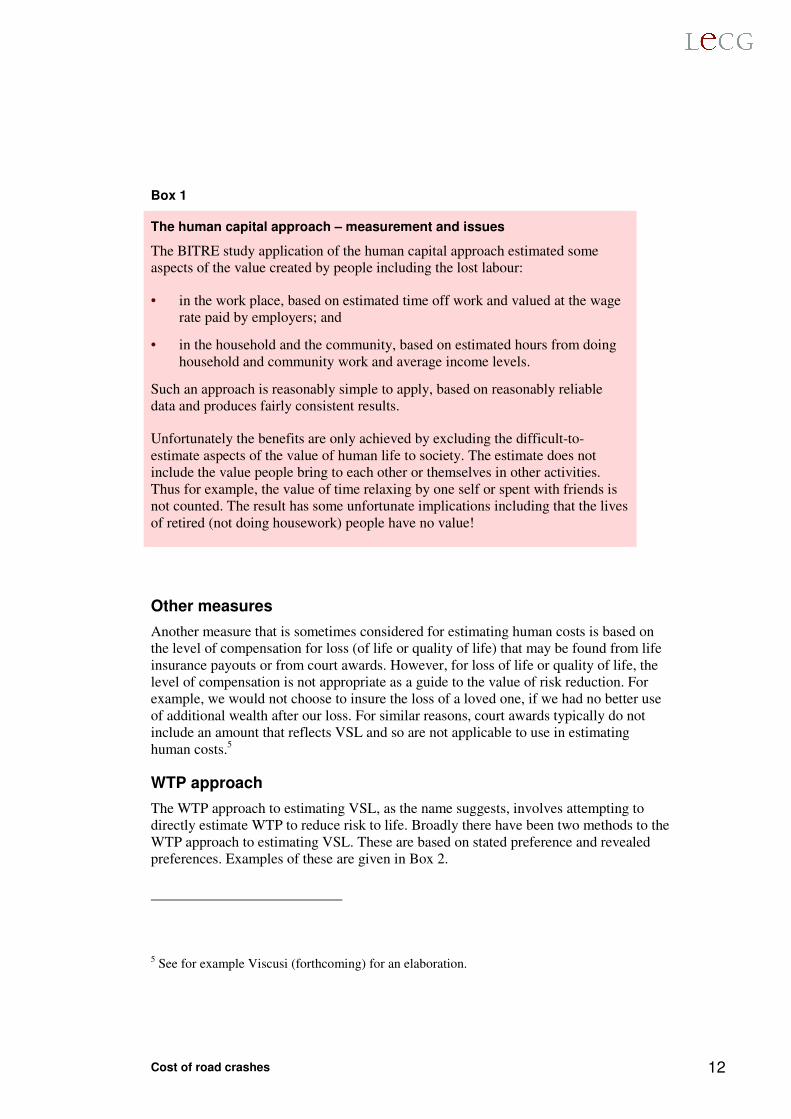
The ‘human capital’ approach essentially involves estimating the value of productive output of people over their remaining life (see Box 1 below). The often quoted estimate of road crash costs that appears in Table 2 is based on a ‘human capital’ approach to the valuation of life supplemented with an amount for lost quality of life.
The common applications of the method (including that used in the recent BITRE study) do not attempt to measure the WTP to reduce risks. There is, however, a revised approach known as a hybrid human capital/WTP that is based on a formulation which, under certain assumptions, may yield a similar amount to the WTP measure.4
The proposed application of the revised hybrid human capital/WTP, like the more common approach, is however flawed in what it excludes. In theory the hybrid human capital/WTP measure would include not just the easy-to-measure benefits from labour and non-labour income but all the other benefits we receive from living, including the enjoyment of leisure, any enjoyment of life we have while working and the avoidance of pain and suffering of dying. In practice, due to the difficulty of measurement, it is proposed that these additional benefits from life are excluded – that is, they are given no value. As advocates of the approach acknowledge, this leads to a large underestimate of the value of life.
Potentially a hybrid type of approach could lead to reasonable estimates of a VSL consistent with the WTP approach. This would, however, require estimating the hard-to-measure benefits of life (e.g. leisure). Such an exercise may provide some useful insights, however, the simplest and most robust way to estimate the additional benefits may be using the WTP approach.
In the absence of other VSL measures, Government agencies in Australia have used the human capital approach for the purposes of policy analysis. However, as is discussed below, more direct estimates of VSL have been obtained and it is now widely accepted that the human capital approach leads to an underestimate of VSL. Given the availability of other measures, there is no justification for using a human capital approach that underestimates VSL in policy analysis evaluating the costs and benefits of the risk of crashes.
4 The approach and its proposed application are described in Landefeld and Seskin (1982).
Cost of road crashes 12
Box 1
The human capital approach – measurement and issues
The BITRE study application of the human capital approach estimated some aspects of the value created by people including the lost labour:
• in the work place, based on estimated time off work and valued at the wage rate paid by employers; and
• in the household and the community, based on estimated hours from doing household and community work and average income levels.
Such an approach is reasonably simple to apply, based on reasonably reliable data and produces fairly consistent results.
Unfortunately the benefits are only achieved by excluding the difficult-to-estimate aspects of the value of human life to society. The estimate does not include the value people bring to each other or themselves in other activities. Thus for example, the value of time relaxing by one self or spent with friends is not counted. The result has some unfortunate implications including that the lives of retired (not doing housework) people have no value!
Other measures
Another measure that is sometimes considered for estimating human costs is based on the level of compensation for loss (of life or quality of life) that may be found from life insurance payouts or from court awards. However, for loss of life or quality of life, the level of compensation is not appropriate as a guide to the value of risk reduction. For example, we would not choose to insure the loss of a loved one, if we had no better use of additional wealth after our loss. For similar reasons, court awards typically do not include an amount that reflects VSL and so are not applicable to use in estimating human costs.5
WTP approach
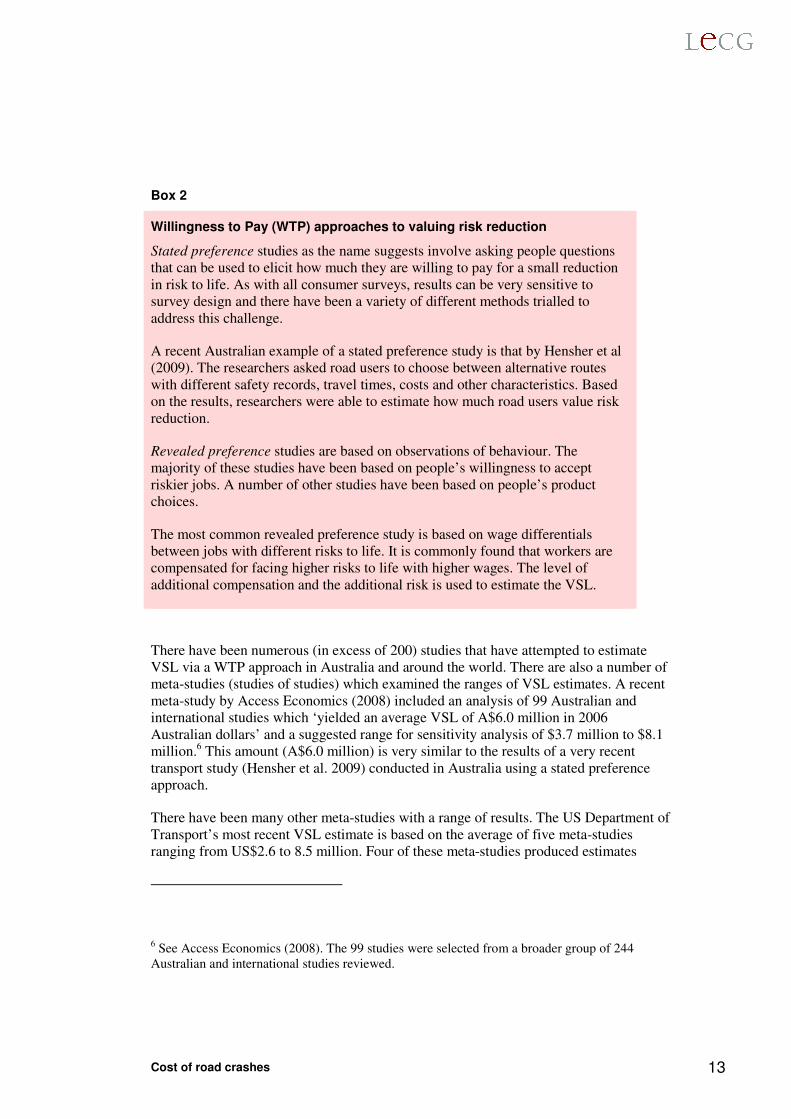
The WTP approach to estimating VSL, as the name suggests, involves attempting to directly estimate WTP to reduce risk to life. Broadly there have been two methods to the WTP approach to estimating VSL. These are based on stated preference and revealed preferences. Examples of these are given in Box 2.
5 See for example Viscusi (forthcoming) for an elaboration.
Cost of road crashes 13
Box 2
Willingness to Pay (WTP) approaches to valuing risk reduction
Stated preference studies as the name suggests involve asking people questions that can be used to elicit how much they are willing to pay for a small reduction in risk to life. As with all consumer surveys, results can be very sensitive to survey design and there have been a variety of different methods trialled to address this challenge.
A recent Australian example of a stated preference study is that by Hensher et al (2009). The researchers asked road users to choose between alternative routes with different safety records, travel times, costs and other characteristics. Based on the results, researchers were able to estimate how much road users value risk reduction.
Revealed preference studies are based on observations of behaviour. The majority of these studies have been based on people’s willingness to accept riskier jobs. A number of other studies have been based on people’s product choices.
The most common revealed preference study is based on wage differentials between jobs with different risks to life. It is commonly found that workers are compensated for facing higher risks to life with higher wages. The level of additional compensation and the additional risk is used to estimate the VSL.
There have been numerous (in excess of 200) studies that have attempted to estimate VSL via a WTP approach in Australia and around the world. There are also a number of meta-studies (studies of studies) which examined the ranges of VSL estimates. A recent meta-study by Access Economics (2008) included an analysis of 99 Australian and international studies which ‘yielded an average VSL of A$6.0 million in 2006 Australian dollars’ and a suggested range for sensitivity analysis of $3.7 million to $8.1 million.6 This amount (A$6.0 million) is very similar to the results of a very recent transport study (Hensher et al. 2009) conducted in Australia using a stated preference approach.
There have been many other meta-studies with a range of results. The US Department of Transport’s most recent VSL estimate is based on the average of five meta-studies ranging from US$2.6 to 8.5 million. Four of these meta-studies produced estimates
6 See Access Economics (2008). The 99 studies were selected from a broader group of 244 Australian and international studies reviewed.
Cost of road crashes 14
higher than the Access Economics estimate. For example, Viscusi and Aldy (2003) recommend a VSL of US $7.0 million (≈ A$10m in 2006) based on a review of international studies.
The estimated VSL has been shown to vary with a number of dimensions including age, income and even cause of death. Of note, more recent studies tend to show higher results suggesting the VSL is increasing at a faster rate than is generally assumed. This is important for considering how the VSL should increase over time.
Concerns over the variation in estimates have declined over time with more research that has led to better techniques, more estimates and greater understanding of the variations between estimates. Reasonably tight ranges for WTP estimates are now being developed and these help to confirm that the human capital method leads to a large undervaluation. In their 2008 review, Access Economics, based on their sensitivity analysis, recommended for Australia a minimum value well above the human capital valuation.
A second concern appears to be based on the policy implications of adopting WTP estimates for public policy. Higher valuations of the cost of road crashes could be used as justification for large increases in public spending or greater safety regulations. There is significant concern that many such interventions have been wasteful and in some cases counterproductive.7 Regardless, such concerns should not influence the correct valuation of VSL; rather they should prompt more rigorous analysis of policies.
3.3 Extensions to existing estimates
Pain and suffering of others
The WTP based methods that are used to estimate VSL are largely designed to capture a person’s WTP to reduce risks to his or her self. But the death or serious injury of a person affects other people, particularly family and friends, who cared for the person. It is thus natural to ask whether the existing estimates of WTP for reducing risks take into account the impact on others.8
There has been some debate as to how the concern of others should be incorporated into values of VSL. Most discussion on this issue is centred around the belief that the
7 Ross Parish (no date) provides an engaging summary of such concerns. This concern also appears reflected in stated preference studies that find people are more reluctant to pay for public investments that are claimed to deliver the same safety benefits as a private benefit; a finding that has been interpreted as people’s concern relating to the effectiveness of public investment (see Andersson and Lindberg 2008).
8 Similarly an additional cost, not traditionally considered, is the pain of the at-fault driver who feels responsible.
Cost of road crashes 15
concern for the safety of others is based on altruism (i.e. an unselfish concern for the welfare of others). Bergstrom (2005) showed that if people are ‘pure’ altruists who care for both the safety of others and the costs of improving safety, then no adjustment is required to existing VSL estimates. This argument has been the basis of a recent European decision to make no adjustment for VSL to reflect the concerns of friends and families (HEATCO 2006 D5, p. 85).
However, our concern for others is more than just pure altruism. We invest time and money in developing relationships, enjoy the company of good friends and family and miss them when they are away. Our lives are enriched by our relationships with others and we feel worse off when these relationships end.9 Consistent with these behaviours the few empirical studies that have examined the issue find that people are willing to pay to enhance the safety of family and friends in a way that is inconsistent with pure altruism.10
There would also be no need to adjust WTP estimates if people’s attitude to risk incorporated concern for the impact on others of their death. This may be the case to a degree; nevertheless it seems unlikely that this is fully incorporated. For example, it appears unlikely that a young male’s risk-taking fully reflects his parent’s interests. As such, in general, society’s WTP for risk reduction of an individual is likely to be higher than the individual’s WTP.
The extent to which existing estimates of VSL should be supplemented will likely depend on how estimates were constructed. Some WTP valuations may reflect, to a degree, household decisions and thus incorporate concern for household members. For example, spouses may influence their partner’s choice of job and thus their concerns may be embedded in studies that examine wage-risk trade-offs. Similarly product purchase decisions and amounts chosen in stated preference studies are likely to be drawn from a household budget. Regardless, people’s concern for others clearly extends to people outside of the household.
9 The significance of the loss of a loved one is empirically tested by Oswald & Powdthavee (2008). They find that the loss of a loved one has a significant impact on measures of people’s psychological well-being and life satisfaction. They also, by way of illustration, estimate the per annum financial compensation that would be sufficient to restore these measures to their pre-loss level. These vary from around A$30,000 for a sibling to over A$200,000 for the loss of a spouse in the first year.
10 For example, studies have found that people are much more willing to donate devices to save people’s lives than cash equivalents (see Jacobsen et al. 2007). This suggests people are concerned with others’ safety more than their well-being. This concern has often been described as a form of altruism called safety-paternalistic.
Cost of road crashes 16
Given these considerations, increasing the values of VSL to reflect societal WTP for risk reduction is justified. By how much is debatable. Unfortunately, as there is only limited research on the issue, it is difficult to know how much.11 There is strong evidence that people’s WTP to reduce risk to their children is greater than that for themselves. There is similar evidence for other household members. People also have demonstrated a WTP to reduce risks to other relatives and friends outside of the household. In their study, Andersson and Lindberg (2008) estimated this WTP be on average around one third to one half of the person’s WTP for their own risk reduction. Furthermore they found people were willing to pay to reduce risks to multiple friends and relatives.
Given the level of grief we observe by parents, spouses and other relatives and friends for car crash victims, it would seem hard to justify not making some adjustment. Lindberg (2001), based on existing research, recommends increasing the VSL estimates by 40% to account for concern for others.12 Given the magnitude of the issue, this is an important area for further research.
Value of life and age
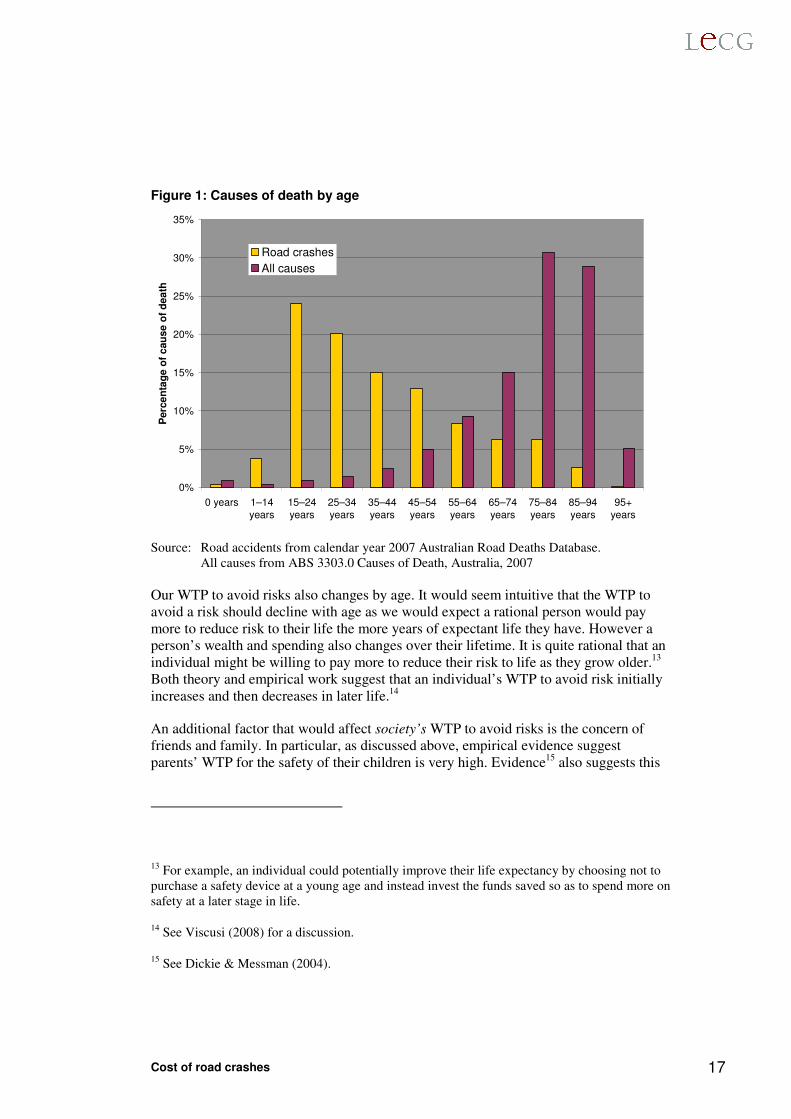
Road-crash victims have a different profile to those killed or seriously injured by other causes. Most notably road crash victims tend to be younger people. Figure 1 below shows the age profile of fatalities caused by road crashes and that of all causes. In terms of years of life lost, road crashes have a particularly significant impact.
While it is tempting to focus on the years of life lost, policy analysis should be based on society’s willingness to pay for the reduced risk to life. Policies that generate benefits and impose costs for a group would ideally reflect the characteristics of that group. It is efficient that the cost-benefit analysis of safety measures reflect the WTP of the road-users impacted.
11 Andersson and Lindberg (2008) is a recent study on the issue that also summarises prior evidence.
12 The 40% uplift is suggested by Lindberg (2001) and in HEATCO D5 (2006). This uplift appears consistent with subsequent studies (e.g. Andersson and Lindberg 2008).
Cost of road crashes 17
Figure 1: Causes of death by age
0%
5%
10%
15%
20%
25%
30%
35%
0 years 1–14years
15–24years
25–34years
35–44years
45–54years
55–64years
65–74years
75–84years
85–94years
95+years
Perc
en
tag
e o
f c
au
se
of
de
ath
Road crashes
All causes
Source: Road accidents from calendar year 2007 Australian Road Deaths Database. All causes from ABS 3303.0 Causes of Death, Australia, 2007
Our WTP to avoid risks also changes by age. It would seem intuitive that the WTP to avoid a risk should decline with age as we would expect a rational person would pay more to reduce risk to their life the more years of expectant life they have. However a person’s wealth and spending also changes over their lifetime. It is quite rational that an individual might be willing to pay more to reduce their risk to life as they grow older.13 Both theory and empirical work suggest that an individual’s WTP to avoid risk initially increases and then decreases in later life.14
An additional factor that would affect society’s WTP to avoid risks is the concern of friends and family. In particular, as discussed above, empirical evidence suggest parents’ WTP for the safety of their children is very high. Evidence15 also suggests this
13 For example, an individual could potentially improve their life expectancy by choosing not to purchase a safety device at a young age and instead invest the funds saved so as to spend more on safety at a later stage in life.
14 See Viscusi (2008) for a discussion.
15 See Dickie & Messman (2004).
Cost of road crashes 18
effect declines with age and so it would appear likely that the societal VSL would be initially relatively high and would then continually decline with age.
Policies that vary VSL by age are clearly controversial.16 Regardless, different government agencies currently employ different VSL estimates for their analysis. Consideration of the age profile suggests that for the purposes of costing road crashes and for analysing road crash policy, relative to some other agencies, a higher VSL should be used.
Willingness to accept
The above discussion has been in relation to society’s willingness to pay for increased safety. In some circumstances a change being evaluated will lead to an increase in risks to existing users (for example, whether to allow large trucks on the road). In such contexts it is society’s willingness to accept (WTA) the increased risks that should be relevant.
While we might expect that WTP and WTA for a small change in risk should be similar, empirical studies frequently display a large discrepancy between them. A recent review (Horowitz and McConnell 2002) of 45 studies found that the mean WTA/WTP ratio is around seven to one. Transport safety research found the WTA-based VSL to be around three to five times the WTP-based amount (see NZ DOL 2004, p. 89).
Adoption of WTA based measures for VSL would be very significant for policy analysis. Although possible explanations, including problems of survey design and behavioural issues, have been suggested, there appears to be no clear resolution for the difference in WTA and WTP estimates. Given the lack of clarity, it is perhaps not surprising that policy makers have been reluctant to use WTA based measures. Regardless where applicable, the implications of using a WTA based estimate should at least be considered and recognised.
3.4 VSL approaches and values used around the world
The approaches and VSL values used in a number of countries with similar economic development and Government agencies are provided in Table 3 below. Some qualifications are necessary. This is by no means a comprehensive review. Typically, there are not strict requirements imposed by Government agencies; agencies may just recommend approaches or values to be used or simply provide analysis that may be used.
16 As noted by Viscusi (2008), for the US Environmental Protection Authority ‘The introduction of distinctions [of VSL] by age set off a political firestorm.’
Cost of road crashes 19
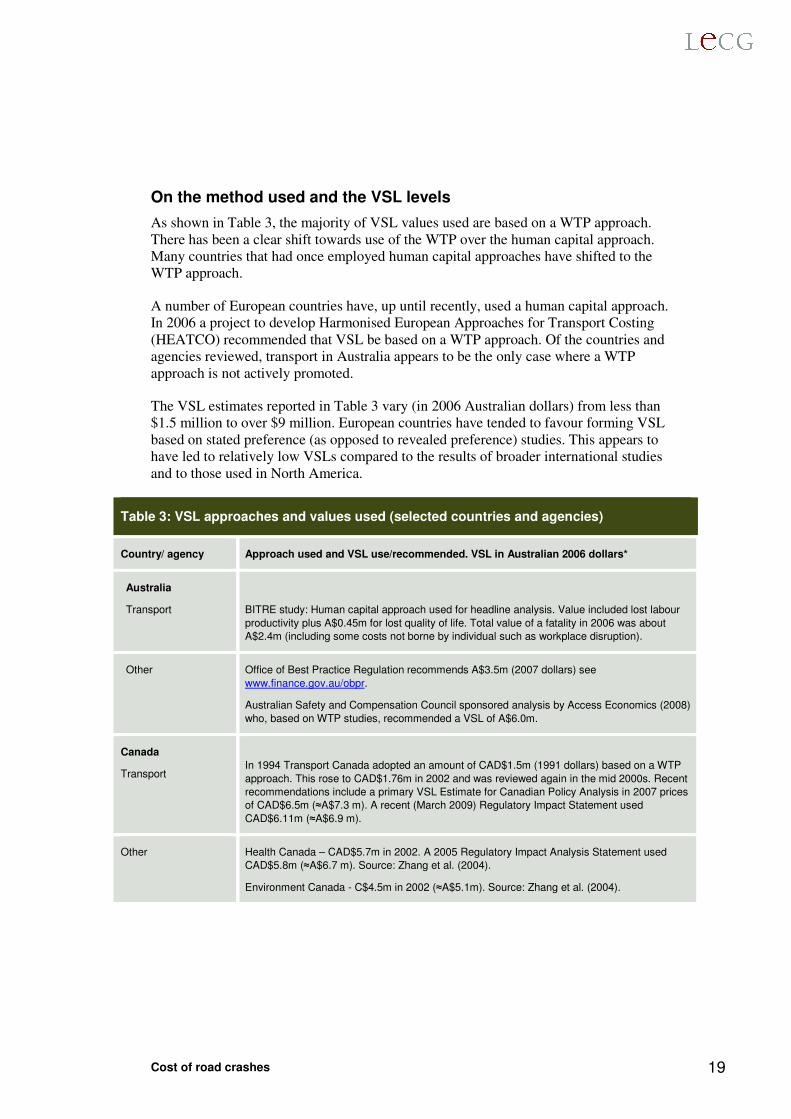
On the method used and the VSL levels
As shown in Table 3, the majority of VSL values used are based on a WTP approach. There has been a clear shift towards use of the WTP over the human capital approach. Many countries that had once employed human capital approaches have shifted to the WTP approach.
A number of European countries have, up until recently, used a human capital approach. In 2006 a project to develop Harmonised European Approaches for Transport Costing (HEATCO) recommended that VSL be based on a WTP approach. Of the countries and agencies reviewed, transport in Australia appears to be the only case where a WTP approach is not actively promoted.
The VSL estimates reported in Table 3 vary (in 2006 Australian dollars) from less than $1.5 million to over $9 million. European countries have tended to favour forming VSL based on stated preference (as opposed to revealed preference) studies. This appears to have led to relatively low VSLs compared to the results of broader international studies and to those used in North America.
Table 3: VSL approaches and values used (selected countries and agencies)
Country/ agency Approach used and VSL use/recommended. VSL in Australian 2006 dollars*
Australia
Transport
BITRE study: Human capital approach used for headline analysis. Value included lost labour
productivity plus A$0.45m for lost quality of life. Total value of a fatality in 2006 was about
A$2.4m (including some costs not borne by individual such as workplace disruption).
Other Office of Best Practice Regulation recommends A$3.5m (2007 dollars) see
www.finance.gov.au/obpr.
Australian Safety and Compensation Council sponsored analysis by Access Economics (2008)
who, based on WTP studies, recommended a VSL of A$6.0m.
Canada
Transport
In 1994 Transport Canada adopted an amount of CAD$1.5m (1991 dollars) based on a WTP
approach. This rose to CAD$1.76m in 2002 and was reviewed again in the mid 2000s. Recent
recommendations include a primary VSL Estimate for Canadian Policy Analysis in 2007 prices
of CAD$6.5m (≈A$7.3 m). A recent (March 2009) Regulatory Impact Statement used
CAD$6.11m (≈A$6.9 m).
Other Health Canada – CAD$5.7m in 2002. A 2005 Regulatory Impact Analysis Statement used
CAD$5.8m (≈A$6.7 m). Source: Zhang et al. (2004).
Environment Canada - C$4.5m in 2002 (≈A$5.1m). Source: Zhang et al. (2004).
Cost of road crashes 20
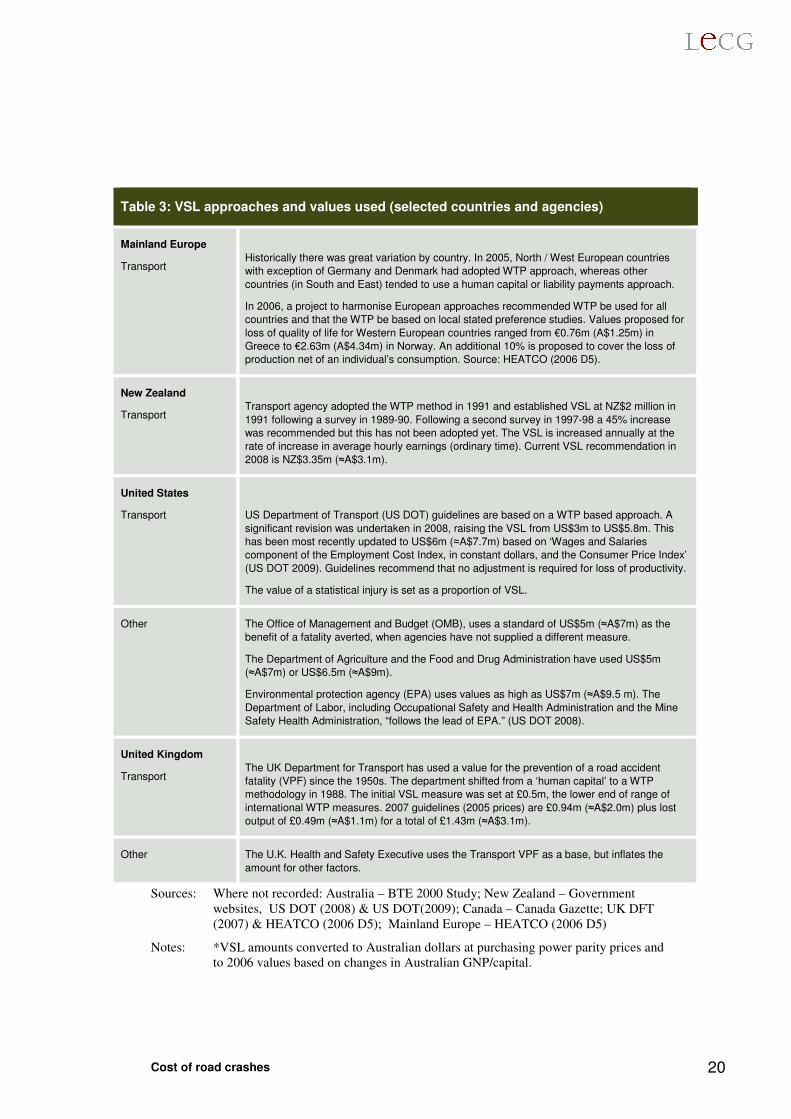
Table 3: VSL approaches and values used (selected countries and agencies)
Mainland Europe
Transport
Historically there was great variation by country. In 2005, North / West European countries
with exception of Germany and Denmark had adopted WTP approach, whereas other
countries (in South and East) tended to use a human capital or liability payments approach.
In 2006, a project to harmonise European approaches recommended WTP be used for all
countries and that the WTP be based on local stated preference studies. Values proposed for
loss of quality of life for Western European countries ranged from €0.76m (A$1.25m) in
Greece to €2.63m (A$4.34m) in Norway. An additional 10% is proposed to cover the loss of
production net of an individual’s consumption. Source: HEATCO (2006 D5).
New Zealand
Transport
Transport agency adopted the WTP method in 1991 and established VSL at NZ$2 million in
1991 following a survey in 1989-90. Following a second survey in 1997-98 a 45% increase
was recommended but this has not been adopted yet. The VSL is increased annually at the
rate of increase in average hourly earnings (ordinary time). Current VSL recommendation in
2008 is NZ$3.35m (≈A$3.1m).
United States
Transport
US Department of Transport (US DOT) guidelines are based on a WTP based approach. A
significant revision was undertaken in 2008, raising the VSL from US$3m to US$5.8m. This
has been most recently updated to US$6m (≈A$7.7m) based on ‘Wages and Salaries
component of the Employment Cost Index, in constant dollars, and the Consumer Price Index’
(US DOT 2009). Guidelines recommend that no adjustment is required for loss of productivity.
The value of a statistical injury is set as a proportion of VSL.
Other The Office of Management and Budget (OMB), uses a standard of US$5m (≈A$7m) as the
benefit of a fatality averted, when agencies have not supplied a different measure.
The Department of Agriculture and the Food and Drug Administration have used US$5m
(≈A$7m) or US$6.5m (≈A$9m).
Environmental protection agency (EPA) uses values as high as US$7m (≈A$9.5 m). The
Department of Labor, including Occupational Safety and Health Administration and the Mine
Safety Health Administration, “follows the lead of EPA.” (US DOT 2008).
United Kingdom
Transport
The UK Department for Transport has used a value for the prevention of a road accident
fatality (VPF) since the 1950s. The department shifted from a ‘human capital’ to a WTP
methodology in 1988. The initial VSL measure was set at £0.5m, the lower end of range of
international WTP measures. 2007 guidelines (2005 prices) are £0.94m (≈A$2.0m) plus lost
output of £0.49m (≈A$1.1m) for a total of £1.43m (≈A$3.1m).
Other The U.K. Health and Safety Executive uses the Transport VPF as a base, but inflates the
amount for other factors.
Sources: Where not recorded: Australia – BTE 2000 Study; New Zealand – Government websites, US DOT (2008) & US DOT(2009); Canada – Canada Gazette; UK DFT (2007) & HEATCO (2006 D5); Mainland Europe – HEATCO (2006 D5)
Notes: *VSL amounts converted to Australian dollars at purchasing power parity prices and to 2006 values based on changes in Australian GNP/capital.
Cost of road crashes 21
Variation between transport and other uses
As noted by a number of commentators (e.g. Viscusi & Aldy 2003, Ashenfelter 2005)17 transport departments have historically tended to use fairly low estimates. For example, in the US, UK, Canada and Australia there is evidence that VSLs used or recommended by transport agencies have been lower than that employed/recommended by environmental and health agencies.
There appear to be a number of reasons for this. A key reason appears to be historical. In general, transport agencies were early adopters of value-of-life measures and began using the human capital approach before the WTP approach had taken hold. When the switch to a WTP approach occurred, conservatively low values were chosen so as to minimise the policy impact. An example of this is from the UK where the WTP approach was adopted in 1987. Chilton et al. (1998) report that a range of values was determined from a comprehensive review of the literature at the time and a value selected ‘at the lower end of this range in order to temper a radical change of methodology … with an element of caution.’
Another historical reason is that often current values are based on a VSL chosen some time ago and updated over time at the growth rate of some index. International estimates of VSLs based on WTP approaches have generally increased over time and as such early adopters of the WTP approach tend to be relatively low compared to more recent evidence. For example, the current New Zealand VSL is based on a survey conducted in 1989–90 inflated by increases in hourly earnings. A second survey report conducted in 1997–98 recommended a much higher VSL (around a 50% increase) but its findings have not been adopted.18
Finally, political interests may be a factor. Viscusi (2008) argues that the US Department of Transport (US DOT) had adopted (between 1993 and 2008) a lower VSL than supported by evidence as a ‘political compromise’ influenced by an amount ‘favoured by the auto industry’.19
17 Ashenfelter (2005) states ‘it is my impression that [US] highway departments often use estimates at the bottom end of [the] range and sometimes below it’.
18 See NZ DOL (2004) which notes that ‘Despite rigorous internal and international review of the survey and the resulting [VSL] estimate, a decision has yet to be made as to whether or not to adopt a new [VSL].’
19 The US DOT provides a different justification for the VSL used prior to 2008. See US DOT (2009).
Cost of road crashes 22
Although typically transport agencies were slow to adopt a WTP approach and chose fairly low VSLs, there appears to be some recent change. Viscusi notes that in 2008 the US Department of Transport ‘finally revamped its official VSL policy to bring it in line with the literature’ and now uses a figure of US$6.0m. Similarly Transport Canada has recently significantly increased the VSLs used in Regulatory Impact Analysis. Europe, through its harmonisation plan appears to have uniformly adopted WTP with a material increase in VSL measures.
Consideration of other factors Some agencies and policy papers have considered whether VSL amounts should vary with age. The US Environmental Protection Agency proposed different VSLs for different age groups. Environment Canada estimated a VSL that reflected the age mix of deaths associated by air particulates.
None of the policies reviewed explicitly include an adjustment to VSL to reflect the WTP by friends and family for risk reduction. As discussed above, HEATCO considered an adjustment for relatives and friends but rejected it on the assumption that people are purely altruistic.20
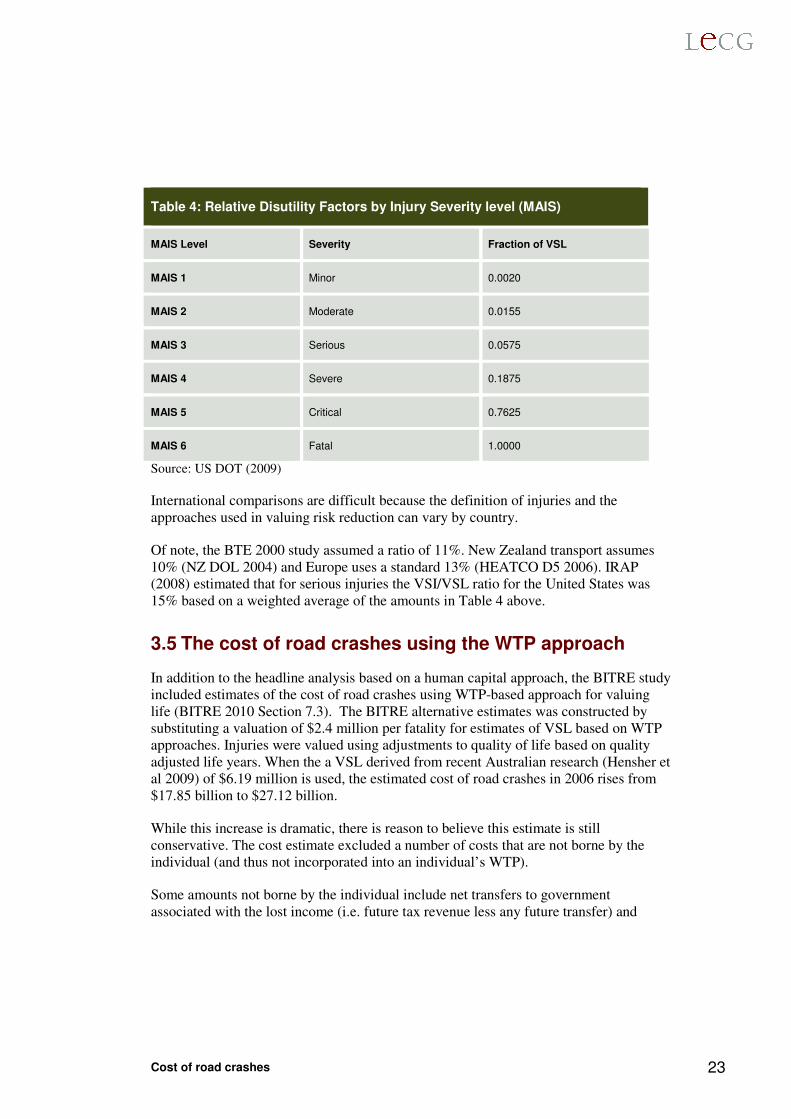
Value of preventing injuries It is common for the value of reduced risk of injury (value of a statistical injury, VSI) to be based on the VSL. For example, the US DOT guidelines (US DOT 2009) provide guidance based on valuing injuries of different severities, ranging from minor to fatal, as a fraction of VSL (as shown in Table 4 below). These proportions were established in 1993 and have not changed as the VSL has been updated.
20 Of note the UK Treasury Green Book claims that “In the UK, the main measure of VPF incorporates the ‘extra’ value placed on relatives and friends…” The document does not describe the basis of the claim.
Cost of road crashes 23
Table 4: Relative Disutility Factors by Injury Severity level (MAIS)
MAIS Level Severity Fraction of VSL
MAIS 1 Minor 0.0020
MAIS 2 Moderate 0.0155
MAIS 3 Serious 0.0575
MAIS 4 Severe 0.1875
MAIS 5 Critical 0.7625
MAIS 6 Fatal 1.0000
Source: US DOT (2009)
International comparisons are difficult because the definition of injuries and the approaches used in valuing risk reduction can vary by country.
Of note, the BTE 2000 study assumed a ratio of 11%. New Zealand transport assumes 10% (NZ DOL 2004) and Europe uses a standard 13% (HEATCO D5 2006). IRAP (2008) estimated that for serious injuries the VSI/VSL ratio for the United States was 15% based on a weighted average of the amounts in Table 4 above.
3.5 The cost of road crashes using the WTP approach
In addition to the headline analysis based on a human capital approach, the BITRE study included estimates of the cost of road crashes using WTP-based approach for valuing life (BITRE 2010 Section 7.3). The BITRE alternative estimates was constructed by substituting a valuation of $2.4 million per fatality for estimates of VSL based on WTP approaches. Injuries were valued using adjustments to quality of life based on quality adjusted life years. When the a VSL derived from recent Australian research (Hensher et al 2009) of $6.19 million is used, the estimated cost of road crashes in 2006 rises from $17.85 billion to $27.12 billion.
While this increase is dramatic, there is reason to believe this estimate is still conservative. The cost estimate excluded a number of costs that are not borne by the individual (and thus not incorporated into an individual’s WTP).
Some amounts not borne by the individual include net transfers to government associated with the lost income (i.e. future tax revenue less any future transfer) and
Cost of road crashes 24
amounts recovered via insurance, sick leave and/or compensation claims.21 22 In Europe the recommended approach is to increase VSL values by an additional 10% to cover the loss of production net of an individual’s consumption (HEATCO D5).23
The WTP based estimate above also does not include a value for impact on friends and family. What adjustment should be made depends also on the extent to which friends and family are willing to pay to reduce risk to life and to injury. Unfortunately, the extent of this is difficult to estimate given the limited research available. A sense of the potential significance can be achieved with some assumptions. If the uplift of 40 per cent that Lindberg (2001) proposes was applied to both life and injuries, the VSL used would be around $8.5m (2006 dollars) and the total cost would increase by around $4 billion for fatalities (an additional uplift would be required for injuries). Clearly given the limited research, such an amount needs to be treated with great caution. It does however highlight the importance of more research in this area.
Furthermore, the cost of serious injuries in the WTP based estimate also appear to be low compared to other countries.24 In the WTP based estimate, the cost of serious25 injuries is less than that of fatalities. In other countries that use a WTP approach the reverse appears to be the case. For example, IRAP (2008) estimated that in the US the ratio of the serious injuries to fatalities was 8.3 to 1 and the value of statistical injury was on average 15% of a VSL implying that the cost of serious injuries to be around 25% more than that of fatalities.26
21 The extent to which this is included may depend on how the WTP estimates are formed. For example, a person’s WTP to avoid an accident will depend on his/her expectations as to compensation in the case of an accident.
22 There are other exclusions as well. As noted in the BITRE report (Page 62) ‘The estimates … do not take account of the fixed cost to the hospital system of providing base capacity needed to respond to road trauma.’
23 The $27.12 billion estimate also excludes costs associated with fatalities other than loss productivity and non-pecuniary costs (such as workplace disruption, correctional services etc) The BITRE estimated these to around $100m (see the BITRE study Table7.1).
24 Of note, these amounts include the assumption that the WTP to reduce risk to an injury is proportional to the WTP to reduce risk to life. That is, an increase in the estimate of the VSL results in the same proportional increase in the loss of life and loss of quality of life from injury. While this is a common and pragmatic approach, there is little empirical research that tests the validity of this approach.
25 That is, excluding the cost of non-hospitalised injuries (estimated at $548m).
26 Using the same approach and IRAP (2008) data, the ratio of cost of serious injuries to fatalities by country is Germany 1.1, UK 1.1, New Zealand 1.8, Sweden 1.6.
Cost of road crashes 25
4 The internalisation of road crash costs
The question of who bears the cost of road crashes is a key issue for public policy analysis. If those undertaking risky activities internalise all the costs and benefits of their activity, then, acting rationally with good information, they will choose an optimal level of risk. In such a world there would still be road crashes (and presumably fatalities) but the frequency of these would reflect society’s choice.
However, it is well recognised that many activities related to road crashes incur external costs to other parties, thus not giving sufficient incentive for people to reduce their risky activity. The greater the external costs, the greater the risk that the costs of road crashes is excessive.
The extent to which road crash costs are external is heavily debated.27 What costs are external depend on the activity being examined. While, as previously discussed, some road crash costs are not borne by road users, collectively the victims of road-crashes are in the main road-users themselves. However, in examining the external costs of road use we are interested in individuals’ decisions including how they use roads and how often.
A useful starting point for examining the external costs of road crashes is to consider the extent to which costs associated with an individual’s driving behaviour are internalised. In this regard a simple perspective is to consider the extent to which a party at fault in a road crash bears the costs of the crash. This section begins by reviewing this approach in light of the analysis of the previous section. It then considers a number of modifications to this approach, most notably the extent to which additional externalities exist due to the relative size of vehicles.
4.1 Internalisation of costs by the driver at fault
Costs internal and external to driver at fault
Some road crash costs are external (i.e. not internalised) to the driver at fault in an accident. These external costs include the increased burden on the public health system, other system costs (such as travel delays resulting from the crash) and non-compensated costs associated with loss of life and quality of life of other parties.28
27 See Martin (2005) for a comprehensive review of external costs of road accidents.
28 It should be noted that there are other means by which the costs of risky activities are internalised. In particular, the legal system through enforcement of road traffic rules provides a major deterrent to risky driving activity. Social programs and social pressure also contribute to encouraging people to drive more safely.
Cost of road crashes 26
It is common to view the internalised costs as including the liabilities of the individual and the individual’s insurer to other parties. Under our current system, the parties at fault for a road crash are liable for at least some of the costs of other parties. In doing so, the party at fault internalises these costs on others. The liability for most claims is passed on to the insurer and this may be viewed as diluting the extent to which costs are internalised. However the insurer is able to modify insurance premiums for risk and provide incentives for the insured to drive more carefully.
The BITRE study did not explicitly identify the external costs of road crashes. Martin (2005) reports Australian estimates of road crash costs ranging from $2.5 to 7 billion per annum.
The estimates of external costs increase dramatically once the revisions made in the previous section are incorporated. This increase includes the following.
• A share of the increased estimate of loss of quality of life not borne by the driver at fault. Based on the assumptions in Section 3.5 above and an additional assumption that half of the loss of quality of life is of parties not at fault, this is around $13 billion.
• The additional pain and suffering of friends and relatives of those killed and seriously injured. By construction this is an external cost to the driver. The estimated increase would be over $4 billion (on fatalities alone) if the uplift of 40 per cent proposed by Lindberg (2001) was used.
Again, the purpose of the example is not to provide an accurate estimate of the external costs, but rather to highlight the potential size of the external costs of road crashes.
The problem of overconfidence
The interest in distinguishing between external and internal costs is due to the belief that individuals will incorporate their own (i.e. internal) costs into their own decision making. Unfortunately this does not always appear to be the case and particularly not so in the case of driving.
There is increasing research on, and recognition of, behavioural biases, which may cause people not to act in their own best interests. An important bias for driving behaviour is overconfidence.
Evidence of overconfidence with regard to driving has been found in numerous Australian and international studies.29 The results of these studies are fairly consistent. It seems that on average we have reasonably good perceptions of societal risks, but that we
29 See Sandroni and Squintani (2004) for a survey.
Cost of road crashes 27
overestimate our own driving ability and underestimate the likelihood that we will be involved in a crash.
The implication of the problem of overconfidence is that the traditional view of what costs are internalised needs some revision. A bias of overconfidence means that much less of the expected cost of road crashes is truly internalised into driver behaviour. This includes costs claimed via insurance (e.g. property damage) and loss of one’s own quality of life.
Insurers do not suffer from bias of overconfidence in estimating the crash risk of their insured clients. Arguably the costs incurred by insurers are thus appropriately internalised via the setting of insurance premiums and associated activities (such as ‘pay by the mile’ insurance and rewards for safe driving). However, there are limits to the costs covered by insurance (e.g. claims do not pay for loss of quality of life), and restrictions on the costs of insurance premiums (e.g. limits on how Compulsory Third Party insurance premiums are applied).
The lack of internalisation of one’s own loss of life is significant. Using recent WTP estimates, the costs of loss of life and quality of life is estimated at over $20 billion. A significant portion of this is borne by the driver. If drivers underestimated their risk of having a road crash by 10%, then the additional cost not internalised could exceed a billion dollars.
4.2 Other external costs associated with vehicle use
The effect of additional road use
A topical issue is the effect that additional vehicles have on the incidence and severity of road crashes. Intuitively it would seem that the likelihood of any vehicle being involved in a road crash increases with each additional vehicle on the road. As such, it would appear that the marginal (i.e. additional) cost of road-use would be much higher than the average cost and that the external costs of any road-use are greater. Thus from the point of view of road crashes, other drivers are better off the less roads are used.
The size of this effect is debatable. More congested traffic can prompt people to drive more slowly and carefully. While this reflects costs to those road users, the effect can be to lower the incidence and severity of road crashes. Greater road use can also motivate and fund greater investment in infrastructure, which can both improve road safety and driving pleasure. Thus the net effect on road crash costs is not clear.30
30 See Martin (2005) or Parry et al. (2007) for further discussion on this topic and links to further work.
Cost of road crashes 28
The problem of vehicle size
The effect of additional road use is clearer when it applies to heavy vehicles. When it comes to road crashes, size matters. The severity of an accident is closely linked to the relative size of the vehicles involved. In a two vehicle collision, the occupants of the smaller vehicle are far more likely to be killed or seriously injured than in the larger vehicle. This is the case for standard passenger cars involved in collisions with heavier sports utility vehicles (SUVs) and for all passenger vehicles involved in accidents with trucks and buses.
A key implication of the importance of relative size is that by their mere presence, heavy vehicles impose external costs for other road users. These costs include the additional severity of accidents, the additional discomfort to drivers of light vehicles and distortions in people’s choice of vehicle and road use. Simply put, people are better off driving on roads surrounded by lighter vehicles.
The concern about relative size of passenger vehicles has increased in recent years (particularly in the US) due to the increased prevalence of SUVs and even heavier vehicles such as Hummers. It wasn’t clear at first whether increased passenger vehicle size was necessarily bad for vehicle safety. Intuitively it would seem that if everyone used larger vehicles then we might even be safer. However, not everyone chooses to drive the larger cars and so large disparities in vehicle size exist. Furthermore, there are additional reasons to be concerned with vehicle size.
Firstly, pedestrians, motor cyclists and cyclists suffer as a result of larger vehicles. All of these parties are more likely to be killed or injured if hit by a larger vehicle.
Secondly, there is some evidence that the driving behaviour of passenger vehicles changes for the worse with larger vehicles. Recent US evidence31 suggests drivers of heavier passenger vehicles are more likely to be involved in a crash and drivers of equal sized vehicles are more likely to be killed or seriously injured when the vehicles are larger.
There is an additional problem of relative size. The presence of larger vehicles encourages consumers, in the interests of their own safety, to themselves purchase larger vehicles. This effect has been described as an ‘arms race’ for larger vehicles which results in increased private spending on larger vehicles and running costs and greater social costs associated with emissions and congestion. Both these additional private costs and public costs are external costs associated with the presence of large vehicles on the road.
31 See White (2004).
Cost of road crashes 29
The issue of relative vehicle size is also gaining greater recognition with regard to road freight policies.32 While trucks are under-represented (on a distance travelled basis) in terms of road crashes, they are over represented in terms of road-fatalities and serious injuries.33 The problem of relative size means that regardless of fault, all else being equal, more trucks on the roads increases the risks to other road users.
It should be possible to make reasonable estimates of the relative size externality associated with a large vehicle such as a truck or SUV. Given available data on the accident rates and fatalities by vehicle types it is possible to estimate the impact of replacing large vehicles with smaller vehicles or other forms of transport. Using such an analysis, White (2004) estimated that the safety benefits of replacing a million SUVs with smaller cars in the US were between US$242 (≈$A330) and US$652 (≈$A890) per replaced vehicle per year.34
In addition to the increased accident externality, the external costs include the increased discomfort for road users and the ‘arms race’ effect. An indication of the former could potentially be obtained through stated preference surveys. Estimating the latter, would require an estimate of how consumer choice of vehicle size changes in response to the presence of other vehicles.
The ‘relative vehicle size’ effect has now been accepted as an issue. Available research suggests that it is sizeable and at least some of its effects quantifiable. Clearly quantification of the relative size effect could lead to changes in estimates of the external costs associated with heavy vehicles and road crashes.
5 Conclusion
This paper supports the case that the cost of road crashes is much more significant than is commonly reported, both in terms of overall costs and the extent to which these costs are internalised. The key issues raised in this paper are not new. They have generally been accepted by experts in the field, but largely have not made their way into effective analysis of policy.
32 BTRE (2006) recognise this. They state ‘… regardless of issues of cause and fault, it is reasonable to argue that heavy vehicles impose an external cost on other road users.’
33 See BTRE (2006), pp. 18-19.
34 The author also estimates that for every fatal crash that individuals avoid by driving larger vehicles ‘at least 4.3 additional fatal crashes involving others occur’.
Cost of road crashes 30
The recent BITRE study reported that its headline estimate of the road crash costs in Australia in 2006 of $17.85 billion (2006 dollars) was conservative, as it was obtained using a human capital approach to valuing the most significant human component of costs. The alternative approach based on the WTP approach should be adopted. This is the approach that is supported by the vast majority of experts and comparable Government agencies around the world.
There should be no debate as to which method should be used for public policy analysis. The human capital approach (or at least how it is applied) because of what it excludes, underestimates the social costs of road crashes. In addition, it is not as theoretically sound as is the WTP approach. The debate between using the WTP method or the human capital method is more about whether it is better to be broadly right or more precisely too low.
Recent Australian research suggest a value of a statistical life (VSL) to a private individual in the order of $6 million (2006 dollars) is appropriate for general application. An upwards adjustment to this amount is also appropriate to reflect the value friends and relatives place on an individual’s life. Furthermore a relatively high VSL may be justified for road crashes, given the age profile of those killed and injured.
Adoption of the WTP approach is particularly significant for the analysis of internal and external costs. The increase in cost estimates reflect loss in life and quality of life, much of which are borne by road-users not at fault and by friends and relatives of victims. As discussed in this paper, the problem of over-confidence of drivers means even less of the true cost of road crashes is effectively internalised by drivers.
The problem of vehicle size is an increasingly important issue that demands further attention. Although the issue has been recognised, there has been little research that has attempted to quantify the effects in a way that may support using them in policy analysis.
A large revision to the external cost of road crashes and greater consideration of the other factors discussed would have important implications for cost-benefit analysis of transport policy. It is worth recognising the concern by some that an increase in the external costs of road crashes could drive inefficient investment and regulation. Properly applied this should not be the case, but regardless, rigour and caution should be applied in further policy analysis in this area.
In summary, the key conclusions from this review are:
• The significance of road crash costs in Australia has been consistently underestimated, both in terms of the overall cost and the extent to which these costs are incorporated (i.e. internalised) in road-users’ decisions.
• Based on recent research, the total road crash costs in Australia are more than what has been commonly reported. This increase relates to costs of loss of life and quality of life, much of which is not borne by the road-users responsible.

Cost of road crashes 31
• The value of risk to life is a key issue. For policy analysis in all transport modes, values used should reflect the WTP-based approach rather than the human-capital approach that undervalues life. The WTP-based approach is now common practice in other areas and other developed countries.
• The impact on friends and family should be further investigated and should be considered in policy analysis.
• Greater consideration should also be given to the problem of (passenger and freight) vehicle size and the external costs that larger vehicles impose on other road users.
• Overconfidence causes road-users to not fully internalise the costs to themselves as they underestimate their likelihood of being involved in a road crash.
Cost of road crashes 32
References
Access Economics 2008, ‘The Health of Nations: The Value of a Statistical Life’, A report for Australian Safety and Compensation Council. Available from www.safeworkaustralia.gov.au.
Andersson, H & Lindberg, G, 2008, ‘Benevolence and the value of road safety’, Swedish National Road & Transport Research, Working Papers, Revised June 4, 2008 http://swopec.hhs.se/vtiwps/abs/vtiwps2007_004.htm
Ashenfelter, O 2005, ‘Measuring the Value of a Statistical Life: Problems and Prospects,’ Working Papers 884, Princeton University, Department of Economics, Industrial Relations Section.
ATC (Australian Transport Council) 2006 V5, ‘National Guidelines for Transport System Management in Australia: Volume 5 Background Material’ available from www.atcouncil.gov.au.
Bellavance, F, Dionne, G & Lebeau, M 2007, ‘The Value of a Statistical Life: A Meta-Analysis with a Mixed Effects Regression Model’, Canada Research Chair in Risk Management Working paper 06-12.
Bergstrom, T 2005, ‘Benefit-cost in a Benevolent Society.’ UC Santa Barbara: Department of Economics, UCSB.
BITRE (Bureau of Infrastructure Transport and Regional Economics) 2010, Cost of Road Crashes in Australia, Research Report 118, available at http://www.bitre.gov.au/Info.aspx?ResourceId=748&NodeId=58
BTE (Bureau of Transport and Economics) 2000, Road Crash Costs in Australia, Report 102, available at http://www.btre.gov.au/docs/r102/r102.pdf.
BTRE (Bureau of Transport and Regional Economics) 2006, Submission to the Productivity Commission road and rail freight infrastructure pricing inquiry, August 2006.
Chilton, S, et al. 1998, ‘New research on the valuation of preventing fatal road accident casualties.’ In DETR (ed): Road accidents Great Britain 1997, 28-33. The Stationery Office, London
Connelly, LB & Supangan, R 2006, ‘The economic costs of road traffic crashes: Australia, states and territories’, Accident Analysis and Prevention, 38, 6, 2006, 1087-93.
Dahdah, S & McMahon, K 2008, ‘The true cost of road crashes – valuing life and the cost of a serious injury.’ iRAP, UK. available at www.irap.net/documents/pdf/iRAPValueoflifeseriousinjurypaper.pdf
Cost of road crashes 33
Dickie, M & Messman, VL 2004, ‘Parental altruism and the value of avoiding acute illness: Are kids worth more than parents?’ Journal of Environmental Economics and
Management 2004; 48; 1146-1174.
HEATCO (2006 D5) Developing Harmonised European Approaches for Transport Costing and Project Assessment, ‘Deliverable 5 Proposal for Harmonised Guidelines’, available at http://heatco.ier.uni-stuttgart.de
Hensher, DA, Rose, JM, Ortúzar, J & Rizzi, LI 2009, ‘Estimating the willingness to pay and value of risk reduction for car occupants in the road environment’, ITLS working paper ITLS-WP-03, available from www.itls.usyd.edu.au.
Horowitz, John K. and McConnell, Kenneth E., 2000, A Review of WTA/WTP Studies (October 2000). Available at SSRN: http://ssrn.com/abstract=257336 or doi:10.2139/ssrn.257336
Jacobsson, F, Johannesson, M, & Borgquist, L 2007,‘Is Altruism Paternalistic?’, The
Economic Journal, 117 (April), 761–781.
Jones-Lee, MW 1992, ‘Paternalistic Altruism and the Value of Statistical Life.’ Economics Journal 102(410), 80-90.
Landefeld, JS & Seskin, EP 1982, ‘The economic value of life: linking theory to practice’, American Journal of Public Health, 72(6) 555-566
Lindberg, G 2001, Traffic insurance and Accident Externality Charges Journal of
Transport Economics and Policy, vol. 35, no. 3, 1 September, pp. 399-416 (18). Martin, L 2005, ‘External Accident Costs of Motor Vehicles Revisited’, Staff Paper, Department of Transport and Regional Services, 28th Australasian Transport Research Forum, September 2005. Available from www.bitre.gov.au. NZ DOL (New Zealand Department of Labour) 2004, ‘Measuring the Costs of Injury in New Zealand’, available from http://www.dol.govt.nz/PDFs/COI-MeasuringCostOfInjury.pdf
Oswald, AJ & Powdthavee, N 2008, ‘Death, Happiness, and the Calculation of Compensatory Damages’, Journal of Legal Studies, University of Chicago Press, vol. 37(S2), pages S217-S251, 06.
Parish R, no date, ‘The Valuation of Human Life’, available from author on request.
Parry, I, Wells, M & Harrington, W 2007, ‘Automobile Externalities and Policies’, Journal of Economic Literature, 45, 2, 2007, 373-399
PJP (Port Jackson Partners) 2005, ‘The future for freight’, Report published by the Australasian Railways Association.
Cost of road crashes 34
Sandroni, A & Squintani, F 2004, ‘A Survey on Overconfidence, Insurance and Self-Assessment Training Programs’, unpublished report, available from author on request.
Schwab C, Nathalie G & Soguel, NC 1996, ‘The Pain of Road-Accident Victims and the Bereavement of Their Families: A Contingent-Valuation Experiment.’ Journal of Risk
and Uncertainty, Vol., 13, No. 3.
UK DFT (United Kingdom Department for Transport) 2007, Highway Economics Note No. 1, 2005: Valuation of the Benefits of Prevention of Road Accidents and Casualties, available at http://www.dft.gov.uk/pgr/roadsafety/ea/pdfeconnote105.pdf.
US OMB (United States Office of Management and Budget) 2003, ‘Regulatory Analysis’ Circular 17, A- 4:13.
US DOT (U.S. Department of Transportation) 2008, Re: Treatment of the Economic Value of a Statistical Life in Departmental Analyses’
US DOT (U.S. Department of Transportation) 2009, ‘Treatment of the Economic Value of a Statistical Life in Departmental Analyses – 2009 Annual Revision’, Memorandum to secretarial officers, modal administrators, Dated: March 18, 2009, available at http://ostpxweb.dot.gov/policy/reports/VSL%20Guidance%20031809%20a.pdf .
Viscusi WK 2008, ‘How to Value a Life’ Vanderbilt University Law School Law and Economics, Working Paper Number 08-16/
Viscusi WK and Aldy J 2003, ‘The Value of a Statistical Life: A Critical Review of Market Estimates Throughout the World’ Journal of Risk and Uncertainty, vol. 27(1), pp. 5-76.
Viscusi, WK forthcoming, ‘The Flawed Hedonic Damages Measure of Compensation for Wrongful Death and Personal Injury.’ Journal of Forensic Economics, Forthcoming; Vanderbilt Law and Economics Research Paper No. 08-05
White, M 2004, "The 'arms race' on American Roads: The Effect of SUV's and Pickup Trucks on Traffic Safety," Journal of Law and Economics, 2004, XLVII (2), 333-356.
Zhang A., Boardman, AE, Gillen, D & Waters, WG 2004, ‘Towards Estimating the Social and Environmental Costs of Transportation in Canada’, A report for Transport Canada, available from http://www.tc.gc.ca/pol/en/aca/fci/transmodal/menu.htm