road traffic crashes in queensland 2000/media/safety/transport and road statistics... · page vi...
TRANSCRIPT

CONTENTS Page
INTRODUCTIONBackground to the report .................................................................................................. iv Main features of road traffic crashes in Queensland 2000 ................................................. v Road Crash Database ...................................................................................................... vi
1. ROAD TOLL IN CONTEXT1.1 Road fatality trends ................................................................................................1 1.2 Road casualty trends..............................................................................................2 1.3 Trends in total reported crashes.............................................................................3 1.4 Queensland in relation to Australia.........................................................................4 1.5 Factors behind the road toll ....................................................................................6 1.6 The major contributors to the 2000 fatal road toll....................................................6 1.7 Proposed next steps ..............................................................................................7
2. CHARACTERISTICS OF ROAD USERS INVOLVED IN CRASHES2.1 Introduction ............................................................................................................9 2.2 Trend .....................................................................................................................9 2.3 Children................................................................................................................13 2.4 Young adults ........................................................................................................14 2.5 Mature age road users .........................................................................................16 2.6 Older road users ..................................................................................................19
3. UNITS IN CRASHES3.1 Introduction ..........................................................................................................22 3.2 Fatal crash involvement by unit type ....................................................................24
Cars and variants .................................................................................................24 Heavy freight vehicles ..........................................................................................24 Heavy freight vehicles ..........................................................................................25 Buses ...................................................................................................................25 Motorcycles ..........................................................................................................26 Bicycles ................................................................................................................26 Pedestrians ..........................................................................................................27
4. CHARACTERISTICS OF CRASHES4.1 Introduction ..........................................................................................................28 4.2 Comparative trends..............................................................................................28 4.3 Multi-vehicle crashes............................................................................................30 4.4 Single vehicle crashes..........................................................................................31 4.5 Crashes by time of day.........................................................................................32 4.6 Crashes by day of week .......................................................................................34 4.7 Spatial location of crashes ...................................................................................35
5. FACTORS CONTRIBUTING TO CRASHES5.1 Introduction ..........................................................................................................37 5.2 Trends..................................................................................................................38 5.3 Alcohol and road fatalities ....................................................................................38 5.4 Speed as a contributing factor to fatalities ............................................................41 5.5 Fatigue as a contributing factor ............................................................................42 5.6 Seat belt usage in fatal crashes ...........................................................................43
APPENDIX 1 GLOSSARY.......................................................................A1-1 APPENDIX 2 KEY SUMMARY TABLES............................................A2- 1

Page iv Road Traffic Crashes in Queensland: 2000
INTRODUCTION
Background to the reportThis report presents an overview of reported road traffic crashes in Queensland for the yearended 31 December 2000 in the context of the previous five years.
The information in this bulletin is based on data contained in the Queensland Road CrashInformation System maintained by Queensland Transport's Land Transport & Safety Division.Additional data supplied by the Queensland Government Chemical Laboratory is used for theanalysis of alcohol involvement in road crashes, in particular those involving a fatality.Validation and enhancement of the raw data which originates from the Queensland PoliceService Traffic Incident Report System (TIRS) is completed by the Road Crash DatabaseGroup. This group provides a statistical service for the Land Transport & Safety Division andis a unit located within the Government Statistician’s Office, Queensland TreasuryDepartment.
In 1991, a number of major changes occurred concerning road crash data collection inQueensland, which impact upon the figures in this report. These changes were:
• from 1 April 1991: implementation of the Queensland Road Crash InformationSystem by Queensland Transport. Prior to that date all road traffic crash dataon the system had been coded by the Australian Bureau of Statistics (ABS) anddistributed to Queensland Transport;
• from 1 July 1991: transfer of the official source for Queensland road traffic crashstatistics from the ABS to Queensland Transport;
• from 1 October 1991: introduction of a new Queensland Police Service TIRSand computerised data entry system;
• from 1 December 1991: increase of the minimum damage cost of a reportableroad crash (under Section 31 of the Queensland Traffic Act) from greater than$1,000 to greater than $2,500.
During 1992 further modifications were made to the Queensland Road Crash InformationSystem. Also the criterion for the inclusion of a “property damage only” crash in the systemwas altered in line with the then Queensland Traffic Act to include any crash where thedamage to vehicles was greater than $2500 or towed away. On 1 December 1999, with theimplementation of the Australian Road Rules in Queensland, this was again altered toinclude crashes where the damage was greater than $2500 to property other than vehicles orat least one vehicle was towed away.
All crashes and casualties reported in this bulletin are dated in terms of the actual crashdates. Because of this and the fact that some non-fatal crashes may take 12 months orlonger for validation, crash data for prior years will contain a percentage of changed data aslate reports continue to be entered.
Figures presented in this report are based on the crashes validated in the Queensland RoadCrash Information System at 31 March 2001.
Road Traffic Crashes in Queensland: 2000 Page v
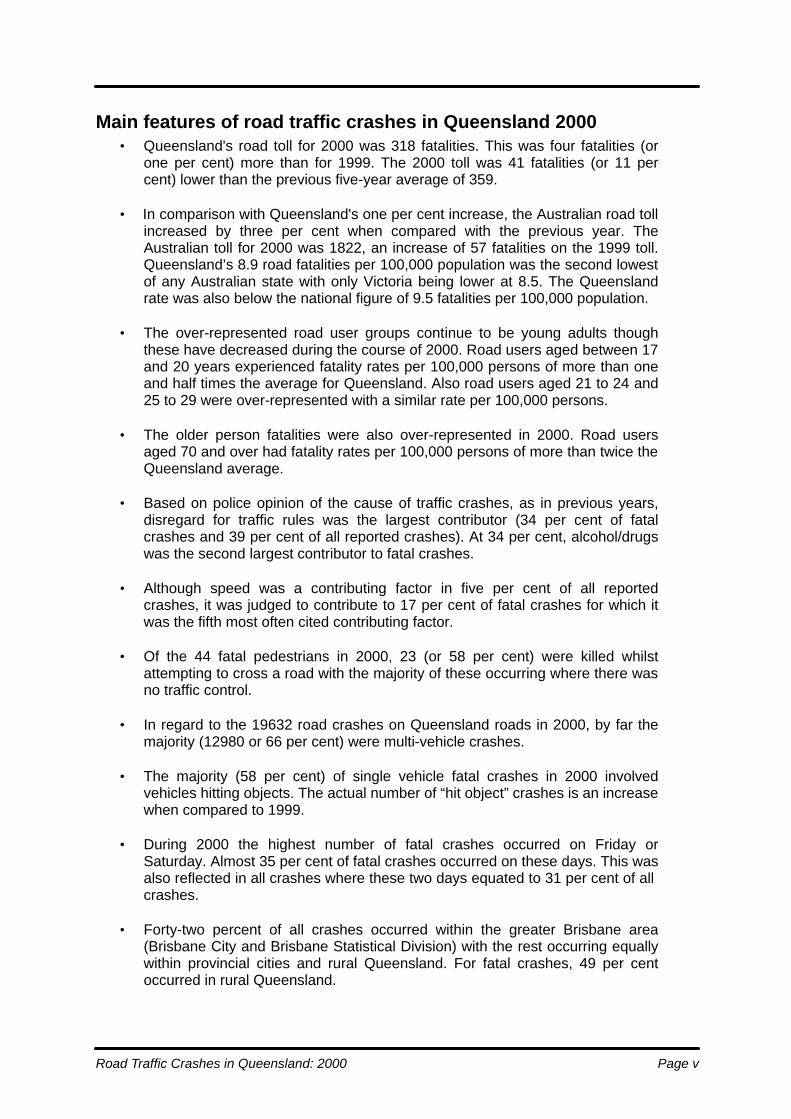
Main features of road traffic crashes in Queensland 2000 • Queensland's road toll for 2000 was 318 fatalities. This was four fatalities (or
one per cent) more than for 1999. The 2000 toll was 41 fatalities (or 11 per cent) lower than the previous five-year average of 359.
• In comparison with Queensland's one per cent increase, the Australian road toll
increased by three per cent when compared with the previous year. The Australian toll for 2000 was 1822, an increase of 57 fatalities on the 1999 toll. Queensland’s 8.9 road fatalities per 100,000 population was the second lowest of any Australian state with only Victoria being lower at 8.5. The Queensland rate was also below the national figure of 9.5 fatalities per 100,000 population.
• The over-represented road user groups continue to be young adults though
these have decreased during the course of 2000. Road users aged between 17 and 20 years experienced fatality rates per 100,000 persons of more than one and half times the average for Queensland. Also road users aged 21 to 24 and 25 to 29 were over-represented with a similar rate per 100,000 persons.
• The older person fatalities were also over-represented in 2000. Road users
aged 70 and over had fatality rates per 100,000 persons of more than twice the Queensland average.
• Based on police opinion of the cause of traffic crashes, as in previous years,
disregard for traffic rules was the largest contributor (34 per cent of fatal crashes and 39 per cent of all reported crashes). At 34 per cent, alcohol/drugs was the second largest contributor to fatal crashes.
• Although speed was a contributing factor in five per cent of all reported
crashes, it was judged to contribute to 17 per cent of fatal crashes for which it was the fifth most often cited contributing factor.
• Of the 44 fatal pedestrians in 2000, 23 (or 58 per cent) were killed whilst
attempting to cross a road with the majority of these occurring where there was no traffic control.
• In regard to the 19632 road crashes on Queensland roads in 2000, by far the
majority (12980 or 66 per cent) were multi-vehicle crashes.
• The majority (58 per cent) of single vehicle fatal crashes in 2000 involved vehicles hitting objects. The actual number of “hit object” crashes is an increase when compared to 1999.
• During 2000 the highest number of fatal crashes occurred on Friday or
Saturday. Almost 35 per cent of fatal crashes occurred on these days. This was also reflected in all crashes where these two days equated to 31 per cent of all crashes.
• Forty-two percent of all crashes occurred within the greater Brisbane area
(Brisbane City and Brisbane Statistical Division) with the rest occurring equally within provincial cities and rural Queensland. For fatal crashes, 49 per cent occurred in rural Queensland.
Page vi Road Traffic Crashes in Queensland: 2000
Road Crash Database
Road crash data plays a major role in the road safety planning and action of major agenciesin Queensland and major developments have occurred in its use in recent years.
Queensland Transport provides a range of analysis services using the road crash data. Aswell as the present report, road crash data is used to provide crash profile reports, onrequest, on specific crash categories. As well, crash data is used to evaluate theeffectiveness of all major countermeasures in Queensland (see Chapter 1 of this report) soas to influence program development.
The Department of Main Roads takes core data from the road crash data system operatedby Queensland Transport and adds further site information to enable better planning for roadsafety engineering.
Road Traffic Crashes in Queensland: 2000 Page 1
1. ROAD TOLL IN CONTEXT In this section, road traffic crashes for a range of severities in Queensland during 2000 are analysed. The analysis compares 2000 crashes (i) with past trends, (ii) with other states of Australia and (iii) in terms of population growth and economic activity. Finally, the key road safety initiatives of the 2000/2001 Queensland Road Safety Action Plan are evaluated and future actions to reduce the Queensland road toll are summarised.
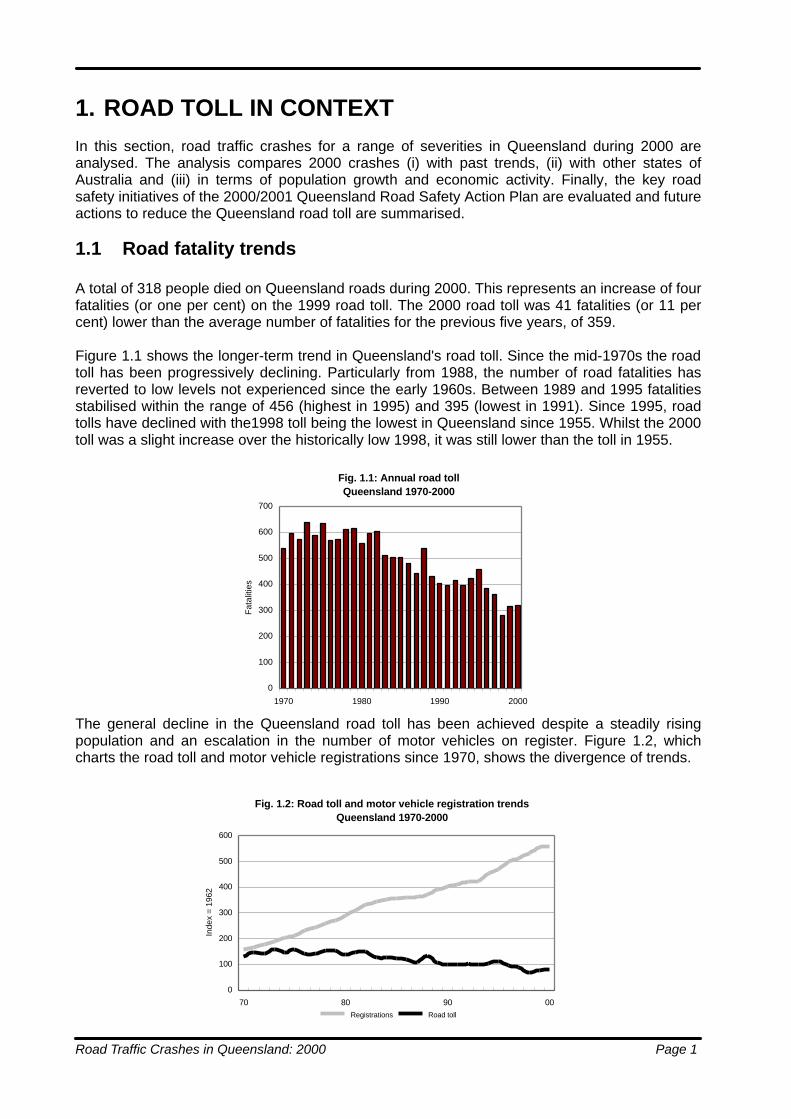
1.1 Road fatality trends A total of 318 people died on Queensland roads during 2000. This represents an increase of four fatalities (or one per cent) on the 1999 road toll. The 2000 road toll was 41 fatalities (or 11 per cent) lower than the average number of fatalities for the previous five years, of 359. Figure 1.1 shows the longer-term trend in Queensland's road toll. Since the mid-1970s the road toll has been progressively declining. Particularly from 1988, the number of road fatalities has reverted to low levels not experienced since the early 1960s. Between 1989 and 1995 fatalities stabilised within the range of 456 (highest in 1995) and 395 (lowest in 1991). Since 1995, road tolls have declined with the1998 toll being the lowest in Queensland since 1955. Whilst the 2000 toll was a slight increase over the historically low 1998, it was still lower than the toll in 1955.
The general decline in the Queensland road toll has been achieved despite a steadily rising population and an escalation in the number of motor vehicles on register. Figure 1.2, which charts the road toll and motor vehicle registrations since 1970, shows the divergence of trends.
Fig. 1.1: Annual road tollQueensland 1970-2000
0
100
200
300
400
500
600
700
1970 1980 1990 2000
Fat
aliti
es
Fig. 1.2: Road toll and motor vehicle registration trendsQueensland 1970-2000
0
100
200
300
400
500
600
70 80 90 00
Inde
x =
1962
Registrations Road toll

Page 2 Road Traffic Crashes in Queensland: 2000
Fatalities in 2000 were 40 per cent below the 1970 toll of 527 fatalities, but vehicle registrations in 2000 were almost four times the 1970 level (see Table 1.1). From the early 1960s, annual road toll figures increased until the mid-1970s, after which a substantial decrease occurred. This decline was achieved despite a continuing strong increase in the number of motor vehicles registered. A number of road safety initiatives introduced since 1970 have contributed to the reduction in road fatalities, particularly:
• compulsory seat belt wearing for occupants of cars (1972); • reduction of illegal blood alcohol levels to 0.05 per cent (1982); • introduction of Random Breath Testing (1988); • introduction of Random Road Watch (1991); • compulsory helmet wearing for bicyclists (1992); • introduction of Speed Cameras (1997); and • introduction of 50 km/h on local streets (1999)
As shown in Table 1.1, the fatality rates relative to both population and vehicle registration have declined significantly since 1970. Since that year the fatality rate based on population has declined by more than two-thirds and the rate based on number of vehicles on register has fallen over 80 per cent. Approximately 8.9 persons per 100,000 population died on Queensland roads in 2000 in contrast to 29.1 in 1970. Further, there were 1.3 road fatalities per 10,000 Queensland vehicles on register in 2000 in contrast to 7.7 in 1970.
1.2 Road casualty trends Casualties from road traffic crashes on Queensland roads totalled 15,173 in 2000. This represents a increase of 286 (or two per cent) on 1999. The increase was in all severity categories. The 2000 casualty figure was 98 (or one per cent) lower than the average number for the previous five years.
Table 1.1: Fatality rates per head of population and vehicles registeredQueensland 1970 to 2000
Fatality rate Vehicles on Fatality rate perYear Road Toll Population * per 100,000 register 10,000 vehicles
('000) population ('000)1970 527 1812.8 29.1 686.1 7.71975 635 2072.3 30.6 917.0 6.91980 557 2301.7 24.2 1256.9 4.41985 502 2597.1 19.3 1546.1 3.21990 399 2932.2 13.6 1751.9 2.31995 456 3277.3 13.9 2038.9 2.22000 318 3566.4 8.9 2428.6 1.3
* ABS Cat. No. 3201.0
Table 1.2: Severity of road crash casualtiesQueensland 1995-2000
Severity 1995 1996 1997 1998 1999 2000No. % No. % No. % No. % No. % No. %
Fatal 456 3% 385 2% 360 2% 279 2% 314 2% 318 2%Hospitalisation 4636 29% 4481 28% 4146 28% 4394 29% 4496 30% 4726 31%Medical treatment required 6692 43% 6836 43% 6483 43% 6321 42% 6243 42% 6265 41%Other injury 3932 25% 4131 26% 3928 26% 4008 27% 3834 26% 3864 25%Total 15716 100% 15833 100% 14917 100% 15002 100% 14887 100% 15173 100%
Road Traffic Crashes in Queensland: 2000 Page 3
As indicated in Table 1.2:
• the total number of road crash casualties in 2000 was slightly above that for 1999; • road crash casualties in 2000 were more than three per cent lower than in 1995; • 33 per cent of all road crash casualties in 2000 were either killed or admitted to
hospital; and
• medical treatment injuries accounted for the greatest percentage of all casualties in 2000 (41 per cent).
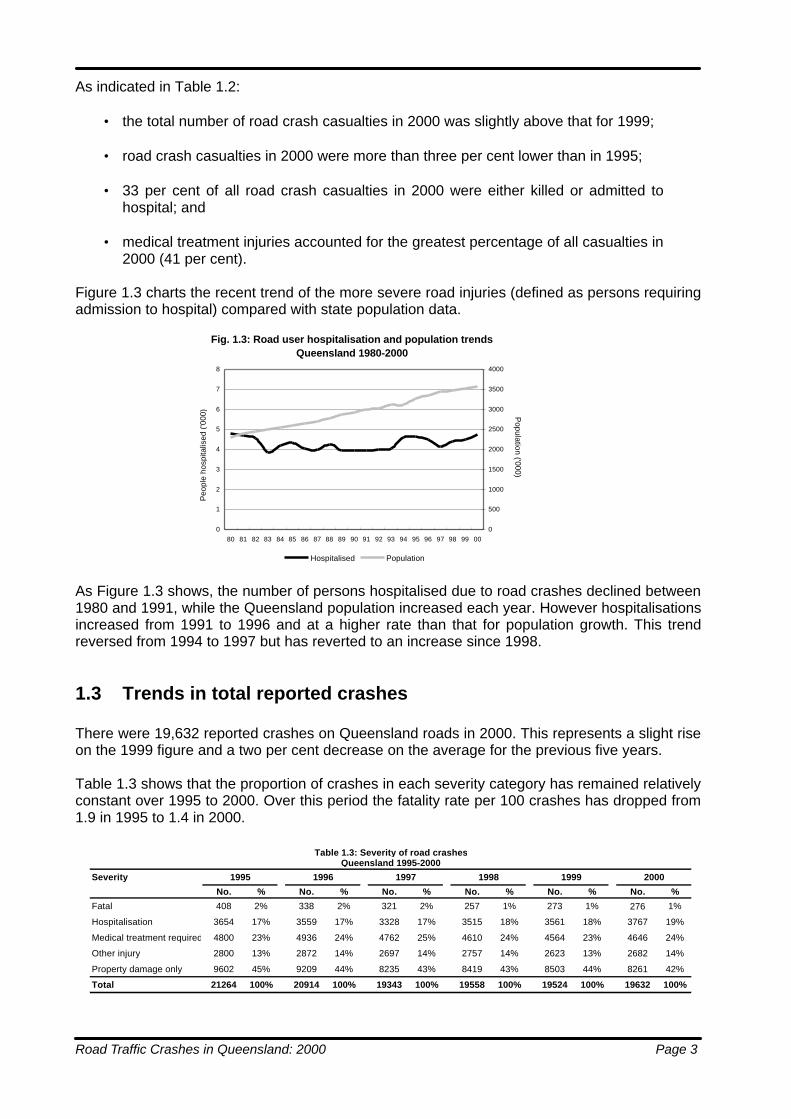
Figure 1.3 charts the recent trend of the more severe road injuries (defined as persons requiring admission to hospital) compared with state population data.
As Figure 1.3 shows, the number of persons hospitalised due to road crashes declined between 1980 and 1991, while the Queensland population increased each year. However hospitalisations increased from 1991 to 1996 and at a higher rate than that for population growth. This trend reversed from 1994 to 1997 but has reverted to an increase since 1998.
1.3 Trends in total reported crashes There were 19,632 reported crashes on Queensland roads in 2000. This represents a slight rise on the 1999 figure and a two per cent decrease on the average for the previous five years. Table 1.3 shows that the proportion of crashes in each severity category has remained relatively constant over 1995 to 2000. Over this period the fatality rate per 100 crashes has dropped from 1.9 in 1995 to 1.4 in 2000.
Fig. 1.3: Road user hospitalisation and population trendsQueensland 1980-2000
0
1
2
3
4
5
6
7
8
80 81 82 83 84 85 86 87 88 89 90 91 92 93 94 95 96 97 98 99 00
Peo
ple
hosp
italis
ed (
'000
)
0
500
1000
1500
2000
2500
3000
3500
4000
Population ('000)
Hospitalised Population
Table 1.3: Severity of road crashesQueensland 1995-2000
Severity 1995 1996 1997 1998 1999 2000
No. % No. % No. % No. % No. % No. %
Fatal 408 2% 338 2% 321 2% 257 1% 273 1% 276 1%
Hospitalisation 3654 17% 3559 17% 3328 17% 3515 18% 3561 18% 3767 19%
Medical treatment required 4800 23% 4936 24% 4762 25% 4610 24% 4564 23% 4646 24%
Other injury 2800 13% 2872 14% 2697 14% 2757 14% 2623 13% 2682 14%
Property damage only 9602 45% 9209 44% 8235 43% 8419 43% 8503 44% 8261 42%
Total 21264 100% 20914 100% 19343 100% 19558 100% 19524 100% 19632 100%
Page 4 Road Traffic Crashes in Queensland: 2000
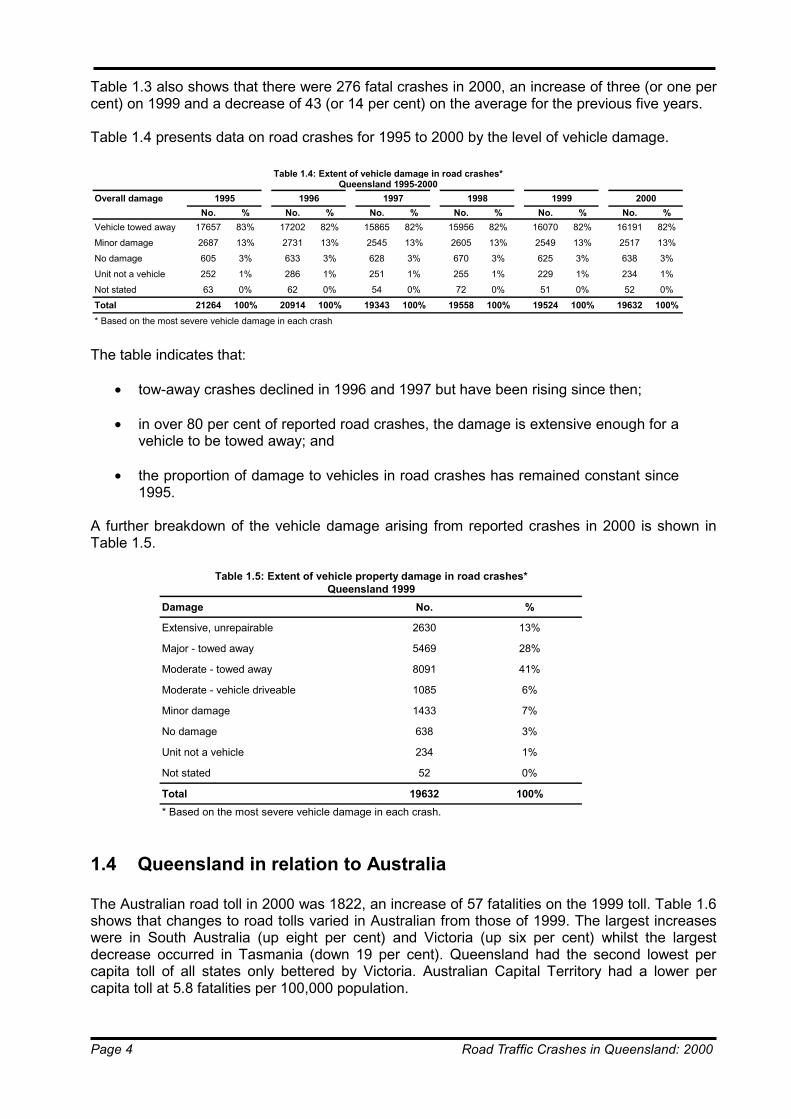
Table 1.3 also shows that there were 276 fatal crashes in 2000, an increase of three (or one per cent) on 1999 and a decrease of 43 (or 14 per cent) on the average for the previous five years. Table 1.4 presents data on road crashes for 1995 to 2000 by the level of vehicle damage.
The table indicates that:
• tow-away crashes declined in 1996 and 1997 but have been rising since then; • in over 80 per cent of reported road crashes, the damage is extensive enough for a
vehicle to be towed away; and • the proportion of damage to vehicles in road crashes has remained constant since
1995. A further breakdown of the vehicle damage arising from reported crashes in 2000 is shown in Table 1.5.
1.4 Queensland in relation to Australia The Australian road toll in 2000 was 1822, an increase of 57 fatalities on the 1999 toll. Table 1.6 shows that changes to road tolls varied in Australian from those of 1999. The largest increases were in South Australia (up eight per cent) and Victoria (up six per cent) whilst the largest decrease occurred in Tasmania (down 19 per cent). Queensland had the second lowest per capita toll of all states only bettered by Victoria. Australian Capital Territory had a lower per capita toll at 5.8 fatalities per 100,000 population.
Table 1.4: Extent of vehicle damage in road crashes*Queensland 1995-2000
Overall damage 1995 1996 1997 1998 1999 2000No. % No. % No. % No. % No. % No. %
Vehicle towed away 17657 83% 17202 82% 15865 82% 15956 82% 16070 82% 16191 82%Minor damage 2687 13% 2731 13% 2545 13% 2605 13% 2549 13% 2517 13%No damage 605 3% 633 3% 628 3% 670 3% 625 3% 638 3%Unit not a vehicle 252 1% 286 1% 251 1% 255 1% 229 1% 234 1%Not stated 63 0% 62 0% 54 0% 72 0% 51 0% 52 0%Total 21264 100% 20914 100% 19343 100% 19558 100% 19524 100% 19632 100%* Based on the most severe vehicle damage in each crash
Table 1.5: Extent of vehicle property damage in road crashes*Queensland 1999
Damage No. %
Extensive, unrepairable 2630 13%
Major - towed away 5469 28%
Moderate - towed away 8091 41%
Moderate - vehicle driveable 1085 6%
Minor damage 1433 7%
No damage 638 3%
Unit not a vehicle 234 1%
Not stated 52 0%
Total 19632 100%* Based on the most severe vehicle damage in each crash.

Road Traffic Crashes in Queensland: 2000 Page 5
As indicated previously, Queensland’s 8.9 road fatalities per 100,000 population and 1.3 road fatalities per 10,000 motor vehicles on register were both below the Australian average rates of 9.5 and 1.5 respectively.
To place this situation into a longer-term perspective, Figure 1.4 plots annual road fatalities by state for the period 1986 to 2000.
The figure shows that:
• after a period of relative stability, road fatalities in NSW and Victoria fell significantly from 1988 to 1992;
• the road toll in other jurisdictions remained relatively constant over the period; and • the Queensland road toll has been declining markedly in comparison with the other
states since 1995.
Fig. 1.4: Annual road fatalities by state1986-2000
0
200
400
600
800
1000
1200
1986 1987 1988 1989 1990 1991 1992 1993 1994 1995 1996 1997 1998 1999 2000
Fata
litie
s
Qld NSW Vic SA WA Tas
Table 1.6: Road toll in 2000 compared with 1999States and territories of Australia
Fatalities Fatality rate2000 1999 Variation Variation per 100,000 per 10,000No. No. No. per cent population * vehicles on
register **New South Wales 606 578 28 5% 9.4 1.6
Queensland 318 314 4 1% 8.9 1.3
Victoria 407 383 24 6% 8.5 1.3
Western Australia 213 217 -4 -2% 11.3 1.6
South Australia 166 153 13 8% 11.1 1.6
Tasmania 43 53 -10 -19% 9.1 1.3
Northern Territory 51 49 2 4% 26.1 5.0
Australian Capital Territory 18 18 0 0% 5.8 0.9
Australia 1822 1765 57 3% 9.5 1.5
* Based on ABS Cat. No. 3201.0
** Vehicle data supplied by relevant road authorities
Page 6 Road Traffic Crashes in Queensland: 2000
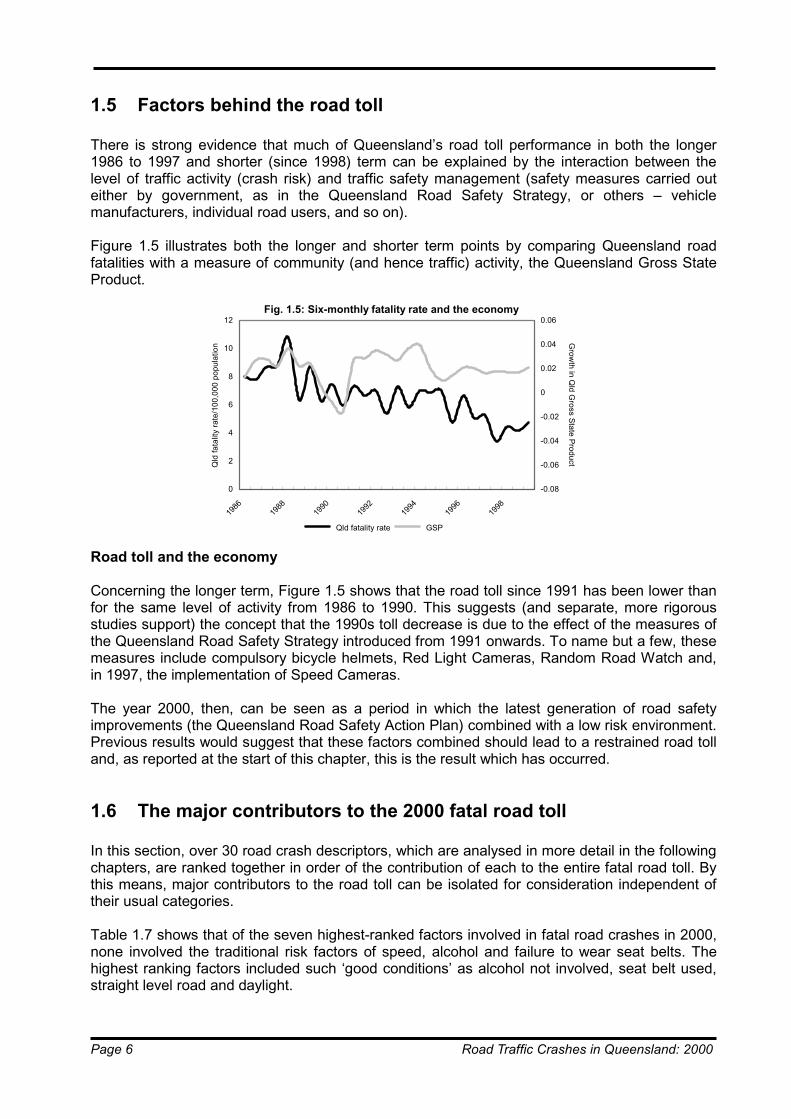
1.5 Factors behind the road toll There is strong evidence that much of Queensland’s road toll performance in both the longer 1986 to 1997 and shorter (since 1998) term can be explained by the interaction between the level of traffic activity (crash risk) and traffic safety management (safety measures carried out either by government, as in the Queensland Road Safety Strategy, or others – vehicle manufacturers, individual road users, and so on). Figure 1.5 illustrates both the longer and shorter term points by comparing Queensland road fatalities with a measure of community (and hence traffic) activity, the Queensland Gross State Product.
Road toll and the economy Concerning the longer term, Figure 1.5 shows that the road toll since 1991 has been lower than for the same level of activity from 1986 to 1990. This suggests (and separate, more rigorous studies support) the concept that the 1990s toll decrease is due to the effect of the measures of the Queensland Road Safety Strategy introduced from 1991 onwards. To name but a few, these measures include compulsory bicycle helmets, Red Light Cameras, Random Road Watch and, in 1997, the implementation of Speed Cameras. The year 2000, then, can be seen as a period in which the latest generation of road safety improvements (the Queensland Road Safety Action Plan) combined with a low risk environment. Previous results would suggest that these factors combined should lead to a restrained road toll and, as reported at the start of this chapter, this is the result which has occurred.
1.6 The major contributors to the 2000 fatal road toll In this section, over 30 road crash descriptors, which are analysed in more detail in the following chapters, are ranked together in order of the contribution of each to the entire fatal road toll. By this means, major contributors to the road toll can be isolated for consideration independent of their usual categories. Table 1.7 shows that of the seven highest-ranked factors involved in fatal road crashes in 2000, none involved the traditional risk factors of speed, alcohol and failure to wear seat belts. The highest ranking factors included such ‘good conditions’ as alcohol not involved, seat belt used, straight level road and daylight.
Fig. 1.5: Six-monthly fatality rate and the economy
0
2
4
6
8
10
12
1986
1988
1990
1992
1994
1996
1998
Qld
fata
lity
rate
/100
,000
pop
ulat
ion
-0.08
-0.06
-0.04
-0.02
0
0.02
0.04
0.06
Grow
th in Qld G
ross State Product
Qld fatality rate GSP

Road Traffic Crashes in Queensland: 2000 Page 7
The high levels of these categories of crashes point to the influence of the road and travel environment on fatal crashes. Hence widespread as well as targeted safety programs may be more likely to achieve benefits through greater deterrence.
1.7 Proposed next steps As discussed above, during the 1990s Queensland has been subject to a wide range of road safety risk factors including Australia’s:
• most rapid population growth; and
• strongest economic performance. However, as outlined above, the road toll has not increased to the extent expected (see Section 1.5). As also outlined this reflects the success of the road safety initiatives discussed above, including those implemented since the release of the 1993 Queensland Road Safety Strategy. Despite the benefits of these programs, the road toll remains high. Following the success of the 1999/2000 Action Plan, the Queensland Government developed the 2000/2001 Queensland Road Safety Action Plan to enhance those measures which were proven to work and to introduce further new effective programs. The 2000/2001 Queensland Road Safety Action Plan Top 10 actions in priority order are presented in Table 1.8.
Table 1.7: Fatal crash descriptors by size of contribution to fatal crashes:per cent of crashes, units or persons involved
Queensland 2000Crash descriptor % Total Crash descriptor % Total
Alcohol not involved 84% Speed 26%
Seatbelt used 79% 17-24 years 22%
Non-intersection 78% Seatbelt not used 21%
Weekday 69% Alcohol involvement 16%
Cars and variants 66% 60 years and over 14%
25-59 years 62% Heavy freight vehicles 13%
Daylight 59% Brisbane City 11%
Built-up area 56% Pedestrians 10%
Open road 54% Uncontrolled intersections 9%
Disobeyed traff ic rules 54% Fatigue 9%
Multi-vehicle 52% Motorcycle 7%
Single vehicle 48% Rain/w et road 5%
After dark 41% Vehicle defects 3%
Weekend 31% Bicycles 1%
Age/inexperience 30%

Page 8 Road Traffic Crashes in Queensland: 2000
These initiatives have been prioritised on the basis of:
• the extent to which they target the total road toll; • their ability to reduce crashes; and • their value for money.
Once implemented, it is expected that the Top 10 initiatives alone will make significant further inroads into the state road toll.
Table 1.8: 2000/2001 Queensland Road Safety Action Plan - Top 10 actions in priority order
ActionType of crash addressed
Coverage of road toll
Proven crash
reductions
Value for money score
Target group
Enhanced speed management strategy
Speed-related crashes Medium Y High Drivers
Random Road Watch enforcement program
All crashes High Y High All road users
Improved Random Breath Testing
All crashes High Y Medium All road users
More effective sanctions and penalties
All crashes Medium Y High All road users
Road safety traff ic engineering w orks
All crashes Low Y Medium All road users
Improved vehicle safety standards All crashes High Y Medium Vehicle occupants
Increase w earing of seat belts
All crashes Medium Y High All vehicle occupants
Increase take-up of road safety ITS
All crashes All road users
Conduct public education campaigns
All crashes Low Y Medium All road users
Maintenance of State Traff ic Task Force
All crashes Medium Y Medium All road users
Road Traffic Crashes in Queensland: 2000 Page 9
2. CHARACTERISTICS OF ROAD USERS INVOLVED IN CRASHES
2.1 Introduction Of the 318 road users killed on Queensland roads in 2000, 234 (or 74 per cent) were male and 84 (or 26 per cent) were female. This represents an increase of 10 males and a decrease of 4 females over the figures for 1999.
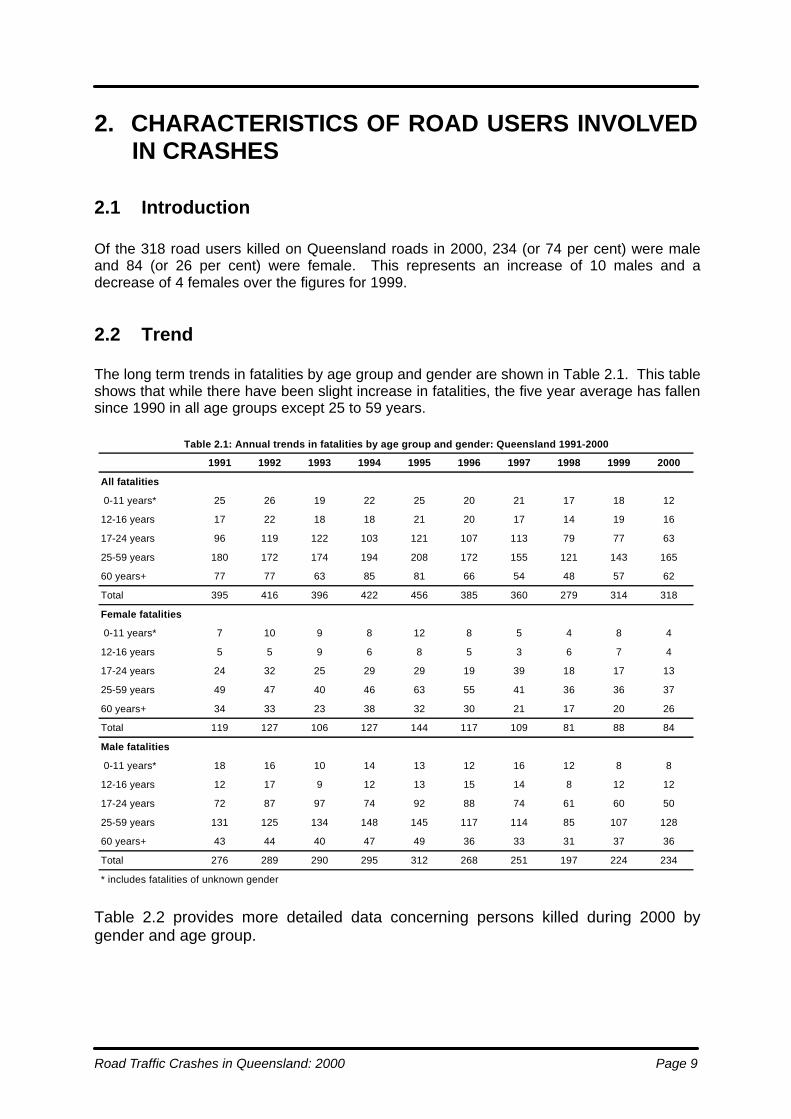
2.2 Trend The long term trends in fatalities by age group and gender are shown in Table 2.1. This table shows that while there have been slight increase in fatalities, the five year average has fallen since 1990 in all age groups except 25 to 59 years.
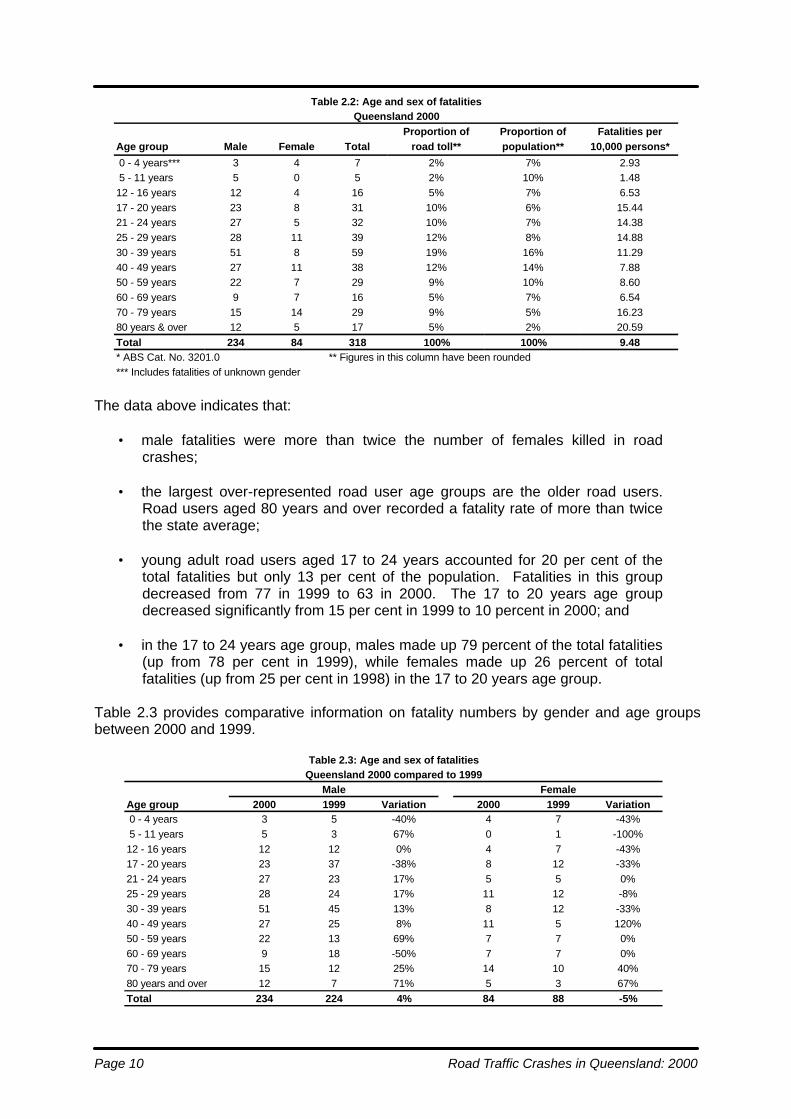
Table 2.2 provides more detailed data concerning persons killed during 2000 by gender and age group.
Table 2.1: Annual trends in fatalities by age group and gender: Queensland 1991-2000
1991 1992 1993 1994 1995 1996 1997 1998 1999 2000
All fatalities
0-11 years* 25 26 19 22 25 20 21 17 18 12
12-16 years 17 22 18 18 21 20 17 14 19 16
17-24 years 96 119 122 103 121 107 113 79 77 63
25-59 years 180 172 174 194 208 172 155 121 143 165
60 years+ 77 77 63 85 81 66 54 48 57 62
Total 395 416 396 422 456 385 360 279 314 318
Female fatalities
0-11 years* 7 10 9 8 12 8 5 4 8 4
12-16 years 5 5 9 6 8 5 3 6 7 4
17-24 years 24 32 25 29 29 19 39 18 17 13
25-59 years 49 47 40 46 63 55 41 36 36 37
60 years+ 34 33 23 38 32 30 21 17 20 26
Total 119 127 106 127 144 117 109 81 88 84
Male fatalities
0-11 years* 18 16 10 14 13 12 16 12 8 8
12-16 years 12 17 9 12 13 15 14 8 12 12
17-24 years 72 87 97 74 92 88 74 61 60 50
25-59 years 131 125 134 148 145 117 114 85 107 128
60 years+ 43 44 40 47 49 36 33 31 37 36
Total 276 289 290 295 312 268 251 197 224 234
* includes fatalities of unknown gender
Page 10 Road Traffic Crashes in Queensland: 2000
The data above indicates that:
• male fatalities were more than twice the number of females killed in road crashes;
• the largest over-represented road user age groups are the older road users.
Road users aged 80 years and over recorded a fatality rate of more than twice the state average;
• young adult road users aged 17 to 24 years accounted for 20 per cent of the
total fatalities but only 13 per cent of the population. Fatalities in this group decreased from 77 in 1999 to 63 in 2000. The 17 to 20 years age group decreased significantly from 15 per cent in 1999 to 10 percent in 2000; and
• in the 17 to 24 years age group, males made up 79 percent of the total fatalities
(up from 78 per cent in 1999), while females made up 26 percent of total fatalities (up from 25 per cent in 1998) in the 17 to 20 years age group.
Table 2.3 provides comparative information on fatality numbers by gender and age groups between 2000 and 1999.
Table 2.2: Age and sex of fatalitiesQueensland 2000
Proportion of Proportion of Fatalities perAge group Male Female Total road toll** population** 10,000 persons*
0 - 4 years*** 3 4 7 2% 7% 2.93 5 - 11 years 5 0 5 2% 10% 1.4812 - 16 years 12 4 16 5% 7% 6.5317 - 20 years 23 8 31 10% 6% 15.4421 - 24 years 27 5 32 10% 7% 14.3825 - 29 years 28 11 39 12% 8% 14.8830 - 39 years 51 8 59 19% 16% 11.2940 - 49 years 27 11 38 12% 14% 7.8850 - 59 years 22 7 29 9% 10% 8.6060 - 69 years 9 7 16 5% 7% 6.5470 - 79 years 15 14 29 9% 5% 16.2380 years & over 12 5 17 5% 2% 20.59Total 234 84 318 100% 100% 9.48* ABS Cat. No. 3201.0 ** Figures in this column have been rounded*** Includes fatalities of unknown gender
Table 2.3: Age and sex of fatalitiesQueensland 2000 compared to 1999
Male FemaleAge group 2000 1999 Variation 2000 1999 Variation 0 - 4 years 3 5 -40% 4 7 -43% 5 - 11 years 5 3 67% 0 1 -100%12 - 16 years 12 12 0% 4 7 -43%17 - 20 years 23 37 -38% 8 12 -33%21 - 24 years 27 23 17% 5 5 0%25 - 29 years 28 24 17% 11 12 -8%30 - 39 years 51 45 13% 8 12 -33%40 - 49 years 27 25 8% 11 5 120%50 - 59 years 22 13 69% 7 7 0%60 - 69 years 9 18 -50% 7 7 0%70 - 79 years 15 12 25% 14 10 40%80 years and over 12 7 71% 5 3 67%Total 234 224 4% 84 88 -5%
Road Traffic Crashes in Queensland: 2000 Page 11
Table 2.3 indicates that, compared with 1999:
• the number of male road user fatalities increased by 4 per cent from 224 to 234in 2000. Fatalities for females decreased five per cent from 88 to 84;
• the largest percentage decrease of male age groups occurred in fatalities aged60 to 69 years, (a decrease of 50 per cent from 18 to 9);
• the largest percentage decrease for any female age group occurred in the 5 to11 years age group, where fatalities decreased by 100 per cent (from one tozero) compared with 1999. Fatalities in the 0 to 4 years age group and 12 to 16years age group decreased by 43 per cent from 7 in 1999 to four in 2000; and
• in contrast to 1999, the largest percentage increases in male fatalities occurredin the 80 years and over age group (from seven to 12). The largest percentageincrease in female fatalities occurred in the 40 to 49 years and 80 years andover age groups, by 120 and 67 per cent respectively.
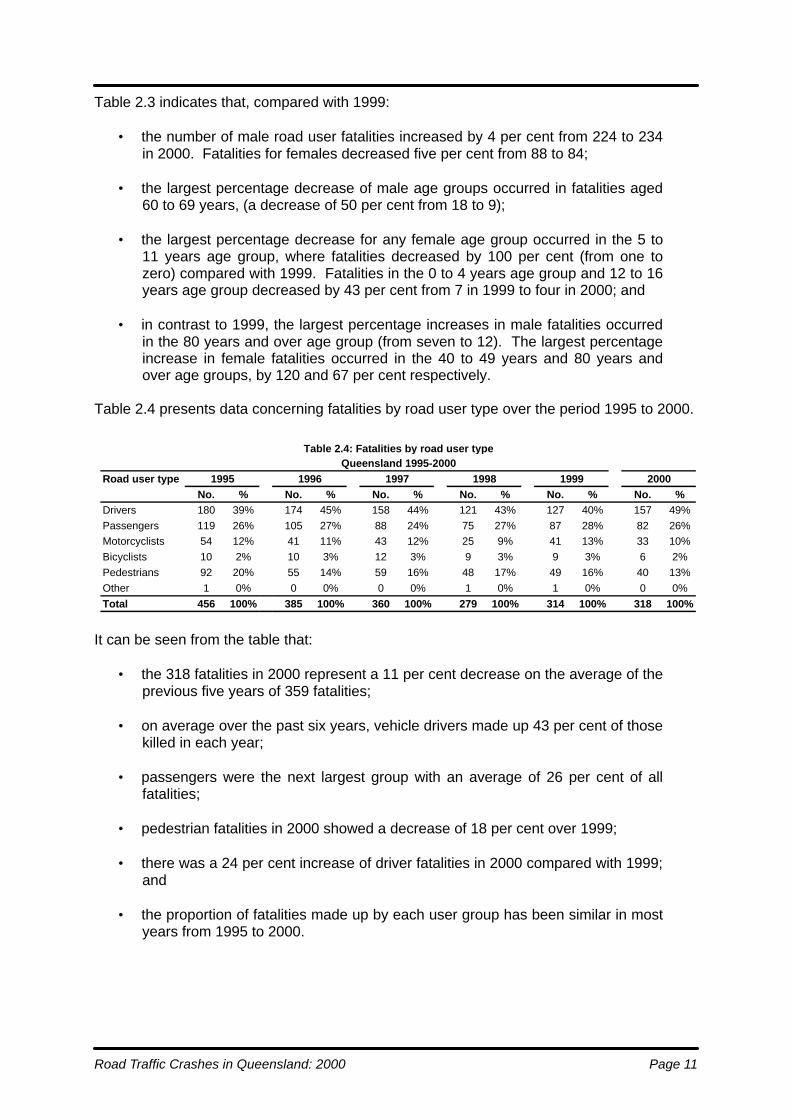
Table 2.4 presents data concerning fatalities by road user type over the period 1995 to 2000.
It can be seen from the table that:
• the 318 fatalities in 2000 represent a 11 per cent decrease on the average of theprevious five years of 359 fatalities;
• on average over the past six years, vehicle drivers made up 43 per cent of thosekilled in each year;
• passengers were the next largest group with an average of 26 per cent of allfatalities;
• pedestrian fatalities in 2000 showed a decrease of 18 per cent over 1999;
• there was a 24 per cent increase of driver fatalities in 2000 compared with 1999;and
• the proportion of fatalities made up by each user group has been similar in mostyears from 1995 to 2000.
Table 2.4: Fatalities by road user typeQueensland 1995-2000
Road user type 1995 1996 1997 1998 1999 2000No. % No. % No. % No. % No. % No. %
Drivers 180 39% 174 45% 158 44% 121 43% 127 40% 157 49%Passengers 119 26% 105 27% 88 24% 75 27% 87 28% 82 26%Motorcyclists 54 12% 41 11% 43 12% 25 9% 41 13% 33 10%Bicyclists 10 2% 10 3% 12 3% 9 3% 9 3% 6 2%Pedestrians 92 20% 55 14% 59 16% 48 17% 49 16% 40 13%Other 1 0% 0 0% 0 0% 1 0% 1 0% 0 0%Total 456 100% 385 100% 360 100% 279 100% 314 100% 318 100%
Page 12 Road Traffic Crashes in Queensland: 2000
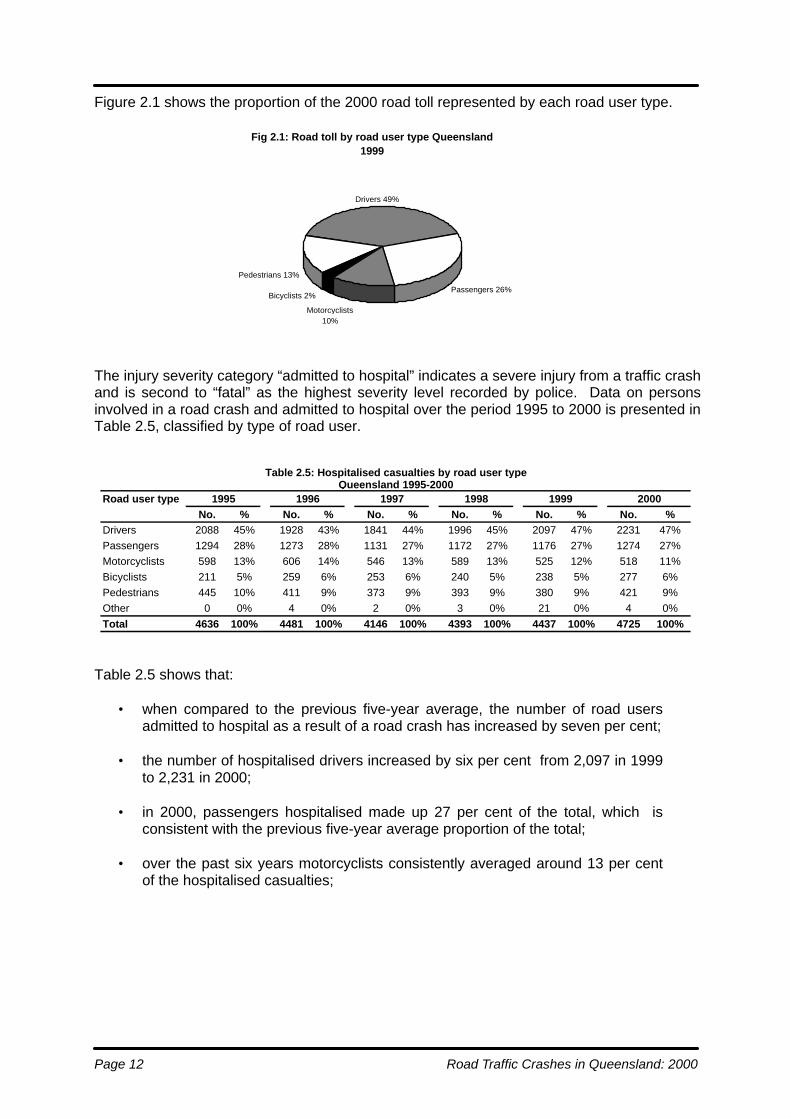
Figure 2.1 shows the proportion of the 2000 road toll represented by each road user type.
The injury severity category “admitted to hospital” indicates a severe injury from a traffic crashand is second to “fatal” as the highest severity level recorded by police. Data on personsinvolved in a road crash and admitted to hospital over the period 1995 to 2000 is presented inTable 2.5, classified by type of road user.
Table 2.5 shows that:
• when compared to the previous five-year average, the number of road usersadmitted to hospital as a result of a road crash has increased by seven per cent;
• the number of hospitalised drivers increased by six per cent from 2,097 in 1999to 2,231 in 2000;
• in 2000, passengers hospitalised made up 27 per cent of the total, which isconsistent with the previous five-year average proportion of the total;
• over the past six years motorcyclists consistently averaged around 13 per centof the hospitalised casualties;
Table 2.5: Hospitalised casualties by road user typeQueensland 1995-2000
Road user type 1995 1996 1997 1998 1999 2000No. % No. % No. % No. % No. % No. %
Drivers 2088 45% 1928 43% 1841 44% 1996 45% 2097 47% 2231 47%Passengers 1294 28% 1273 28% 1131 27% 1172 27% 1176 27% 1274 27%Motorcyclists 598 13% 606 14% 546 13% 589 13% 525 12% 518 11%Bicyclists 211 5% 259 6% 253 6% 240 5% 238 5% 277 6%Pedestrians 445 10% 411 9% 373 9% 393 9% 380 9% 421 9%Other 0 0% 4 0% 2 0% 3 0% 21 0% 4 0%Total 4636 100% 4481 100% 4146 100% 4393 100% 4437 100% 4725 100%
Fig 2.1: Road toll by road user type Queensland 1999
Drivers 49%
Passengers 26%
Pedestrians 13%
Bicyclists 2%
Motorcyclists 10%
Road Traffic Crashes in Queensland: 2000 Page 13
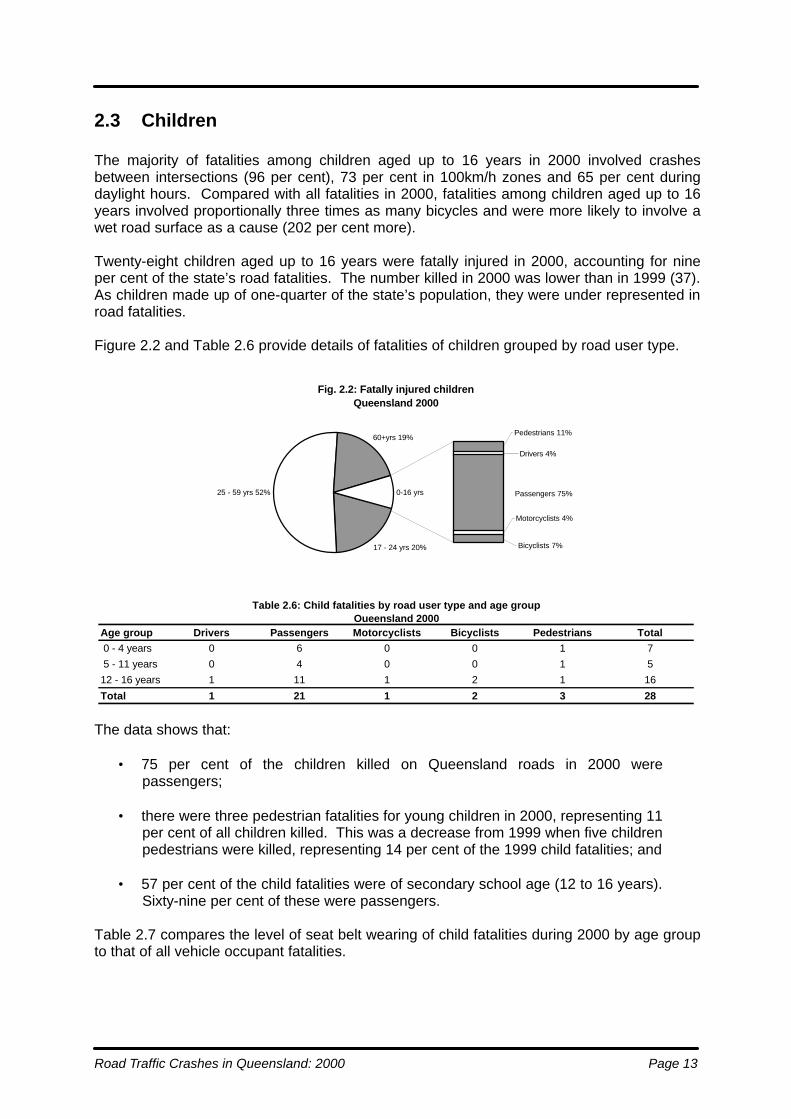
2.3 Children The majority of fatalities among children aged up to 16 years in 2000 involved crashes between intersections (96 per cent), 73 per cent in 100km/h zones and 65 per cent during daylight hours. Compared with all fatalities in 2000, fatalities among children aged up to 16 years involved proportionally three times as many bicycles and were more likely to involve a wet road surface as a cause (202 per cent more). Twenty-eight children aged up to 16 years were fatally injured in 2000, accounting for nine per cent of the state’s road fatalities. The number killed in 2000 was lower than in 1999 (37). As children made up of one-quarter of the state’s population, they were under represented in road fatalities. Figure 2.2 and Table 2.6 provide details of fatalities of children grouped by road user type.
The data shows that:
• 75 per cent of the children killed on Queensland roads in 2000 were passengers;
• there were three pedestrian fatalities for young children in 2000, representing 11
per cent of all children killed. This was a decrease from 1999 when five children pedestrians were killed, representing 14 per cent of the 1999 child fatalities; and
• 57 per cent of the child fatalities were of secondary school age (12 to 16 years).
Sixty-nine per cent of these were passengers. Table 2.7 compares the level of seat belt wearing of child fatalities during 2000 by age group to that of all vehicle occupant fatalities.
Table 2.6: Child fatalities by road user type and age groupQueensland 2000
Age group Drivers Passengers Motorcyclists Bicyclists Pedestrians Total 0 - 4 years 0 6 0 0 1 7
5 - 11 years 0 4 0 0 1 5
12 - 16 years 1 11 1 2 1 16
Total 1 21 1 2 3 28
Fig. 2.2: Fatally injured childrenQueensland 2000
Passengers 75%
17 - 24 yrs 20%
25 - 59 yrs 52%
60+yrs 19%Pedestrians 11%
Bicyclists 7%
Motorcyclists 4%
0-16 yrs
Drivers 4%

Page 14 Road Traffic Crashes in Queensland: 2000
The above data indicates that, in 2000, the proportion of child fatalities unrestrained (50 percent) was above that for all road fatalities unrestrained (34 per cent).
The percentage of unrestrained vehicle occupants (regardless of age) has increased whencompared with 1999 (from 32 per cent to 34 per cent). In 2000, of the 18 child vehicleoccupant fatalities, nine were unrestrained compared with seven in 1999.
Table 2.8 shows the time of day when children were killed on Queensland roads in 2000.
The table shows that:
• 39 per cent of child fatalities in 2000 occurred between 8 am and 4pm;
• four (14 per cent) of the fatally injured children where involved in crashesoccurring between 6pm and midnight; and
• nine (32 per cent) of the child fatalities died as a result of crashes occurringafter dark.
2.4 Young adults
The majority of fatalities among young adults (that is, those aged between 17 and 24 years)in 2000 involved vehicles moving straight ahead (86 per cent) with 78 per cent occurringbetween intersections and 63 per cent during the working week. Seventy per cent of unitsinvolved were cars whilst 56 percent of crashes were single vehicle accidents. Comparedwith all fatalities in 2000, fatalities among young adults occurred proportionally more often atroundabouts (55 per cent more), involving speed (45 per cent more) and occurring after dark(42 per cent more).
In Queensland, road crashes are a major cause of death for young adults (Australian Bureauof Statistics Cat. No. 3303.0). Young adults made up 63 of those killed on Queensland roadsin 2000, this number representing 20 per cent of the year’s total fatalities. This group wasover-represented in road traffic fatalities as it makes up only 13 per cent of the totalpopulation of Queensland.
Table 2.7: Non-seat belt wearing of child vehicle occupant fatalitiesQueensland 2000
Age group Seat belt not Total vehicle Proportion ofworn occupants killed * occupants unrestrained
0 - 4 years 2 6 33% 5 - 11 years 3 4 75%12 - 16 years 4 8 50%Total children 9 18 50%All vehicle occupants 58 173 34%* Where restraint use could be determined
Table 2.8: Child road user fatalities by time of dayQueensland 2000
Age group Midnight 6 am to 8 am to 2 pm to 4 pm to 6 pm toto 6 am 8 am 2 pm 4 pm 6 pm midnight Total
0 - 4 years 1 0 2 0 2 2 7 5 - 11 years 0 2 1 2 0 0 512 - 16 years 4 2 5 1 2 2 16Total Children 5 4 8 3 4 4 28

Road Traffic Crashes in Queensland: 2000 Page 15
The road user type of young adult fatalities is presented in Table 2.9. The table is divided into the two principal age groups; 17 to 20 years and 21 to 24 years.
Table 2.9 indicates that:
• in 2000, 31 young adult fatalities (49 per cent) were aged 17 to 20 years. This is a decrease on the 1999 proportion of 63 per cent;
• 50 of the young adults killed in road crashes (79 per cent) were vehicle
occupants, with the majority of those being drivers; and • pedestrian fatalities, at seven, among young adults have dropped 22 per cent
since 1999. Table 2.10 shows that, where restraint use was known, 27 per cent of young adult vehicle occupant fatalities were unrestrained in 2000. This is an decrease on 1999 when this proportion was 38 per cent, and is below all vehicle occupants fatality rate (34 per cent).
Table 2.11 shows that the alcohol involvement of young adults in fatal crashes was below that for all drivers and riders. In 2000, 24 per cent of young adult fatalities tested for alcohol returned blood alcohol levels of 0.05 per cent or greater, below the figure for all road users (28 per cent).
Table 2.9: Young adult fatalities by road user type and age groupQueensland 2000
Age group Drivers Passengers Motorcyclists Bicyclists Pedestrians Total17 - 20 years 19 6 2 0 4 3121 - 24 years 14 11 4 0 3 32
Total 33 17 6 0 7 63
Table 2.10: Non - seat belt wearing of young adult vehicle occupant fatalitiesQueensland 2000
Age group Seat belt Total vehicle Proportion of vehiclenot worn occupants killed * occupants unrestrained
17 - 20 years 5 20 25%21 - 24 years 4 13 31%
Total young adults 9 33 27%All vehicle occupants 58 173 34%* Where restraint use could be determined
Fig. 2.3: Fatally injured young adultsQueensland 2000
0 - 16 yrs 9%
Drivers 52%
Bicyclists 0%
Passengers 27%25 - 59 yrs 52%
60 + yrs 19%
Motorcyclists 10%Pedestrians 11%
17-24 yrs
Page 16 Road Traffic Crashes in Queensland: 2000
Compared with 1999, proportional alcohol involvement amongst young adults increased by nine per cent in 2000. The total number of young adults with alcohol involvement rose by 14 per cent compared to 1999.
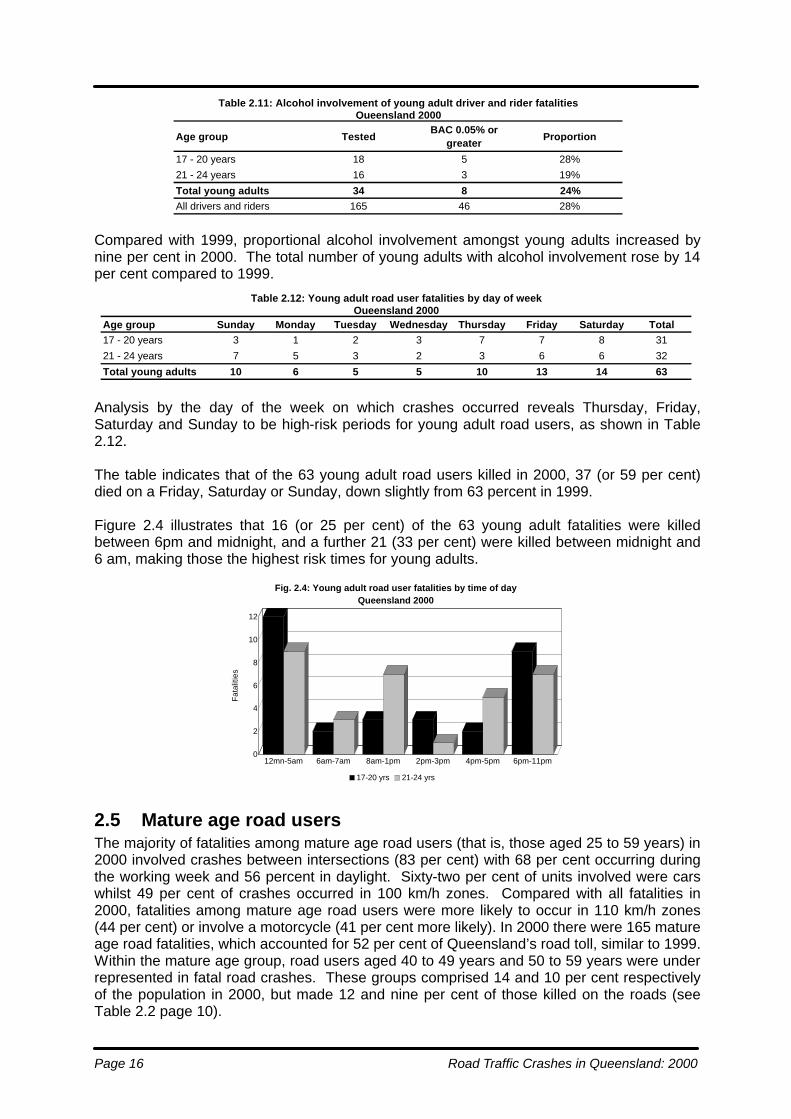
Analysis by the day of the week on which crashes occurred reveals Thursday, Friday, Saturday and Sunday to be high-risk periods for young adult road users, as shown in Table 2.12. The table indicates that of the 63 young adult road users killed in 2000, 37 (or 59 per cent) died on a Friday, Saturday or Sunday, down slightly from 63 percent in 1999. Figure 2.4 illustrates that 16 (or 25 per cent) of the 63 young adult fatalities were killed between 6pm and midnight, and a further 21 (33 per cent) were killed between midnight and 6 am, making those the highest risk times for young adults.
2.5 Mature age road users The majority of fatalities among mature age road users (that is, those aged 25 to 59 years) in 2000 involved crashes between intersections (83 per cent) with 68 per cent occurring during the working week and 56 percent in daylight. Sixty-two per cent of units involved were cars whilst 49 per cent of crashes occurred in 100 km/h zones. Compared with all fatalities in 2000, fatalities among mature age road users were more likely to occur in 110 km/h zones (44 per cent) or involve a motorcycle (41 per cent more likely). In 2000 there were 165 mature age road fatalities, which accounted for 52 per cent of Queensland’s road toll, similar to 1999. Within the mature age group, road users aged 40 to 49 years and 50 to 59 years were under represented in fatal road crashes. These groups comprised 14 and 10 per cent respectively of the population in 2000, but made 12 and nine per cent of those killed on the roads (see Table 2.2 page 10).
Table 2.11: Alcohol involvement of young adult driver and rider fatalitiesQueensland 2000
Age group TestedBAC 0.05% or
greaterProportion
17 - 20 years 18 5 28%
21 - 24 years 16 3 19%
Total young adults 34 8 24%All drivers and riders 165 46 28%
0
2
4
6
8
10
12
Fat
aliti
es
12mn-5am 6am-7am 8am-1pm 2pm-3pm 4pm-5pm 6pm-11pm
Fig. 2.4: Young adult road user fatalities by time of dayQueensland 2000
17-20 yrs 21-24 yrs
Table 2.12: Young adult road user fatalities by day of weekQueensland 2000
Age group Sunday Monday Tuesday Wednesday Thursday Friday Saturday Total17 - 20 years 3 1 2 3 7 7 8 31
21 - 24 years 7 5 3 2 3 6 6 32
Total young adults 10 6 5 5 10 13 14 63

Road Traffic Crashes in Queensland: 2000 Page 17
Mature age road user fatalities in the four main age groups are shown in Table 2.13.
Data presented in Table 2.13 and Figure 2.5 indicate that:
• 73 per cent of the mature age road users killed in 2000 were vehicle occupants; • 98 (59 per cent) of the mature age road users were drivers; and • motorcycle fatalities decreased by 13 per cent from 30 in 1999 to 26 in 2000.
Table 2.14 shows that, where restraint use was known, mature age vehicle occupant fatalities have a failure to wear a seat belt rate of 38 per cent, which is four per cent higher than that for all road users.
The data in Table 2.14 indicate that vehicle occupant fatalities aged 25 to 29 years had the lowest seat belt wearing rates of mature age groups, with 57 per cent unrestrained. Table 2.15 presents data on alcohol involvement of mature age driver and rider fatalities in 2000.
Table 2.13: Mature age road user fatalities by type and age groupQueensland 2000
Age group Drivers Passengers Motorcyclists Bicyclists Pedestrians Total25 - 29 years 24 7 6 1 1 3930 - 39 years 34 7 13 1 4 5940 - 49 years 20 6 5 1 6 3850 - 59 years 20 2 2 1 4 29
Total 98 22 26 4 15 165
Table 2.14: Non-seat belt wearing of mature age vehicle occupant fatalitiesQueensland 2000
Age group Seat belt not Total vehicle Proportion ofworn occupants killed * occupants unrestrained
25 - 29 years 12 21 57%30 - 39 years 12 30 40%40 - 49 years 6 19 32%
50 - 59 years 4 20 20%
Total mature age 34 90 38%All vehicle occupants 58 173 34%
* Where restraint use could be determined
Fig. 2.5: Mature age road user fatalitiesQueensland 2000
0 - 16 yrs 9%
17 - 24 yrs 20%
60 + yrs 19%
Passengers 13%
Motorcyclists 16%
Pedestrians 9%
Drivers 59%
Bicyclists 2%
25-59 yrs
Page 18 Road Traffic Crashes in Queensland: 2000
The table shows that:
• compared with 1999, proportional alcohol involvement amongst mature adults showed an increase;
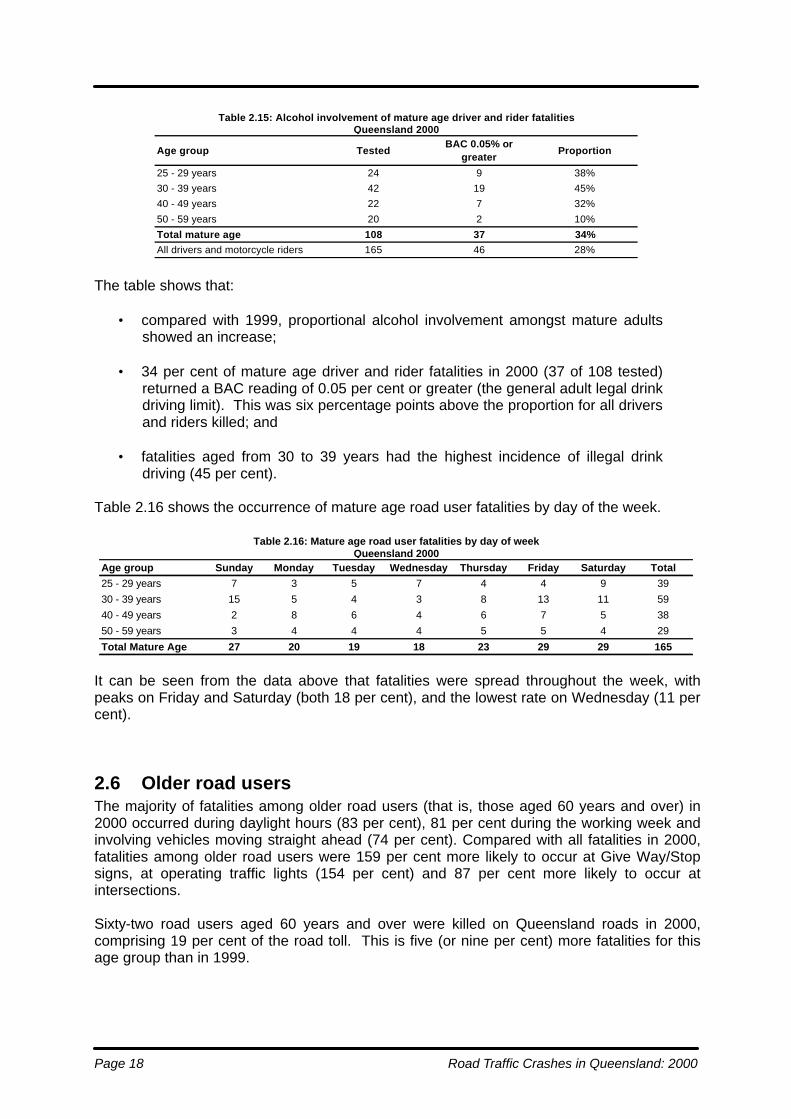
• 34 per cent of mature age driver and rider fatalities in 2000 (37 of 108 tested)
returned a BAC reading of 0.05 per cent or greater (the general adult legal drink driving limit). This was six percentage points above the proportion for all drivers and riders killed; and
• fatalities aged from 30 to 39 years had the highest incidence of illegal drink
driving (45 per cent). Table 2.16 shows the occurrence of mature age road user fatalities by day of the week.
It can be seen from the data above that fatalities were spread throughout the week, with peaks on Friday and Saturday (both 18 per cent), and the lowest rate on Wednesday (11 per cent).
2.6 Older road users The majority of fatalities among older road users (that is, those aged 60 years and over) in 2000 occurred during daylight hours (83 per cent), 81 per cent during the working week and involving vehicles moving straight ahead (74 per cent). Compared with all fatalities in 2000, fatalities among older road users were 159 per cent more likely to occur at Give Way/Stop signs, at operating traffic lights (154 per cent) and 87 per cent more likely to occur at intersections. Sixty-two road users aged 60 years and over were killed on Queensland roads in 2000, comprising 19 per cent of the road toll. This is five (or nine per cent) more fatalities for this age group than in 1999.
Table 2.16: Mature age road user fatalities by day of weekQueensland 2000
Age group Sunday Monday Tuesday Wednesday Thursday Friday Saturday Total25 - 29 years 7 3 5 7 4 4 9 3930 - 39 years 15 5 4 3 8 13 11 5940 - 49 years 2 8 6 4 6 7 5 3850 - 59 years 3 4 4 4 5 5 4 29
Total Mature Age 27 20 19 18 23 29 29 165
Table 2.15: Alcohol involvement of mature age driver and rider fatalitiesQueensland 2000
Age group TestedBAC 0.05% or
greaterProportion
25 - 29 years 24 9 38%30 - 39 years 42 19 45%40 - 49 years 22 7 32%
50 - 59 years 20 2 10%
Total mature age 108 37 34%All drivers and motorcycle riders 165 46 28%
Road Traffic Crashes in Queensland: 2000 Page 19
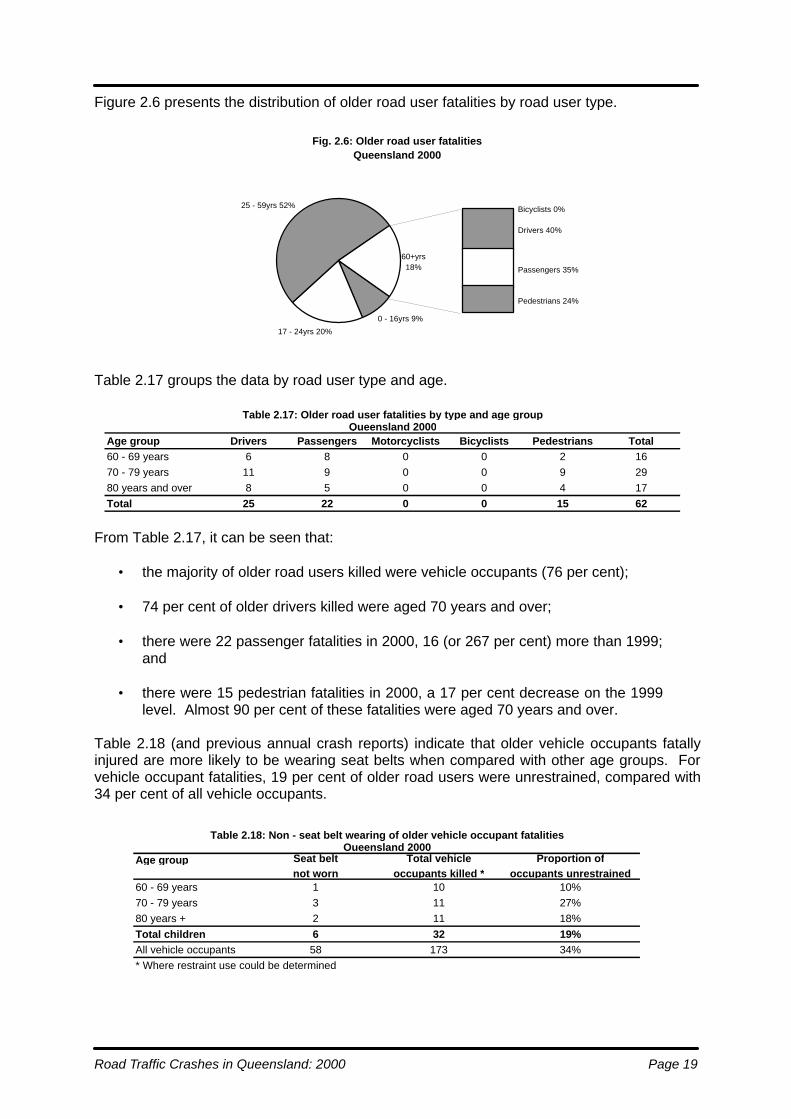
Figure 2.6 presents the distribution of older road user fatalities by road user type.
Table 2.17 groups the data by road user type and age.
From Table 2.17, it can be seen that:
• the majority of older road users killed were vehicle occupants (76 per cent);
• 74 per cent of older drivers killed were aged 70 years and over;
• there were 22 passenger fatalities in 2000, 16 (or 267 per cent) more than 1999;and
• there were 15 pedestrian fatalities in 2000, a 17 per cent decrease on the 1999level. Almost 90 per cent of these fatalities were aged 70 years and over.
Table 2.18 (and previous annual crash reports) indicate that older vehicle occupants fatallyinjured are more likely to be wearing seat belts when compared with other age groups. Forvehicle occupant fatalities, 19 per cent of older road users were unrestrained, compared with34 per cent of all vehicle occupants.
Table 2.17: Older road user fatalities by type and age groupQueensland 2000
Age group Drivers Passengers Motorcyclists Bicyclists Pedestrians Total60 - 69 years 6 8 0 0 2 1670 - 79 years 11 9 0 0 9 2980 years and over 8 5 0 0 4 17Total 25 22 0 0 15 62
Table 2.18: Non - seat belt wearing of older vehicle occupant fatalitiesQueensland 2000
Age group Seat belt Total vehicle Proportion ofnot worn occupants killed * occupants unrestrained
60 - 69 years 1 10 10%70 - 79 years 3 11 27%80 years + 2 11 18%Total children 6 32 19%All vehicle occupants 58 173 34%* Where restraint use could be determined
Fig. 2.6: Older road user fatalitiesQueensland 2000
0 - 16yrs 9%
17 - 24yrs 20%
25 - 59yrs 52% Bicyclists 0%
Drivers 40%
Passengers 35%
Pedestrians 24%
60+yrs18%

Page 20 Road Traffic Crashes in Queensland: 2000
Table 2.19 provides details of responsibility for fatal crashes involving older road users, as indicated by the reporting police officer.
Table 2.19 shows that:
• older drivers were believed to be responsible for 67 per cent of fatal crashes in which they were involved in 2000 in contrast to drivers generally, who were believed to be responsible for 58 per cent of fatal crashes in which they were involved. This remained constant for the older drivers also at 67 per cent in 1999;
• this allocated responsibility for drivers increases with age from 47 per cent in the
60 to 69 years group, to 82 per cent for the 80 years and over group; and • older pedestrians were believed to be responsible for 59 per cent of fatal
crashes in which they were involved in 2000. This is lower than the proportion of pedestrians responsible for fatal crashes across all age groups (75 per cent).
Table 2.20 shows the daily time periods during which fatal crashes involved older road users occurred in 2000.
The data show that:
• 73 per cent of older road user fatalities (45 out of 62) occurred between 8.00am and 6.00pm;
• 29 per cent of the older road user fatalities (18) occurred between 12.00pm and
4.00pm; and • 19 per cent of the older road user fatalities (12) occurred between 6.00pm and
6.00am.
Table 2.19: Responsibility for fatal crashes involving older drivers or pedestriansQueensland 2000
Drivers PedestriansAge group Responsible Total % Responsible Total %60 - 69 years 9 19 47% 1 2 50%70 - 79 years 16 21 76% 6 11 55%80 years and over 9 11 82% 3 4 75%
Total older age group 34 51 67% 10 17 59%All age groups 215 372 58% 36 48 75%
Table 2.20: Older road user fatalities by time of dayQueensland 2000
Age group6am - 8am
8am - 10am
10am - 12 noon
12 noon - 2pm
2pm - 4pm
4pm - 6pm
6pm - 6am
Total
60 - 69 years 2 3 2 1 3 2 3 16
70 - 79 years 1 4 4 6 3 5 6 2980 years and over 2 2 2 3 2 3 3 17
Total older age group 5 9 8 10 8 10 12 62
Road Traffic Crashes in Queensland: 2000 Page 21
3. UNITS IN CRASHES
3.1 Introduction
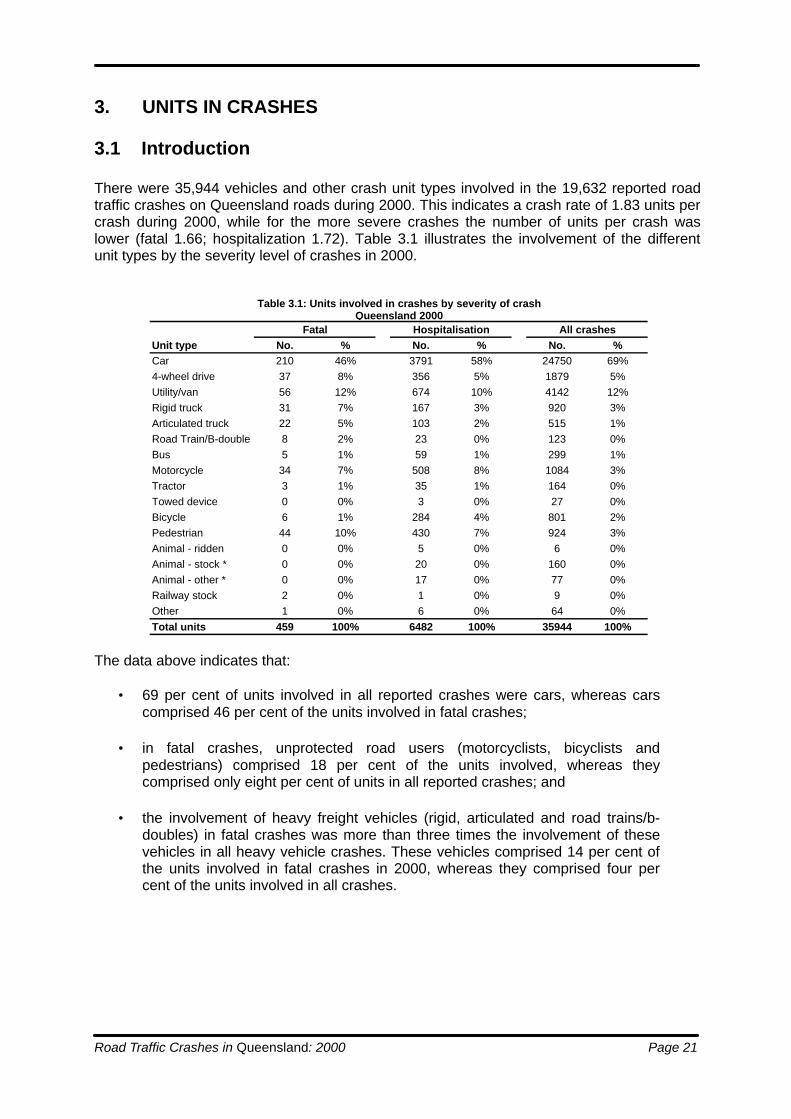
There were 35,944 vehicles and other crash unit types involved in the 19,632 reported roadtraffic crashes on Queensland roads during 2000. This indicates a crash rate of 1.83 units percrash during 2000, while for the more severe crashes the number of units per crash waslower (fatal 1.66; hospitalization 1.72). Table 3.1 illustrates the involvement of the differentunit types by the severity level of crashes in 2000.
The data above indicates that:
• 69 per cent of units involved in all reported crashes were cars, whereas carscomprised 46 per cent of the units involved in fatal crashes;
• in fatal crashes, unprotected road users (motorcyclists, bicyclists andpedestrians) comprised 18 per cent of the units involved, whereas theycomprised only eight per cent of units in all reported crashes; and
• the involvement of heavy freight vehicles (rigid, articulated and road trains/b-doubles) in fatal crashes was more than three times the involvement of thesevehicles in all heavy vehicle crashes. These vehicles comprised 14 per cent ofthe units involved in fatal crashes in 2000, whereas they comprised four percent of the units involved in all crashes.
Table 3.1: Units involved in crashes by severity of crashQueensland 2000
Fatal Hospitalisation All crashesUnit type No. % No. % No. %Car 210 46% 3791 58% 24750 69%4-wheel drive 37 8% 356 5% 1879 5%Utility/van 56 12% 674 10% 4142 12%Rigid truck 31 7% 167 3% 920 3%Articulated truck 22 5% 103 2% 515 1%Road Train/B-double 8 2% 23 0% 123 0%Bus 5 1% 59 1% 299 1%Motorcycle 34 7% 508 8% 1084 3%Tractor 3 1% 35 1% 164 0%Towed device 0 0% 3 0% 27 0%Bicycle 6 1% 284 4% 801 2%Pedestrian 44 10% 430 7% 924 3%Animal - ridden 0 0% 5 0% 6 0%Animal - stock * 0 0% 20 0% 160 0%Animal - other * 0 0% 17 0% 77 0%Railway stock 2 0% 1 0% 9 0%Other 1 0% 6 0% 64 0%Total units 459 100% 6482 100% 35944 100%
Page 22 Road Traffic Crashes in Queensland: 2000
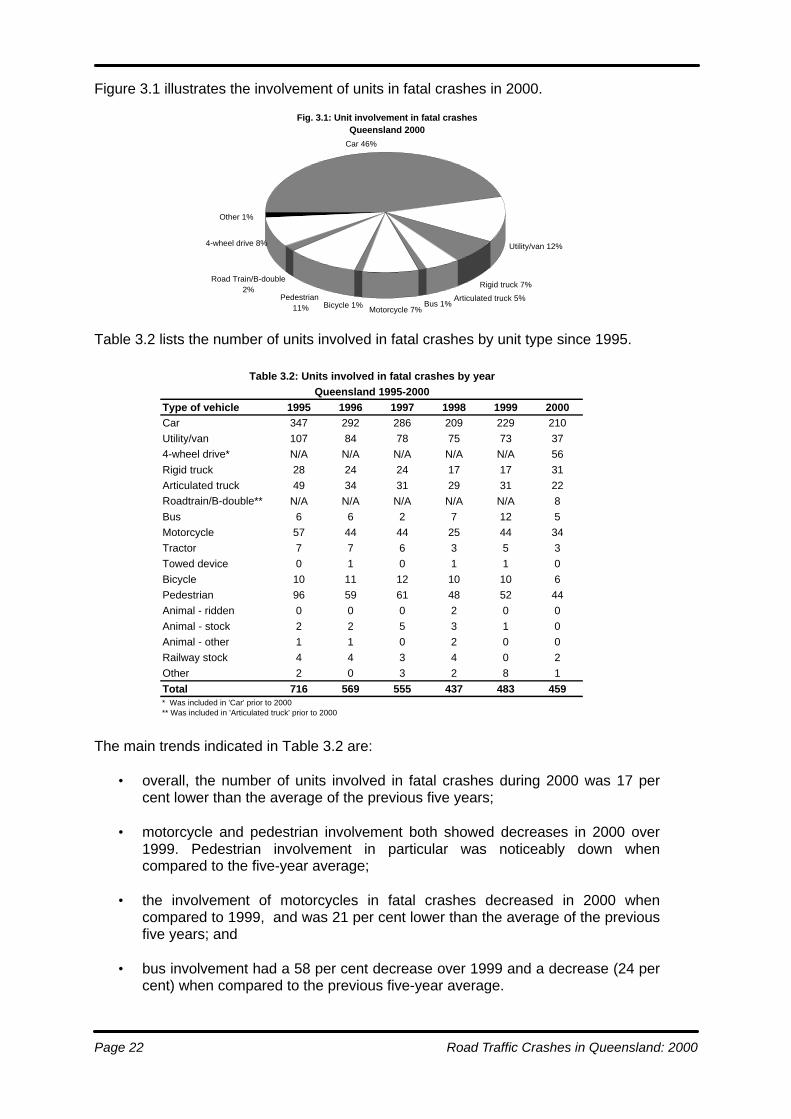
Figure 3.1 illustrates the involvement of units in fatal crashes in 2000.
Table 3.2 lists the number of units involved in fatal crashes by unit type since 1995.
The main trends indicated in Table 3.2 are:
• overall, the number of units involved in fatal crashes during 2000 was 17 percent lower than the average of the previous five years;
• motorcycle and pedestrian involvement both showed decreases in 2000 over1999. Pedestrian involvement in particular was noticeably down whencompared to the five-year average;
• the involvement of motorcycles in fatal crashes decreased in 2000 whencompared to 1999, and was 21 per cent lower than the average of the previousfive years; and
• bus involvement had a 58 per cent decrease over 1999 and a decrease (24 percent) when compared to the previous five-year average.
Fig. 3.1: Unit involvement in fatal crashesQueensland 2000
4-wheel drive 8%
Other 1%
Motorcycle 7%Bicycle 1% Bus 1%Pedestrian
11%
Road Train/B-double 2%
Rigid truck 7%
Articulated truck 5%
Utility/van 12%
Car 46%
Table 3.2: Units involved in fatal crashes by yearQueensland 1995-2000
Type of vehicle 1995 1996 1997 1998 1999 2000Car 347 292 286 209 229 210Utility/van 107 84 78 75 73 374-wheel drive* N/A N/A N/A N/A N/A 56Rigid truck 28 24 24 17 17 31Articulated truck 49 34 31 29 31 22Roadtrain/B-double** N/A N/A N/A N/A N/A 8Bus 6 6 2 7 12 5Motorcycle 57 44 44 25 44 34Tractor 7 7 6 3 5 3Towed device 0 1 0 1 1 0Bicycle 10 11 12 10 10 6Pedestrian 96 59 61 48 52 44Animal - ridden 0 0 0 2 0 0Animal - stock 2 2 5 3 1 0Animal - other 1 1 0 2 0 0Railway stock 4 4 3 4 0 2Other 2 0 3 2 8 1Total 716 569 555 437 483 459* Was included in 'Car' prior to 2000** Was included in 'Articulated truck' prior to 2000

Road Traffic Crashes in Queensland: 2000 Page 23
The trend of the involvement of the major vehicle types in fatal crashes since 1986 isillustrated in Figure 3.2.
Figure 3.2 highlights the general downward trend of all units involved in fatal crashes from1988 until 1999. In 2000, rigid truck involvement increased markedly but all other units showa decrease over 1999 levels.
3.2 Fatal crash involvement by unit type
Cars and variants
Fatal crash involvement of cars, utilities and panel vans have shown decreases in 2000 overthe previous nine year averages, of 16 per cent and 32 per cent respectively (see Table 3.3).The majority of these crashes in 2000 involved vehicles between intersections (77 per cent),with 69 per cent occurring during the working week, 60 per cent in daylight and 55 percent onstraight roads. Compared with all fatal crashes in 2000, fatal crashes involving cars occurredin similar proportions for all descriptors.
During 2000, 303 cars (including utilities, panel vans and 4-wheel drives) were involved infatal crashes. Of the 303 cars, 194 (or 64 per cent) were considered “most at fault” byinvestigating police. Of the fatal crashes in which a car was considered most at fault, morethan half (106 crashes) were single vehicle crashes. Overall, cars were considered the unitmost at fault in 70 per cent of all fatal crashes.
An analysis of the relative involvement in fatal crashes of all types of cars in 2000 is providedin Table 3.4.
Fig. 3.2: Unit involvement trend for fatal crashesQueensland 1986 - 2000
0
0.5
1
1.5
2
1986
1987
1988
1989
1980
1991
1992
1993
1994
1995
1996
1997
1998
1999
2000
Inde
x 10
0 =
1986
Car Motorcycle Rigid truck
Pedestrian Artic. truck Bicycle
Table 3.4: Comparison of fatal crash involvement for cars and variantsQueensland 2000
% of units in fatal % of total vehicle Fatal crashVehicle type crashes registrations rate/10,000 vehicles
Car/Station wagon 46% 73% 1.2
Utility/van 8% 17% 1.3
Total cars 54% 91% 1.2
Table 3.3: Annual trends in fatal crash involvement of cars and variants
Queensland 1991-2000
1991 1992 1993 1994 1995 1996 1997 1998 1999 2000
Car 325 310 313 335 347 292 286 209 229 210
Utility/van 75 89 72 85 107 84 78 75 73 56
4-wheel drive N/A N/A N/A N/A N/A N/A N/A N/A N/A 37

Page 24 Road Traffic Crashes in Queensland: 2000
Heavy freight vehicles
Fatal crash involvement of heavy vehicles showed a significant increase in 2000. Overall, theinvolvement of rigid and articulated trucks showed a slight increase in 2000 over the previousnine-year average (up by 40 per cent and down by 36 per cent respectively) (see Table 3.5).The majority of these crashes occurred between intersections (90 per cent) and during theworking week (74 per cent), with 67 per cent during daylight and 54 per cent on straightroads. Twenty-eight per cent of these crashes occurred within the Southern region.Compared with all fatal crashes in 2000, fatal crashes involving heavy vehicles were morelikely to involve fatigue (66 per cent more) and occur less often at operating traffic lights (74per cent less often).
During 2000, 61 heavy freight vehicles (rigid and articulated trucks and road trains/bdoubles)were involved in fatal crashes. Of the 61 heavy freight vehicles, 16 (or 26 per cent) wereconsidered most at fault by investigating police. Of those fatal crashes in which a heavyfreight vehicle was considered most at fault, 63 per cent were single vehicle crashes. Overall,heavy freight vehicles were considered the unit most at fault in only six per cent of all fatalcrashes. An analysis of the relative involvement in fatal crashes in 2000 of heavy freightvehicles compared with cars is provided in Table 3.6.
The data indicates that in 2000 articulated trucks had a fatal crash rate per 10,000 registeredvehicles of almost 15 times that for cars. Articulated trucks were involved in 17.5 fatalcrashes per 10,000 trucks on register in 2000. The figure for cars was 1.2 fatal crashes per10,000 cars registered. Rigid trucks had a total crash rate of 3.3 times that for cars.
Buses
Fatal crash involvement of buses has shown a relatively flat trend over the past ten yearsapart from peaks in 1991 and 1999 (see Table 3.7). Bus crashes in 2000 resulted in two busoccupants killed. The majority of fatal crashes involving buses in 2000 occurred during theworking week (80 per cent), in daylight (60 per cent) and on straight roads (60 per cent).
During 2000, 5 buses were involved in fatal crashes on Queensland roads. In three of thesecrashes, the bus was considered most at fault by investigating police, and two bus occupantswas killed in those crashes. A comparison of the relative fatal crash involvement per 10,000
Table 3.5: Annual trends in fatal crash involvement of heavy vehiclesQueensland 1991-2000
1991 1992 1993 1994 1995 1996 1997 1998 1999 2000
Rigid Truck 38 38 34 31 28 24 24 17 17 31
Articulated Truck 24 34 41 38 49 34 31 29 31 22
Road train/Bdouble N/A N/A N/A N/A N/A N/A N/A N/A N/A 8
Table 3.7: Annual trends in fatal crash involvement of busesQueensland 1991-2000
1991 1992 1993 1994 1995 1996 1997 1998 1999 2000
Bus 12 4 7 7 6 6 2 7 12 5
Table 3.6: Comparison of fatal crash involvement for cars and heavy freight vehiclesQueensland 2000
% of units in fatal % of total vehicle Fatal crashVehicle type crashes registrations rate/10,000 vehicles
Total cars 58% 91% 1.2
Rigid trucks 7% 3% 4.0
Articulated trucks 5% 1% 17.5
Road Traffic Crashes in Queensland: 2000 Page 25
vehicles on register of buses compared with cars indicates a fatal crash rate for buses ofover twice that of cars for 2000. Table 3.8 presents this comparison.
Motorcycles
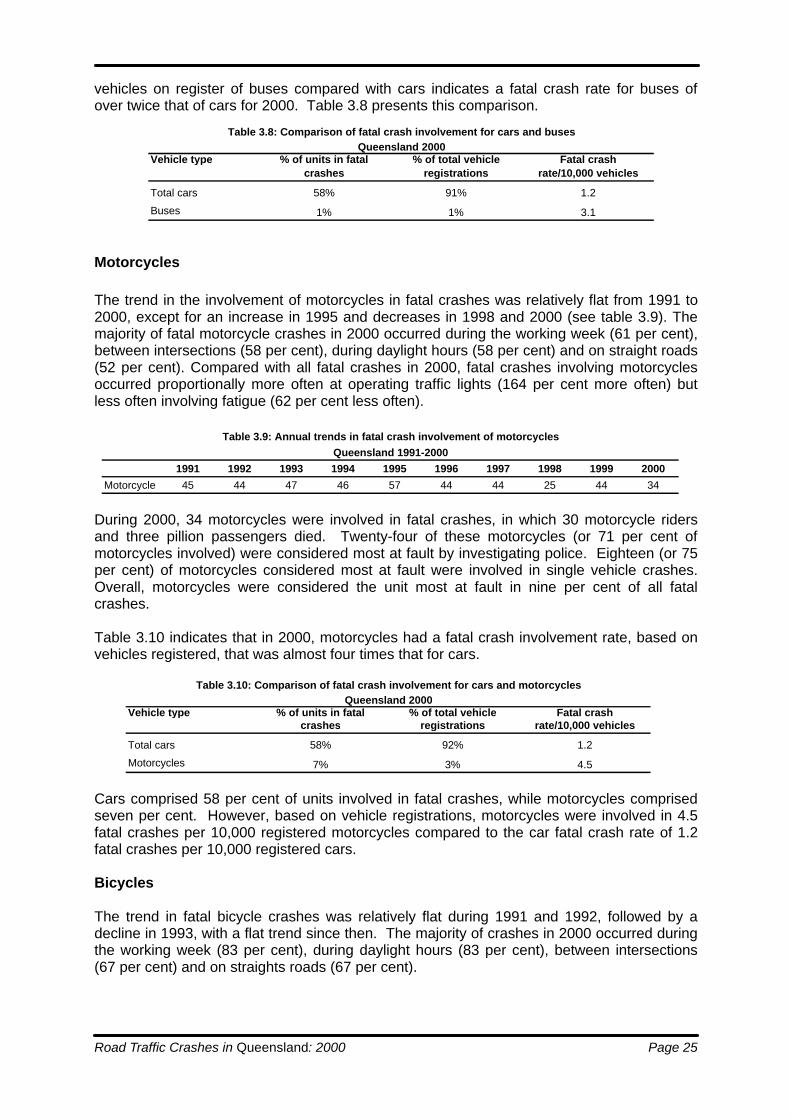
The trend in the involvement of motorcycles in fatal crashes was relatively flat from 1991 to2000, except for an increase in 1995 and decreases in 1998 and 2000 (see table 3.9). Themajority of fatal motorcycle crashes in 2000 occurred during the working week (61 per cent),between intersections (58 per cent), during daylight hours (58 per cent) and on straight roads(52 per cent). Compared with all fatal crashes in 2000, fatal crashes involving motorcyclesoccurred proportionally more often at operating traffic lights (164 per cent more often) butless often involving fatigue (62 per cent less often).
During 2000, 34 motorcycles were involved in fatal crashes, in which 30 motorcycle ridersand three pillion passengers died. Twenty-four of these motorcycles (or 71 per cent ofmotorcycles involved) were considered most at fault by investigating police. Eighteen (or 75per cent) of motorcycles considered most at fault were involved in single vehicle crashes.Overall, motorcycles were considered the unit most at fault in nine per cent of all fatalcrashes.
Table 3.10 indicates that in 2000, motorcycles had a fatal crash involvement rate, based onvehicles registered, that was almost four times that for cars.
Cars comprised 58 per cent of units involved in fatal crashes, while motorcycles comprisedseven per cent. However, based on vehicle registrations, motorcycles were involved in 4.5fatal crashes per 10,000 registered motorcycles compared to the car fatal crash rate of 1.2fatal crashes per 10,000 registered cars.
Bicycles
The trend in fatal bicycle crashes was relatively flat during 1991 and 1992, followed by adecline in 1993, with a flat trend since then. The majority of crashes in 2000 occurred duringthe working week (83 per cent), during daylight hours (83 per cent), between intersections(67 per cent) and on straights roads (67 per cent).
Table 3.9: Annual trends in fatal crash involvement of motorcyclesQueensland 1991-2000
1991 1992 1993 1994 1995 1996 1997 1998 1999 2000
Motorcycle 45 44 47 46 57 44 44 25 44 34
Table 3.10: Comparison of fatal crash involvement for cars and motorcyclesQueensland 2000
Vehicle type % of units in fatal % of total vehicle Fatal crashcrashes registrations rate/10,000 vehicles
Total cars 58% 92% 1.2
Motorcycles 7% 3% 4.5
Table 3.8: Comparison of fatal crash involvement for cars and busesQueensland 2000
Vehicle type % of units in fatal % of total vehicle Fatal crashcrashes registrations rate/10,000 vehicles
Total cars 58% 91% 1.2
Buses 1% 1% 3.1
Page 26 Road Traffic Crashes in Queensland: 2000
In 2000, six bicycles were involved in fatal crashes on Queensland roads. In five of these fatal crashes (or 83 per cent), the cyclist was considered most at fault. Overall, bicycles were considered the unit most at fault in one per cent of all fatal crashes.
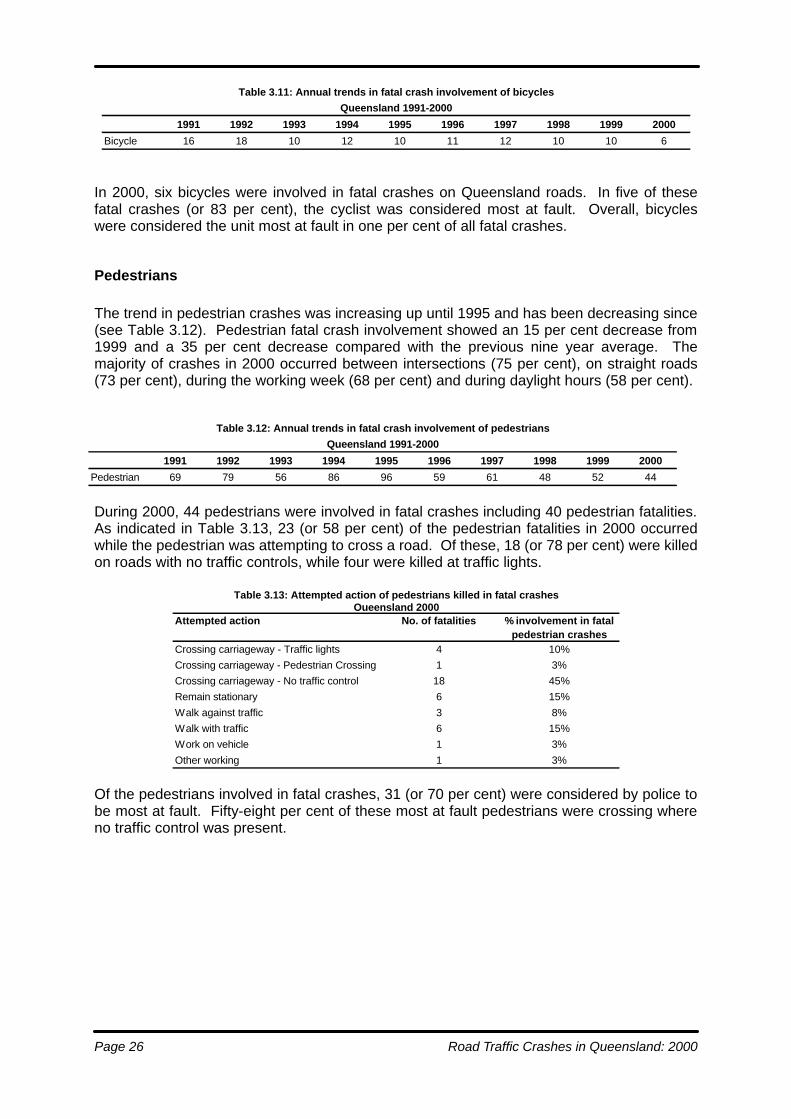
Pedestrians The trend in pedestrian crashes was increasing up until 1995 and has been decreasing since (see Table 3.12). Pedestrian fatal crash involvement showed an 15 per cent decrease from 1999 and a 35 per cent decrease compared with the previous nine year average. The majority of crashes in 2000 occurred between intersections (75 per cent), on straight roads (73 per cent), during the working week (68 per cent) and during daylight hours (58 per cent).
During 2000, 44 pedestrians were involved in fatal crashes including 40 pedestrian fatalities. As indicated in Table 3.13, 23 (or 58 per cent) of the pedestrian fatalities in 2000 occurred while the pedestrian was attempting to cross a road. Of these, 18 (or 78 per cent) were killed on roads with no traffic controls, while four were killed at traffic lights.
Of the pedestrians involved in fatal crashes, 31 (or 70 per cent) were considered by police to be most at fault. Fifty-eight per cent of these most at fault pedestrians were crossing where no traffic control was present.
Table 3.11: Annual trends in fatal crash involvement of bicyclesQueensland 1991-2000
1991 1992 1993 1994 1995 1996 1997 1998 1999 2000
Bicycle 16 18 10 12 10 11 12 10 10 6
Table 3.12: Annual trends in fatal crash involvement of pedestrians
Queensland 1991-2000
1991 1992 1993 1994 1995 1996 1997 1998 1999 2000
Pedestrian 69 79 56 86 96 59 61 48 52 44
Table 3.13: Attempted action of pedestrians killed in fatal crashesQueensland 2000
Attempted action No. of fatalities % involvement in fatalpedestrian crashes
Crossing carriageway - Traffic lights 4 10%Crossing carriageway - Pedestrian Crossing 1 3%Crossing carriageway - No traffic control 18 45%Remain stationary 6 15%
Walk against traffic 3 8%Walk with traffic 6 15%Work on vehicle 1 3%
Other working 1 3%

Road Traffic Crashes in Queensland: 2000 Page 27
4. CHARACTERISTICS OF CRASHES
4.1 Introduction Of the 19,632 road crashes reported in Queensland in 2000, by far the majority (12,980 or 66 per cent) were multi-vehicle crashes. Single vehicle crashes made up 6652 crashes, or 34 per cent of all crashes in 2000.
4.2 Comparative trends The long-term trends in the nature of fatal crashes are shown in Table 4.1. This table shows that, while there have been no dramatic changes in these trends over the past ten years, hit pedestrian and rear-end crashes showed decreases in 2000. Compared to 1999, overturned has recorded a significant increase of 48 per cent during 2000 in contrast to sideswipe fatal crashes with a decrease of 32 per cent.
Figure 4.1 illustrates the proportion of each of the major road crash types for 2000.
The relative occurrence of single vehicle crashes increases as the crash severity increases. Of the 276 fatal crashes in 2000, 137 crashes (or 50 per cent) were single vehicle crashes, while multi-vehicle crashes accounted for 100 crashes (or 36 per cent).
Fig. 4.1: Type of road crashesQueensland 2000
Multi vehicle 59.9% Pedestrian
4.3%
Single vehicle 33.9%
Other 1.9%
Table 4.1: Annual trends in the nature of fatal crashes:Queensland 1991-2000
1991 1992 1993 1994 1995 1996 1997 1998 1999 2000
Hit object 85 82 101 93 105 93 95 80 65 79
Hit pedestrian 63 73 44 73 88 55 55 46 47 38
Head-on 53 67 55 62 70 46 48 23 47 47
Angle 69 53 71 60 50 60 54 44 36 34
Overturned 46 39 53 35 47 45 25 24 27 40
Rear-end 15 17 7 11 16 10 8 8 12 6
Fall from vehicle 8 20 9 10 11 13 11 8 12 12
Sideswipe 15 9 7 10 10 9 16 11 19 13
Hit parked vehicle 1 1 2 6 7 4 3 6 5 6
Hit animal 3 2 7 4 3 3 5 6 1 0
Other 1 0 1 4 1 0 1 1 2 1
* Vehicle includes motor or pedal cycle

Page 28 Road Traffic Crashes in Queensland: 2000
Figure 4.2 shows how the nature of crashes changed in relation to the severity of the crash.
Table 4.2 provides a more detailed analysis of the nature of crashes in Queensland in 2000 grouped by the severity of crash.
Table 4.2 indicates that in 2000:
• 79 fatal crashes (or 29 per cent of all fatal crashes) occurred as the result of a vehicle hitting an object, whilst 22 per cent of all crashes were of this nature;
• vehicles involved in head-on crashes (47 fatal crashes or 17 per cent of fatal
crashes), and vehicles hitting a pedestrian (38 fatal crashes or 14 per cent of fatal crashes) were also markedly over-represented in fatal crashes compared with all reported crashes;
• the majority of hospitalisation crashes resulted from vehicles colliding at
intersections, i.e. angle crashes (29 per cent), or colliding with an object, e.g. trees or power poles (24 per cent); and
• intersection collisions and rear end crashes, both multi-vehicle type crashes,
made up over half (53 per cent) of all reported crashes.
0
10
20
30
40
50
60
70
80
Per
cent
of r
epor
t cra
shes
Fatal Hospitalised Med. treatment Minor Injury Prop. damage
Fig. 4.2: Type of road crash by severityQueensland 2000
Single vehicle Multi vehicle
Table 4.2: Crashes by nature of crash and severityQueensland 2000
Fatal Hospitalisation All crashes**
Nature of crash No. % No. % No. %Hit object 79 29% 905 24% 4287 22%Head-on 47 17% 138 4% 413 2%
Overturned 40 14% 384 10% 1343 7%
Hit pedestrian 38 14% 396 11% 848 4%Angle 34 12% 1110 29% 6284 32%
Sideswipe 13 5% 160 4% 953 5%
Fall from vehicle * 12 4% 142 4% 297 2%Hit parked vehicle 6 2% 92 2% 725 4%
Rear-end 6 2% 376 10% 4114 21%Other 1 0% 25 1% 131 1%
Hit animal 0 0% 39 1% 237 1%
Total 276 100% 3767 100% 19632 100%* Vehicle includes motor or pedal cycle ** Including casualty and property damage only

Road Traffic Crashes in Queensland: 2000 Page 29
4.3 Multi-vehicle crashes The trend in fatal multi-vehicle crashes has been relatively stable over the period 1995 to 2000 and, in line with fatal crashes overall, numbers of fatal multi-vehicle crashes have trended downwards from 1995 to 2000. The majority of these crashes in 2000 occurred between Monday and Friday (77 per cent), in daylight (76 per cent) and at non-intersections (67 per cent). Compared with all fatal crashes in 2000, fatal multi-vehicle crashes occurred proportionally more often at Give Way/Stop signs (122 per cent more often), at operating traffic lights (74 per cent more often) and were 66 per cent more likely to result from disobeying traffic rules. Similarly, multi-vehicle fatal crashes were 76 per cent less likely to involve speed and 62 per cent less likely to involve fatigue. In 2000, 100 fatal multi-vehicle crashes were reported. This figure is 16 per cent below the average for the last five years. Table 4.3 presents multi-vehicle fatal crash data for 1995 to 2000 by the nature of the crash.
Table 4.3 indicates that:
• angle crashes represented 34 per cent of fatal multi-vehicle crashes in 2000, which is less than the 1995 to 1999 average of 42 per cent;
• head-on crashes represented 47 per cent of fatal multi-vehicle crashes in
2000 which is above the 1995 to 1999 average of 39 per cent; and • rear-end crashes contributed a slightly lower proportion of fatal multi-vehicle
crashes (six per cent), compared with the previous five-year average (nine per cent), whereas sideswipe crashes are 19 per cent above the previous five-year average.
Multi-vehicle crashes in which at least one road user was hospitalised but no road user was killed totalled 1784 in 2000. This figure is an increase on the 1999 total (1688) and 120 above the average of the 1995 to 1999 period. Table 4.4 presents multi-vehicle crash data involving hospitalisation for 1995 to 2000 by the nature of the crash.
Table 4.3: Multi-vehicle fatal crashes by nature of crashQueensland 1995-2000
Nature of crash 1995 1996 1997 1998 1999 2000No. % No. % No. % No. % No. % No. %
Angle 50 34% 60 48% 54 43% 44 51% 36 32% 34 34%Head-on 70 48% 46 37% 48 38% 23 27% 47 41% 47 47%Rear-end 16 11% 10 8% 8 6% 8 9% 12 11% 6 6%Sideswipe 10 7% 9 7% 16 13% 11 13% 19 17% 13 13%
Total 146 100% 125 100% 126 100% 86 100% 114 100% 100 100%
Table 4.4: Multi-vehicle crashes involving hospitalisation by nature of crashQueensland 1995-2000
Nature of crash 1995 1996 1997 1998 1999 2000No. % No. % No. % No. % No. % No. %
Angle 1043 60% 1035 61% 976 63% 997 61% 1020 60% 1110 62%Head-on 229 13% 224 13% 165 11% 177 11% 163 10% 138 8%Rear-end 293 17% 297 17% 279 18% 325 20% 361 21% 376 21%Sideswipe 161 9% 146 9% 141 9% 145 9% 144 9% 160 9%
Total 1726 100% 1702 100% 1561 100% 1644 100% 1688 100% 1784 100%

Page 30 Road Traffic Crashes in Queensland: 2000
Table 4.4 indicates that:
• the majority (62 per cent) of multi-vehicle crashes involving hospitalisation in2000 were angle crashes (i.e. intersection collisions). This proportion is almosttwice that for fatal angle crashes which accounted for 34 per cent of multi-vehicle fatal crashes; and
• the proportion of rear-end, head-on, angle and sideswipe crashes involvinghospitalisation has remained relatively constant over the last six-year period.
4.4 Single vehicle crashes
The trend in fatal single vehicle crashes over the last five years has been tending downwardonly to have an increase in 2000 (see Table 4.5). The majority of these crashes in 2000occurred between intersections (86 per cent) with 72 per cent involving cars and two-thirdsbeing speed related. Compared with all fatal crashes in 2000, fatal single vehicle crasheswere proportionally more likely to involve speed (142 per cent more likely), fatigue (121 percent more likely), alcohol (66 per cent more likely) and 64 per cent more likely to involvemotorcycles. Similarly, fatal single vehicle crashes were less likely to occur at operatingtraffic lights (78 per cent less likely), at Give Way/Stop signs (59 per cent less likely) andwere 71 per cent less likey to result from disobeying traffic rules.
In 2000, 137 fatal single vehicle crashes were reported. This figure is 28 crashes (or 26 percent) more than the 1999 total and equal to the average of the 1995 to 1999 period. In Table4.5 single vehicle fatal crash data are presented for 1995 to 2000 by the nature of the crash.
Table 4.5 indicates that:
• 79 single vehicle fatal crashes in 2000 (58 per cent) involved vehicles hittingobjects (such as trees or power poles). This is above the 1995 to 1999average (64 per cent); and
• the other major category in 2000, vehicle overturning, represents 29 per centof the total number of fatal single vehicle crashes for that year. The number ofoverturning fatal crashes was 6 (or 19 per cent) higher than the average forthe previous five years of 34 fatal crashes.
In 2000, there were 1524 single vehicle crashes in which a road user was hospitalised. Thisfigure is 123 above the figure for 1999 and 110 (or eight per cent) above the average for the1995 to 1999 period. In Table 4.6 data are presented for single vehicle crashes involvinghospitalisation for the period 1995 to 2000 by the nature of crash.
Table 4.5: Single vehicle fatal crashes by nature of crashQueensland 1995-2000
Nature of crash 1995 1996 1997 1998 1999 2000No. % No. % No. % No. % No. % No. %
Hit object 105 62% 93 60% 95 71% 80 68% 65 60% 79 58%Overturned 47 28% 45 29% 25 19% 24 20% 27 25% 40 29%Hit parked vehicle 7 4% 4 3% 3 2% 6 5% 5 5% 6 4%Fall from vehicle * 11 6% 13 8% 11 8% 8 7% 12 11% 12 9%Total 170 100% 155 100% 134 100% 118 100% 109 100% 137 100%* Vehicle include motor or pedal cycle

Road Traffic Crashes in Queensland: 2000 Page 31
Table 4.6 indicates that:
• 59 per cent of the single vehicle crashes involving hospitalisation in 2000 (906of a total 1524) resulted from a vehicle hitting an object. This proportion isbelow the 1999 level of 64 per cent, and two percentage points below the1995 to 1999 average of 61 per cent;
• vehicles overturning represented 25 per cent of single vehicle crashesinvolving hospitalisation in 2000. This proportion is one percentage pointhigher than the 1995 to 1999 average of 24 per cent; and
• in 2000, motorcyclists, bicyclists or other vehicle occupants falling from theirvehicles represented nine per cent of single vehicle crashes involvinghospitalisation. The number of this crash type in 2000 (142 hospitalisationcrashes) is 10 per cent higher than the 1995 to 1999 average of 129.
4.5 Crashes by time of day
The long term trend in the proportion of fatal crashes occurring after dark increased from1991 to 1995 but has generally declined since then as shown in Table 4.7.
Different patterns appear when looking at high-risk periods of the day for multi-vehicle andsingle vehicle fatal crashes. Generally speaking, the majority of multi-vehicle fatal crashesoccurred most frequently during daytime periods, while single vehicle crashes occurred moreoften after dark. Figure 4.3 demonstrates this occurrence for crashes in 2000.
Table 4.6: Single vehicle crashes involving hospitalisation by nature of crashQueensland 1995-2000
Nature of crash 1995 1996 1997 1998 1999 2000No. % No. % No. % No. % No. % No. %
Hit object 841 58% 840 60% 861 64% 903 62% 894 64% 906 59%Overturned 412 28% 346 25% 313 23% 326 22% 290 21% 384 25%Hit parked vehicle 88 6% 80 6% 61 5% 87 6% 86 6% 92 6%Fall from vehicle * 115 8% 139 10% 120 9% 140 10% 131 9% 142 9%Total 1456 100% 1405 100% 1355 100% 1456 100% 1401 100% 1524 100%* Vehicle includes motor or pedal cycle
Table 4.7: Annual trends in the nature of fatal crashes occuring after dark
Queensland 1991-20001991 1992 1993 1994 1995 1996 1997 1998 1999 2000
Fatal crashes after dark 149 161 150 154 171 142 152 102 124 112All fatal crashes 359 363 357 368 408 338 321 257 273 276% after dark 42% 44% 42% 42% 42% 42% 47% 40% 45% 41%

Page 32 Road Traffic Crashes in Queensland: 2000
Figure 4.3 indicates that:
• during morning and afternoon commuting periods (6 to 10 a.m. and 4 to 6 p.m.), 35 per cent of multi-vehicle fatal crashes occurred with a similar percentage (33 per cent) for single vehicle fatal crashes;
• during the balance of daylight hours (10 a.m. to 4 p.m.), 33 per cent of multi-
vehicle fatal crashes occurred, in contrast to 24 per cent of single vehicle fatal crashes; and
• during the after dark periods (6 p.m. to 6 a.m.), the trend was reversed; 24 per
cent of fatal multi-vehicle crashes occurred, in contrast to 52 per cent of fatal single vehicle crashes.
An analysis of the data in Table 4.8 reveals that crashes, which occurred after dark, are more likely to result in a fatality than daytime crashes.
Table 4.8 indicates that:
• 40 per cent of fatal crashes occurred after dark (i.e. 6 p.m. to 6 a.m.) compared with 29 per cent for all crashes. Between midnight and 6 a.m. the proportion of fatal crashes at 17 per cent was almost double that of all crashes (nine per cent); and
• the reverse trend applied during the middle of the day (between 10 a.m. and 4
p.m.) when 37 per cent of all reported crashes occurred while 26 per cent of fatal crashes occurred during this period.
Fig. 4.3: Fatal crashes by time of dayQueensland 2000
0
2
4
6
8
10
12
14
16
18
20
00 - 01 02 - 03 04 - 05 06 - 07 08 - 09 10 - 11 12 - 13 14 - 15 16 - 17 18 - 19 20 - 21 22 - 23
Time of day (24 hr clock)
Fat
al c
rash
es
Single vehicle Multi vehicle
Table 4.8: Crashes by time of day by severityQueensland 2000
Fatal Hospitalisation All crashes*
Time period No. % No. % No. %
Midnight - 6 am 48 17% 370 10% 1687 9%
6 am - 10 am 44 16% 709 19% 3737 19%
10 am - 4 pm 73 26% 1320 35% 7236 37%
4 pm - 6 pm 47 17% 547 15% 2955 15%
6 pm - midnight 64 23% 821 22% 4017 20%
Total 276 100% 3767 459% 19632 100%
* Including casualty and property damage only
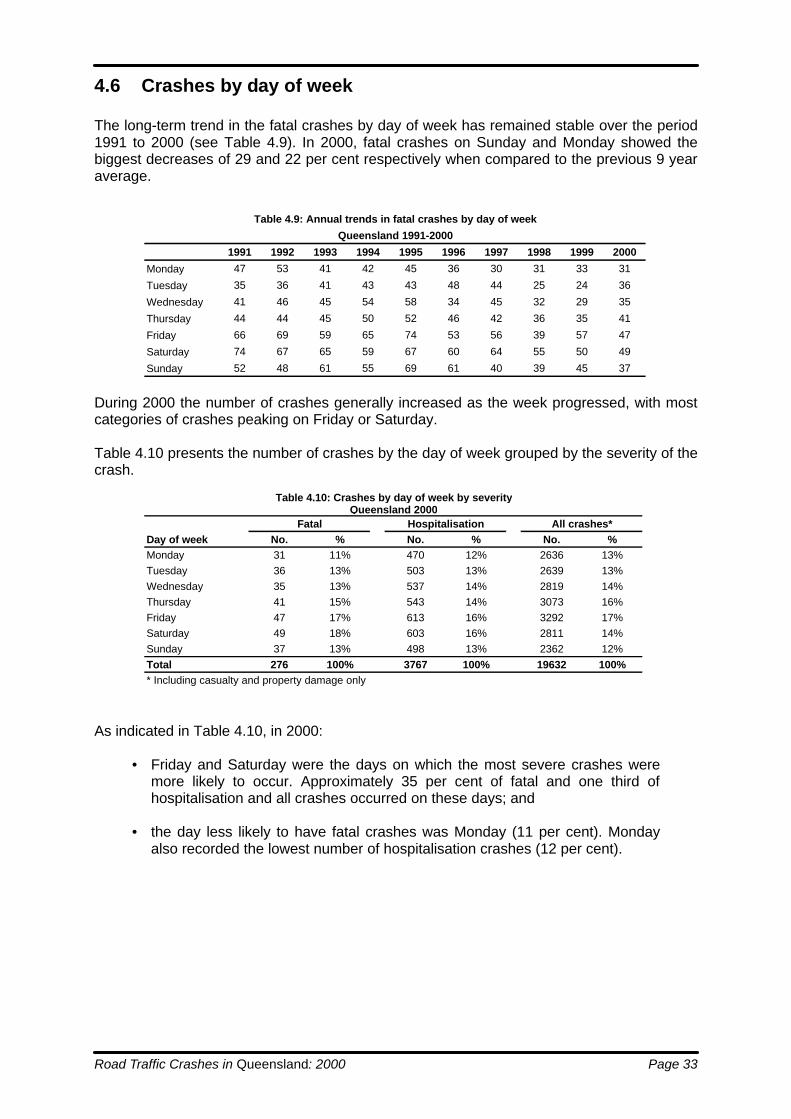
Road Traffic Crashes in Queensland: 2000 Page 33
4.6 Crashes by day of week
The long-term trend in the fatal crashes by day of week has remained stable over the period1991 to 2000 (see Table 4.9). In 2000, fatal crashes on Sunday and Monday showed thebiggest decreases of 29 and 22 per cent respectively when compared to the previous 9 yearaverage.
During 2000 the number of crashes generally increased as the week progressed, with mostcategories of crashes peaking on Friday or Saturday.
Table 4.10 presents the number of crashes by the day of week grouped by the severity of thecrash.
As indicated in Table 4.10, in 2000:
• Friday and Saturday were the days on which the most severe crashes weremore likely to occur. Approximately 35 per cent of fatal and one third ofhospitalisation and all crashes occurred on these days; and
• the day less likely to have fatal crashes was Monday (11 per cent). Mondayalso recorded the lowest number of hospitalisation crashes (12 per cent).
Table 4.10: Crashes by day of week by severityQueensland 2000
Fatal Hospitalisation All crashes*Day of week No. % No. % No. %Monday 31 11% 470 12% 2636 13%Tuesday 36 13% 503 13% 2639 13%Wednesday 35 13% 537 14% 2819 14%Thursday 41 15% 543 14% 3073 16%Friday 47 17% 613 16% 3292 17%Saturday 49 18% 603 16% 2811 14%Sunday 37 13% 498 13% 2362 12%Total 276 100% 3767 100% 19632 100%* Including casualty and property damage only
Table 4.9: Annual trends in fatal crashes by day of week
Queensland 1991-2000
1991 1992 1993 1994 1995 1996 1997 1998 1999 2000
Monday 47 53 41 42 45 36 30 31 33 31
Tuesday 35 36 41 43 43 48 44 25 24 36
Wednesday 41 46 45 54 58 34 45 32 29 35
Thursday 44 44 45 50 52 46 42 36 35 41
Friday 66 69 59 65 74 53 56 39 57 47
Saturday 74 67 65 59 67 60 64 55 50 49
Sunday 52 48 61 55 69 61 40 39 45 37
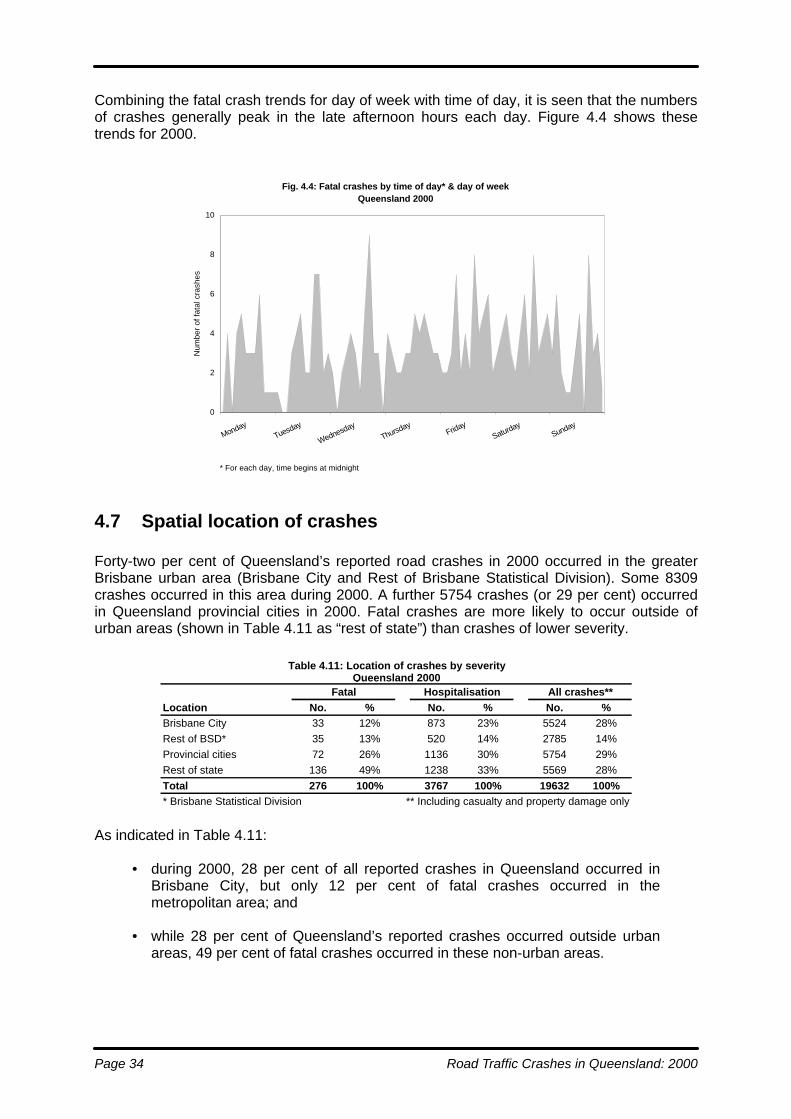
Page 34 Road Traffic Crashes in Queensland: 2000
Combining the fatal crash trends for day of week with time of day, it is seen that the numbers of crashes generally peak in the late afternoon hours each day. Figure 4.4 shows these trends for 2000.
4.7 Spatial location of crashes Forty-two per cent of Queensland’s reported road crashes in 2000 occurred in the greater Brisbane urban area (Brisbane City and Rest of Brisbane Statistical Division). Some 8309 crashes occurred in this area during 2000. A further 5754 crashes (or 29 per cent) occurred in Queensland provincial cities in 2000. Fatal crashes are more likely to occur outside of urban areas (shown in Table 4.11 as “rest of state”) than crashes of lower severity.
As indicated in Table 4.11:
• during 2000, 28 per cent of all reported crashes in Queensland occurred in Brisbane City, but only 12 per cent of fatal crashes occurred in the metropolitan area; and
• while 28 per cent of Queensland’s reported crashes occurred outside urban
areas, 49 per cent of fatal crashes occurred in these non-urban areas.
Table 4.11: Location of crashes by severityQueensland 2000
Fatal Hospitalisation All crashes**Location No. % No. % No. %Brisbane City 33 12% 873 23% 5524 28%Rest of BSD* 35 13% 520 14% 2785 14%Provincial cities 72 26% 1136 30% 5754 29%Rest of state 136 49% 1238 33% 5569 28%Total 276 100% 3767 100% 19632 100%* Brisbane Statistical Division ** Including casualty and property damage only
Fig. 4.4: Fatal crashes by time of day* & day of weekQueensland 2000
0
2
4
6
8
10
MondayTuesday
WednesdayThursday
FridaySaturday
Sunday
Num
ber
of fa
tal c
rash
es
* For each day, time begins at midnight
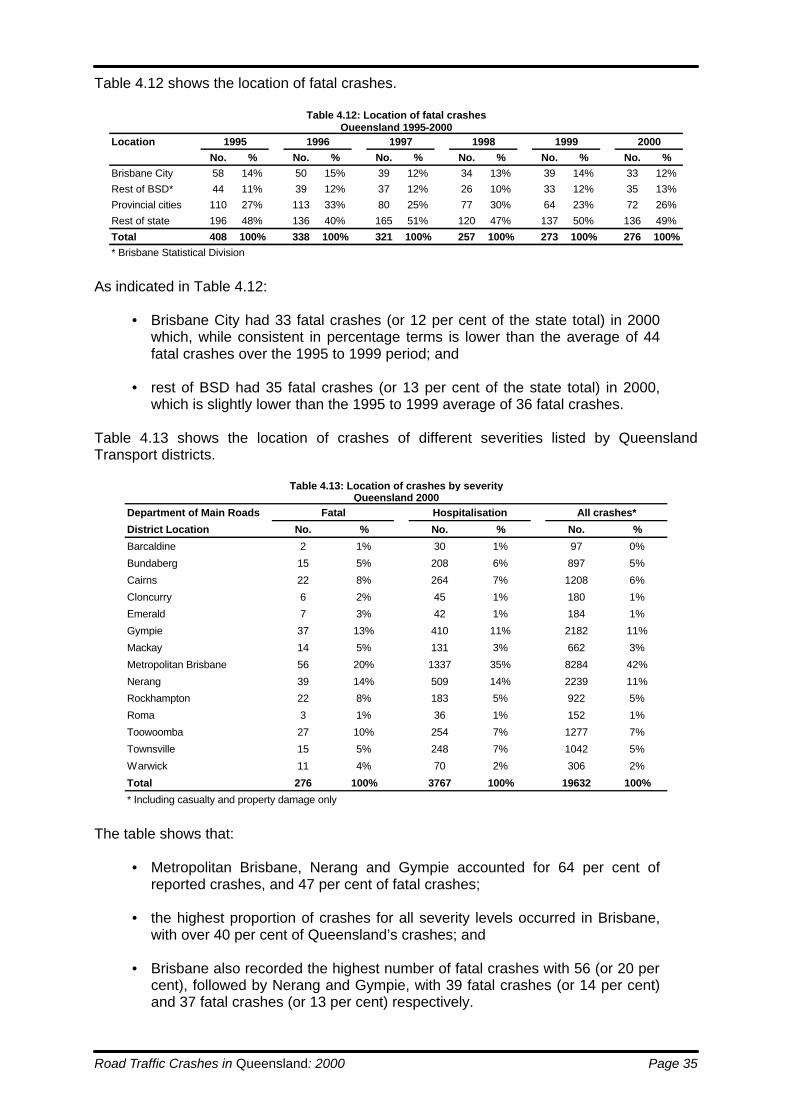
Road Traffic Crashes in Queensland: 2000 Page 35
Table 4.12 shows the location of fatal crashes.
As indicated in Table 4.12:
• Brisbane City had 33 fatal crashes (or 12 per cent of the state total) in 2000 which, while consistent in percentage terms is lower than the average of 44 fatal crashes over the 1995 to 1999 period; and
• rest of BSD had 35 fatal crashes (or 13 per cent of the state total) in 2000,
which is slightly lower than the 1995 to 1999 average of 36 fatal crashes.
Table 4.13 shows the location of crashes of different severities listed by Queensland Transport districts.
The table shows that:
• Metropolitan Brisbane, Nerang and Gympie accounted for 64 per cent of reported crashes, and 47 per cent of fatal crashes;
• the highest proportion of crashes for all severity levels occurred in Brisbane,
with over 40 per cent of Queensland’s crashes; and • Brisbane also recorded the highest number of fatal crashes with 56 (or 20 per
cent), followed by Nerang and Gympie, with 39 fatal crashes (or 14 per cent) and 37 fatal crashes (or 13 per cent) respectively.
Table 4.12: Location of fatal crashesQueensland 1995-2000
Location 1995 1996 1997 1998 1999 2000No. % No. % No. % No. % No. % No. %
Brisbane City 58 14% 50 15% 39 12% 34 13% 39 14% 33 12%Rest of BSD* 44 11% 39 12% 37 12% 26 10% 33 12% 35 13%Provincial cities 110 27% 113 33% 80 25% 77 30% 64 23% 72 26%
Rest of state 196 48% 136 40% 165 51% 120 47% 137 50% 136 49%
Total 408 100% 338 100% 321 100% 257 100% 273 100% 276 100%* Brisbane Statistical Division
Table 4.13: Location of crashes by severityQueensland 2000
Department of Main Roads Fatal Hospitalisation All crashes*
District Location No. % No. % No. %
Barcaldine 2 1% 30 1% 97 0%
Bundaberg 15 5% 208 6% 897 5%
Cairns 22 8% 264 7% 1208 6%
Cloncurry 6 2% 45 1% 180 1%
Emerald 7 3% 42 1% 184 1%
Gympie 37 13% 410 11% 2182 11%
Mackay 14 5% 131 3% 662 3%
Metropolitan Brisbane 56 20% 1337 35% 8284 42%
Nerang 39 14% 509 14% 2239 11%
Rockhampton 22 8% 183 5% 922 5%
Roma 3 1% 36 1% 152 1%
Toowoomba 27 10% 254 7% 1277 7%
Townsville 15 5% 248 7% 1042 5%
Warwick 11 4% 70 2% 306 2%
Total 276 100% 3767 100% 19632 100%
* Including casualty and property damage only
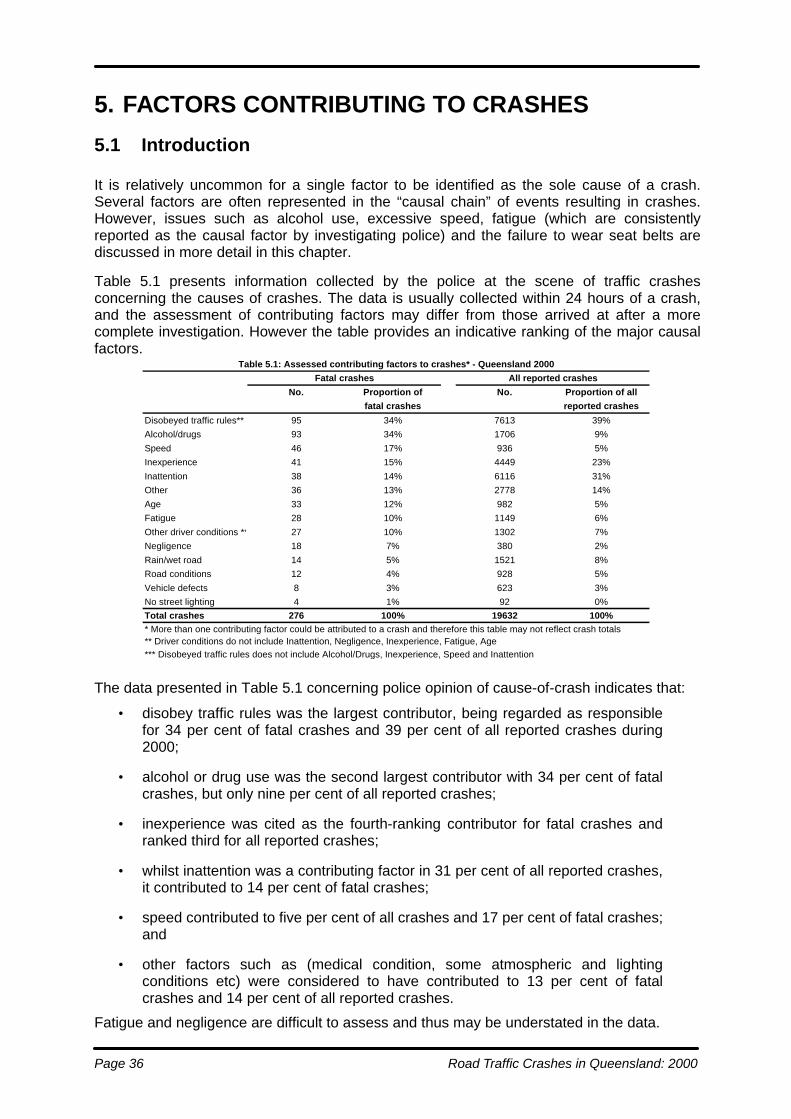
Page 36 Road Traffic Crashes in Queensland: 2000
5. FACTORS CONTRIBUTING TO CRASHES
5.1 Introduction It is relatively uncommon for a single factor to be identified as the sole cause of a crash. Several factors are often represented in the “causal chain” of events resulting in crashes. However, issues such as alcohol use, excessive speed, fatigue (which are consistently reported as the causal factor by investigating police) and the failure to wear seat belts are discussed in more detail in this chapter. Table 5.1 presents information collected by the police at the scene of traffic crashes concerning the causes of crashes. The data is usually collected within 24 hours of a crash, and the assessment of contributing factors may differ from those arrived at after a more complete investigation. However the table provides an indicative ranking of the major causal factors.
The data presented in Table 5.1 concerning police opinion of cause-of-crash indicates that:
• disobey traffic rules was the largest contributor, being regarded as responsible for 34 per cent of fatal crashes and 39 per cent of all reported crashes during 2000;
• alcohol or drug use was the second largest contributor with 34 per cent of fatal crashes, but only nine per cent of all reported crashes;
• inexperience was cited as the fourth-ranking contributor for fatal crashes and ranked third for all reported crashes;
• whilst inattention was a contributing factor in 31 per cent of all reported crashes, it contributed to 14 per cent of fatal crashes;
• speed contributed to five per cent of all crashes and 17 per cent of fatal crashes; and
• other factors such as (medical condition, some atmospheric and lighting conditions etc) were considered to have contributed to 13 per cent of fatal crashes and 14 per cent of all reported crashes.
Fatigue and negligence are difficult to assess and thus may be understated in the data.
Table 5.1: Assessed contributing factors to crashes* - Queensland 2000Fatal crashes All reported crashes
No. Proportion of No. Proportion of allfatal crashes reported crashes
Disobeyed traffic rules** 95 34% 7613 39%Alcohol/drugs 93 34% 1706 9%
Speed 46 17% 936 5%Inexperience 41 15% 4449 23%
Inattention 38 14% 6116 31%Other 36 13% 2778 14%
Age 33 12% 982 5%Fatigue 28 10% 1149 6%
Other driver conditions *** 27 10% 1302 7%Negligence 18 7% 380 2%
Rain/wet road 14 5% 1521 8%Road conditions 12 4% 928 5%
Vehicle defects 8 3% 623 3%No street lighting 4 1% 92 0%Total crashes 276 100% 19632 100%* More than one contributing factor could be attributed to a crash and therefore this table may not reflect crash totals** Driver conditions do not include Inattention, Negligence, Inexperience, Fatigue, Age*** Disobeyed traffic rules does not include Alcohol/Drugs, Inexperience, Speed and Inattention
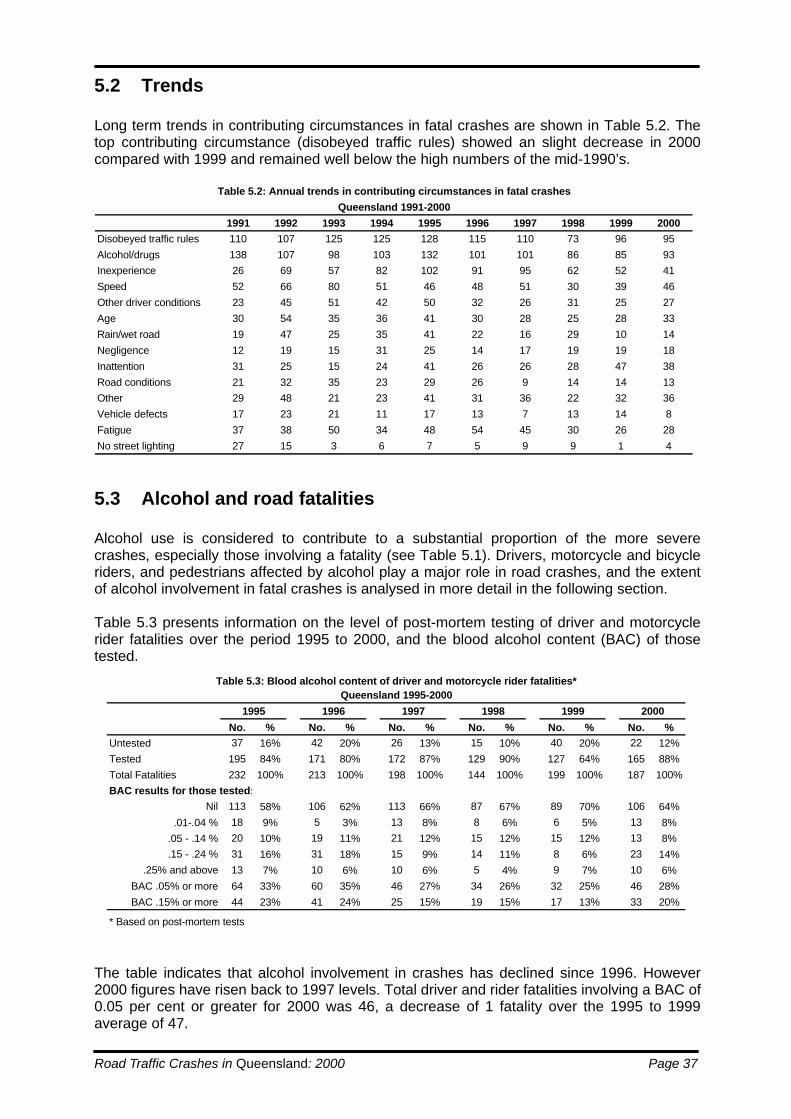
Road Traffic Crashes in Queensland: 2000 Page 37
5.2 Trends Long term trends in contributing circumstances in fatal crashes are shown in Table 5.2. The top contributing circumstance (disobeyed traffic rules) showed an slight decrease in 2000 compared with 1999 and remained well below the high numbers of the mid-1990’s.
5.3 Alcohol and road fatalities Alcohol use is considered to contribute to a substantial proportion of the more severe crashes, especially those involving a fatality (see Table 5.1). Drivers, motorcycle and bicycle riders, and pedestrians affected by alcohol play a major role in road crashes, and the extent of alcohol involvement in fatal crashes is analysed in more detail in the following section. Table 5.3 presents information on the level of post-mortem testing of driver and motorcycle rider fatalities over the period 1995 to 2000, and the blood alcohol content (BAC) of those tested.
The table indicates that alcohol involvement in crashes has declined since 1996. However 2000 figures have risen back to 1997 levels. Total driver and rider fatalities involving a BAC of 0.05 per cent or greater for 2000 was 46, a decrease of 1 fatality over the 1995 to 1999 average of 47.
Table 5.2: Annual trends in contributing circumstances in fatal crashes
Queensland 1991-2000
1991 1992 1993 1994 1995 1996 1997 1998 1999 2000Disobeyed traffic rules 110 107 125 125 128 115 110 73 96 95
Alcohol/drugs 138 107 98 103 132 101 101 86 85 93Inexperience 26 69 57 82 102 91 95 62 52 41
Speed 52 66 80 51 46 48 51 30 39 46
Other driver conditions 23 45 51 42 50 32 26 31 25 27
Age 30 54 35 36 41 30 28 25 28 33
Rain/wet road 19 47 25 35 41 22 16 29 10 14
Negligence 12 19 15 31 25 14 17 19 19 18
Inattention 31 25 15 24 41 26 26 28 47 38
Road conditions 21 32 35 23 29 26 9 14 14 13Other 29 48 21 23 41 31 36 22 32 36
Vehicle defects 17 23 21 11 17 13 7 13 14 8
Fatigue 37 38 50 34 48 54 45 30 26 28
No street lighting 27 15 3 6 7 5 9 9 1 4
Table 5.3: Blood alcohol content of driver and motorcycle rider fatalities*Queensland 1995-2000
1995 1996 1997 1998 1999 2000
No. % No. % No. % No. % No. % No. %Untested 37 16% 42 20% 26 13% 15 10% 40 20% 22 12%Tested 195 84% 171 80% 172 87% 129 90% 127 64% 165 88%
Total Fatalities 232 100% 213 100% 198 100% 144 100% 199 100% 187 100%BAC results for those tested:
Nil 113 58% 106 62% 113 66% 87 67% 89 70% 106 64%
.01-.04 % 18 9% 5 3% 13 8% 8 6% 6 5% 13 8%.05 - .14 % 20 10% 19 11% 21 12% 15 12% 15 12% 13 8%.15 - .24 % 31 16% 31 18% 15 9% 14 11% 8 6% 23 14%
.25% and above 13 7% 10 6% 10 6% 5 4% 9 7% 10 6%BAC .05% or more 64 33% 60 35% 46 27% 34 26% 32 25% 46 28%
BAC .15% or more 44 23% 41 24% 25 15% 19 15% 17 13% 33 20%
* Based on post-mortem tests

Page 38 Road Traffic Crashes in Queensland: 2000
Of 187 driver and motorcycle rider fatalities during 2000:
• 88 per cent were given a post-mortem blood alcohol test;
• of those tested, 28 per cent had a BAC at or in excess of the general legal limitof 0.05 per cent for open license holders and provisional license holders over 25years. This figure is four percentage points lower than the 1995 to 1999average; and
• 20 per cent of those tested had a BAC of 0.15 per cent or greater (three timesthe legal limit for most open license holders). In 2000, 33 fatalities recordedthese levels which is a 94 per cent increase over 1999. Compared with theaverage of the previous five years of 29, 2000 figures have increased 12 percent.
Figure 5.1 provides a graphical representation of blood alcohol levels for all driver andmotorcycle rider fatalities in 2000.
Table 5.4 presents data by year from 1995 to 2000 on the age groups of fatally injured driversand motorcycle riders who were found to have a blood alcohol content of 0.05 per cent orgreater.
The table indicates that:
• illegal BACs have been found almost exclusively in drivers and motorcycleriders between the ages of 17 and 59 years; and
• in 2000, 17 per cent of driver and motorcycle rider fatalities with illegal BACswere aged between 17 and 24 years. This was well below the previous five-yearaverage of 31 per cent. The result for ages 25 to 59 years of 80 per cent wasabove the previous five-year average of 63 per cent.
Fig. 5.1: Blood alcohol level for driver & motorcycle rider fatalitiesQueensland 2000
.25% + BAC 17%
Positive BAC31%
Nil BAC57%
.05-.14% BAC 22%
.15-.24% BAC 39%
Not tested 12%
.01-.04% BAC 22%
Table 5.4: Age of drivers and motorcycle rider fatalities with BAC of 0.05% or greater*Queensland 1995-2000
Age group 1995 1996 1997 1998 1999 2000
No. % No. % No. % No. % No. % No. %0 - 16 years 0 0% 1 2% 2 4% 0 0% 2 6% 0 0%
17 - 24 years 11 17% 31 52% 14 30% 11 32% 7 22% 8 17%25 - 59 years 47 73% 28 47% 30 65% 22 65% 21 66% 37 80%
60 years and over 6 9% 0 0% 0 0% 1 3% 2 6% 1 2%
Total 64 100% 60 100% 46 100% 34 100% 32 100% 46 100%* Based on post-mortem tests

Road Traffic Crashes in Queensland: 2000 Page 39
Table 5.5 provides information on the four main road user groups (drivers, motorcycle riders, bicyclists and pedestrians) in terms of positive blood alcohol tests following a fatal crash.
It can be seen that:
• drivers made up the largest group of alcohol-involved fatalities in 2000, constituting 62 per cent of fatalities tested with a BAC of 0.05 per cent or greater. This figure is above the previous five-year average of 60 per cent;
• the percentage of pedestrians recording a BAC of 0.05 per cent or greater in
2000 was 21 per cent, a decrease of one third from 1999; and • 10 motorcycle rider fatalities revealed a BAC of 0.05 per cent or greater in 2000,
an increase of 14 per cent on the previous five-year average. Figure 5.2 shows that the incidence of single vehicle crashes, crashes after dark and crashes on weekends is greatly elevated for alcohol related crashes compared with all crashes.
5.4 Speed as a contributing factor to fatalities Table 5.1 demonstrated that although speed was a contributing factor in five per cent of all reported crashes, it was judged to contribute to 17 per cent of fatal crashes and was the third most often cited contributing factor. Excessive speed for the prevailing conditions is believed to contribute to a further class of crashes. Table 5.6 sets out information by year on the severities of crashes to which speed was judged by the reporting officer to be a contributing factor.
Table 5.5: Road user fatalities with BAC of 0.05% or greater*Queensland 1995-2000
Roaduser type 1995 1996 1997 1998 1999 2000
No. % No. % No. % No. % No. % No. %Bicyclist 2 3% 1 1% 0 0% 0 0% 0 0% 0 0%
Driver 49 62% 50 70% 38 57% 29 53% 26 54% 36 62%Motorcyclist 15 19% 10 14% 8 12% 5 9% 6 13% 10 17%
Pedestrian 13 16% 10 14% 21 31% 21 38% 16 33% 12 21%
Total 79 100% 71 100% 67 100% 55 100% 48 100% 58 100%* Based on post-mortem tests
Single vehicle
After dark
Weekends
0
20
40
60
80
100
120
140
Cra
shes
Fig. 5.2: Crashes involving alcohol by selected variablesQueensland 2000
Alcohol related fatal crashes Fatal crashes

Page 40 Road Traffic Crashes in Queensland: 2000
The table shows that the distribution of severity levels in crashes to which speed was acontributing factor remained relatively constant from 1995 to 1999. All severity levels in 2000recorded increases in crash numbers. The involvement of speed in fatal crashes in 2000 wasseven per cent above the 1995 to 1999 average of 43 fatal crashes.
The age groups of fatally injured road users involved in crashes to which speed wasconsidered to be a contributing factor are presented in Table 5.7.
The table shows that the proportions of each age group involved in speed-related fatalcrashes have shown an erratic trend over the period 1995 to 2000. However, in 2000, fatalcrashes involving speed among young adults (aged 17 to 24 years) showed an increase of 54per cent when compared with 1999. This age group comprised 38 per cent of all speed-related fatalities in 2000.
5.5 Fatigue as a contributing factor
It is often difficult to isolate fatigue as a factor in crashes, particularly in the more severecrashes. One means of identifying likely fatigue-related crashes is to analyse single vehicle-type crashes (such as roll-over or hit object) on open roads during high-risk times for fatigue(i.e. 2 pm to 4 pm and 10 pm to 6 am). Also included in this analysis are other crashes wherepolice reported fatigue to be a contributing factor. Naturally, this approach will ignore crasheswhich occur at other times of day, occur in urban areas or are multi-vehicle collisions (e.g.head-on crashes), unless positively identified as a fatigue crash by police. However, theassumptions described above do point to factors which collectively constitute the majoringredients for fatigue crashes and therefore allow consistent analysis.
Table 5.6: Severity of crashes to which speed was a contributing factorQueensland 1995-2000
Severity 1995 1996 1997 1998 1999 2000No. % No. % No. % No. % No. % No. %
Fatal 46 5% 48 6% 51 6% 30 4% 40 5% 46 5%Hospitalisation 214 24% 177 22% 177 22% 215 25% 211 25% 237 25%Other injury 237 27% 259 32% 228 28% 233 27% 210 25% 256 27%Property damage 385 44% 334 41% 348 43% 378 44% 392 46% 397 42%
Total 882 100% 818 100% 804 100% 856 100% 853 100% 936 100%
Table 5.7: Age of fatalities in crashes to which speed was a contributing factorQueensland 1995-2000
Age group 1995 1996 1997 1998 1999 2000No. % No. % No. % No. % No. % No. %
0 - 16 years 4 7% 3 5% 1 2% 4 12% 5 11% 1 2%17 - 24 years 20 36% 31 55% 30 52% 19 56% 13 30% 20 38%25 - 59 years 27 49% 19 34% 27 47% 11 32% 24 55% 32 60%60 years and over 4 7% 3 5% 0 0% 0 0% 2 5% 0 0%
Total 55 100% 56 100% 58 100% 34 100% 44 100% 53 100%
Table 5.8: Severity of fatigue related crashes*Queensland 1995-2000
Severity 1995 1996 1997 1998 1999 2000No. % No. % No. % No. % No. % No. %
Fatal 47 4% 53 4% 44 4% 34 3% 27 2% 28 2%Hospitalisation 328 25% 322 25% 334 27% 324 28% 293 25% 309 26%Other injury 377 29% 400 31% 370 30% 314 27% 372 31% 350 30%Property damage 538 42% 501 39% 486 39% 501 43% 489 41% 495 42%
Total 1290 100% 1276 100% 1234 100% 1173 100% 1181 100% 1182 100%* Single vehicle-type crashes in 100km/h zones during typical fatigue times (2-4pm, 10pm-6am) or where police considered fatigue was a contributing factor.
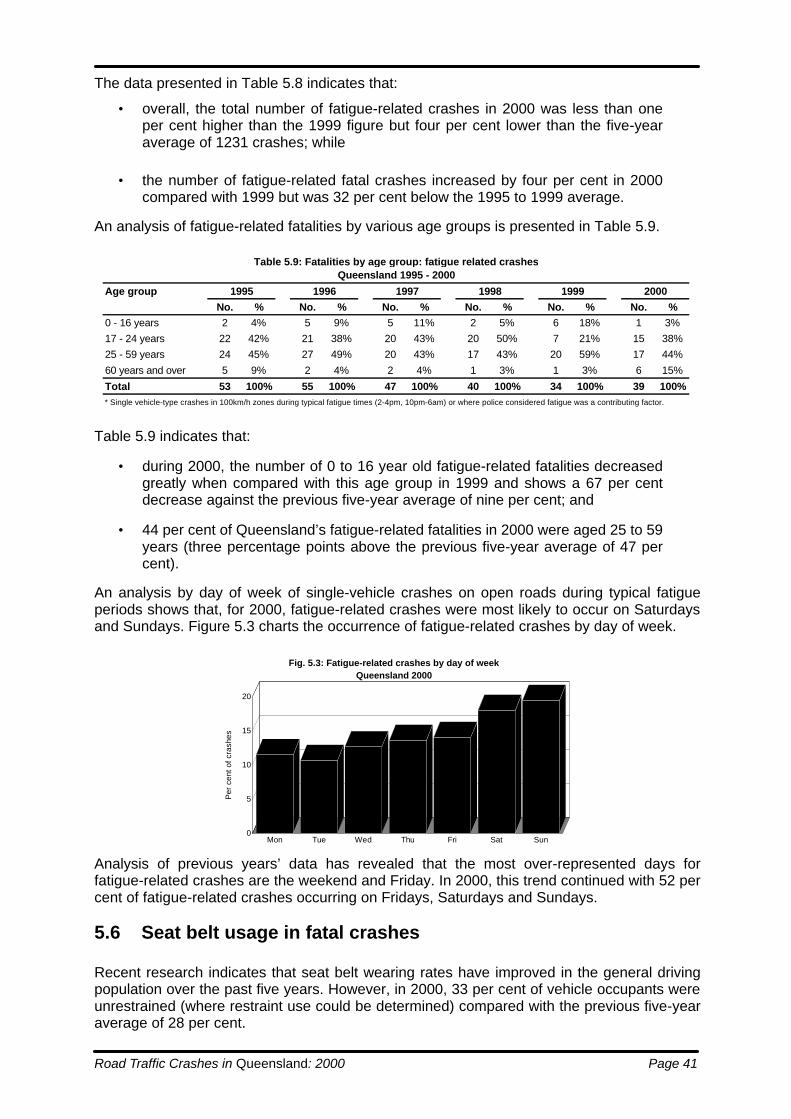
Road Traffic Crashes in Queensland: 2000 Page 41
The data presented in Table 5.8 indicates that:
• overall, the total number of fatigue-related crashes in 2000 was less than one per cent higher than the 1999 figure but four per cent lower than the five-year average of 1231 crashes; while
• the number of fatigue-related fatal crashes increased by four per cent in 2000 compared with 1999 but was 32 per cent below the 1995 to 1999 average.
An analysis of fatigue-related fatalities by various age groups is presented in Table 5.9.
Table 5.9 indicates that:
• during 2000, the number of 0 to 16 year old fatigue-related fatalities decreased greatly when compared with this age group in 1999 and shows a 67 per cent decrease against the previous five-year average of nine per cent; and
• 44 per cent of Queensland’s fatigue-related fatalities in 2000 were aged 25 to 59 years (three percentage points above the previous five-year average of 47 per cent).
An analysis by day of week of single-vehicle crashes on open roads during typical fatigue periods shows that, for 2000, fatigue-related crashes were most likely to occur on Saturdays and Sundays. Figure 5.3 charts the occurrence of fatigue-related crashes by day of week.
Analysis of previous years’ data has revealed that the most over-represented days for fatigue-related crashes are the weekend and Friday. In 2000, this trend continued with 52 per cent of fatigue-related crashes occurring on Fridays, Saturdays and Sundays.
5.6 Seat belt usage in fatal crashes Recent research indicates that seat belt wearing rates have improved in the general driving population over the past five years. However, in 2000, 33 per cent of vehicle occupants were unrestrained (where restraint use could be determined) compared with the previous five-year average of 28 per cent.
Table 5.9: Fatalities by age group: fatigue related crashesQueensland 1995 - 2000
Age group 1995 1996 1997 1998 1999 2000No. % No. % No. % No. % No. % No. %
0 - 16 years 2 4% 5 9% 5 11% 2 5% 6 18% 1 3%17 - 24 years 22 42% 21 38% 20 43% 20 50% 7 21% 15 38%25 - 59 years 24 45% 27 49% 20 43% 17 43% 20 59% 17 44%
60 years and over 5 9% 2 4% 2 4% 1 3% 1 3% 6 15%
Total 53 100% 55 100% 47 100% 40 100% 34 100% 39 100%* Single vehicle-type crashes in 100km/h zones during typical fatigue times (2-4pm, 10pm-6am) or where police considered fatigue was a contributing factor.
0
5
10
15
20
Per
cen
t of c
rash
es
Mon Tue Wed Thu Fri Sat Sun
Fig. 5.3: Fatigue-related crashes by day of weekQueensland 2000
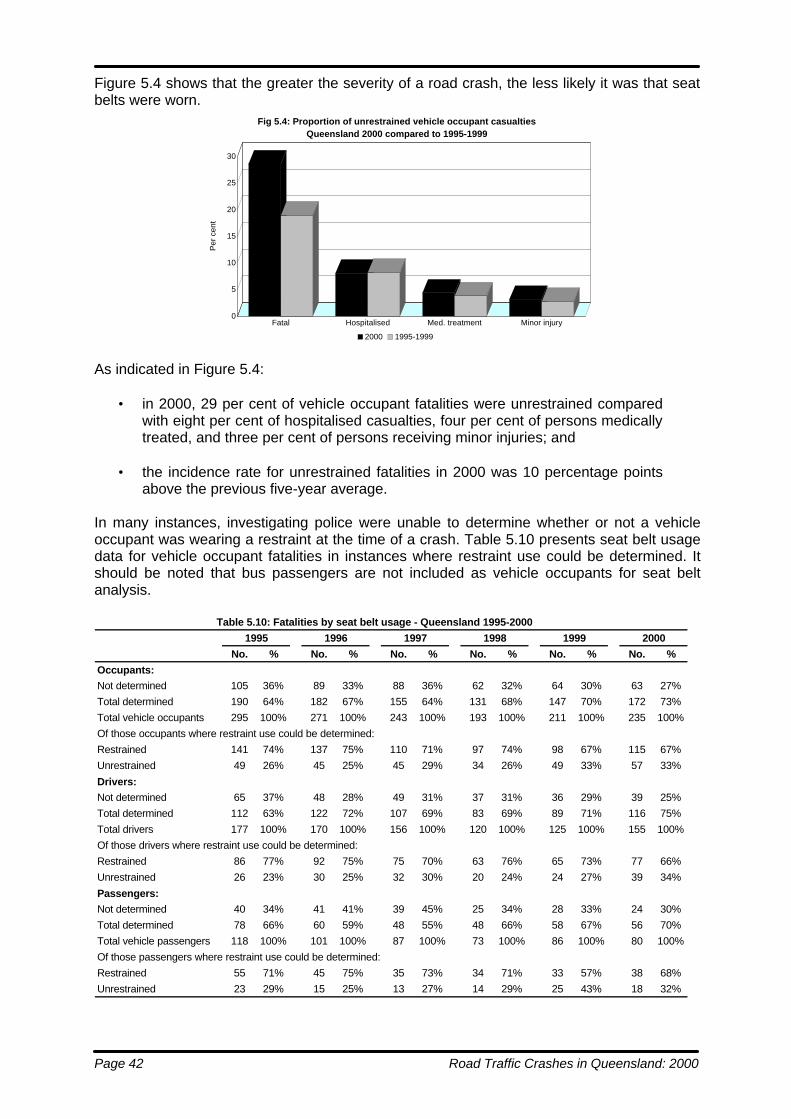
Page 42 Road Traffic Crashes in Queensland: 2000
Figure 5.4 shows that the greater the severity of a road crash, the less likely it was that seat belts were worn.
As indicated in Figure 5.4:
• in 2000, 29 per cent of vehicle occupant fatalities were unrestrained compared with eight per cent of hospitalised casualties, four per cent of persons medically treated, and three per cent of persons receiving minor injuries; and
• the incidence rate for unrestrained fatalities in 2000 was 10 percentage points above the previous five-year average.
In many instances, investigating police were unable to determine whether or not a vehicle occupant was wearing a restraint at the time of a crash. Table 5.10 presents seat belt usage data for vehicle occupant fatalities in instances where restraint use could be determined. It should be noted that bus passengers are not included as vehicle occupants for seat belt analysis.
0
5
10
15
20
25
30
Per
cen
t
Fatal Hospitalised Med. treatment Minor injury
Fig 5.4: Proportion of unrestrained vehicle occupant casualtiesQueensland 2000 compared to 1995-1999
2000 1995-1999
Table 5.10: Fatalities by seat belt usage - Queensland 1995-2000
1995 1996 1997 1998 1999 2000
No. % No. % No. % No. % No. % No. %
Occupants:Not determined 105 36% 89 33% 88 36% 62 32% 64 30% 63 27%
Total determined 190 64% 182 67% 155 64% 131 68% 147 70% 172 73%
Total vehicle occupants 295 100% 271 100% 243 100% 193 100% 211 100% 235 100%
Of those occupants where restraint use could be determined:
Restrained 141 74% 137 75% 110 71% 97 74% 98 67% 115 67%
Unrestrained 49 26% 45 25% 45 29% 34 26% 49 33% 57 33%
Drivers:Not determined 65 37% 48 28% 49 31% 37 31% 36 29% 39 25%
Total determined 112 63% 122 72% 107 69% 83 69% 89 71% 116 75%
Total drivers 177 100% 170 100% 156 100% 120 100% 125 100% 155 100%
Of those drivers where restraint use could be determined:
Restrained 86 77% 92 75% 75 70% 63 76% 65 73% 77 66%
Unrestrained 26 23% 30 25% 32 30% 20 24% 24 27% 39 34%
Passengers:Not determined 40 34% 41 41% 39 45% 25 34% 28 33% 24 30%
Total determined 78 66% 60 59% 48 55% 48 66% 58 67% 56 70%
Total vehicle passengers 118 100% 101 100% 87 100% 73 100% 86 100% 80 100%
Of those passengers where restraint use could be determined:
Restrained 55 71% 45 75% 35 73% 34 71% 33 57% 38 68%
Unrestrained 23 29% 15 25% 13 27% 14 29% 25 43% 18 32%
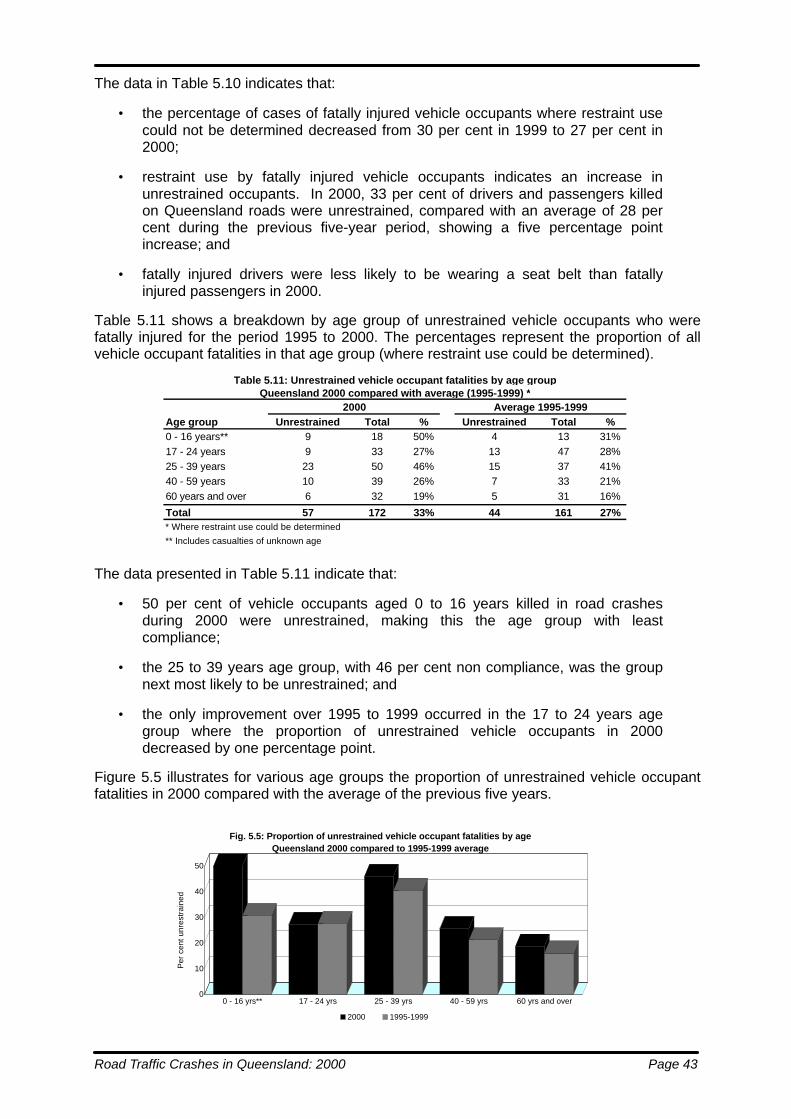
Road Traffic Crashes in Queensland: 2000 Page 43
The data in Table 5.10 indicates that:
• the percentage of cases of fatally injured vehicle occupants where restraint usecould not be determined decreased from 30 per cent in 1999 to 27 per cent in2000;
• restraint use by fatally injured vehicle occupants indicates an increase inunrestrained occupants. In 2000, 33 per cent of drivers and passengers killedon Queensland roads were unrestrained, compared with an average of 28 percent during the previous five-year period, showing a five percentage pointincrease; and
• fatally injured drivers were less likely to be wearing a seat belt than fatallyinjured passengers in 2000.
Table 5.11 shows a breakdown by age group of unrestrained vehicle occupants who werefatally injured for the period 1995 to 2000. The percentages represent the proportion of allvehicle occupant fatalities in that age group (where restraint use could be determined).
The data presented in Table 5.11 indicate that:
• 50 per cent of vehicle occupants aged 0 to 16 years killed in road crashesduring 2000 were unrestrained, making this the age group with leastcompliance;
• the 25 to 39 years age group, with 46 per cent non compliance, was the groupnext most likely to be unrestrained; and
• the only improvement over 1995 to 1999 occurred in the 17 to 24 years agegroup where the proportion of unrestrained vehicle occupants in 2000decreased by one percentage point.
Figure 5.5 illustrates for various age groups the proportion of unrestrained vehicle occupantfatalities in 2000 compared with the average of the previous five years.
Table 5.11: Unrestrained vehicle occupant fatalities by age groupQueensland 2000 compared with average (1995-1999) *
2000 Average 1995-1999Age group Unrestrained Total % Unrestrained Total %0 - 16 years** 9 18 50% 4 13 31%17 - 24 years 9 33 27% 13 47 28%25 - 39 years 23 50 46% 15 37 41%40 - 59 years 10 39 26% 7 33 21%60 years and over 6 32 19% 5 31 16%
Total 57 172 33% 44 161 27%* Where restraint use could be determined
** Includes casualties of unknown age
0
10
20
30
40
50
Per
cen
t unr
estr
aine
d
0 - 16 yrs** 17 - 24 yrs 25 - 39 yrs 40 - 59 yrs 60 yrs and over
Fig. 5.5: Proportion of unrestrained vehicle occupant fatalities by ageQueensland 2000 compared to 1995-1999 average
2000 1995-1999

Appendix 1: Glossary Page A1-1
APPENDIX 1 GLOSSARYRoad users are defined as:• drivers of motor vehicles other than a motorcycle• motorcycle riders• bicycle riders• horse riders• passengers of the above• pedestrians
A road traffic crash is a crash reported to thepolice which resulted from the movement of atleast one road vehicle on a road and involvingdeath or injury to any person, or propertydamage.
A property damage only crash is a crash where atleast one vehicle is towed away or the damagecost is greater than $2,500 (or $1000 prior to 1December 1991).
The road toll is a count of fatalities (excludinginjuries) resulting from road traffic crashes.
A fatality is recorded when any person dies within30 days as a result of injuries sustained in a roadtraffic crash.
A serious injury is recorded when any personinvolved in a road traffic crash: (a) requireshospitalisation (i.e. is admitted to hospital) or (b)requires medical treatment.
An injury is recorded when any person involved ina road traffic crash: (a) requires hospitalisation;(b) requires medical treatment; or (c) receives aminor injury (i.e. first aid treatment only).
A casualty is the grouping of both fatalities andinjuries.
A single vehicle crash is a crash in which onlyone moving motor vehicle is involved in the initialevent, either in a collision (e.g. with a roadsidepole) or a non-collision (e.g. a roll over). Acollision with a parked car is considered a singlevehicle crash because the characteristics of thistype of crash are similar to crashes where avehicle collides with a roadside object.
A multi-vehicle crash is a crash which involves aninitial collision between any two (or more) movingmotor vehicles.
A blood alcohol content (BAC) reading is ameasure of the proportion of alcohol in a person’sblood. This reading is typically obtained using abreathalyser or by conducting a blood
test. Where possible, a post-mortem bloodanalysis is carried out on a fatally injured roaduser.
A controller is a road user who exercises controlover their movements at the time of an accident(i.e. driver, rider or pedestrian). Passengers arenot regarded as controllers.
A child is regarded as being a road user agedunder 17 years.
A young adult is a road user aged from 17 to 24years.
A mature aged road user is a person who is agedfrom 25 to 59 years.
An older road user is a person who is aged 60years or over.
Heavy freight vehicle refers to both rigid andarticulated trucks.
A vehicle occupant is a person travelling in a car,utility, panel van, bus, rigid truck or articulatedvehicle at the time of a crash.
A driver is the vehicle occupant in control of amotor vehicle at the time of a crash.
A passenger is any other occupant of a motorvehicle at the time of a crash.
A motorcyclist is either the rider or pillionpassenger of a motorcycle.
A pedal cyclist is either the rider or pillionpassenger of a bicycle.
A pedestrian is either an ordinary pedestrian or aperson on skates, rollerblades or a skateboard.
A peak commuter period refers to that time of daywhen most commuters are either travelling to orreturning from work. For this report it isconsidered to cover the periods from 6.00 am to10.00 am and 4.00 pm to 6.00 pm, Monday toFriday.
The provincial cities are: Gold Coast, Gladstone,Charters Towers, Warwick, Cairns, Maryborough,Townsville, Gympie, Mackay, Mount Isa,Bundaberg, Rockhampton, Toowoomba, HerveyBay City, Caloundra City and Thuringowa City.

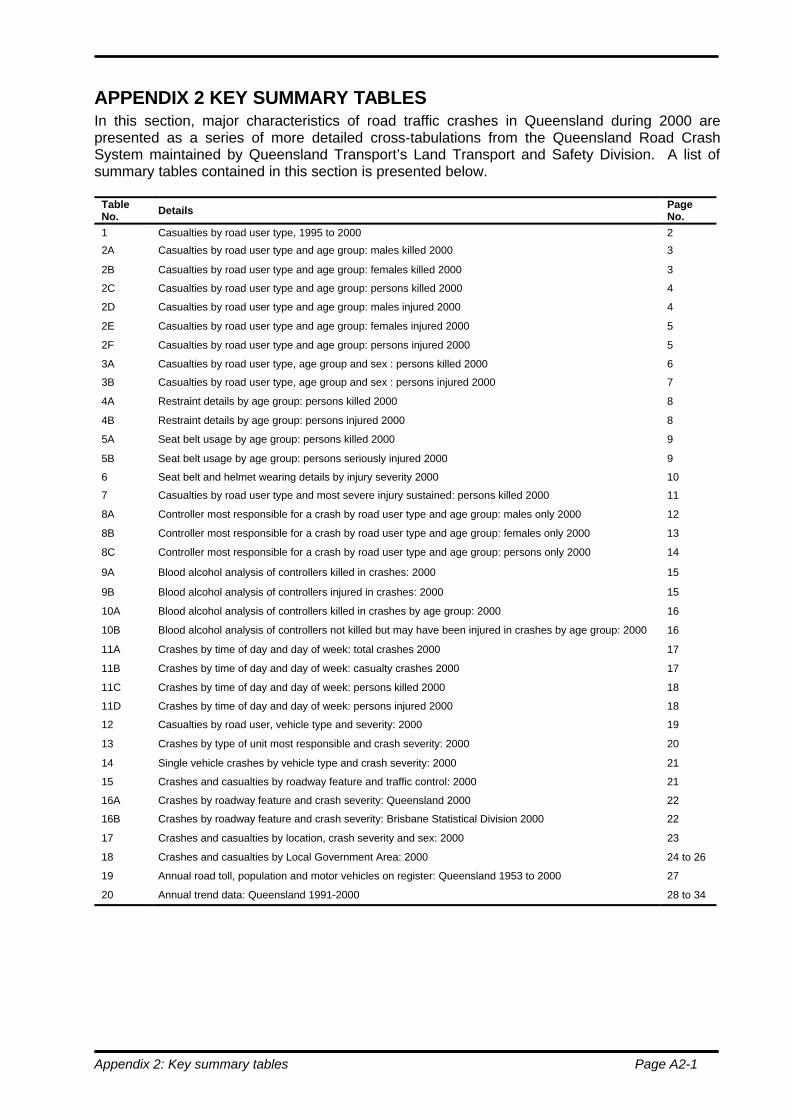
Appendix 2: Key summary tables Page A2-1
APPENDIX 2 KEY SUMMARY TABLESIn this section, major characteristics of road traffic crashes in Queensland during 2000 arepresented as a series of more detailed cross-tabulations from the Queensland Road CrashSystem maintained by Queensland Transport’s Land Transport and Safety Division. A list ofsummary tables contained in this section is presented below.
TableNo. Details Page
No.1 Casualties by road user type, 1995 to 2000 2
2A Casualties by road user type and age group: males killed 2000 3
2B Casualties by road user type and age group: females killed 2000 3
2C Casualties by road user type and age group: persons killed 2000 4
2D Casualties by road user type and age group: males injured 2000 4
2E Casualties by road user type and age group: females injured 2000 5
2F Casualties by road user type and age group: persons injured 2000 5
3A Casualties by road user type, age group and sex : persons killed 2000 6
3B Casualties by road user type, age group and sex : persons injured 2000 7
4A Restraint details by age group: persons killed 2000 8
4B Restraint details by age group: persons injured 2000 8
5A Seat belt usage by age group: persons killed 2000 9
5B Seat belt usage by age group: persons seriously injured 2000 9
6 Seat belt and helmet wearing details by injury severity 2000 10
7 Casualties by road user type and most severe injury sustained: persons killed 2000 11
8A Controller most responsible for a crash by road user type and age group: males only 2000 12
8B Controller most responsible for a crash by road user type and age group: females only 2000 13
8C Controller most responsible for a crash by road user type and age group: persons only 2000 14
9A Blood alcohol analysis of controllers killed in crashes: 2000 15
9B Blood alcohol analysis of controllers injured in crashes: 2000 15
10A Blood alcohol analysis of controllers killed in crashes by age group: 2000 16
10B Blood alcohol analysis of controllers not killed but may have been injured in crashes by age group: 2000 16
11A Crashes by time of day and day of week: total crashes 2000 17
11B Crashes by time of day and day of week: casualty crashes 2000 17
11C Crashes by time of day and day of week: persons killed 2000 18
11D Crashes by time of day and day of week: persons injured 2000 18
12 Casualties by road user, vehicle type and severity: 2000 19
13 Crashes by type of unit most responsible and crash severity: 2000 20
14 Single vehicle crashes by vehicle type and crash severity: 2000 21
15 Crashes and casualties by roadway feature and traffic control: 2000 21
16A Crashes by roadway feature and crash severity: Queensland 2000 22
16B Crashes by roadway feature and crash severity: Brisbane Statistical Division 2000 22
17 Crashes and casualties by location, crash severity and sex: 2000 23
18 Crashes and casualties by Local Government Area: 2000 24 to 26
19 Annual road toll, population and motor vehicles on register: Queensland 1953 to 2000 27
20 Annual trend data: Queensland 1991-2000 28 to 34

Page A2-2 Appendix 2: Key summary tables
Table 1: Road traffic casualties by road user type - Queensland 1995-2000
Car, Truck, Bus Motorcycle
Driver Passenger Rider Pillion
Year K H M K H M K H M K H M
1995 178 2081 3298 119 1291 2039 52 550 481 2 48 51
1996 170 1919 3411 104 1270 2008 39 562 519 2 44 42
1997 157 1832 3328 88 1128 1891 40 504 406 3 42 44
1998 120 1990 3278 75 1168 1840 23 534 383 2 55 35
1999 125 2134 3310 87 1193 1839 39 490 395 2 42 23
2000 155 2227 3387 82 1271 1809 30 482 355 3 37 27
Pedestrian Pedal Cyclist Other All Road Users
Year K H M K H M K H M K H M
1995 92 445 398 10 211 411 3 10 13 456 4636 6691
1996 55 411 393 10 259 444 5 16 18 385 4481 6835
1997 59 373 375 12 253 420 1 14 18 360 4146 6482
1998 48 393 336 9 240 427 2 14 21 279 4394 6320
1999 49 385 318 9 241 336 3 15 22 314 4500 6243
2000 40 423 340 6 277 352 2 17 17 318 4734 6287
Legend:
K = Killed, H = Admitted to hospital, M = Received medical treatment
* Includes pillion passengers

Appendix 2: Key summary tables Page A2-3
Table 2A: Road traffic casualties Queensland 2000by road user type and age group
Males killed by age goup
Road user type 0-4 5-16 17-20 21-25 26-29 30-39 40-49 50-59 60 & Notyears years years years years years years years years stated Total
Drivers 0 1 14 12 14 32 13 15 18 0 119
% 0.0% 0.8% 11.8% 10.1% 11.8% 26.9% 10.9% 12.6% 15.1% 0.0% 100.0
Passengers 2 11 4 13 2 4 3 0 10 0 49
% 4.1% 22.4% 8.2% 26.5% 4.1% 8.2% 6.1% 0.0% 20.4% 0.0% 100.0
Pedestrians 1 2 3 4 0 2 5 4 8 0 29
% 3.4% 6.9% 10.3% 13.8% 0.0% 6.9% 17.2% 13.8% 27.6% 0.0% 100.0
Motorcycle riders 0 1 2 5 2 12 5 2 0 0 29
% 0.0% 3.4% 6.9% 17.2% 6.9% 41.4% 17.2% 6.9% 0.0% 0.0% 100.0
Motorcycle pillions 0 0 0 1 1 0 0 0 0 0 2
% 0.0% 0.0% 0.0% 50.0% 50.0% 0.0% 0.0% 0.0% 0.0% 0.0% 100.0
Bicycle riders 0 2 0 0 1 1 1 1 0 0 6
% 0.0% 33.3% 0.0% 0.0% 16.7% 16.7% 16.7% 16.7% 0.0% 0.0% 100.0
Bicycle pillions 0 0 0 0 0 0 0 0 0 0 0
% 0.0% 0.0% 0.0% 0.0% 0.0% 0.0% 0.0% 0.0% 0.0% 0.0% 100.0
Total killed 3 17 23 35 20 51 27 22 36 0 234
% of total 1.3% 7.3% 9.8% 15.0% 8.5% 21.8% 11.5% 9.4% 15.4% 0.0% 100.0
Table 2B: Road traffic casualties Queensland 2000by road user type and age group
Females killed by age goup
Road user type 0-4 5-16 17-20 21-25 26-29 30-39 40-49 50-59 60 & Notyears years years years years years years years years stated Total
Drivers 0 0 5 6 6 2 7 5 7 0 38
% 0.0% 0.0% 13.2% 15.8% 15.8% 5.3% 18.4% 13.2% 18.4% 0.0% 100.0
Passengers 4 4 2 3 0 3 3 2 12 0 33
% 12.1% 12.1% 6.1% 9.1% 0.0% 9.1% 9.1% 6.1% 36.4% 0.0% 100.0
Pedestrians 0 0 1 0 0 2 1 0 7 0 11
% 0.0% 0.0% 9.1% 0.0% 0.0% 18.2% 9.1% 0.0% 63.6% 0.0% 100.0
Motorcycle riders 0 0 0 0 0 1 0 0 0 0 1
% 0.0% 0.0% 0.0% 0.0% 0.0% 100.0% 0.0% 0.0% 0.0% 0.0% 100.0
Motorcycle pillions 0 0 0 0 1 0 0 0 0 0 1
% 0.0% 0.0% 0.0% 0.0% 100.0% 0.0% 0.0% 0.0% 0.0% 0.0% 100.0
Bicycle riders 0 0 0 0 0 0 0 0 0 0 0
% 0.0% 0.0% 0.0% 0.0% 0.0% 0.0% 0.0% 0.0% 0.0% 0.0% 100.0
Bicycle pillions 0 0 0 0 0 0 0 0 0 0 0
% 0.0% 0.0% 0.0% 0.0% 0.0% 0.0% 0.0% 0.0% 0.0% 0.0% 100.0
Total killed 4 4 8 9 7 8 11 7 26 0 84
% of total 4.8% 4.8% 9.5% 10.7% 8.3% 9.5% 13.1% 8.3% 31.0% 0.0% 100.0

Page A2-4 Appendix 2: Key summary tables
Table 2C: Road traffic casualties Queensland 2000by road user type and age group
Persons killed by age goup
Road user type 0-4* 5-16 17-20 21-25 26-29 30-39 40-49 50-59 60 & Notyears years years years years years years years years stated Total
Drivers 0 1 19 18 20 34 20 20 25 0 157
% 0.0% 0.6% 12.1% 11.5% 12.7% 21.7% 12.7% 12.7% 15.9% 0.0% 100.0
Passengers 6 15 6 16 2 7 6 2 22 0 82
% 7.3% 18.3% 7.3% 19.5% 2.4% 8.5% 7.3% 2.4% 26.8% 0.0% 100.0
Pedestrians 1 2 4 4 0 4 6 4 15 0 40
% 2.5% 5.0% 10.0% 10.0% 0.0% 10.0% 15.0% 10.0% 37.5% 0.0% 100.0
Motorcycle riders 0 1 2 5 2 13 5 2 0 0 30
% 0.0% 3.3% 6.7% 16.7% 6.7% 43.3% 16.7% 6.7% 0.0% 0.0% 100.0
Motorcycle pillions 0 0 0 1 2 0 0 0 0 0 3
% 0.0% 0.0% 0.0% 33.3% 66.7% 0.0% 0.0% 0.0% 0.0% 0.0% 100.0
Bicycle riders 0 2 0 0 1 1 1 1 0 0 6
% 0.0% 33.3% 0.0% 0.0% 16.7% 16.7% 16.7% 16.7% 0.0% 0.0% 100.0
Bicycle pillions 0 0 0 0 0 0 0 0 0 0 0
% 0.0% 0.0% 0.0% 0.0% 0.0% 0.0% 0.0% 0.0% 0.0% 0.0% 100.0
Total killed 7 21 31 44 27 59 38 29 62 0 318
% of total 2.2% 6.6% 9.7% 13.8% 8.5% 18.6% 11.9% 9.1% 19.5% 0.0% 100.0
* Includes fatalities of unknown gender
Table 2D: Road traffic casualties Queensland 2000by road user type and age group
Males injured by age goup
Road user type 0-4 5-16 17-20 21-25 26-29 30-39 40-49 50-59 60 & Notyears years years years years years years years years stated Total
Drivers 0 28 694 642 437 808 584 450 472 3 4118
% 0.0% 0.7% 16.9% 15.6% 10.6% 19.6% 14.2% 10.9% 11.5% 0.1% 100.0
Passengers 84 371 339 230 124 184 120 60 86 19 1617
% 5.2% 22.9% 21.0% 14.2% 7.7% 11.4% 7.4% 3.7% 5.3% 1.2% 100.0
Pedestrians 30 133 54 69 37 71 38 42 60 8 542
% 5.5% 24.5% 10.0% 12.7% 6.8% 13.1% 7.0% 7.7% 11.1% 1.5% 100.0
Motorcycle riders 0 22 101 183 128 243 157 61 22 2 919
% 0.0% 2.4% 11.0% 19.9% 13.9% 26.4% 17.1% 6.6% 2.4% 0.2% 100.0
Motorcycle pillions 1 9 9 2 3 3 3 0 0 1 31
% 3.2% 29.0% 29.0% 6.5% 9.7% 9.7% 9.7% 0.0% 0.0% 3.2% 100.0
Bicycle riders 4 230 61 53 59 99 66 32 15 6 625
% 0.6% 36.8% 9.8% 8.5% 9.4% 15.8% 10.6% 5.1% 2.4% 1.0% 100.0
Bicycle pillions 0 4 0 0 0 0 0 0 0 0 4
% 0.0% 100.0% 0.0% 0.0% 0.0% 0.0% 0.0% 0.0% 0.0% 0.0% 100.0
Total injured 119 797 1258 1179 788 1408 968 645 655 39 7856
% of total 1.5% 10.1% 16.0% 15.0% 10.0% 17.9% 12.3% 8.2% 8.3% 0.5% 100.0
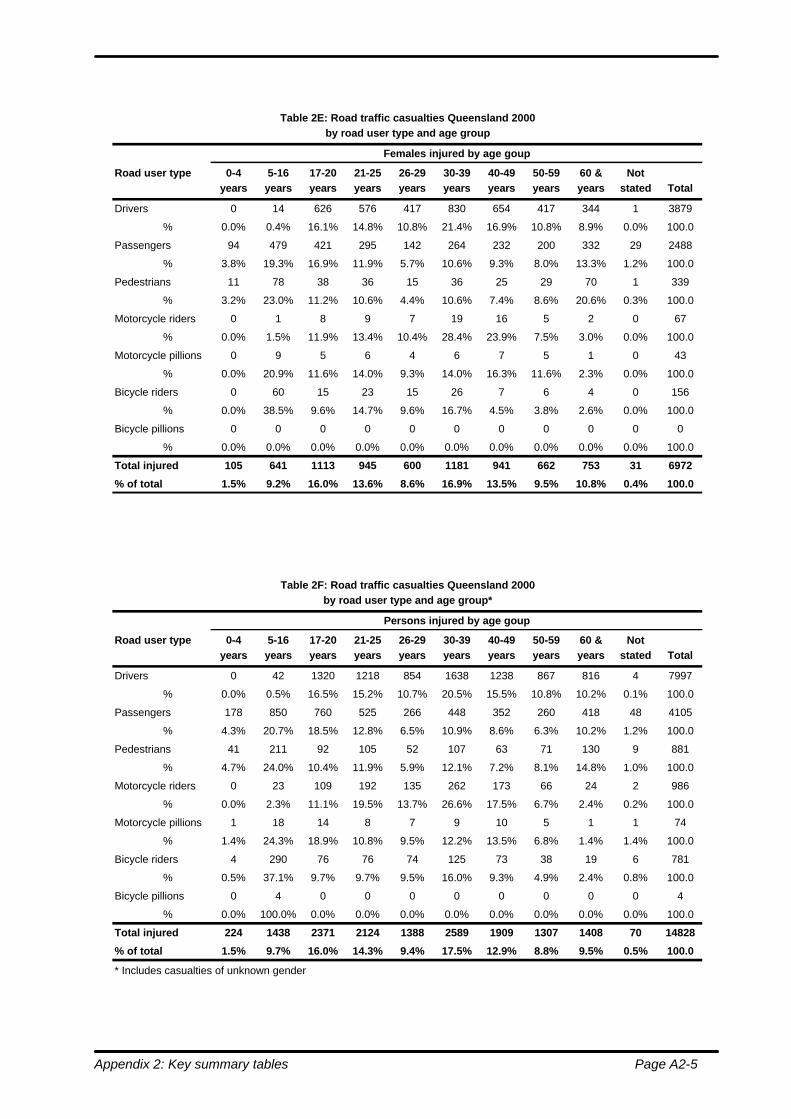
Appendix 2: Key summary tables Page A2-5
Table 2E: Road traffic casualties Queensland 2000by road user type and age group
Females injured by age goup
Road user type 0-4 5-16 17-20 21-25 26-29 30-39 40-49 50-59 60 & Notyears years years years years years years years years stated Total
Drivers 0 14 626 576 417 830 654 417 344 1 3879
% 0.0% 0.4% 16.1% 14.8% 10.8% 21.4% 16.9% 10.8% 8.9% 0.0% 100.0
Passengers 94 479 421 295 142 264 232 200 332 29 2488
% 3.8% 19.3% 16.9% 11.9% 5.7% 10.6% 9.3% 8.0% 13.3% 1.2% 100.0
Pedestrians 11 78 38 36 15 36 25 29 70 1 339
% 3.2% 23.0% 11.2% 10.6% 4.4% 10.6% 7.4% 8.6% 20.6% 0.3% 100.0
Motorcycle riders 0 1 8 9 7 19 16 5 2 0 67
% 0.0% 1.5% 11.9% 13.4% 10.4% 28.4% 23.9% 7.5% 3.0% 0.0% 100.0
Motorcycle pillions 0 9 5 6 4 6 7 5 1 0 43
% 0.0% 20.9% 11.6% 14.0% 9.3% 14.0% 16.3% 11.6% 2.3% 0.0% 100.0
Bicycle riders 0 60 15 23 15 26 7 6 4 0 156
% 0.0% 38.5% 9.6% 14.7% 9.6% 16.7% 4.5% 3.8% 2.6% 0.0% 100.0
Bicycle pillions 0 0 0 0 0 0 0 0 0 0 0
% 0.0% 0.0% 0.0% 0.0% 0.0% 0.0% 0.0% 0.0% 0.0% 0.0% 100.0
Total injured 105 641 1113 945 600 1181 941 662 753 31 6972
% of total 1.5% 9.2% 16.0% 13.6% 8.6% 16.9% 13.5% 9.5% 10.8% 0.4% 100.0
Table 2F: Road traffic casualties Queensland 2000by road user type and age group*
Persons injured by age goup
Road user type 0-4 5-16 17-20 21-25 26-29 30-39 40-49 50-59 60 & Notyears years years years years years years years years stated Total
Drivers 0 42 1320 1218 854 1638 1238 867 816 4 7997
% 0.0% 0.5% 16.5% 15.2% 10.7% 20.5% 15.5% 10.8% 10.2% 0.1% 100.0
Passengers 178 850 760 525 266 448 352 260 418 48 4105
% 4.3% 20.7% 18.5% 12.8% 6.5% 10.9% 8.6% 6.3% 10.2% 1.2% 100.0
Pedestrians 41 211 92 105 52 107 63 71 130 9 881
% 4.7% 24.0% 10.4% 11.9% 5.9% 12.1% 7.2% 8.1% 14.8% 1.0% 100.0
Motorcycle riders 0 23 109 192 135 262 173 66 24 2 986
% 0.0% 2.3% 11.1% 19.5% 13.7% 26.6% 17.5% 6.7% 2.4% 0.2% 100.0
Motorcycle pillions 1 18 14 8 7 9 10 5 1 1 74
% 1.4% 24.3% 18.9% 10.8% 9.5% 12.2% 13.5% 6.8% 1.4% 1.4% 100.0
Bicycle riders 4 290 76 76 74 125 73 38 19 6 781
% 0.5% 37.1% 9.7% 9.7% 9.5% 16.0% 9.3% 4.9% 2.4% 0.8% 100.0
Bicycle pillions 0 4 0 0 0 0 0 0 0 0 4
% 0.0% 100.0% 0.0% 0.0% 0.0% 0.0% 0.0% 0.0% 0.0% 0.0% 100.0
Total injured 224 1438 2371 2124 1388 2589 1909 1307 1408 70 14828
% of total 1.5% 9.7% 16.0% 14.3% 9.4% 17.5% 12.9% 8.8% 9.5% 0.5% 100.0
* Includes casualties of unknown gender
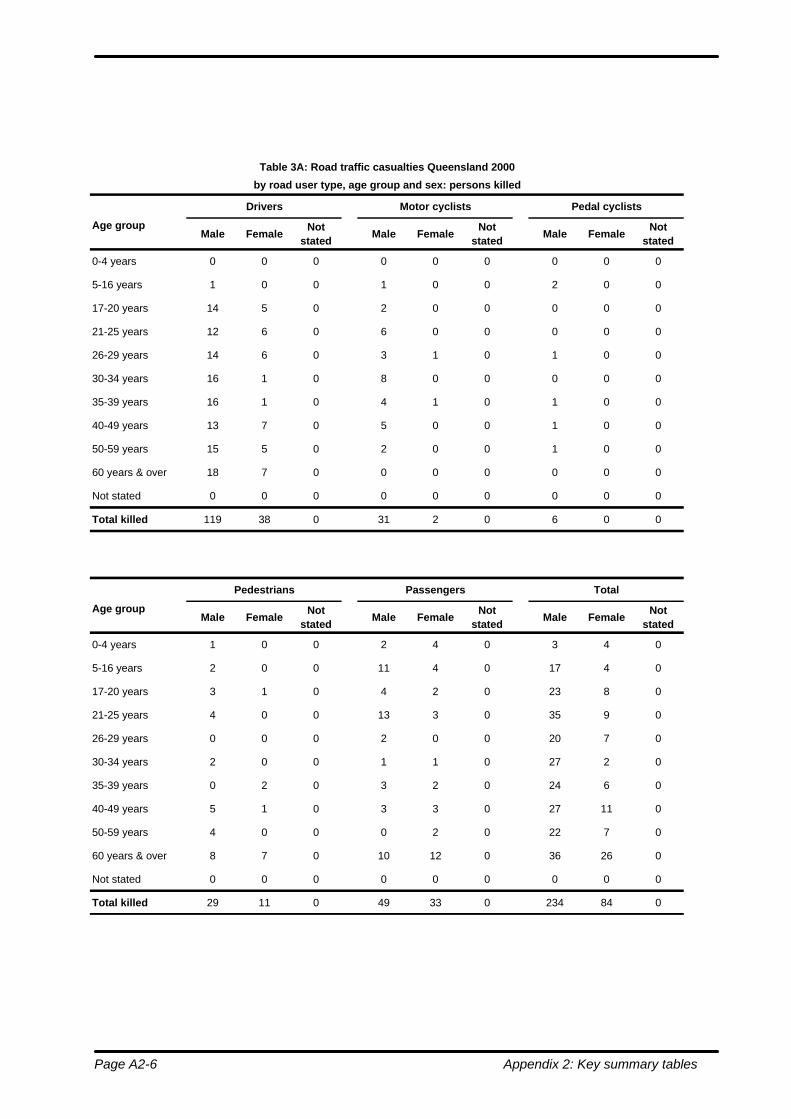
Page A2-6 Appendix 2: Key summary tables
Table 3A: Road traffic casualties Queensland 2000
by road user type, age group and sex: persons killed
Drivers Motor cyclists Pedal cyclists
Age groupMale Female
Not stated
Male FemaleNot
statedMale Female
Not stated
0-4 years 0 0 0 0 0 0 0 0 0
5-16 years 1 0 0 1 0 0 2 0 0
17-20 years 14 5 0 2 0 0 0 0 0
21-25 years 12 6 0 6 0 0 0 0 0
26-29 years 14 6 0 3 1 0 1 0 0
30-34 years 16 1 0 8 0 0 0 0 0
35-39 years 16 1 0 4 1 0 1 0 0
40-49 years 13 7 0 5 0 0 1 0 0
50-59 years 15 5 0 2 0 0 1 0 0
60 years & over 18 7 0 0 0 0 0 0 0
Not stated 0 0 0 0 0 0 0 0 0
Total killed 119 38 0 31 2 0 6 0 0
Pedestrians Passengers Total
Age groupMale Female
Not stated
Male FemaleNot
statedMale Female
Not stated
0-4 years 1 0 0 2 4 0 3 4 0
5-16 years 2 0 0 11 4 0 17 4 0
17-20 years 3 1 0 4 2 0 23 8 0
21-25 years 4 0 0 13 3 0 35 9 0
26-29 years 0 0 0 2 0 0 20 7 0
30-34 years 2 0 0 1 1 0 27 2 0
35-39 years 0 2 0 3 2 0 24 6 0
40-49 years 5 1 0 3 3 0 27 11 0
50-59 years 4 0 0 0 2 0 22 7 0
60 years & over 8 7 0 10 12 0 36 26 0
Not stated 0 0 0 0 0 0 0 0 0
Total killed 29 11 0 49 33 0 234 84 0

Appendix 2: Key summary tables Page A2-7
Table 3B: Road traffic casualties Queensland 2000
by road user type, age group and sex: persons injured
Drivers Motor cyclists Pedal cyclists
Age groupMale Female
Not stated
Male FemaleNot
statedMale Female
Not stated
0-4 years 0 0 0 1 0 0 4 0 0
5-16 years 28 14 0 31 10 0 234 60 0
17-20 years 694 626 0 110 13 0 61 15 0
21-25 years 642 576 0 185 15 0 53 23 0
26-29 years 437 417 0 131 11 0 59 15 0
30-34 years 424 388 0 149 18 0 35 8 0
35-39 years 341 394 0 116 12 0 38 13 0
40-49 years 584 654 0 160 23 0 66 7 0
50-59 years 450 417 0 61 10 0 32 6 0
60 years & over 472 344 0 22 3 0 15 4 0
Not stated 3 1 4 3 0 0 6 0 0
Total injured 4075 3831 4 969 115 0 603 151 0
Pedestrians Passengers Total
Age groupMale Female
Not stated
Male FemaleNot
statedMale Female
Not stated
0-4 years 30 11 0 84 94 0 119 105 0
5-16 years 133 78 0 371 479 0 797 641 0
17-20 years 54 38 0 339 421 0 1258 1113 0
21-25 years 69 36 0 230 295 0 1179 945 0
26-29 years 37 15 0 124 142 0 788 600 0
30-34 years 35 15 0 103 115 0 746 544 0
35-39 years 34 19 0 70 100 0 599 538 0
40-49 years 38 25 0 120 232 0 968 941 0
50-59 years 42 29 0 60 200 0 645 662 0
60 years & over 60 70 0 86 332 0 655 753 0
Not stated 8 1 0 19 29 11 39 21 15
Total injured 540 337 0 1606 2439 11 7793 6863 15

Page A2-8 Appendix 2: Key summary tables
Table 4A: Road traffic casualties Queensland 2000Restraint details by age group: persons killed
0 - 4 5 - 16 17 - 20 21 - 25 26 - 29 30 - 39 40 - 49 50 - 59 60 years NotRestraint details years years years years years years years years & over stated Total
Fitted:
Worn 4 5 15 11 7 18 13 16 26 0 115
Not worn 1 4 5 7 8 11 6 4 6 0 52
Unknown if worn 0 3 4 7 5 9 5 2 5 0 40
Not fitted 1 3 0 1 0 1 0 0 0 0 6
Unknown 0 1 1 8 2 2 2 0 8 0 24
Not applicable 1 5 6 10 5 18 12 7 17 0 81
Total killed 7 21 31 44 27 59 38 29 62 0 318
Table 4B: Road traffic casualties Queensland 2000Restraint details by age group: persons injured
0 - 4 5 - 16 17 - 20 21 - 25 26 - 29 30 - 39 40 - 49 50 - 59 60 years NotRestraint details years years years years years years years years & over stated Total
Fitted:
Worn 155 682 1684 1381 863 1657 1320 966 1059 32 9799
Not worn 6 61 58 71 50 87 45 32 26 2 438
Unknown if worn 5 53 153 154 98 155 100 65 82 16 881
Not fitted 4 29 25 13 13 31 19 5 13 1 153
Unknown 7 56 154 118 92 144 98 57 49 21 796
Not applicable 47 557 298 387 272 515 327 182 179 23 2787
Total injured 224 1438 2372 2124 1388 2589 1909 1307 1408 95 14854

Appendix 2: Key summary tables Page A2-9
Table 5A: Road traffic casualties Queensland 2000Seat belt usage by age group: persons killed
Age group Total killed *Unknown seat belt
usageUnrestrained Restrained
0-4 5 0 2 3
5-11 3 0 2 1
12-16 7 3 2 2
17-20 25 5 5 15
21-24 23 11 4 8
25-29 24 7 10 7
30-34 14 3 3 8
35-39 18 4 6 8
40-49 24 7 4 13
50-59 21 2 4 15
60-69 12 3 1 8
70-79 19 8 3 8
80+ 13 2 2 9
Not stated 0 0 0 0
Total 208 55 48 105
Table 5B: Road traffic casualties Queensland 2000Seat belt usage by age group: persons injured
Age groupTotal seriously
injured *Unknown seat belt
usageUnrestrained Restrained
0-4 124 9 8 107
5-11 244 17 28 199
12-16 340 57 35 248
17-20 1433 228 63 1142
21-24 920 149 45 726
25-29 901 161 43 697
30-34 666 88 42 536
35-39 648 100 46 502
40-49 1057 129 42 886
50-59 734 84 24 626
60-69 453 49 15 389
70-79 332 36 4 292
80+ 129 19 4 106
Not stated 34 20 2 12
Total 8015 1146 401 6468
* Does not include occupants of buses or tractors

Page A2-10 Appendix 2: Key summary tables
Table 6: Road traffic casualties Queensland 2000Seat belt and helmet wearing details by injury severity
Road user type/safety device used Killed Seriously injured Other injury Total
Driver:
Restraint worn 77 4610 1991 6678
Fitted but not worn 38 187 49 274
No restraint fitted 1 29 6 36
Not stated 39 769 331 1139
Sub total driver 155 5595 2377 8127
Passenger:
Restraint worn 38 2320 878 3236
Fitted but not worn 14 175 27 216
No restraint fitted 5 93 25 123
Not stated 25 470 107 602
Sub total passenger 82 3058 1037 4177
Total vehicle occupants 237 8653 3414 12304
Pedal cycle rider & pillion:
Helmet worn 4 476 113 593
No helmet worn 1 108 19 128
Not stated 1 44 25 70
Total pedal cycle rider & pillion 6 628 157 791
Motorcycle cycle rider & pillion:
Helmet worn 29 826 142 997
No helmet worn 1 24 4 29
Not stated 3 49 19 71
Total motor cycle rider & pillion 33 899 165 1097

Appendix 2: Key summary tables Page A2-11
Table 7: Road traffic casualties Queensland 2000
by road user type and most severe injury sustained: persons killed
Nature of injury Drivers*Motor
cyclistsPedal
cyclistsPedestrians Passengers** Other TOTAL
Fractures
Skull & Face 9 2 0 0 4 0 15
Spine & Trunk 5 1 0 0 4 0 10
Upper Limbs 0 0 0 0 0 0 0
Lower Limbs & Mult 0 0 0 0 0 0 0
Sub-Total 14 3 0 0 8 0 25
Lacerations
Head & Face 0 0 0 0 0 0 0
Neck & Trunk 0 0 0 0 0 0 0
Upper Limbs 0 0 0 0 0 0 0
Lower Limbs 0 0 0 0 0 0 0
Sub-Total 0 0 0 0 0 0 0
Other
Intracranial 36 8 2 15 28 0 89
Concussion 0 0 0 0 0 0 0
Internal 96 19 4 23 43 0 185
Nerve/Spinal Cord Injury 0 0 0 0 0 0 0
Crush Injury 2 0 0 0 0 0 2
Blood Vessel Injury 6 0 0 2 5 0 13
Foreign Matter in Orifice 0 0 0 0 0 0 0
Burn 1 0 0 0 0 0 1
Dislocation 0 0 0 0 0 0 0
Sprain/Strain 0 0 0 0 0 0 0
Abrasions 0 0 0 0 0 0 0
Contusion 0 0 0 0 0 0 0
Shock 0 0 0 0 0 0 0
Other 2 0 0 0 1 0 3
Sub-total 143 27 6 40 77 0 293
Total fatalities 157 30 6 40 85 0 318
* Includes horse riders
** Includes pillion passengers

Page A2-12 Appendix 2: Key summary tables
Table 8A: Road traffic crashes Queensland 2000Involved controllers by road user type and age group: males only
Driver Motorcyclist Bicyclist
Age group Inv Resp Inv Resp Inv Resp
0-4 1 0 0 0 4 3
5-7 0 0 0 0 15 14
8-12 2 1 3 3 88 73
13-15 49 47 15 12 108 75
16-19 2784 2002 88 56 73 47
20-24 3109 1891 186 112 60 29
25-29 2530 1383 181 101 68 21
30-34 1924 933 150 80 57 14
35-39 1808 816 114 56 44 7
40-49 2991 1301 172 82 68 26
50-59 2224 960 69 44 33 14
60-69 1154 573 17 10 10 6
70+ 915 631 5 4 6 5
Not stated 211 165 5 4 7 5
Total 19702 10703 1005 564 641 339
Pedestrian Other road user Total
Age group Inv Resp Inv Resp Inv Resp
0-4 31 20 0 0 36 23
5-7 34 31 0 0 49 45
8-12 57 46 0 0 150 124
13-15 32 25 0 0 204 161
16-19 58 38 6 4 3009 2230
20-24 72 51 7 6 3434 2217
25-29 49 32 16 6 2844 1665
30-34 40 17 20 8 2191 1156
35-39 33 19 15 8 2014 995
40-49 44 21 33 20 3308 1569
50-59 46 23 34 20 2406 1180
60-69 28 9 11 6 1220 653
70+ 40 18 4 3 970 678
Not stated 9 9 0 0 232 190
Total 573 359 146 81 22067 12886
Legend:
Inv - Number of controllers* involved in a crash
Resp - The controller considered most responsible for the crash by police
* Controller - see definitions, Appendix 1
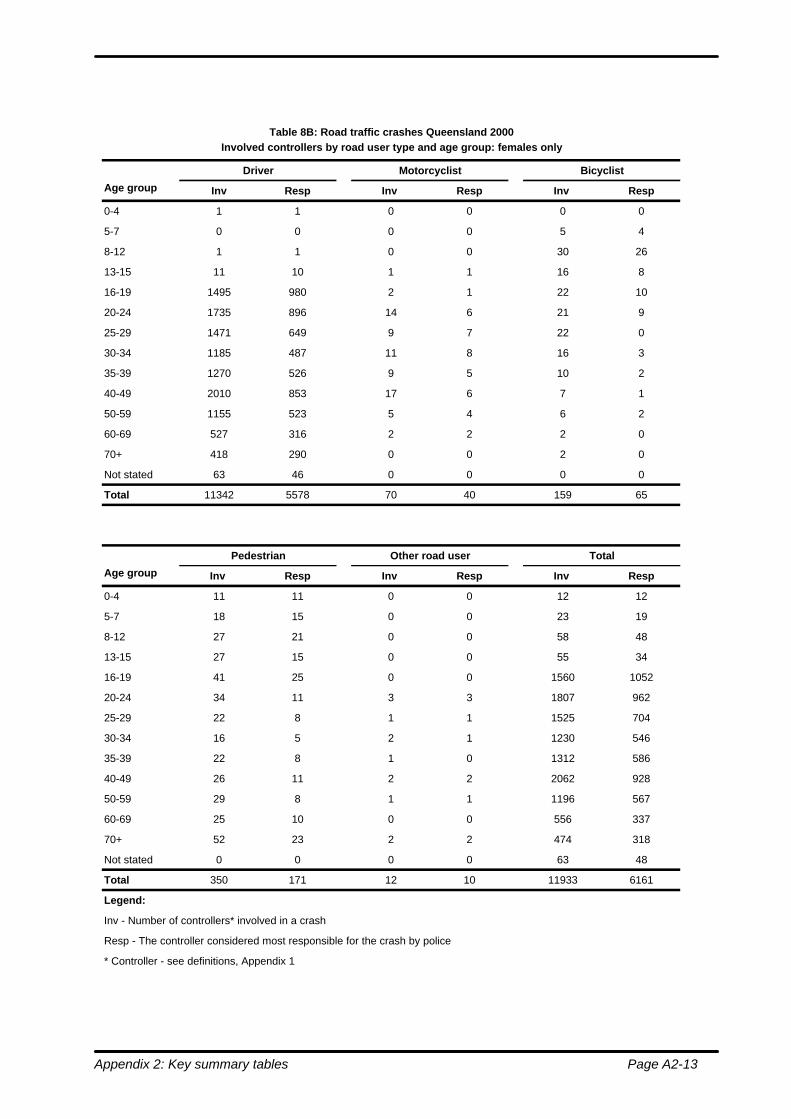
Appendix 2: Key summary tables Page A2-13
Table 8B: Road traffic crashes Queensland 2000Involved controllers by road user type and age group: females only
Driver Motorcyclist Bicyclist
Age group Inv Resp Inv Resp Inv Resp
0-4 1 1 0 0 0 0
5-7 0 0 0 0 5 4
8-12 1 1 0 0 30 26
13-15 11 10 1 1 16 8
16-19 1495 980 2 1 22 10
20-24 1735 896 14 6 21 9
25-29 1471 649 9 7 22 0
30-34 1185 487 11 8 16 3
35-39 1270 526 9 5 10 2
40-49 2010 853 17 6 7 1
50-59 1155 523 5 4 6 2
60-69 527 316 2 2 2 0
70+ 418 290 0 0 2 0
Not stated 63 46 0 0 0 0
Total 11342 5578 70 40 159 65
Pedestrian Other road user Total
Age group Inv Resp Inv Resp Inv Resp
0-4 11 11 0 0 12 12
5-7 18 15 0 0 23 19
8-12 27 21 0 0 58 48
13-15 27 15 0 0 55 34
16-19 41 25 0 0 1560 1052
20-24 34 11 3 3 1807 962
25-29 22 8 1 1 1525 704
30-34 16 5 2 1 1230 546
35-39 22 8 1 0 1312 586
40-49 26 11 2 2 2062 928
50-59 29 8 1 1 1196 567
60-69 25 10 0 0 556 337
70+ 52 23 2 2 474 318
Not stated 0 0 0 0 63 48
Total 350 171 12 10 11933 6161
Legend:
Inv - Number of controllers* involved in a crash
Resp - The controller considered most responsible for the crash by police
* Controller - see definitions, Appendix 1

Page A2-14 Appendix 2: Key summary tables
Table 8C: Road traffic crashes Queensland 2000Involved controllers by road user type and age group: persons only
Driver Motorcyclist Bicyclist
Age group Inv Resp Inv Resp Inv Resp
0-4 2 1 2 2 1 0
5-7 0 0 0 0 20 18
8-12 3 2 3 3 118 99
13-15 60 57 16 13 124 83
16-19 4279 2982 90 57 95 57
20-24 4844 2787 200 118 81 38
25-29 4001 2032 190 108 90 21
30-34 3109 1420 161 88 73 17
35-39 3078 1342 123 61 54 9
40-49 5001 2154 189 88 75 27
50-59 3379 1483 74 48 39 16
60-69 1681 889 19 12 12 6
70+ 1333 921 5 4 8 5
Not stated 274 211 5 4 7 5
Total 31044 16281 1075 604 800 404
Pedestrian Other road user Total
Age group Inv Resp Inv Resp Inv Resp
0-4 42 31 2 2 1 0
5-7 52 46 0 0 72 64
8-12 84 67 0 0 208 172
13-15 59 40 0 0 259 195
16-19 99 63 6 4 4569 3282
20-24 106 62 10 9 5241 3179
25-29 71 40 17 7 4369 2369
30-34 56 22 22 9 3421 1702
35-39 55 27 16 8 3326 1581
40-49 70 32 35 22 5370 2497
50-59 75 31 35 21 3602 1747
60-69 53 19 11 6 1776 990
70+ 92 41 6 5 1444 996
Not stated 9 9 0 0 295 238
Total 923 530 158 91 34000 19047
Legend:
Inv - Number of controllers* involved in a crash
Resp - The controller considered most responsible for the crash by police
* Controller - see definitions, Appendix 1

Appendix 2: Key summary tables Page A2-15
Table 9B: Blood alcohol analysis Queensland 2000Controllers* injured in road traffic crashes
Blood alcohol analysis DriversMotor
cyclistsPedal
cyclistsPedestrians Other Total
No test required 4350 593 703 850 2 6498
Refused test 23 4 1 0 0 28
Negative 3148 343 72 29 1 3593
Positive
.01 - .04 41 5 0 0 0 46
.05 - .07 47 4 0 0 0 51
.08 - .14 156 20 0 2 0 178
.15 - .19 140 10 2 0 0 152
.20 - .24 61 6 1 1 0 69
.25 & over 31 1 2 0 0 34
Total positive 476 46 5 3 0 530
Total controllers 7997 986 781 882 3 10649
Total tested 3624 389 77 32 0 4123
% positive 13.1 11.8 6.5 9.4 0.0 12.9
* Controller - for definition see Glossary, Appendix 1
Table 9A: Blood alcohol analysis Queensland 2000Controllers* killed in road traffic crashes
Blood alcohol analysis DriversMotor
cyclistsPedal
cyclistsPedestrians Other Total
No blood analysis 21 1 1 11 0 34
Negative 88 18 5 16 0 127
Positive
.01 - .04 12 1 0 1 0 14
.05 - .07 2 0 0 1 0 3
.08 - .14 8 3 0 1 0 12
.15 - .19 8 3 0 1 0 12
.20 - .24 10 2 0 6 0 18
.25 & over 8 2 0 3 0 13
Total positive 48 7 0 17 0 52
Total controllers 157 26 6 44 0 213
Total tested 136 25 5 33 0 179
% positive 35.3 28.0 0.0 51.5 0.0 29.1

Page A2-16 Appendix 2: Key summary tables
Table 10A: Blood alcohol analysis by age group Queensland 2000Controllers* killed in road traffic crashes
Blood alcohol analysisUnder 17
years17 - 20 years
21 - 24 years
25 - 29 years
30 - 39 years
40 - 49 years
50 years & over
Total
Failure to supply 0 0 0 0 0 0 0 0
Negative 4 11 15 11 24 15 47 127
Positive 2 17 12 6 19 10 36 102
.01 - .04 0 4 2 3 1 1 3 14
.05 - .07 1 1 0 1 0 0 0 3
.08 - .14 0 4 1 1 5 0 1 12
.15 - .19 0 0 1 2 5 3 1 12
.20 - .24 0 1 3 1 6 6 1 18
.25 & over 0 0 2 1 4 4 2 13
Total positive 1 10 9 9 21 14 8 72
Total tested for alcohol 5 21 24 20 45 29 55 199
% positive 20.0 47.6 37.5 45.0 46.7 48.3 14.5 36.2
* Controller - for definition see Glossary, Appendix 1
Table 10B: Blood alcohol analysis by age group Queensland 2000Controllers* not killed but may have been injured in road traffic crashes
Blood alcohol analysisUnder 17
years17 - 20 years
21 - 24 years
25 - 29 years
30 - 39 years
40 - 49 years
50 years & over
Total
Failure to supply 3 8 12 15 19 9 3 69
Negative 123 2782 2251 1491 2930 2344 2929 14851
Positive
.01 - .04 4 35 24 15 25 16 17 136
.05 - .07 8 40 32 17 23 9 11 140
.08 - .14 4 117 111 58 97 48 25 460
.15 - .19 2 66 85 56 67 40 21 337
.20 - .24 1 15 30 20 39 28 8 141
.25 & over 0 12 18 9 20 23 17 99
Total positive 19 285 300 175 271 164 99 1313
Total tested for alcohol 142 3067 2551 1666 3201 2508 3028 16164
% positive 13.4 9.3 11.8 10.5 8.5 6.5 3.3 8.1
* Controller - for definition see Glossary, Appendix 1
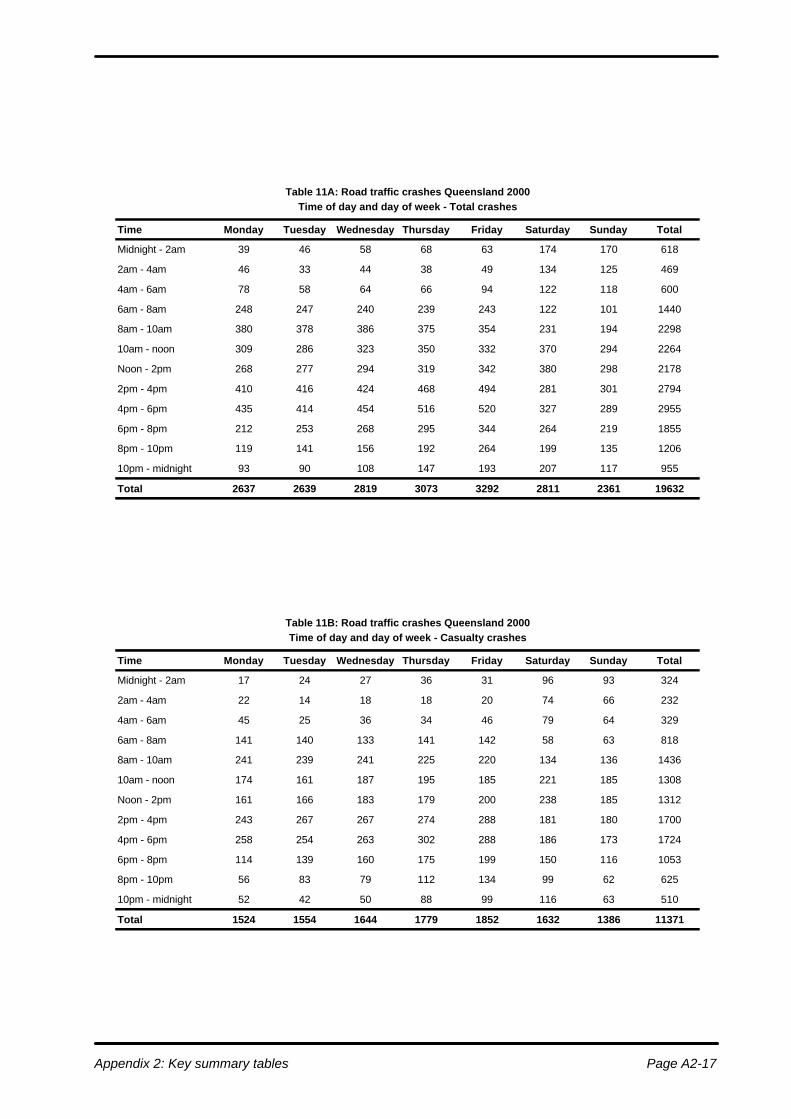
Appendix 2: Key summary tables Page A2-17
Table 11A: Road traffic crashes Queensland 2000Time of day and day of week - Total crashes
Time Monday Tuesday Wednesday Thursday Friday Saturday Sunday Total
Midnight - 2am 39 46 58 68 63 174 170 618
2am - 4am 46 33 44 38 49 134 125 469
4am - 6am 78 58 64 66 94 122 118 600
6am - 8am 248 247 240 239 243 122 101 1440
8am - 10am 380 378 386 375 354 231 194 2298
10am - noon 309 286 323 350 332 370 294 2264
Noon - 2pm 268 277 294 319 342 380 298 2178
2pm - 4pm 410 416 424 468 494 281 301 2794
4pm - 6pm 435 414 454 516 520 327 289 2955
6pm - 8pm 212 253 268 295 344 264 219 1855
8pm - 10pm 119 141 156 192 264 199 135 1206
10pm - midnight 93 90 108 147 193 207 117 955
Total 2637 2639 2819 3073 3292 2811 2361 19632
Table 11B: Road traffic crashes Queensland 2000Time of day and day of week - Casualty crashes
Time Monday Tuesday Wednesday Thursday Friday Saturday Sunday Total
Midnight - 2am 17 24 27 36 31 96 93 324
2am - 4am 22 14 18 18 20 74 66 232
4am - 6am 45 25 36 34 46 79 64 329
6am - 8am 141 140 133 141 142 58 63 818
8am - 10am 241 239 241 225 220 134 136 1436
10am - noon 174 161 187 195 185 221 185 1308
Noon - 2pm 161 166 183 179 200 238 185 1312
2pm - 4pm 243 267 267 274 288 181 180 1700
4pm - 6pm 258 254 263 302 288 186 173 1724
6pm - 8pm 114 139 160 175 199 150 116 1053
8pm - 10pm 56 83 79 112 134 99 62 625
10pm - midnight 52 42 50 88 99 116 63 510
Total 1524 1554 1644 1779 1852 1632 1386 11371
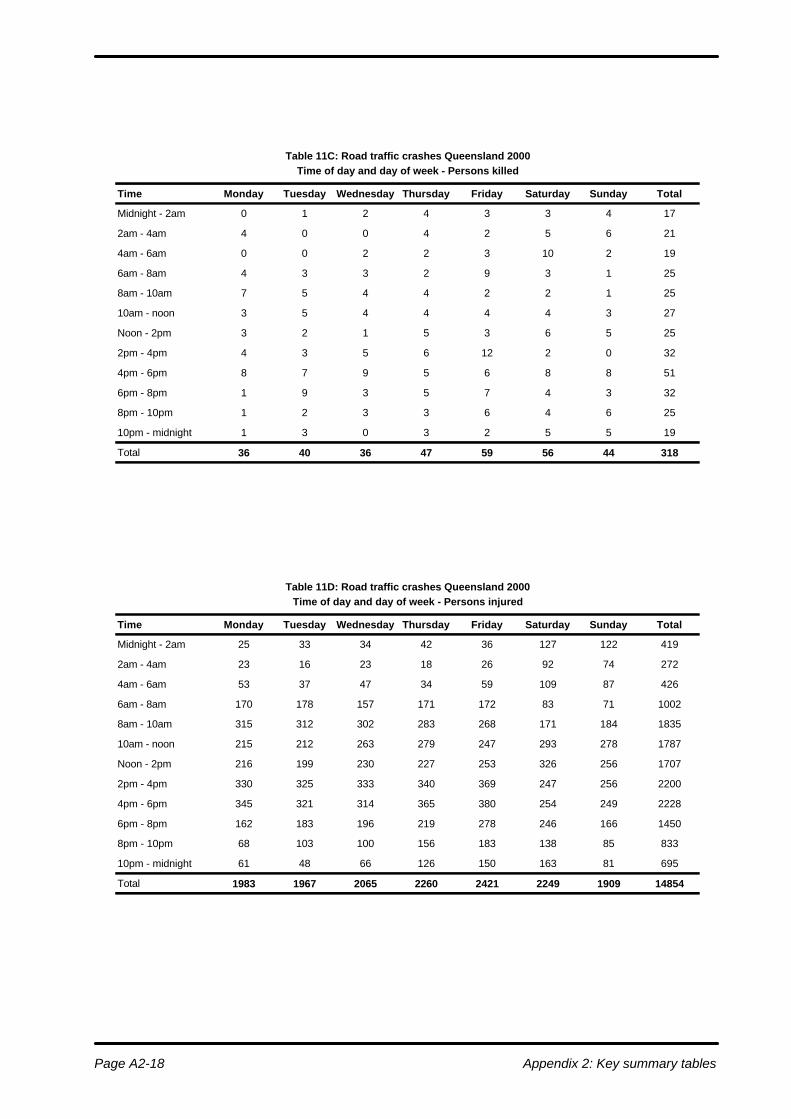
Page A2-18 Appendix 2: Key summary tables
Table 11C: Road traffic crashes Queensland 2000Time of day and day of week - Persons killed
Time Monday Tuesday Wednesday Thursday Friday Saturday Sunday Total
Midnight - 2am 0 1 2 4 3 3 4 17
2am - 4am 4 0 0 4 2 5 6 21
4am - 6am 0 0 2 2 3 10 2 19
6am - 8am 4 3 3 2 9 3 1 25
8am - 10am 7 5 4 4 2 2 1 25
10am - noon 3 5 4 4 4 4 3 27
Noon - 2pm 3 2 1 5 3 6 5 25
2pm - 4pm 4 3 5 6 12 2 0 32
4pm - 6pm 8 7 9 5 6 8 8 51
6pm - 8pm 1 9 3 5 7 4 3 32
8pm - 10pm 1 2 3 3 6 4 6 25
10pm - midnight 1 3 0 3 2 5 5 19
Total 36 40 36 47 59 56 44 318
Table 11D: Road traffic crashes Queensland 2000Time of day and day of week - Persons injured
Time Monday Tuesday Wednesday Thursday Friday Saturday Sunday Total
Midnight - 2am 25 33 34 42 36 127 122 419
2am - 4am 23 16 23 18 26 92 74 272
4am - 6am 53 37 47 34 59 109 87 426
6am - 8am 170 178 157 171 172 83 71 1002
8am - 10am 315 312 302 283 268 171 184 1835
10am - noon 215 212 263 279 247 293 278 1787
Noon - 2pm 216 199 230 227 253 326 256 1707
2pm - 4pm 330 325 333 340 369 247 256 2200
4pm - 6pm 345 321 314 365 380 254 249 2228
6pm - 8pm 162 183 196 219 278 246 166 1450
8pm - 10pm 68 103 100 156 183 138 85 833
10pm - midnight 61 48 66 126 150 163 81 695
Total 1983 1967 2065 2260 2421 2249 1909 14854
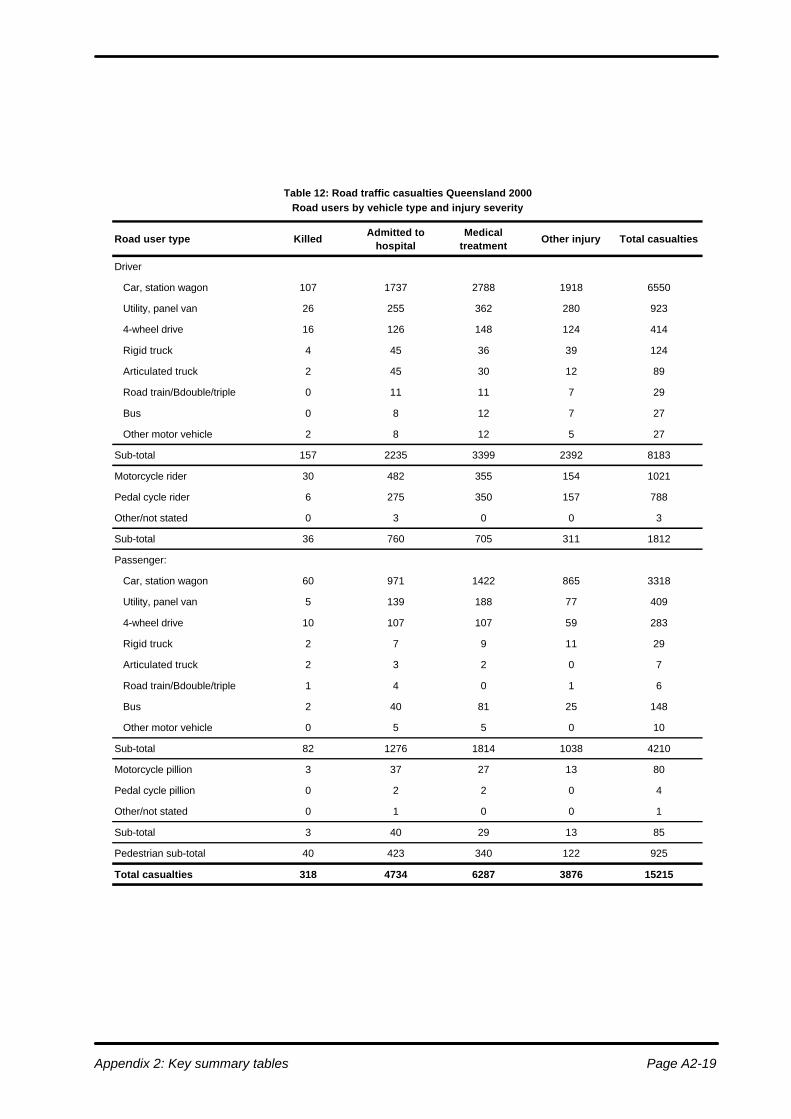
Appendix 2: Key summary tables Page A2-19
Table 12: Road traffic casualties Queensland 2000Road users by vehicle type and injury severity
Road user type KilledAdmitted to
hospitalMedical
treatmentOther injury Total casualties
Driver
Car, station wagon 107 1737 2788 1918 6550
Utility, panel van 26 255 362 280 923
4-wheel drive 16 126 148 124 414
Rigid truck 4 45 36 39 124
Articulated truck 2 45 30 12 89
Road train/Bdouble/triple 0 11 11 7 29
Bus 0 8 12 7 27
Other motor vehicle 2 8 12 5 27
Sub-total 157 2235 3399 2392 8183
Motorcycle rider 30 482 355 154 1021
Pedal cycle rider 6 275 350 157 788
Other/not stated 0 3 0 0 3
Sub-total 36 760 705 311 1812
Passenger:
Car, station wagon 60 971 1422 865 3318
Utility, panel van 5 139 188 77 409
4-wheel drive 10 107 107 59 283
Rigid truck 2 7 9 11 29
Articulated truck 2 3 2 0 7
Road train/Bdouble/triple 1 4 0 1 6
Bus 2 40 81 25 148
Other motor vehicle 0 5 5 0 10
Sub-total 82 1276 1814 1038 4210
Motorcycle pillion 3 37 27 13 80
Pedal cycle pillion 0 2 2 0 4
Other/not stated 0 1 0 0 1
Sub-total 3 40 29 13 85
Pedestrian sub-total 40 423 340 122 925
Total casualties 318 4734 6287 3876 15215

Page A2-20 Appendix 2: Key summary tables
Table 13: Road traffic crashes Queensland 2000Type of unit most responsible by crash severity
Crash severity
Type of unitF % H % M % O % All crashes %
Car/station wagon 139 50 2208 59 3119 67 1911 71 13621 69
Utility, panel van 35 13 369 10 504 11 251 9 2166 11
Rigid truck 7 3 72 2 113 2 81 3 503 3
Articulated vehicle 7 3 68 2 72 2 36 1 337 2
Omnibus 3 1 27 1 51 1 21 1 150 1
Motorcycle 24 9 321 9 189 4 61 2 606 3
Tractor 2 1 15 0 12 0 18 1 89 0
Towed device (Caravan) 0 0 0 0 2 0 1 0 16 0
Bicycle 5 2 174 5 156 3 68 3 404 2
Pedestrian 31 11 278 7 166 4 53 2 528 3
Animal - ridden 0 0 4 0 0 0 0 0 5 0
Animal - stock 0 0 0 0 0 0 0 0 0 0
Animal - other 0 0 0 0 0 0 0 0 0 0
Railway rolling stock 0 0 0 0 0 0 0 0 0 0
4-wheel drive 20 7 212 6 247 5 166 6 1088 6
Road train/Bdouble/triple 2 1 15 0 10 0 9 0 84 0
Other 0 0 0 0 0 0 0 0 0 0
Not stated 1 0 4 0 4 0 5 0 32 0
Total number of crashes 276 101 3767 100 4645 99 2681 100 19629 100
Injury severity
Type of unitK % Hl % Ml % Mm %
Total casualties
%
Car/station wagon 168 53 2872 61 4296 69 2799 72 10135 67
Utility, panel van 37 12 474 10 676 11 374 10 1561 10
Rigid truck 7 2 91 2 161 3 112 3 371 2
Articulated vehicle 8 3 74 2 87 1 49 1 218 1
Omnibus 4 1 63 1 102 2 35 1 204 1
Motorcycle 26 8 347 7 217 3 73 2 663 4
Tractor 2 1 20 0 14 0 21 1 57 0
Towed device (Caravan) 0 0 0 0 3 0 1 0 4 0
Bicycle 5 2 179 4 160 3 81 2 425 3
Pedestrian 31 10 287 6 177 3 58 2 553 4
Animal - ridden 0 0 4 0 0 0 0 0 4 0
Animal - stock 0 0 0 0 0 0 0 0 0
Animal - other 0 0 0 0 0 0 0 0 0
Railway rolling stock 0 0 0 0 0 0 0 0 0
4-wheel drive 27 8 292 6 353 6 246 6 918 6
Road train/Bdouble/triple 2 1 19 0 13 0 9 0 43 0
Other 0 0 0 0 0 0 0 0 0
Not stated 1 0 4 0 5 0 5 0 15 0
Total number of crashes 318 100 4726 100 6264 100 3863 100 15171 100
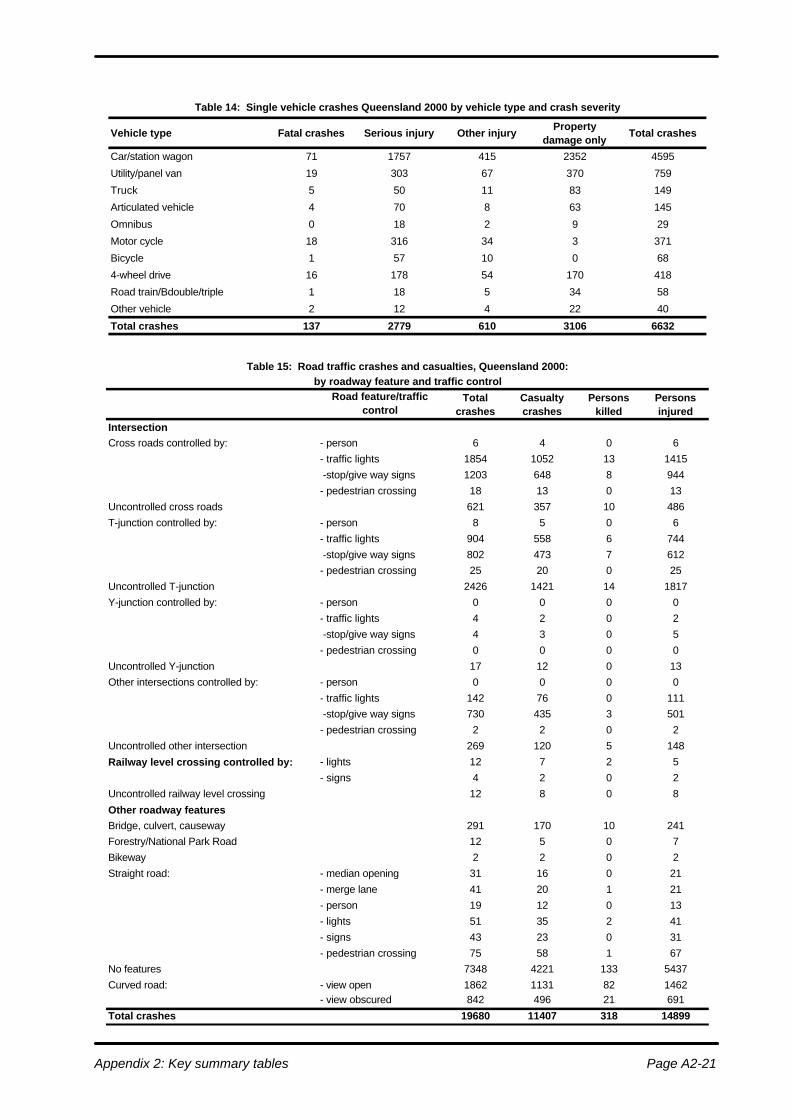
Appendix 2: Key summary tables Page A2-21
Table 15: Road traffic crashes and casualties, Queensland 2000:by roadway feature and traffic control
Road feature/traffic control
Total crashes
Casualty crashes
Persons killed
Persons injured
IntersectionCross roads controlled by: - person 6 4 0 6
- traffic lights 1854 1052 13 1415
-stop/give way signs 1203 648 8 944
- pedestrian crossing 18 13 0 13
Uncontrolled cross roads 621 357 10 486
T-junction controlled by: - person 8 5 0 6
- traffic lights 904 558 6 744
-stop/give way signs 802 473 7 612- pedestrian crossing 25 20 0 25
Uncontrolled T-junction 2426 1421 14 1817
Y-junction controlled by: - person 0 0 0 0
- traffic lights 4 2 0 2
-stop/give way signs 4 3 0 5
- pedestrian crossing 0 0 0 0
Uncontrolled Y-junction 17 12 0 13
Other intersections controlled by: - person 0 0 0 0
- traffic lights 142 76 0 111 -stop/give way signs 730 435 3 501
- pedestrian crossing 2 2 0 2
Uncontrolled other intersection 269 120 5 148
Railway level crossing controlled by: - lights 12 7 2 5
- signs 4 2 0 2
Uncontrolled railway level crossing 12 8 0 8
Other roadway featuresBridge, culvert, causeway 291 170 10 241Forestry/National Park Road 12 5 0 7
Bikeway 2 2 0 2
Straight road: - median opening 31 16 0 21
- merge lane 41 20 1 21
- person 19 12 0 13
- lights 51 35 2 41
- signs 43 23 0 31
- pedestrian crossing 75 58 1 67No features 7348 4221 133 5437
Curved road: - view open 1862 1131 82 1462- view obscured 842 496 21 691
Total crashes 19680 11407 318 14899
Table 14: Single vehicle crashes Queensland 2000 by vehicle type and crash severity
Vehicle type Fatal crashes Serious injury Other injuryProperty
damage onlyTotal crashes
Car/station wagon 71 1757 415 2352 4595
Utility/panel van 19 303 67 370 759
Truck 5 50 11 83 149
Articulated vehicle 4 70 8 63 145
Omnibus 0 18 2 9 29
Motor cycle 18 316 34 3 371
Bicycle 1 57 10 0 68
4-wheel drive 16 178 54 170 418
Road train/Bdouble/triple 1 18 5 34 58
Other vehicle 2 12 4 22 40
Total crashes 137 2779 610 3106 6632
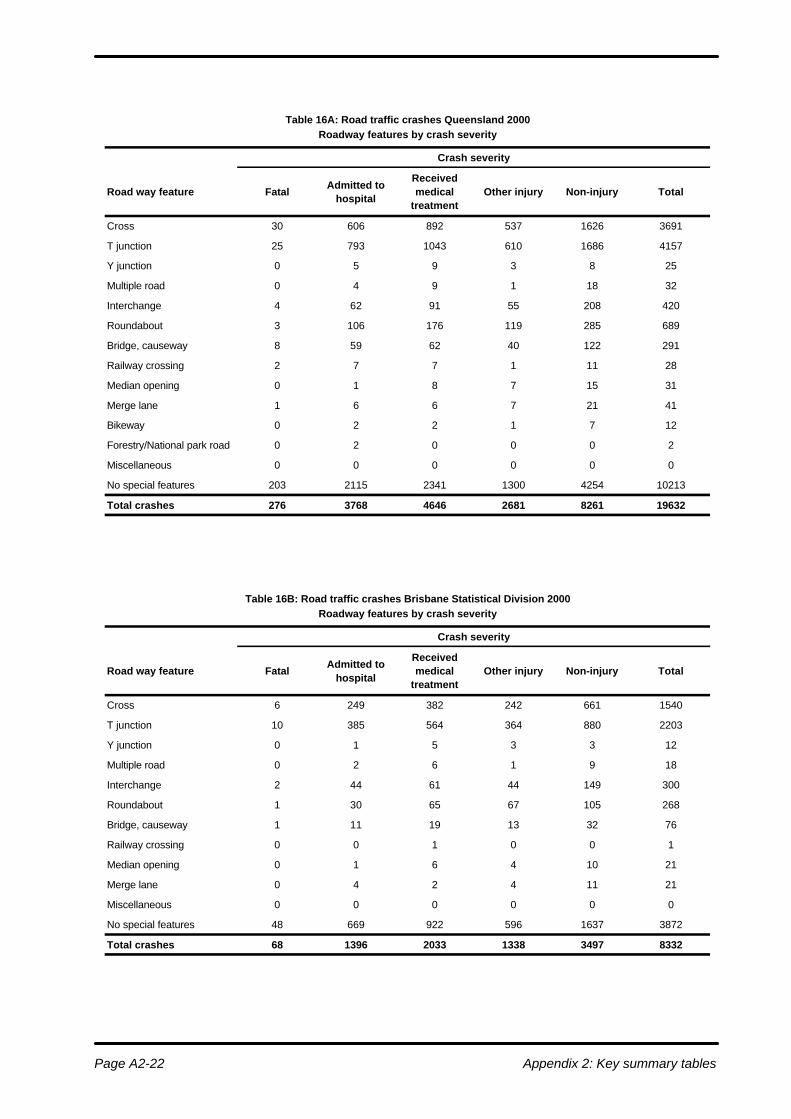
Page A2-22 Appendix 2: Key summary tables
Table 16A: Road traffic crashes Queensland 2000Roadway features by crash severity
Crash severity
Road way feature FatalAdmitted to
hospital
Received medical
treatmentOther injury Non-injury Total
Cross 30 606 892 537 1626 3691
T junction 25 793 1043 610 1686 4157
Y junction 0 5 9 3 8 25
Multiple road 0 4 9 1 18 32
Interchange 4 62 91 55 208 420
Roundabout 3 106 176 119 285 689
Bridge, causeway 8 59 62 40 122 291
Railway crossing 2 7 7 1 11 28
Median opening 0 1 8 7 15 31
Merge lane 1 6 6 7 21 41
Bikeway 0 2 2 1 7 12
Forestry/National park road 0 2 0 0 0 2
Miscellaneous 0 0 0 0 0 0
No special features 203 2115 2341 1300 4254 10213
Total crashes 276 3768 4646 2681 8261 19632
Table 16B: Road traffic crashes Brisbane Statistical Division 2000Roadway features by crash severity
Crash severity
Road way feature FatalAdmitted to
hospital
Received medical
treatmentOther injury Non-injury Total
Cross 6 249 382 242 661 1540
T junction 10 385 564 364 880 2203
Y junction 0 1 5 3 3 12
Multiple road 0 2 6 1 9 18
Interchange 2 44 61 44 149 300
Roundabout 1 30 65 67 105 268
Bridge, causeway 1 11 19 13 32 76
Railway crossing 0 0 1 0 0 1
Median opening 0 1 6 4 10 21
Merge lane 0 4 2 4 11 21
Miscellaneous 0 0 0 0 0 0
No special features 48 669 922 596 1637 3872
Total crashes 68 1396 2033 1338 3497 8332

Appendix 2: Key summary tables Page A2-23
Table 17: Road traffic crashes and casualties Queensland 2000by region, crash severity and gender
Crashes and casualties Brisbane City Rest of BSD*Provincial
citiesRest of Qld Total Qld
Crashes
Fatal crashes 33 35 72 136 276
Serious injury crashes 874 522 1138 1241 3775
Other injury crashes 2277 1094 2168 1817 7356
Total casualty crashes 3184 1651 3378 3194 11407
Property damage only crashes 2352 1145 2387 2389 8273
Total crashes 5536 2796 5765 5583 19680
Casualties
Fatalities
Males 28 31 62 113 234
Females 7 7 21 49 84
Not stated 0 0 0 0 0
Total fatalities 35 38 83 162 318
Seriously injured
Males 1422 799 1743 1850 5814
Females 1302 804 1528 1563 5197
Not stated 5 1 0 6 12
Total seriously injured 2729 1604 3271 3419 11023
Other injured
Males 701 298 553 512 2064
Females 611 266 517 404 1798
Not stated 6 1 5 2 14
Total other injured 1318 565 1075 918 3876
Total casualties
Males 2151 1128 2358 2475 8112
Females 1920 1077 2066 2016 7079
Not stated 11 2 5 8 26
Total casualties 4082 2207 4429 4499 15217
* Brisbane Statistical Division

Page A2-24 Appendix 2: Key summary tables
Table 18: Road traffic crashes and casualties Queensland 2000by Local Government Area
Crashes Persons
Local Government Area
Drivers and passengers
PedestriansMotorcycle riders and
pillions
Pedal cycle riders
Others
Total reported
Involving casualties
K I K I K I K I K I
Aramac Shire Council 6 3 0 3 0 0 0 1 0 0 0 0
Atherton Shire Council 40 25 0 44 0 1 0 1 0 2 0 0
Balonne Shire Council 38 25 3 20 0 4 0 2 0 1 0 0
Banana Shire Council 96 58 1 55 0 3 0 5 0 7 0 0
Barcaldine Shire Council 10 6 0 7 0 0 0 1 0 0 0 0
Barcoo Shire Council 8 5 1 4 0 0 0 2 0 0 0 0
Bauhinia Shire Council 18 14 1 15 0 0 0 0 0 1 0 0
Beaudesert Shire Council 231 141 3 189 0 2 1 17 0 1 0 0
Belyando Shire Council 32 17 0 15 0 1 0 1 0 1 0 0
Bendemere Shire Council 9 7 0 11 0 0 0 0 0 0 0 0
Biggenden Shire Council 13 4 0 5 0 0 0 0 0 0 0 0
Blackall Shire Council 8 7 0 6 0 2 0 1 0 0 0 0
Boonah Shire Council 63 32 0 38 0 0 1 2 0 1 0 0
Booringa Shire Council 12 10 0 14 0 0 0 0 0 0 0 0
Boulia Shire Council 8 6 0 16 0 0 0 0 0 0 0 0
Bowen Shire Council 58 34 0 33 0 2 0 4 0 1 0 0
Brisbane City Council 5536 3184 20 3290 9 290 6 263 0 186 0 0
Broadsound Shire Council 47 29 4 44 0 0 0 1 0 0 0 0
Bulloo Shire Council 3 2 0 3 0 0 0 0 0 0 0 0
Bundaberg City Council 245 133 1 101 2 15 0 22 0 15 0 0
Bungil Shire Council 34 16 0 19 0 0 0 0 0 0 0 0
Burdekin Shire Council 101 53 5 63 0 4 0 4 0 2 0 0
Burke Shire Council 13 9 1 16 1 0 0 0 0 0 0 0
Burnett Shire Council 65 34 3 44 0 2 0 5 0 2 0 0
Caboolture Shire Council 561 333 5 351 5 23 0 26 1 25 0 0
Cairns City Council 713 386 7 331 1 41 1 41 1 64 0 0
Calliope Shire Council 96 59 7 83 1 1 0 4 0 0 0 0
Caloundra City Council 428 238 6 265 0 21 0 21 0 15 0 0
Cambooya Shire Council 23 11 0 13 0 0 0 0 0 0 0 0
Cardwell Shire Council 65 39 1 38 1 3 0 2 0 1 0 0
Carpentaria Shire Council 12 5 1 4 0 1 0 0 0 0 0 0
Charters Towers City Council 29 14 0 21 0 1 0 0 0 0 0 0
Chinchilla Shire Council 28 17 0 25 0 0 0 0 0 0 0 0
Clifton Shire Council 8 5 0 5 0 0 0 0 0 0 0 0
Cloncurry Shire Council 22 13 1 11 0 2 0 2 0 0 0 0
Cook Shire Council 55 45 2 69 0 2 0 3 0 0 0 0
Cooloola Shire Council 239 120 5 149 0 5 0 13 0 3 0 0
Crows Nest Shire Council 43 22 2 32 0 2 0 1 0 0 0 0
Croydon Shire Council 1 0 0 0 0 0 0 0 0 0 0 0
Dalby Town Council 30 17 0 25 0 1 0 3 0 0 0 0
Dalrymple Shire Council 57 33 6 49 0 0 1 3 0 0 0 0
Diamantina Shire Council 10 8 0 12 0 0 0 1 0 0 0 0
Douglas Shire Council 88 46 6 48 1 3 0 6 0 5 0 0
Duaringa Shire Council 43 28 1 42 0 0 0 0 0 1 0 0
Eacham Shire Council 36 19 2 19 0 1 1 0 0 1 0 0
Eidsvold Shire Council 11 9 0 9 0 1 0 0 0 0 0 0
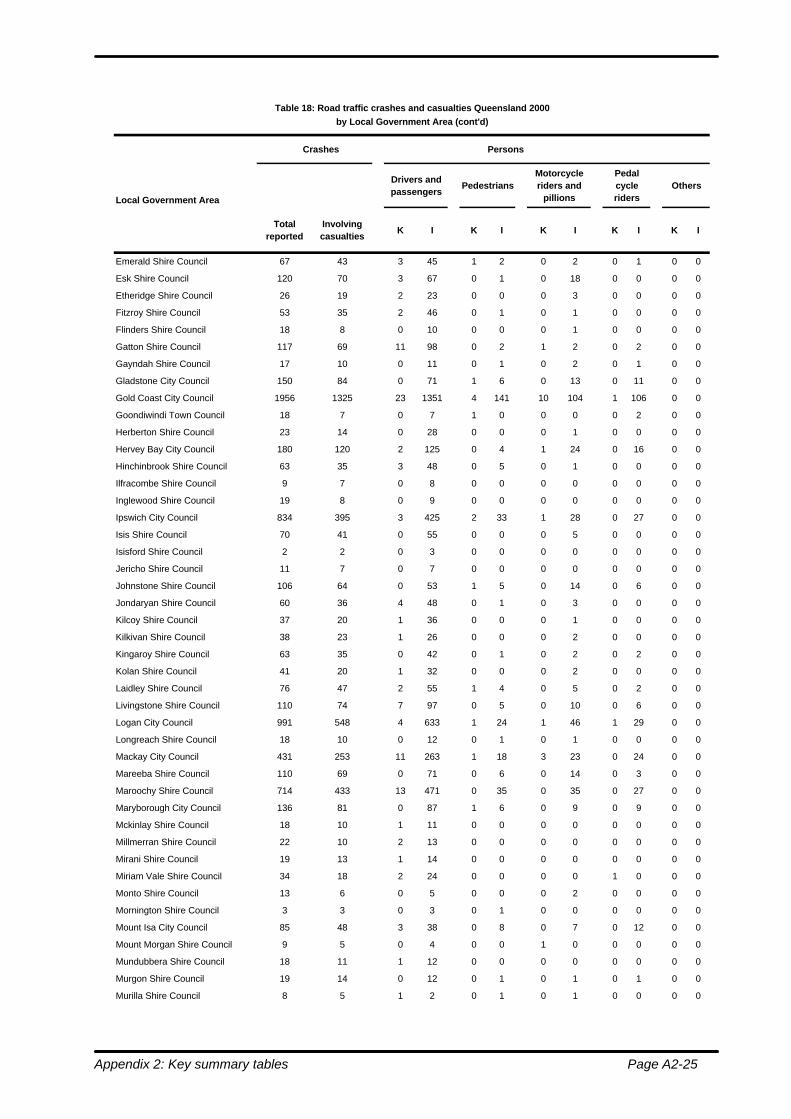
Appendix 2: Key summary tables Page A2-25
Table 18: Road traffic crashes and casualties Queensland 2000by Local Government Area (cont'd)
Crashes Persons
Local Government Area
Drivers and passengers
PedestriansMotorcycle riders and
pillions
Pedal cycle riders
Others
Total reported
Involving casualties
K I K I K I K I K I
Emerald Shire Council 67 43 3 45 1 2 0 2 0 1 0 0
Esk Shire Council 120 70 3 67 0 1 0 18 0 0 0 0
Etheridge Shire Council 26 19 2 23 0 0 0 3 0 0 0 0
Fitzroy Shire Council 53 35 2 46 0 1 0 1 0 0 0 0
Flinders Shire Council 18 8 0 10 0 0 0 1 0 0 0 0
Gatton Shire Council 117 69 11 98 0 2 1 2 0 2 0 0
Gayndah Shire Council 17 10 0 11 0 1 0 2 0 1 0 0
Gladstone City Council 150 84 0 71 1 6 0 13 0 11 0 0
Gold Coast City Council 1956 1325 23 1351 4 141 10 104 1 106 0 0
Goondiwindi Town Council 18 7 0 7 1 0 0 0 0 2 0 0
Herberton Shire Council 23 14 0 28 0 0 0 1 0 0 0 0
Hervey Bay City Council 180 120 2 125 0 4 1 24 0 16 0 0
Hinchinbrook Shire Council 63 35 3 48 0 5 0 1 0 0 0 0
Ilfracombe Shire Council 9 7 0 8 0 0 0 0 0 0 0 0
Inglewood Shire Council 19 8 0 9 0 0 0 0 0 0 0 0
Ipswich City Council 834 395 3 425 2 33 1 28 0 27 0 0
Isis Shire Council 70 41 0 55 0 0 0 5 0 0 0 0
Isisford Shire Council 2 2 0 3 0 0 0 0 0 0 0 0
Jericho Shire Council 11 7 0 7 0 0 0 0 0 0 0 0
Johnstone Shire Council 106 64 0 53 1 5 0 14 0 6 0 0
Jondaryan Shire Council 60 36 4 48 0 1 0 3 0 0 0 0
Kilcoy Shire Council 37 20 1 36 0 0 0 1 0 0 0 0
Kilkivan Shire Council 38 23 1 26 0 0 0 2 0 0 0 0
Kingaroy Shire Council 63 35 0 42 0 1 0 2 0 2 0 0
Kolan Shire Council 41 20 1 32 0 0 0 2 0 0 0 0
Laidley Shire Council 76 47 2 55 1 4 0 5 0 2 0 0
Livingstone Shire Council 110 74 7 97 0 5 0 10 0 6 0 0
Logan City Council 991 548 4 633 1 24 1 46 1 29 0 0
Longreach Shire Council 18 10 0 12 0 1 0 1 0 0 0 0
Mackay City Council 431 253 11 263 1 18 3 23 0 24 0 0
Mareeba Shire Council 110 69 0 71 0 6 0 14 0 3 0 0
Maroochy Shire Council 714 433 13 471 0 35 0 35 0 27 0 0
Maryborough City Council 136 81 0 87 1 6 0 9 0 9 0 0
Mckinlay Shire Council 18 10 1 11 0 0 0 0 0 0 0 0
Millmerran Shire Council 22 10 2 13 0 0 0 0 0 0 0 0
Mirani Shire Council 19 13 1 14 0 0 0 0 0 0 0 0
Miriam Vale Shire Council 34 18 2 24 0 0 0 0 1 0 0 0
Monto Shire Council 13 6 0 5 0 0 0 2 0 0 0 0
Mornington Shire Council 3 3 0 3 0 1 0 0 0 0 0 0
Mount Isa City Council 85 48 3 38 0 8 0 7 0 12 0 0
Mount Morgan Shire Council 9 5 0 4 0 0 1 0 0 0 0 0
Mundubbera Shire Council 18 11 1 12 0 0 0 0 0 0 0 0
Murgon Shire Council 19 14 0 12 0 1 0 1 0 1 0 0
Murilla Shire Council 8 5 1 2 0 1 0 1 0 0 0 0

Page A2-26 Appendix 2: Key summary tables
Table 18: Road traffic crashes and casualties Queensland 2000by Local Government Area (cont'd)
Crashes Persons
Local Government Area
Drivers and passengers
PedestriansMotorcycle riders and
pillions
Pedal cycle riders
Others
Total reported
Involving casualties
K I K I K I K I K I
Murweh Shire Council 26 16 2 18 0 0 0 5 0 1 0 0
Nanango Shire Council 52 31 1 35 0 1 0 3 0 1 0 0
Nebo Shire Council 18 11 0 13 0 0 0 0 0 0 0 0
Noosa Shire Council 210 128 8 130 0 11 0 15 0 12 0 0
Paroo Shire Council 6 3 1 11 0 0 0 0 0 0 0 0
Peak Downs Shire Council 13 9 1 8 0 0 0 1 0 0 0 0
Perry Shire Council 3 1 0 2 0 0 0 0 0 0 0 0
Pine Rivers Shire Council 383 237 3 223 1 25 2 23 0 23 0 0
Pittsworth Shire Council 18 10 1 9 0 0 0 1 0 1 0 0
Quilpie Shire Council 8 4 0 6 0 0 0 0 0 0 0 0
Redcliffe City Council 243 127 2 130 2 11 0 13 0 18 0 0
Redland Shire Council 322 212 1 214 0 16 0 22 0 26 0 0
Richmond Shire Council 10 6 0 9 0 0 0 0 0 0 0 0
Rockhampton City Council 376 173 1 175 0 11 0 21 0 16 0 0
Roma Town Council 20 14 0 19 0 1 0 0 0 1 0 0
Rosalie Shire Council 34 15 0 15 0 0 0 2 0 0 0 0
Sarina Shire Council 58 29 0 31 0 2 1 4 0 2 0 0
Stanthorpe Shire Council 50 22 1 27 0 0 0 1 0 0 0 0
Tambo Shire Council 8 4 1 5 0 0 0 0 0 0 0 0
Tara Shire Council 27 17 1 20 0 0 0 0 0 0 0 0
Taroom Shire Council 23 12 0 17 0 0 0 0 0 0 0 0
Thuringowa City Council 154 94 0 86 0 7 0 15 0 8 0 0
Tiaro Shire Council 28 17 1 21 1 0 0 1 0 0 0 0
Toowoomba City Council 524 259 2 269 0 25 1 26 1 18 0 0
Torres Shire Council 10 6 0 4 0 1 0 1 0 1 0 0
Townsville City Council 515 300 0 272 1 21 0 56 0 34 0 0
Waggamba Shire Council 33 18 4 26 0 0 0 0 0 0 0 0
Wambo Shire Council 30 19 2 25 0 0 0 0 0 0 0 0
Warroo Shire Council 4 2 0 4 0 0 0 0 0 0 0 0
Warwick Shire Council 111 60 2 76 0 2 0 3 0 2 0 0
Whitsunday Shire Council 90 51 0 73 0 4 0 4 0 0 0 0
Winton Shire Council 10 3 0 4 0 0 0 0 0 0 0 0
Wondai Shire Council 20 12 2 14 0 0 0 0 0 0 0 0
Woocoo Shire Council 19 9 0 11 0 0 0 0 0 0 0 0
TOTAL for QUEENSLAND 19680 11407 239 12159 40 885 33 1058 6 786 0 0
K - Killed
I - Injured
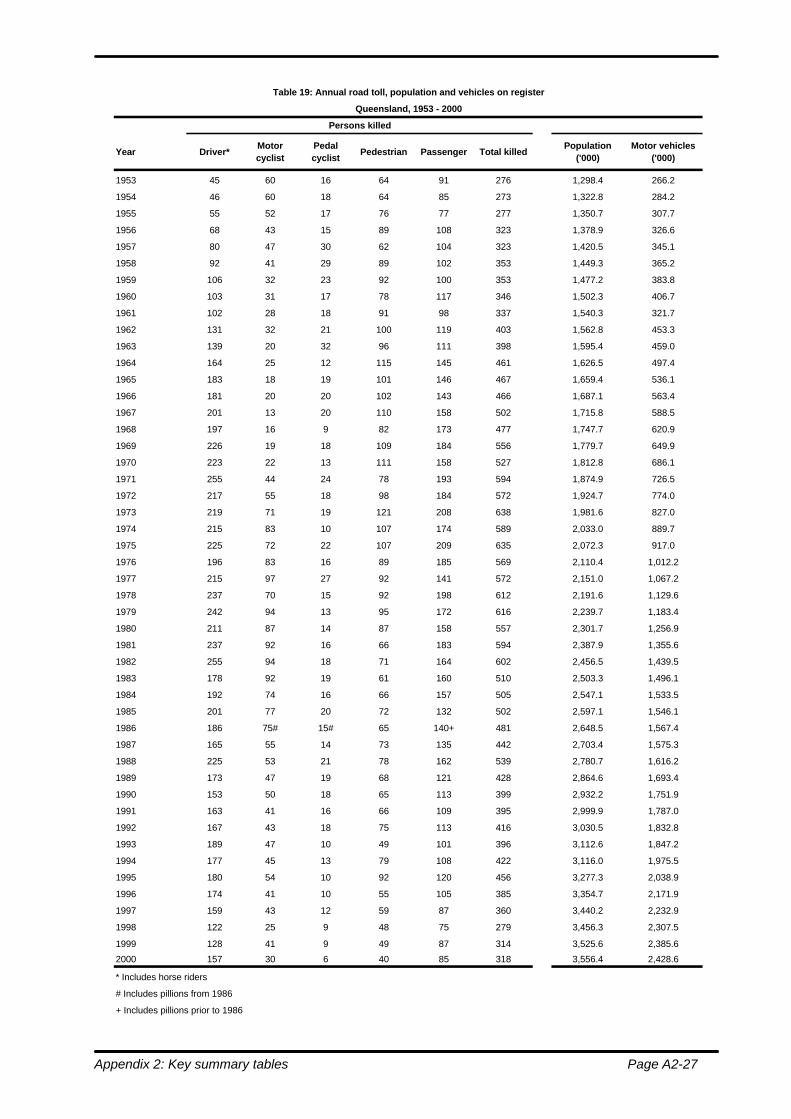
Appendix 2: Key summary tables Page A2-27
Table 19: Annual road toll, population and vehicles on register
Queensland, 1953 - 2000
Persons killed
Year Driver*Motor cyclist
Pedal cyclist
Pedestrian Passenger Total killedPopulation
('000)Motor vehicles
('000)
1953 45 60 16 64 91 276 1,298.4 266.2
1954 46 60 18 64 85 273 1,322.8 284.2
1955 55 52 17 76 77 277 1,350.7 307.7
1956 68 43 15 89 108 323 1,378.9 326.6
1957 80 47 30 62 104 323 1,420.5 345.1
1958 92 41 29 89 102 353 1,449.3 365.2
1959 106 32 23 92 100 353 1,477.2 383.8
1960 103 31 17 78 117 346 1,502.3 406.7
1961 102 28 18 91 98 337 1,540.3 321.7
1962 131 32 21 100 119 403 1,562.8 453.3
1963 139 20 32 96 111 398 1,595.4 459.0
1964 164 25 12 115 145 461 1,626.5 497.4
1965 183 18 19 101 146 467 1,659.4 536.1
1966 181 20 20 102 143 466 1,687.1 563.4
1967 201 13 20 110 158 502 1,715.8 588.5
1968 197 16 9 82 173 477 1,747.7 620.9
1969 226 19 18 109 184 556 1,779.7 649.9
1970 223 22 13 111 158 527 1,812.8 686.1
1971 255 44 24 78 193 594 1,874.9 726.5
1972 217 55 18 98 184 572 1,924.7 774.0
1973 219 71 19 121 208 638 1,981.6 827.0
1974 215 83 10 107 174 589 2,033.0 889.7
1975 225 72 22 107 209 635 2,072.3 917.0
1976 196 83 16 89 185 569 2,110.4 1,012.2
1977 215 97 27 92 141 572 2,151.0 1,067.2
1978 237 70 15 92 198 612 2,191.6 1,129.6
1979 242 94 13 95 172 616 2,239.7 1,183.4
1980 211 87 14 87 158 557 2,301.7 1,256.9
1981 237 92 16 66 183 594 2,387.9 1,355.6
1982 255 94 18 71 164 602 2,456.5 1,439.5
1983 178 92 19 61 160 510 2,503.3 1,496.1
1984 192 74 16 66 157 505 2,547.1 1,533.5
1985 201 77 20 72 132 502 2,597.1 1,546.1
1986 186 75# 15# 65 140+ 481 2,648.5 1,567.4
1987 165 55 14 73 135 442 2,703.4 1,575.3
1988 225 53 21 78 162 539 2,780.7 1,616.2
1989 173 47 19 68 121 428 2,864.6 1,693.4
1990 153 50 18 65 113 399 2,932.2 1,751.9
1991 163 41 16 66 109 395 2,999.9 1,787.0
1992 167 43 18 75 113 416 3,030.5 1,832.8
1993 189 47 10 49 101 396 3,112.6 1,847.2
1994 177 45 13 79 108 422 3,116.0 1,975.5
1995 180 54 10 92 120 456 3,277.3 2,038.9
1996 174 41 10 55 105 385 3,354.7 2,171.9
1997 159 43 12 59 87 360 3,440.2 2,232.9
1998 122 25 9 48 75 279 3,456.3 2,307.5
1999 128 41 9 49 87 314 3,525.6 2,385.6
2000 157 30 6 40 85 318 3,556.4 2,428.6
* Includes horse riders
# Includes pillions from 1986
+ Includes pillions prior to 1986

Page A2-28 Appendix 2: Key summary tables
Table 20: Annual trend data
Queensland 1991-2000
1991 1992 1993 1994 1995 1996 1997 1998 1999 2000
Casualties by severity
Fatalities 395 416 396 422 456 385 360 279 314 318
Hospitalised 3959 4004 4052 4600 4636 4481 4146 4394 4498 4738
Medical treatment 4826 5473 5876 6207 6692 6836 6483 6321 6243 6290
Minor injury 2493 2926 3131 3587 3932 4131 3928 4008 3835 3876
Total 11673 12819 13455 14816 15716 15833 14917 15002 14890 15222
Fatalities by age group
0-11 years* 25 26 19 22 25 20 21 17 18 12
12-16 years 17 22 18 18 21 20 17 14 19 16
17-24 years 96 119 122 103 121 107 113 79 77 63
25-59 years 180 172 174 194 208 172 155 121 143 165
60 years and over 77 77 63 85 81 66 54 48 57 62
Total 395 416 396 422 456 385 360 279 314 318
Fatalities by age group: female
0-11 years* 7 10 9 8 12 8 5 4 8 4
12-16 years 5 5 9 6 8 5 3 6 7 4
17-24 years 24 32 25 29 29 19 39 18 17 13
25-59 years 49 47 40 46 63 55 41 36 36 37
60 years and over 34 33 23 38 32 30 21 17 20 26
Total 119 127 106 127 144 117 109 81 88 84
Fatalities by age group: male
0-11 years* 18 16 10 14 13 12 16 12 8 8
12-16 years 12 17 9 12 13 15 14 8 12 12
17-24 years 72 87 97 74 92 88 74 61 60 50
25-59 years 131 125 134 148 145 117 114 85 107 128
60 years and over 43 44 40 47 49 36 33 31 37 36
Total 276 289 290 295 312 268 251 197 224 234
Fatalities by road user
Drivers 162 168 189 177 181 174 158 122 127 157
Passengers 106 113 101 108 119 105 88 75 87 82
Motorcyclists 45 43 47 45 54 41 43 25 41 33
Bicyclists 16 18 10 13 10 10 12 9 9 6
Pedestrians 66 74 49 79 92 55 59 48 49 40
Other 0 0 0 0 0 0 0 0 1 0
Total 395 416 396 422 456 385 360 279 314 318
Fatalities by driver/rider blood alcohol content
Tested 158 152 182 164 194 170 171 128 121 163
Untested 43 49 50 53 36 41 26 15 42 22
Total 201 201 232 217 230 211 197 143 163 185
Nil 103 96 123 103 112 105 112 86 86 104
0.01 - 0.04 6 4 7 10 18 5 13 8 6 13
0.05 - 0.14 13 18 14 20 20 19 21 15 13 13
0.15 - 0.24 28 25 32 23 31 31 15 14 8 23
0.25 and over 8 9 6 8 13 10 10 5 8 10
Total 158 152 182 164 194 170 171 128 121 163
* May include unknown age of fatality

Appendix 2: Key summary tables Page A2-29
Table 20: Annual trend data
Queensland 1991-2000
1991 1992 1993 1994 1995 1996 1997 1998 1999 2000
Fatalities by seatbelt usage
Not determined 82 114 105 89 105 89 88 62 64 64
Restrained 133 120 110 139 141 137 110 97 98 115
Unrestrained 51 44 70 40 46 45 45 34 48 58
Total 266 278 285 268 292 271 243 193 210 237
Fatalities by helmet usage
Not determined 24 0 1 2 3 5 2 7 3 4
Worn 3 17 5 5 9 11 9 4 9 33
Not worn 34 44 51 51 52 35 44 23 38 2
Total 61 61 57 58 64 51 55 34 50 39
Injuries by age group
0-11 years 716 790 863 850 930 935 886 858 867 836
12-16 years 809 847 829 899 1035 979 926 954 853 829
17-24 years 3588 3954 4202 4631 4611 4572 4143 4199 4007 4119
25-59 years 4862 5476 5806 6583 7178 7379 7090 7162 7177 7610
60 years and over 1125 1283 1293 1384 1443 1525 1438 1470 1380 1412
Unstated 178 53 66 45 63 58 72 78 73 98
Total 11278 12403 13059 14392 15260 15448 14555 14721 14357 14904
Injuries by age group: female
0-11 years 335 351 353 373 434 381 366 372 388 363
12-16 years 321 365 358 371 439 437 397 408 364 383
17-24 years 1428 1541 1742 1938 1959 1962 1765 1862 1774 1892
25-59 years 2182 2322 2561 2905 3228 3351 3282 3376 3283 3569
60 years and over 577 656 686 747 725 792 777 756 716 755
Unstated 107 34 30 20 21 24 16 21 30 32
Total 4950 5269 5730 6354 6806 6947 6603 6795 6555 6994
Injuries by age group: male
0-11 years 381 439 510 477 496 553 520 486 479 473
12-16 years 488 482 471 528 596 542 529 546 489 446
17-24 years 2160 2413 2460 2693 2652 2610 2378 2337 2233 2226
25-59 years 2680 3154 3245 3678 3950 4028 3806 3785 3894 4041
60 years and over 548 627 607 637 718 733 661 714 664 657
Unstated 65 16 23 14 27 26 38 34 43 41
Total 6322 7131 7316 8027 8439 8492 7932 7902 7802 7884
Injuries by road user type
Drivers 5098 5662 6149 7055 7677 7725 7457 7628 7566 8049
Passengers 3377 3593 3917 4250 4402 4434 4089 4112 4065 4132
Motorcyclists 1168 1278 1340 1374 1357 1396 1204 1220 1100 1072
Bicyclists 866 961 792 784 816 916 913 876 763 788
Pedestrians 757 889 854 918 994 963 884 877 858 887
Other 12 19 6 11 12 12 7 6 5 2
Total 11278 12402 13058 14392 15258 15446 14554 14719 14357 14930

Page A2-30 Appendix 2: Key summary tables
Table 20: Annual trend data
Queensland 1991-2000
1991 1992 1993 1994 1995 1996 1997 1998 1999 2000
Injuries by blood alcohol content of driver/rider
Tested 1019 1518 1690 1904 2042 2203 2285 2730 3064 3639
Untested 6135 6511 6568 7317 7814 7820 7274 6888 6360 6113
Total 7154 8029 8258 9221 9856 10023 9559 9618 9424 9752
Nil 612 1071 1220 1374 1477 1595 1773 2239 2578 3138
0.01 - 0.04 21 21 29 32 41 31 33 42 33 45
0.05 - 0.14 155 159 182 200 228 233 228 225 187 222
0.15 - 0.24 195 209 216 257 255 307 223 195 230 214
0.25 and over 36 58 43 41 41 37 28 29 36 20
Total 1019 1518 1690 1904 2042 2203 2285 2730 3064 3639
Injuries by seatbelt usage
Not determined 1466 1431 1381 1529 1702 1794 1874 1851 1718 1599
Restrained 6330 7141 8019 9101 9685 9684 9045 9224 9310 9249
Unrestrained 499 499 552 508 534 517 482 477 434 550
Total 8295 9071 9952 11138 11921 11995 11401 11552 11462 11398
Injuries by helmet usage
Not determined 1016 173 75 100 108 129 136 154 130 137
Worn 909 1600 1905 1876 1889 1939 1779 1765 1573 1563
Not worn 121 483 157 193 188 256 209 183 168 156
Total 2046 2256 2137 2169 2185 2324 2124 2102 1871 1856
Crashes by severity
Fatal 359 363 357 368 408 338 321 257 273 276
Hospitalisation 3041 3232 3204 3612 3654 3559 3328 3514 3529 3779
Medical treatment 3454 3967 4172 4469 4800 4936 4761 4609 4501 4670
Minor injury 1788 2054 2170 2469 2800 2872 2697 2757 2596 2694
Property damage 9526 9551 9667 9912 9602 9208 8236 8419 8543 8335
Total 18168 19167 19570 20830 21264 20913 19343 19556 19442 19754
Fatal crashes - crash nature
Hit object 85 82 101 93 105 93 95 80 65 79
Hit pedestrian 63 73 44 73 88 55 55 46 47 38
Head-on 53 67 55 62 70 46 48 23 47 47
Angle 69 53 71 60 50 60 54 44 36 34
Overturned 46 39 53 35 47 45 25 24 27 40
Rear-end 15 17 7 11 16 10 8 8 12 6
Fall from vehicle 8 20 9 10 11 13 11 8 12 12
Sideswipe 15 9 7 10 10 9 16 11 19 13
Hit parked vehicle 1 1 2 6 7 4 3 6 5 6
Hit animal 3 2 7 4 3 3 5 6 1 0
Other 1 0 1 4 1 0 1 1 2 1
Total 359 363 357 368 408 338 321 257 273 276

Appendix 2: Key summary tables Page A2-31
Table 20: Annual trend data
Queensland 1991-2000
1991 1992 1993 1994 1995 1996 1997 1998 1999 2000
Fatal crashes - traffic control
Police 0 1 1 1 0 0 0 0 0 0
Road/Rail worker 0 0 2 0 0 0 0 0 2 0
Operating traffic lights 24 19 14 26 24 23 10 12 13 20
Railway-lights only 3 2 2 2 1 0 1 0 0 1
Railway-lights & boom gate 0 3 0 2 1 0 1 2 0 1
Stop sign 10 9 13 5 9 10 16 9 8 4
Give way sign 14 12 14 14 17 13 10 12 14 11
Railway crossing sign 0 2 3 0 1 4 0 2 0 0
Pedestrian crossing sign 1 6 0 3 5 3 3 1 2 1
Miscellaneous 2 1 0 0 0 0 0 0 0 0
No traffic control 305 308 308 315 350 285 280 219 234 238
Fatal crashes - speed limit
0-50 km/h 2 3 1 5 3 7 1 6 10 15
60 km/h 148 149 136 148 152 142 115 75 84 78
70-90 km/h 45 44 41 49 46 39 42 46 62 52
100km/h and over 164 167 179 166 207 150 163 130 117 131
Fatal crashes after dark
Total 149 161 150 154 171 142 152 102 124 112
Fatal crashes - roadway feature
Wet road 0 0 0 0 0 11 31 48 42 46
Crossroad 41 32 45 36 44 47 27 25 31 30
Roundabout 1 2 0 2 2 3 1 2 0 3
Other intersection 54 58 50 54 59 55 48 31 35 29
Bridge/causeway 15 10 9 12 16 7 12 11 3 8
Fatal crashes - day of week
Monday 47 53 41 42 45 36 30 31 33 31
Tuesday 35 36 41 43 43 48 44 25 24 36
Wednesday 41 46 45 54 58 34 45 32 29 35
Thursday 44 44 45 50 52 46 42 36 35 41
Friday 66 69 59 65 74 53 56 39 57 47
Saturday 74 67 65 59 67 60 64 55 50 49
Sunday 52 48 61 55 69 61 40 39 45 37
Fatal crashes - location
Brisbane City 59 57 49 53 58 50 39 34 39 33
Rest of BSD 55 56 53 60 44 39 37 26 33 35
Provincial cities 63 54 66 58 69 79 61 54 46 44
Rest of state 182 196 189 197 237 170 184 143 155 164
Total 359 363 357 368 408 338 321 257 273 276
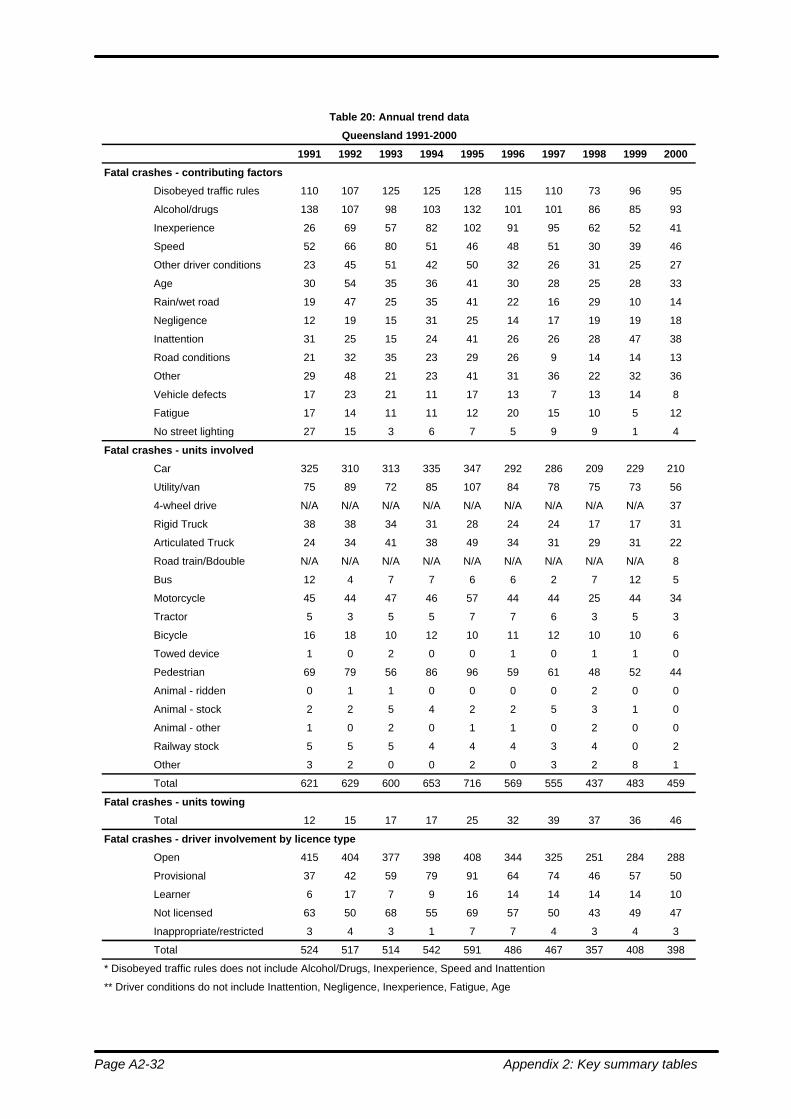
Page A2-32 Appendix 2: Key summary tables
Table 20: Annual trend data
Queensland 1991-2000
1991 1992 1993 1994 1995 1996 1997 1998 1999 2000
Fatal crashes - contributing factors
Disobeyed traffic rules 110 107 125 125 128 115 110 73 96 95
Alcohol/drugs 138 107 98 103 132 101 101 86 85 93
Inexperience 26 69 57 82 102 91 95 62 52 41
Speed 52 66 80 51 46 48 51 30 39 46
Other driver conditions 23 45 51 42 50 32 26 31 25 27
Age 30 54 35 36 41 30 28 25 28 33
Rain/wet road 19 47 25 35 41 22 16 29 10 14
Negligence 12 19 15 31 25 14 17 19 19 18
Inattention 31 25 15 24 41 26 26 28 47 38
Road conditions 21 32 35 23 29 26 9 14 14 13
Other 29 48 21 23 41 31 36 22 32 36
Vehicle defects 17 23 21 11 17 13 7 13 14 8
Fatigue 17 14 11 11 12 20 15 10 5 12
No street lighting 27 15 3 6 7 5 9 9 1 4
Fatal crashes - units involved
Car 325 310 313 335 347 292 286 209 229 210
Utility/van 75 89 72 85 107 84 78 75 73 56
4-wheel drive N/A N/A N/A N/A N/A N/A N/A N/A N/A 37
Rigid Truck 38 38 34 31 28 24 24 17 17 31
Articulated Truck 24 34 41 38 49 34 31 29 31 22
Road train/Bdouble N/A N/A N/A N/A N/A N/A N/A N/A N/A 8
Bus 12 4 7 7 6 6 2 7 12 5
Motorcycle 45 44 47 46 57 44 44 25 44 34
Tractor 5 3 5 5 7 7 6 3 5 3
Bicycle 16 18 10 12 10 11 12 10 10 6
Towed device 1 0 2 0 0 1 0 1 1 0
Pedestrian 69 79 56 86 96 59 61 48 52 44
Animal - ridden 0 1 1 0 0 0 0 2 0 0
Animal - stock 2 2 5 4 2 2 5 3 1 0
Animal - other 1 0 2 0 1 1 0 2 0 0
Railway stock 5 5 5 4 4 4 3 4 0 2
Other 3 2 0 0 2 0 3 2 8 1
Total 621 629 600 653 716 569 555 437 483 459
Fatal crashes - units towing
Total 12 15 17 17 25 32 39 37 36 46
Fatal crashes - driver involvement by licence type
Open 415 404 377 398 408 344 325 251 284 288
Provisional 37 42 59 79 91 64 74 46 57 50
Learner 6 17 7 9 16 14 14 14 14 10
Not licensed 63 50 68 55 69 57 50 43 49 47
Inappropriate/restricted 3 4 3 1 7 7 4 3 4 3
Total 524 517 514 542 591 486 467 357 408 398
* Disobeyed traffic rules does not include Alcohol/Drugs, Inexperience, Speed and Inattention
** Driver conditions do not include Inattention, Negligence, Inexperience, Fatigue, Age

Appendix 2: Key summary tables Page A2-33
Table 20: Annual trend data
Queensland 1991-2000
1991 1992 1993 1994 1995 1996 1997 1998 1999 2000
Injury crashes - crash nature
Hit object 1264 1447 1723 1877 1951 2037 2064 2013 2037 2037
Hit pedestrian 716 826 781 835 903 886 827 796 777 816
Head-on 384 379 371 392 473 452 299 321 311 260
Angle 2860 3085 3155 3521 3723 3661 3569 3530 3404 3501
Overturned 879 877 867 884 978 869 764 742 681 809
Rear-end 1205 1490 1521 1844 1972 2119 2053 2186 2158 2487
Fall from vehicle 211 324 285 292 252 323 271 281 265 283
Sideswipe 396 431 465 505 561 567 516 583 525 519
Hit parked vehicle 234 243 247 271 293 296 259 276 287 272
Hit animal 117 123 118 104 120 120 124 87 122 85
Other 17 28 13 25 28 37 40 65 59 74
Injury crashes - traffic control
Police 15 20 15 14 16 9 2 9 5 11
Road/Rail worked 15 12 12 18 12 26 24 24 21 13
Operating traffic lights 921 1079 1136 1348 1479 1497 1502 1521 1583 1707
Flashing amber lights 1 1 4 1 9 1 1 2 2 3
Railway-lights only 6 13 14 21 10 12 18 13 11 4
Railway-lights & boom gate 4 2 7 4 9 9 5 3 1 3
Stop sign 455 466 469 468 558 491 472 440 438 440
Give way sign 655 802 857 999 1139 1154 1058 1087 1018 1142
Railway crossing sign 4 5 7 12 7 11 5 3 3 3
Pedestrian crossing sign 123 135 100 118 117 127 95 110 96 96
Miscellaneous 12 3 4 1 0 0 0 0 1 1
No traffic control 6063 6711 6914 7541 7893 8025 7602 7669 7569 7718
Injury crashes - speed limit
0-50 km/h 91 107 105 133 162 164 174 205 867 1140
60 km/h 5530 6190 6398 7024 7644 7686 7333 7314 6158 6290
70-90 km/h 748 822 882 1024 1016 1094 1019 1235 1414 1597
100km/h and over 1914 2134 2161 2369 2432 2423 2260 2126 2187 2114
Injury crashes after dark
Total 2253 2568 2600 2908 3205 3228 2873 2885 2897 2970
Injury crashes - roadway feature
Wet road N/A N/A N/A N/A N/A 489 1554 1786 1941 1853
Crossroad 1745 1946 1985 2201 2291 2228 2067 1995 1980 2047
Roundabout 181 232 252 256 308 319 335 353 356 404
Other intersection 1836 2182 2255 2520 2784 2853 2710 2719 2497 2694
Bridge/causeway 165 161 150 166 207 200 120 170 156 161
Injury crashes - day of week
Monday 1107 1239 1308 1433 1529 1505 1405 1501 1459 1497
Tuesday 1161 1213 1318 1420 1486 1595 1513 1450 1421 1526
Wednesday 1174 1332 1354 1449 1590 1625 1665 1638 1506 1618
Thursday 1234 1435 1425 1588 1668 1701 1654 1693 1603 1744
Friday 1435 1606 1615 1793 1897 1906 1721 1847 1878 1811
Saturday 1216 1319 1421 1681 1675 1728 1590 1445 1550 1590
Sunday 956 1109 1105 1186 1409 1307 1238 1306 1209 1357

Page A2-34 Appendix 2: Key summary tables
Table 20: Annual trend data
Queensland 1991-2000
1991 1992 1993 1994 1995 1996 1997 1998 1999 2000
Injury crashes - location
Brisbane City 2284 2546 2592 2973 3173 3140 2975 3017 2933 3145
Rest of BSD 1326 1520 1628 1791 1946 1770 1510 1612 1454 1612
Provincial cities 1758 1957 2018 2215 2316 2337 2225 2203 2100 2166
Rest of state 2915 3230 3308 3573 3819 4120 4077 4050 4260 4199
Injury crashes - contributing factors
Disobeyed traffic rules 3325 3659 3865 4349 4578 4604 4315 4389 4200 4214
Alcohol/drugs 765 826 858 934 1045 1035 979 938 873 952
Inexperience 645 1288 1851 2436 2726 2823 2818 2601 2265 2420
Speed 269 441 369 438 451 436 405 448 418 495
Other driver conditions 538 880 951 869 889 1023 912 844 619 745
Age 247 448 420 456 522 580 610 668 530 540
Rain/wet road 423 874 1038 1163 1317 1146 781 1011 927 746
Negligence 160 266 187 242 209 177 214 297 385 336
Inattention 1966 2416 2290 2812 2657 2701 2850 3337 3506 3536
Road conditions 433 713 681 709 909 857 586 594 563 497
Other 608 988 897 923 1136 1400 1565 1435 1344 1457
Vehicle defects 359 435 412 460 450 425 418 421 364 313
Fatigue 157 211 192 239 219 253 253 244 218 263
No street lighting 121 94 63 77 83 69 42 63 53 53
Injury crashes - units involved
Car 9906 10918 11407 13102 14091 14130 13564 13817 13440 13661
Utility/van 1823 2061 2252 2446 2672 2659 2450 2472 2440 2217
4-wheel drive N/A N/A N/A N/A N/A N/A N/A N/A N/A 1088
Rigid Truck 453 454 451 546 559 490 474 454 471 498
Articulated Truck 243 314 299 369 369 377 344 377 385 287
Road train/Bdouble N/A N/A N/A N/A N/A N/A N/A N/A N/A 57
Bus 128 152 116 122 150 169 177 159 177 192
Motorcycle 1160 1287 1318 1361 1347 1383 1194 1190 1113 1057
Tractor 43 51 57 73 63 77 91 94 95 92
Bicycle 900 1009 823 811 840 944 945 899 789 802
Towed device 18 10 11 17 10 5 3 9 11 8
Pedestrian 830 965 906 998 1090 1022 945 929 916 929
Animal - ridden 6 11 5 4 2 6 4 4 1 5
Animal - stock 77 79 69 65 84 79 91 64 89 44
Animal - other 44 40 54 42 39 39 38 27 34 41
Railway stock 20 22 27 30 22 25 19 18 20 4
Other 32 34 29 39 34 55 33 34 148 1174
Total 15683 17407 17824 20025 21372 21460 20372 20547 20129 22156
Injury crashes - units towing
Total 227 249 269 329 376 470 530 554 544 550
Injury crashes - driver involvement by licence type
Open 10546 11734 11575 12719 13472 13818 13184 13314 13056 13737
Provisional 1103 1390 2179 2913 3079 2829 2546 2660 2550 2810
Learner 246 276 323 287 321 357 375 431 427 452
Not licensed 1018 995 996 1202 1356 1377 1357 1429 1409 1363
Inappropriate/restricted 46 55 58 54 83 65 48 47 40 51
Total 12959 14450 15131 17175 18311 18446 17510 17881 17482 18413
* Disobeyed traffic rules does not include Alcohol/Drugs, Inexperience, Speed and Inattention
** Driver conditions do not include Inattention, Negligence, Inexperience, Fatigue, Age