factors related to fatal single-vehicle run-off-road crashes
TRANSCRIPT
DOT HS 811 232 November 2009
Factors Related to Fatal Single-Vehicle Run-Off-Road Crashes
_______________________________________________________________________
Technical Report Documentation Page
1 Report No
DOT HS 811 232 2 Government Accession No 3 Recipientrsquos Catalog No
4 Title and Subtitle
Factors Related to Fatal Single-Vehicle Run-Off-Road Crashes
5 Report Date
November 2009
6 Performing Organization Code
NVS-421
7 Author(s)
Cejun Liu PhD and Rajesh Subramanian dagger 8 Performing Organization Report No
9 Performing Organization Name and Address
URC Enterprises Inc 1710 6 Thatcher Court Olney MD 20832
10 Work Unit No (TRAIS)n code
11 Contract of Grant No
12 Sponsoring Agency Name and Address
Mathematical Analysis Division National Center for Statistics and Analysis National Highway Traffic Safety Administration 1200 New Jersey Avenue SE Washington DC 20590
13 Type of Report and Period Covered
NHTSA Technical Report
14 Sponsoring Agency Code
15Supplementary Notes
Program Analyst URC Enterprises Inc dagger Mathematical Statistician Mathematical Analysis Division National Center for Statistics and Analysis NHTSA
Helpful comments from Santokh Singh Chou-Lin Chen Refaat Hanna Jim Simons Chuck Kahane Dennis Flemons Roya Amjadi Carl Andersen Cathy Satterfield and Jessica Cicchino are appreciated
16 Abstract
Run-Off-Road crashes cause a large proportion of fatalities and serious injuries to the vehicle occupants In this study fatal crashes from the Fatality Analysis Reporting System for passenger vehicles (passenger cars and LTVs) during the period 1991 to 2007 were used to identify the roadway- (eg ruralurban nature and curve existence) driver- (eg age gender drowsy and alcohol use) environmental- (eg weather lighting condition) and vehicle-related factors (eg speeding) associated with the fatal single-vehicle run-off-road crashes
The results show that the factors driver sleep drivers with alcohol use roadway alignment with curve speeding vehicle passenger car rural roadway high speed limit road and adverse weather were significant factors related to the high risk of fatal single-vehicle run-off-road crashes Also in the adverse weather condition and for the younger drivers the vehicle speeding would increase the risk of fatal single-vehicle run-off-road crashes by an additional factor
17 Key Words
Run-off-road ROR Passenger vehicle Fatal single-vehicle crashes FARS Rural Age Alcohol Gender Driver-related factor Sleep Inattention Over correction Avoiding
18 Distribution Statement
Document is available to the public from the National Technical Information Service wwwntisgov
19 Security Classif (of this report)
Unclassified 20 Security Classif (of this page)
Unclassified 21 No of Pages
30 22 Price
Form DOT F17007 (8-72) Reproduction of completed page authorized
i
NHTSArsquos National Center for Statistics and Analysis 1200 New Jersey Avenue SE Washington DC 20590
_______________________________________________________________________
Table of Contents
Executive Summary 1
1 Introduction 4
2 Data and Methodology 6
3 Factors Related to Fatal Single-Vehicle ROR Crashes 7
31 Environment-Related Factors 7
311 Road Environment 7
312 Weather Conditions 11
313 Natural Lighting Conditions 12
32 Occupant-Related Factors 13
321 Occupancy 13
322 Driverrsquos Gender 14
323 Driverrsquos Age 15
324 Alcohol-Related Driving 16
325 Driver-Performance-Related Factors 17
33 Vehicle-Related Factors 19
331 Vehicle Speeding Status 19
332 Vehicle Type 20
4 Logistic Regression 21
41 Logistic Regression Results and Interpretation 22
5 Conclusions 24
6 References 25
ii
NHTSArsquos National Center for Statistics and Analysis 1200 New Jersey Avenue SE Washington DC 20590
_______________________________________________________________________
Executive Summary
A vehicle in transport sometimes leaves the travel lane and encroaches onto the shoulder median roadside parking lane gore or a separator and hits one or more natural or artificial objects This event usually involves a single vehicle and is referred to as a runshyoff-road (ROR) crash ROR crashes contribute to a large proportion of fatalities and serious injuries to the vehicle occupants in fatal single-vehicle crashes (around 70 of the fatal single-vehicle crashes are ROR crashes)
In this study the data from the Fatality Analysis Reporting System (FARS) for fatal crashes involving passenger vehicles (passenger cars vans pickup trucks and utility vehicles) during the period 1991 to 2007 were used to identify the roadway- driver- environment- and vehicle-related factors associated with fatal single-vehicle ROR crashes The data pertaining only to fatal single-vehicle ROR crashes was used in multiple-vehicle crashes one vehicle running off the road could result from its collision with other vehicles
The single-vehicle crashes were categorized into two groups run-off-road (ROR) crashes and on-road (OR) crashes in which the vehicle remained on the road after the crash The single-vehicle OR crashes may involve a pedestrian bicyclist train an animal or it may be an on-road rollover a vehicle hitting a median divider or falling trees on the roadway etc In this report the descriptive (univariate) analysis of the relationship between selected factors (variables) was conducted to estimate the likelihood of a vehicle involvement in fatal single-vehicle ROR and OR crashes The impact of these related factors is also assessed by logistic regression procedure in which the OR crashes essentially form one element of the binary outcome of a crash (on-road versus off-theshyroad) This procedure helps to assess their relative influence as well as estimate the amount of risk each carries in the occurrence of such crashes
This study only uses data on fatal single-vehicle crashes and therefore the results of this analysis should not be interpreted to be representative of all police-reported crashes Also because the comparisons are made between single-vehicle ROR and OR crashes it is possible that the factors that differ between these two types of crashes are not necessarily associated solely with these two types of crashes
The following are some highlights from the analyses conducted in this study
Drivers with alcohol use are more likely to be involved in ROR crashes as compared to the sober drivers Among the drivers with alcohol use (blood alcohol concentration BAC=01+ grams per deciliter) 865 percent of them were involved in ROR crashes while among the sober drivers (BAC=0) 583 percent of them were involved in ROR crashes
Speeding vehicles are more likely to be involved in ROR crashes as compared to the non-speeding vehicles Among the vehicles that were speeding 90 percent
1
NHTSArsquos National Center for Statistics and Analysis 1200 New Jersey Avenue SE Washington DC 20590
_______________________________________________________________________
were involved in ROR crashes while among vehicles that were not speeding 595 percent were involved in ROR crashes
Curved road segments are more likely to be the scene of ROR crashes as compared to the straight roadways Among the crashes that occurred on curved roads 902 percent of them were ROR crashes while among those that occurred on straight roadways 621 percent were ROR crashes
Rural roads are more likely to be the scene of ROR crashes as compared to the urban roads Among all crashes that occurred on rural roadways 806 percent of them were ROR crashes while among the crashes that occurred on urban roadways 562 percent of them were ROR crashes
In most cases the actual vehiclersquos pre-crash travel speed is unknown In this analysis the posted speed limit was used as a proxy to a vehiclersquos travel speed Among all the crashes that occurred on roadways with posted speed limits of 60 mph and above 81 percent were in ROR crashes while among the crashes that occurred on roadways with speed limits less than 60 mph 69 percent of the vehicles were in ROR crashes The high speed limit roads are more likely to be the scene of ROR crashes as compared to the low speed limit roads
Roadways with fewer lanes (one or two lanes) are more likely to be the scene of ROR crashes as compared to the roadways with three and more lanes (divided or undivided) Among all the crashes that occurred on roadways with fewer lanes 678 percent (divided) and 766 percent (undivided) were ROR crashes while among the crashes that occurred on roads with three and more lanes 62 percent (divided) and 40 percent (undivided) were ROR crashes
ROR crashes are more likely to occur in adverse weather conditions (rain sleet snow fog fog and others - smog smoke blowing sand or dust) as compared to good weather conditions (normal or clear) Among the crashes that occurred in adverse weather conditions 755 percent of the crashes were ROR crashes while among those crashes that occurred in good weather conditions 70 percent were ROR crashes
ROR crashes are more likely to occur during nighttime as compared to the daytime Among the crashes that occurred during nighttime (8 pm ndash 559 am) 742 percent were ROR crashes while among those crashes that occurred during the day time period (6 am ndash 759 pm) 665 percent were ROR crashes
Vehicles with high occupancy (two or more occupants) are more likely to be involved in ROR crashes as compared to the vehicles with drivers alone Among crashes involving vehicles with the drivers as the only occupants 680 percent were ROR crashes while among vehicles involved with two or more occupants 748 percent were ROR crashes
2
NHTSArsquos National Center for Statistics and Analysis 1200 New Jersey Avenue SE Washington DC 20590
_______________________________________________________________________
Vehicles driven by young drivers (age 15 to 24) are more likely to be involved in ROR crashes as compared to other age groups of drivers
Vehicles with male drivers are more likely to be involved in ROR crashes as compared to the vehicles with female drivers
Drivers with performance-related factors such as sleepiness inattentiveness over-correction of the vehicle or crash-avoiding are more likely to be involved in ROR crashes as compared to other driver-performance-related factors The percentages of sleepy (912) inattentive (754) over-correction of the vehicle (856) and crash-avoiding (798) drivers involved in fatal single-vehicle ROR crashes are significantly greater (p lt00001) than the drivers with other performance-related factors that account for 67 percent of ROR crashes
Among all passenger vehicles (passenger cars vans pickup trucks and utility vehicles) passenger cars are more likely to be involved in fatal single-vehicle ROR crashes as compared to other passenger vehicle types
Logistic regression modeling was used to assess their relative influence as well as estimate the amount of risk each factor carries in the occurrence of such crashes It shows that the most influential factor in the occurrence of fatal single-vehicle ROR crashes is the driver performance-related factor sleepy followed by alcohol use roadway alignment with curve vehicle speeding passenger car rural roadway high-speed-limit road adverse weather and crash-avoiding In the adverse weather condition and for the younger drivers (15 to 24 and age 25 to 44) the vehicle speeding would increase the risk of fatal single-vehicle ROR crashes by an additional factor
3
NHTSArsquos National Center for Statistics and Analysis 1200 New Jersey Avenue SE Washington DC 20590
_______________________________________________________________________
NHTSArsquos National Center for Statistics and Analysis 1200 New Jersey Avenue SE Washington DC 20590
4
Total Fatal Single-Vehicle Crashes (Bar Graph) and Percent ROR Crashes (Line Graph) 1991-2007 75
73
71
69
67
65
91 2 3 4 5 6 79 9 9 9 9 99 9 9 9 9 9 98 9 0 1 2 3 04 5 619 19
9 0 0 0 0 0 07
9 0 0 0 0 0 01 1 1 1 1 1 1 2 2 2 2 20 200
2 2Year
19000
18500
s ehsa
Cr 18000
R
t R
Oencre 17500
P
17000
16500
s
ehsar
Cle
ic
heV-el
gin
l S
atal
Fat
oT
Figure 1 Total Passenger Vehicle Fatal Single-Vehicle Crashes (Bar Graph) and the Percent of ROR Crashes (Line Graph) 1991-2007 (FARS 1991-2007)
1 Introduction A vehicle in transport sometimes leaves the travel lane and encroaches onto the shoulder median roadside parking lane gore or a separator and hits one or more natural or artificial objects This event usually involves a single vehicle and is referred to as a runshyoff-road crash ROR crashes contribute to a large proportion of fatalities and serious injuries to the vehicle occupants in fatal single-vehicle crashes -- around 70 percent of the fatal single-vehicle crashes are ROR crashes In contrast there are crashes in which a vehicle remains on the road after the crash and are referred as on-road crashes The single-vehicle OR crashes may involve a pedestrian bicyclist train an animal or it may be an on-road rollover a vehicle hitting a median divider or falling trees on the roadway etc The OR crashes contribute to around 30 percent of the fatal single-vehicle crashes The total number of passenger vehicle fatal single-vehicle crashes (bar graph right label) and the percentage that were ROR crashes (line graph left label) from 1991 to 2007 are shown in Figure 1 The total numbers of fatal single-vehicle crashes fluctuate over the years 1991 to 2007 However the percent of ROR crashes shows an upward trend during the same time period (with 68 percent in 1991 and 73 percent in 2007) Keeping vehicles on the roadway is one of the major goals of Strategic Highway Safety Plan1 2
_______________________________________________________________________
The reasons for an ROR crash are varied and include avoiding a vehicle object or an animal in the travel lane over-correction during the operation of the vehicle inattentive driving due to distraction fatigue sleep or alcohol the effects of weather on pavement conditions and traveling too fast through a curve There are also a number of roadway design factors (eg travel lanes that are too narrow substandard curves) that can increase the probability that a driver error may result into an ROR crash 2-6
This study aims to identify the roadway factors (eg ruralurban nature and curve existence) driver factors (eg age gender sleepy and alcohol use) environmental factors (eg weather lighting condition) and vehicle-related factors (eg speeding) associated with the fatal single-vehicle ROR crashes The analyses on the relationship between selected factors (variables) and the likelihood of fatal single-vehicle ROR and OR crashes are presented
The study is focused only on fatal crashes that is a crash that involve a motor vehicle in transport traveling on a traffic way customarily open to the public and resulting in the death of a person (occupant of a vehicle or a non-motorist) within 30 days of the crash Therefore the results presented in this study can not be generalized to the entire crash population Also because the comparisons are made between single-vehicle ROR and OR crashes it is possible that the factors that differ between these two types of crashes are not necessarily associated solely with these two types of crashes
The outline of this report is as follows Section 2 presents the data and the method used in this report Section 3 presents the descriptive (univariate) statistics through the percentage frequency distributions of fatal single-vehicle ROR versus fatal single-vehicle OR crashes by various roadway- environment- occupant- and vehicle-related factors Section 4 assesses their relative influence as well as estimates the amount of risk each factor carries in the occurrence of such crashes using logistic regression The conclusions are presented in Section 5
5
NHTSArsquos National Center for Statistics and Analysis 1200 New Jersey Avenue SE Washington DC 20590
_______________________________________________________________________
2 Data and Methodology
The data used in this study comes from the Fatality Analysis Reporting System for fatal crashes during the period 1991 to 2007 All analyses in this report pertain to fatal single-vehicle ROR crashes that involve passenger vehicles including cars vans pickup trucks and utility vehicles with gross vehicle weight ratings under 10000 lbs
In this study the fatal single-vehicle crashes were categorized into two groups ROR crashes and OR crashes in which the vehicles were still on the road after the crashdagger The descriptive (univariate) analysis of the relationship between selected factors (variables) was conducted to estimate the likelihood of a vehicle involvement in fatal single-vehicle ROR and OR crashes The chi-square test is used to assess the differences in percentages between groups and is statistically significant at α = 005 significance level when p lt005 The impact of these related factors is also assessed by logistic regression procedure in which the OR crashes essentially form one element of the binary outcome (on-road versus off- road) This procedure helps to assess their relative influence as well as estimate the amount of risk each carries in the occurrence of such crashes
dagger For the designation of ROR and OR crash refer to FARS Analytical Reference Guide 1975-2006 DOT HS 810 605 May 2006
6
NHTSArsquos National Center for Statistics and Analysis 1200 New Jersey Avenue SE Washington DC 20590
_______________________________________________________________________
3 Factors Related to Fatal Single-Vehicle ROR Crashes
In this section a descriptive (univariate) approach is used to identify the roadway- driver- environment- and vehicle-related factors (variables) that may have strong association with the fatal single-vehicle ROR crashes Based on other studies several variables were considered that include the curvature of the road roadway function class (ruralurban) number of lanes posted speed limit weather and lighting conditions age gender and alcohol use by the driver7 8 9 10 11
31 Environment-Related Factors
The environment-related factors examined in the study are roadway alignment roadway function class number of lanes posted speed limit weather and lighting conditions
311 Road Environment
Road Alignment
Roadway alignment plays a significant role in the occurrence of ROR crashes Figure 2 shows the percentage frequency distributions of passenger vehicles involved in fatal single-vehicle ROR and OR crashes by road alignment (curved or straight)
902 621
98 379
0
50
100
Curve (N=95190) Straight (N=212832)
Pe
rce
nt
ROR OR
Figure 2 Percentage Frequency Distributions of Fatal Single-Vehicle ROR and OR Crashes by Road Alignment (FARS 1991-2007)
7
NHTSArsquos National Center for Statistics and Analysis 1200 New Jersey Avenue SE Washington DC 20590
_______________________________________________________________________
The statistics show that among all fatal single-vehicle crashes that occurred on the curved roads 902 percent were ROR crashes while among crashes that occurred on straight roadways 621 percent were ROR crashes In contrast the occurrence of OR crashes are more frequent on straight roadways A χ2 test shows that the difference between two percentages is statistically significant (p lt00001) thereby indicating that the curved road segments are more likely to be the scene of ROR crashes as compared to the straight roadways Improving roadway design (eg flattening curves signing or the more general curve delineation) could reduce the likelihood of ROR crashes
Roadway Function Class
It is also of interest to see if the roadway function class makes a difference in the occurrence of ROR crashes Figure 3 shows the percentage frequency distributions of passenger vehicles involved in fatal single-vehicle ROR and OR crashes by roadway function (rural or urban)
In fatal single-vehicle crashes among those that occurred on rural roads 806 percent were ROR crashes while among those that occurred on urban roadways 562 percent were ROR crashes In contrast the occurrence of OR crashes were more frequent on urban roadways A χ2 test shows that the difference between two percentages of ROR crashes is statistically significant (p lt00001) This shows that the rural roads are more likely to be the scene of ROR crashes as compared to the urban roads
806 562
194 438
0
50
100
Rural (N=183363) Urban (N=124248)
Pe
rce
nt
ROR OR
Figure 3 Percentage Frequency Distributions of Fatal Single-Vehicle ROR and OR Crashes by Roadway Function (FARS 1991-2007)
8
NHTSArsquos National Center for Statistics and Analysis 1200 New Jersey Avenue SE Washington DC 20590
_______________________________________________________________________
Road Posted Speed Limit
In most cases the actual vehiclersquos pre-crash travel speed is unknown In this analysis the posted speed limit was used as a proxy to a vehiclersquos travel speed Figure 4 shows the percentage frequency distributions of passenger vehicles involved in fatal single-vehicle ROR and OR crashes by posted speed limits (lt 60 mph and 60+ mph)
Among fatal single-vehicle crashes that occurred on roadways with posted speed limits of 60 mph and above 81 percent were ROR crashes while among the crashes that occurred on roadways with posted speed limits less than 60 mph 69 percent were ROR crashes A χ2 test shows that the difference between these two percentages is statistically significant (p lt00001) This in turn shows that the high speed limit roads are more likely to be the scene of ROR crashes as compared to the low speed limit roads
810 690
190 310
0
50
100
60+ mph (N=49687) lt 60 mph (N=251554)
Pe
rce
nt
ROR OR
Figure 4 Percentage Frequency Distributions of Fatal Single-Vehicle ROR and OR Crashes by Road Posted Speed Limits (FARS 1991-2007)
9
NHTSArsquos National Center for Statistics and Analysis 1200 New Jersey Avenue SE Washington DC 20590
_______________________________________________________________________
Roadway Number of Lanes
Another factor that is worth investigating is the roadway number of lanes Figure 5 shows the percentage frequency distributions of passenger vehicles involved in fatal single-vehicle ROR and OR crashes by roadway number of lanes Four categories of roadways were considered with reference to the number of lanes one or two lanes (divided or undivided) and three or more lanes (divided or undivided) The number of lanes refers to the number of lanes of a continuous cross-section of roadway For example a local roadway with one lane going north and one lane going south would be coded as two lanes However if a trafficway is a divided highway with two lanes going north a median and two lanes going south then the number of lanes is coded as two If a trafficway has two lanes going north immediately adjacent to two lanes going south one continuous cross-section of roadway then the number of lanes is coded as four
The results in Figure 5 show that among the fatal single-vehicle crashes that occurred on roadways with fewer lanes (one or two lanes) 678 percent (divided) and 766 percent (undivided) were ROR crashes while among the crashes that occurred on roads with three and more lanes 62 percent (divided) and 40 percent (undivided) were ROR crashes In contrast the occurrence of OR crashes were more frequent on roadways with three and more lanes as compared to one or more lanes both in the case of divided and undivided roadways
Statistically significant (p lt00001) difference shows that the roadways with fewer lanes (one or two lanes) are more likely to be the scene of ROR crashes as compared to the roadway with three and more lanes (divided or undivided) The roadway design or rehabilitation strategy such as building more lanes is likely to reduce ROR crashes 8
400 620 678 766
600 380 326 234
0
50
100
One or Tw o Lanes Divided
(N=53563)
One or Tw o Lanes Undivided (N=191462)
Three and More Lanes Divided
(N=35615)
Three and More Lanes Undivided
(N=18395)
Pe
rce
nt
ROR OR
Figure 5 Percentage Frequency Distributions of Fatal Single-Vehicle ROR and OR Crashes by Roadway Number of Lanes (FARS 1991-2007)
10
NHTSArsquos National Center for Statistics and Analysis 1200 New Jersey Avenue SE Washington DC 20590
_______________________________________________________________________
312 Weather Conditions
To investigate if certain weather conditions contribute to the occurrence of ROR crashes the percentage frequency distributions of passenger vehicles involved in fatal single-vehicle ROR and OR crashes by weather conditions were obtained Two weather conditions were considered for this purpose adverse (rain sleet snow fog fog and others - smog smoke blowing sand or dust) and good weather conditions (normal or clear) The results are presented in Figure 6
Among fatal single-vehicle crashes that occurred during adverse weather conditions 755 percent were ROR crashes while among crashes that occurred during good weather conditions 70 percent were ROR crashes On the other hand OR crashes were more frequent in good weather conditions
The significant difference between the two percentages (p lt00001) shows that ROR crashes are more likely to occur in adverse weather conditions as compared to good weather conditions Improving roadway design (eg providing skid-resistant pavement surfaces) could reduce the likelihood of ROR crashes
755 700
245 300
0
50
100
Adverse Weather (N=34152) Good Weather (N=273242)
Pe
rce
nt
ROR OR
Figure 6 Percentage Frequency Distributions of Fatal Single-Vehicle ROR and OR Crashes by Weather Conditions (FARS 1991-2007)
11
NHTSArsquos National Center for Statistics and Analysis 1200 New Jersey Avenue SE Washington DC 20590
_______________________________________________________________________
ROR OR
100
50
0
Night Time (N=155199) Day Time (N=149945)
742 665
258 335
Pe
rce
nt
313 Natural Lighting Conditions
Could visibility due to natural lighting be an issue in the occurrence of ROR crashes To answer this question frequency analysis was conducted for two lighting conditions nighttime and daytime Figure 7 shows the percentage frequency distributions of passenger vehicles involved in fatal single-vehicle ROR and OR crashes by lighting conditions
Among fatal single-vehicle crashes that occurred during nighttime (8 pm ndash 559 am) 742 percent were ROR crashes while among the crashes that occurred during daytime (6 am ndash 759 pm) 665 percent were ROR crashes In contrast the occurrence of OR crashes are more frequent during day time
A χ2 test confirms that the difference between two percentages is statistically significant (p lt00001) This shows that the night time driving is more likely to result into ROR crashes as compared to the day time period Reduced lighting like adverse weather is associated with a significant increase in the likelihood of single-vehicle ROR crashes
Figure 7 Percentage Frequency Distributions of Fatal Single-Vehicle ROR and OR Crashes by Lighting Conditions (FARS 1991-2007)
12
NHTSArsquos National Center for Statistics and Analysis 1200 New Jersey Avenue SE Washington DC 20590
_______________________________________________________________________
ROR OR
680 748
320 252
0
50
100
Pe
rce
nt
One Occupant (Driver Alone) Two or More Occupants (N=183611) (N=125559)
32 Occupant-Related Factors
The occupant-related factors examined in the study include vehicle occupancy driverrsquos gender age alcohol use and driver performance-related factors such as sleep inattention over-correction of the vehicle etc
321 Occupancy
It is of interest to see if the occupancy of a vehicle makes a difference in the occurrence of ROR crashes Figure 8 shows the percentage frequency distributions of passenger vehicles involved in fatal single-vehicle ROR and OR crashes by vehicle occupancy
Among fatal single-vehicle crashes involving a vehicle with only one occupant (driver alone) 680 percent were ROR crashes while among crashes involving a vehicle with two or more occupants 748 percent were ROR crashes A χ2 test confirms the difference between these two percentages to be statistically significant (p lt00001)
This shows that vehicles with high occupancy (two or more occupants) are more likely to be involved in ROR crashes as compared to a vehicle with the driver alone The reason for this is not immediately clear However a possible explanation could be the fact that the presence of other occupants in the vehicle is a likely source of distraction to the driver due to conversation and other activities 12
Figure 8 Percentage Frequency Distributions of Fatal Single-Vehicle ROR and OR Crashes by Vehicle Occupancy (FARS 1991-2007)
13
NHTSArsquos National Center for Statistics and Analysis 1200 New Jersey Avenue SE Washington DC 20590
_______________________________________________________________________
722 665
278 335
ROR OR
100
50
0
Male Driver (N=230416) Female Driver (N=78754)
Pe
rce
nt
322 Driverrsquos Gender
Among many driver-related factors driver gender that could possibly contribute to the occurrence of ROR crashes was studied Figure 9 shows the percentage frequency distributions of passenger vehicles involved in fatal single-vehicle ROR and OR crashes by driverrsquos gender
Among fatal single-vehicle crashes involving male drivers 722 percent were ROR crashes while 665 percent crashes involving female drivers were ROR crashes In contrast the occurrence of OR crashes are more frequent for female drivers A χ2 test shows that the difference between the two percentages is statistically significant (p lt00001)
Thus one could infer that vehicles with the male drivers are more likely to be involved in ROR crashes as compared to the vehicles with the female drivers
Figure 9 Percentage Frequency Distributions of Fatal Single-Vehicle ROR and OR Crashes by Driverrsquos Gender (FARS 1991-2007)
14
NHTSArsquos National Center for Statistics and Analysis 1200 New Jersey Avenue SE Washington DC 20590
_______________________________________________________________________
323 Driverrsquos Age
To look into driver age as a contributing factor in ROR crashes four age groups were considered 15 to 24 25 to 44 45 to 64 and 65 and older Figure 10 shows the percentage frequency distributions of passenger vehicles involved in fatal single-vehicle ROR and OR crashes by these age groups
Among fatal single-vehicle crashes involving young drivers 15 to 24 a higher percentage (752 percent) were of ROR crashes as compared to other age groups This shows that vehicles with young drivers 15 to 24 are more likely to be involved in ROR crashes as compared to other three age groups
727 664 752 686
273 336 248 314
0
50
100
15-24 (N=102962)
25-44 (N=121728)
45-64 (N=55303)
65+ (N=27195)
Pe
rce
nt
ROR OR
Figure 10 Percentage Frequency Distributions of Fatal Single-Vehicle ROR and OR Crashes by Driverrsquos Age (FARS 1991-2007)
15
NHTSArsquos National Center for Statistics and Analysis 1200 New Jersey Avenue SE Washington DC 20590
_______________________________________________________________________
583 865
417 135
0
50
100
BAC=0 (N=172537) BAC=001+ (N=136633)
Pe
rce
nt
ROR OR
Figure 11 Percentage Frequency Distributions of Fatal Single-Vehicle ROR and OR Crashes by Driverrsquos Alcohol Use (FARS 1991-2007)
324 Alcohol-Related Driving
Alcohol involvement of a driver often leads to safety issues such as loss of vehicle control that may result into a ROR crash Two categories of drivers sober (BAC=0) and alcohol involved (BAC=01+) were considered in the analysis to see if alcohol use contributes to ROR crashes Figure 11 shows the percentage frequency distributions of passenger vehicles involved in fatal single-vehicle ROR and OR crashes by driverrsquos alcohol use
Among fatal single-vehicle crashes involving drivers with alcohol use (BAC=01+) 865 percent were ROR crashes while among those drivers with no alcohol (BAC=0) 583 percent were ROR crashes The difference between these two percentages is statistically significant (p lt00001) This indicates that the drivers with alcohol use are more likely to be involved in ROR crashes as compared to sober drivers
16
NHTSArsquos National Center for Statistics and Analysis 1200 New Jersey Avenue SE Washington DC 20590
_______________________________________________________________________
325 Driver-Performance-Related Factors
Some of the driver performance-related factors that are likely to contribute to the occurrence of ROR crashes were also examined
These include (1) sleepy (drowsy asleep fatigued and sleepy) (2) inattentive (talking eating etc) (3) over-correcting of the vehicle (4) avoiding (avoiding swerving or sliding due to severe crosswind tire blow-out or flat live animals in road vehicle in road etc) (5) distractions inside vehicles (cellular telephone computer fax machine etc) and (6) other driver-performance-related factors such as mentally challenged following improperly failure to signal intensions etc
Figure 12 shows the percentage frequency distributions of passenger vehicles involved in fatal single-vehicle ROR and OR crashes based on the driver performance-related factors The statistics show that the percentages of sleepy (912) inattentive (754) over correction of the vehicle (856) and crash avoiding (798) drivers involved in fatal single-vehicle ROR crashes are significantly greater (p lt00001) than the drivers with lsquoOther driver performance-related factorsrsquo that account for 67 percent of ROR crashes
This means that drivers with these performance-related factors (sleepy inattentive over correction avoiding etc) are more likely to be involved in ROR crashes as compared to drivers with other performance-related factors These results are consistent with those obtained from other studies using different approaches and other crash databases 2-11
17
NHTSArsquos National Center for Statistics and Analysis 1200 New Jersey Avenue SE Washington DC 20590
_______________________________________________________________________
672 671 798 856 754 912
328 329 202 144 246 88
0
20
40
60
80
100
Sleepy (N=14774)
Inattention (N=28081)
Overcorrect (N=19289)
Avoiding (N=14145)
Possible Distraction (N=1429)
Others (N=227587)
Per
cen
t
ROR OR
Figure 12 Percentage Frequency Distributions of Fatal Single-Vehicle ROR and OR Crashes by Driver Performance-Related Factors (FARS 1991-2007)
18
NHTSArsquos National Center for Statistics and Analysis 1200 New Jersey Avenue SE Washington DC 20590
_______________________________________________________________________
33 Vehicle-Related Factors
It is generally believed that ROR crashes are likely to occur due to some vehicle-related factors such as vehicle speeding or vehicle type
331 Vehicle Speeding Status
A crash is considered speeding-related if any driver involved in the crash is charged with a speeding-related offense or if a police officer indicates that racing driving too fast for the conditions or exceeding the posted speed limit was a related factor in the crash 13
Figure 13 shows the percentage frequency distributions of passenger vehicles involved in fatal single-vehicle ROR and OR crashes by vehicle speeding status
Among fatal single-vehicle crashes that involved a speeding vehicle 90 percent were ROR crashes while among crashes that did not involve a speeding vehicle 595 percent were ROR crashes A χ2 test shows that the difference between two percentages is statistically significant (p lt00001) thereby showing that speeding vehicles are more likely to be involved in ROR crashes as compared to non-speeding vehicles
900 595
100 405
0
50
100
Speeding (N=113825) Non-Speeding (N=195345)
Pe
rce
nt
ROR OR
Figure 13 Percentage Frequency Distributions of Fatal Single-Vehicle ROR and OR Crashes by Vehicle Speeding Status (FARS 1991-2007)
19
NHTSArsquos National Center for Statistics and Analysis 1200 New Jersey Avenue SE Washington DC 20590
_______________________________________________________________________
500 520 600 670 730 710
500 480 400 330 270 290
00
200
400
600
800
1000
Passenger Car
(N=178430)
LT Pickup
(N=72065)
LT Utility
(N=38970)
LT MiniVan
(N=11159)
LT Other Van (N=7904)
LT Others (N=642)
Pe
rce
nt
ROR OR
Figure 14 shows the percentage frequency distributions of passenger vehicles involved in fatal single-vehicle ROR and OR crashes by passenger vehicle type passenger car light truck (LT) including pickup utility minivan other van and other light trucks) It shows that passenger cars are more likely to be involved in ROR crashes as compared to other passenger vehicle types Minivans (60) are more likely to be involved in ROR crashes (p lt00001) as compared to other vans (52)
332 Vehicle Type
Figure 14 Percentage Frequency Distributions of Fatal Single-Vehicle ROR and OR Crashes by Vehicle Type (FARS 1991-2007)
20
NHTSArsquos National Center for Statistics and Analysis 1200 New Jersey Avenue SE Washington DC 20590
_______________________________________________________________________
4 Logistic Regression
The analysis in the previous sections shows that factors such as driver sleepiness alcohol use vehicle speeding curved roadway rural roads etc are significant contributors to the occurrence of fatal single-vehicle ROR crashes It remains to assess their relative influence as well as estimate the amount of risk each carries in the occurrence of such crashes Logistic regression was used for this purpose This is a modeling procedure that predicts the probability (p) of occurrence of an event (fatal single-vehicle ROR crash in the present case) as a consequence of certain roadway- driver- environment- and vehicle-related factors such as sleepy alcohol use weather condition lighting condition speeding status road function etc Generally the logistic regression model provides log of odds as a function of the predictors
Log (odds) = a0 + a1timesdriver performance-related factor + a2timesalcohol use + a3timesspeeding status + a4timesweather condition + a5timeslighting conditionhellip + aktimesspeeding statustimesweather condition + ak+1timesspeeding statustimesdriverrsquos age +helliphellip
where a0 is the intercept and a1 a2 a3 helliphellip ak ak+1 helliphellip are the regression coefficients
As in the previous analysis FARS data was used in the modeling procedure Since in FARS driverrsquos alcohol involvement is estimated by Multiple Imputation (MI) 16 17
procedure the SAS MIANALYZE procedure was used in this study to perform the analysis of the MI data generated from the logistic regression18
21
NHTSArsquos National Center for Statistics and Analysis 1200 New Jersey Avenue SE Washington DC 20590
_______________________________________________________________________
41 Logistic Regression Results and Interpretation
Of all the variables considered in the logistic regression only 10 showed up as significant predictors (95 confidence level) As regards the interaction effect of these factors only the interaction of speeding with other variables was considered However only three of these interactions emerged as significant (95 confidence level) The results in Table 1 present estimates of regression coefficients and the corresponding odds ratio only for significant main effects and interactions Since the independent variables (predictors) are dichotomous the influence of the corresponding factors can be compared simply by comparing their regression coefficients
The ordered (decreasing) estimates of regression coefficients in Table 1 show that the most influential factor in the occurrence of fatal single-vehicle ROR crashes is the driver performance-related factor sleepy followed by alcohol use roadway alignment with curve speeding passenger car rural roadway number of lanes high-speed-limit road adverse weather and avoiding With regard to the interaction effect of speeding with other factors speeding with drivers of age groups 15 to 24 and 25 to 44 as well as speeding under adverse weather are significant contributors to the likelihood of ROR crashes
Table 1 Multiple Imputation Parameter Estimates Dagger
Variables Estimate Odds Ratio Driver performance-related factor sleepy vs others 11675 Dagger 321 Driver with alcohol BAC=01+ gdL vs BAC=0 06605 Dagger 194 Road alignment curve vs straight 05535 Dagger 174 Vehicle speeding status speeding vs non-speeding 04966 Dagger 164 Vehicle type passenger car vs other LTs 04780 Dagger 161 Road function rural vs urban 03637 Dagger 144 Roadway of lanes one or two (undivided) vs three amp more (undivided) 03346 Dagger 141 Road speed limit ge 60 mph vs lt60 mph 02659 Dagger 130 Weather adverse vs good 02130 Dagger 124 Driver performance-related factor avoiding vs others 02007 Dagger 122 Weather timesSpeeding status adverse amp speeding vs good amp non-speeding 01056 Dagger 111 Driver Age times Speeding status 25-44 amp speeding vs 65+ amp non-speeding 01003 Dagger 111 Driver Age times Speeding status 15-24 amp speeding vs 65+ amp non-speeding 00578 Dagger 106
Statistically significant variables (α = 005) associated with the high risk (odds ratio gt100) Other variables with low risk (odds ratio lt100) or insignificance (pgt005) after jointly estimating the effect are not shown here Dagger p-value lt00001
One of the most important by-product of logistic regression is the estimate of odds ratio that tells a great deal about the risk a certain factor carries in contributing to the occurrence of ROR crashes Specifically odds ratio measures the magnitude of increase in odds of happening of an event as a result of a unit increase in a predictor (eg sober and alcohol-used driver) An odds ratio value of 1 is indicative of no influence Table 1 also shows odds ratio estimates of significant factors and interactions
22
NHTSArsquos National Center for Statistics and Analysis 1200 New Jersey Avenue SE Washington DC 20590
_______________________________________________________________________
1
250 226
o 200
ita 164
Rd
s 150
d 124
O 100 100
050
Non-Speeding+Good Weather Non-Speeding+Adverse Weather
Speeding+Good Weather Speeding+Adverse Weather
Figure 15 Odds Ratio by Speeding Status and Weather Conditions
The odds ratio 321 for the factor ldquodriver performance-related factorrdquo shows that the odds of being involved in an ROR crash for a sleepy driver are three times as large as that for the driver who is not sleepy
The odds ratio 194 for the factor ldquodriver with alcoholrdquo shows that the odds of being involved in an ROR crash for an alcohol used driver (BAC=01+ gdL) are almost two times as large as that for a sober driver (BAC=0)
The odds ratio 174 for the factor ldquoroad alignmentrdquo shows that the odds of being involved in an ROR crash on curved roadways are 174 times as large as that on straight roadways in fatal single-vehicle crashes
The odds ratio 164 for the factor ldquovehicle speeding statusrdquo shows that the odds of being involved in an ROR crash for speeding vehicles are 164 times as large as that for non-speeding vehicles
The odds ratio 161 for the factor ldquovehicle typerdquo shows that the odds of being involved in an ROR crash for passenger cars are 161 times as large as that for other LTs
The odds ratio 144 for the factor ldquoroad functionrdquo shows that the odds of being involved in an ROR crash on rural roadways are 144 times as large as that on urban roadways
The odds ratio 266 for the factor ldquoweather amp speeding statusrdquo shows that the odds of being involved in an ROR crash under the adverse weather and in speeding vehicle are 266 (=164times124times111) times as large as that under the good weather and in non-speeding vehicle (Figure 15)
23
NHTSArsquos National Center for Statistics and Analysis 1200 New Jersey Avenue SE Washington DC 20590
_______________________________________________________________________
5 Conclusions
Run-off-road crashes account for a significant percentage (around 70) of all fatal single-vehicle crashes FARS data (1991 to 2007) that includes detailed information about ROR crashes provided sufficient statistical evidence to conclude that certain roadway- driver- environment- and vehicle-related factors closely associated with the occurrence of these crashes Appropriate crash countermeasures based on the identified factors can reduce the occurrence of single-vehicle ROR crashes and hence of the fatalities
Curved road segments rural roads high-speed-limit roadways and roadways with fewer lanes (divided or undivided) are found to be more likely to be the scene of fatal single-vehicle ROR crashes as compared to the fatal single-vehicle OR crashes Similarly among environmental factors adverse weather and night time periods are the factors associated with high risk of fatal single-vehicle ROR crashes
Vehicles with high occupancy (two and more occupants) male driver younger driver and alcohol used by driver are more likely to be involved in fatal single-vehicle ROR crashes as compared to the fatal single-vehicle OR crashes Drivers with performance-related factors (sleepy inattentive over-correction avoiding etc) are more likely to be involved in the fatal single-vehicle ROR crashes Speeding vehicles and passenger cars are also associated with high risks of the fatal single-vehicle ROR crashes
In the adverse weather condition and for the younger drivers (15 to 24 and 25 to 44) the speeding vehicle would increase the risk of fatal single-vehicle ROR crashes by an additional factor
The above facts based on statistical evidence suggest several crash countermeasures For example improving roadway design such as flattening curves and installing shoulder rumble strips or rehabilitation strategies such as building wide lanes or adding additional unpaved shoulder width on entire system providing skid-resistant pavement surfaces could reduce the likelihood of ROR crashes
24
NHTSArsquos National Center for Statistics and Analysis 1200 New Jersey Avenue SE Washington DC 20590
_______________________________________________________________________
6 References
1 FHWA (Undated) Reducing Highway Fatalities Washington DC Federal Highway Administration httpsafetyfhwadotgovroadway5Fdept
2 Neuman T RPfefer R Slack K L Council F McGee H Prothe L amp Eccles K (1998) Guidance for Implementation of the AASHTO Strategic Highway Safety Plan Report 500 Volume 6 A Guide for Addressing Run-Off Road Collisions Washington DC Transportation Research Board Available at httponlinepubstrborgonlinepubsnchrpnchrp_rpt_500v6pdf
3 Spainhour L K amp Mishra A (2007) Analysis of Fatal Run-off-the-Road Crashes Involving Overcorrection TRB 87th Annual Meeting Paper No 08-0661 Washington DC Transportation Research Board
4 McGee H W amp Hanscom F R Low-Cost Treatments for Horizontal Curve Safety FHWA-SA-07-002 December 2006
5 Johnston I Corben B TriggsT Candappa N amp Lenneacute M Reducing Serious Injury and Death from Run-off-Road Crashes in Victoria ndash Turning Knowledge into Action (2006 June) RACV Research Report Victoria Australia Royal Automobile Club of Victoria Ltd
6 Dissanayake S (2003 August) Young Drivers and Run-Off-the-Road Crashes Proceedings of the 2003 Mid-Continent Transportation Research Symposium Ames Iowa
7 Knapp K K Giese K L amp Lee W (2003 August) Urban Four-Lane Undivided to Three-Lane Roadway Conversion Guidelines Proceedings of the 2003 Mid-Continent Transportation Research Symposium Ames Iowa
8 Őrnek E amp Drakopoulos A (2007 August) Analysis of Run-Off-Road Crashes in Relation to Roadway Features and Driver Behavior Proceedings of the 2007 Mid-Continent Transportation Research Symposium Ames Iowa
9 Ray M H amp McGinnis R G (1997) Guardrail and Median Barrier Crashworthiness A Synthesis of Highway Practice NCHRP Synthesis 244 Washington DC Transportation Research Board National Research Council
10 Roadside Design Guide (2006) 3rd Edition Washington DC American Association of State Highway and Transportation Officials
25
NHTSArsquos National Center for Statistics and Analysis 1200 New Jersey Avenue SE Washington DC 20590
_______________________________________________________________________
11 Elvik R (1995) The Safety Value of Guardrails and Crash Cushions A Meta-Analysis of Evidence from Evaluation Studies Accident Analysis and Prevention 27 (4)
12 Stutts J C Reinfurth D W Staplin L amp Rodgman EA (2001 May) The Role of Driver Distraction in Traffic Crashes Washington DC AAA Foundation for Traffic Safety
13 Liu C Chen C-L Subramanian R amp Utter D (2005 June) Analysis of Speeding-Related Fatal Motor Vehicle Traffic Crashes NHTSA Technical Report DOT HS 809 839 Washington DC National Highway Traffic Safety Administration
14 Hosmer Jr D W and Lemeshow S (1989) Applied Logistic Regression New York John Wiley amp Sons Inc
15 SAS Institute Inc (1995) Logistic Regression Examples using SAS system Cary NC SAS Institute Inc
16 Rubin D B Schafer J L amp Subramanian R (1998 October) Multiple Imputation of Missing Blood Alcohol Concentration (BAC) Values in FARS NHTSA Technical Report DOT HS 808 816 Washington DC National Highway Traffic Safety Administration
17 Subramanian R (2005 March) Alcohol Involvement in Fatal Motor Vehicle Traffic Crashes NHTSA Technical Report DOT HS 809 822 Washington DC National Highway Traffic Safety Administration
18 SASSTAT Userrsquos Guide Version 8 1999 Cary NC SAS Institute Inc
26
NHTSArsquos National Center for Statistics and Analysis 1200 New Jersey Avenue SE Washington DC 20590
DOT HS 811 232November 2009
_______________________________________________________________________
Table of Contents
Executive Summary 1
1 Introduction 4
2 Data and Methodology 6
3 Factors Related to Fatal Single-Vehicle ROR Crashes 7
31 Environment-Related Factors 7
311 Road Environment 7
312 Weather Conditions 11
313 Natural Lighting Conditions 12
32 Occupant-Related Factors 13
321 Occupancy 13
322 Driverrsquos Gender 14
323 Driverrsquos Age 15
324 Alcohol-Related Driving 16
325 Driver-Performance-Related Factors 17
33 Vehicle-Related Factors 19
331 Vehicle Speeding Status 19
332 Vehicle Type 20
4 Logistic Regression 21
41 Logistic Regression Results and Interpretation 22
5 Conclusions 24
6 References 25
ii
NHTSArsquos National Center for Statistics and Analysis 1200 New Jersey Avenue SE Washington DC 20590
_______________________________________________________________________
Executive Summary
A vehicle in transport sometimes leaves the travel lane and encroaches onto the shoulder median roadside parking lane gore or a separator and hits one or more natural or artificial objects This event usually involves a single vehicle and is referred to as a runshyoff-road (ROR) crash ROR crashes contribute to a large proportion of fatalities and serious injuries to the vehicle occupants in fatal single-vehicle crashes (around 70 of the fatal single-vehicle crashes are ROR crashes)
In this study the data from the Fatality Analysis Reporting System (FARS) for fatal crashes involving passenger vehicles (passenger cars vans pickup trucks and utility vehicles) during the period 1991 to 2007 were used to identify the roadway- driver- environment- and vehicle-related factors associated with fatal single-vehicle ROR crashes The data pertaining only to fatal single-vehicle ROR crashes was used in multiple-vehicle crashes one vehicle running off the road could result from its collision with other vehicles
The single-vehicle crashes were categorized into two groups run-off-road (ROR) crashes and on-road (OR) crashes in which the vehicle remained on the road after the crash The single-vehicle OR crashes may involve a pedestrian bicyclist train an animal or it may be an on-road rollover a vehicle hitting a median divider or falling trees on the roadway etc In this report the descriptive (univariate) analysis of the relationship between selected factors (variables) was conducted to estimate the likelihood of a vehicle involvement in fatal single-vehicle ROR and OR crashes The impact of these related factors is also assessed by logistic regression procedure in which the OR crashes essentially form one element of the binary outcome of a crash (on-road versus off-theshyroad) This procedure helps to assess their relative influence as well as estimate the amount of risk each carries in the occurrence of such crashes
This study only uses data on fatal single-vehicle crashes and therefore the results of this analysis should not be interpreted to be representative of all police-reported crashes Also because the comparisons are made between single-vehicle ROR and OR crashes it is possible that the factors that differ between these two types of crashes are not necessarily associated solely with these two types of crashes
The following are some highlights from the analyses conducted in this study
Drivers with alcohol use are more likely to be involved in ROR crashes as compared to the sober drivers Among the drivers with alcohol use (blood alcohol concentration BAC=01+ grams per deciliter) 865 percent of them were involved in ROR crashes while among the sober drivers (BAC=0) 583 percent of them were involved in ROR crashes
Speeding vehicles are more likely to be involved in ROR crashes as compared to the non-speeding vehicles Among the vehicles that were speeding 90 percent
1
NHTSArsquos National Center for Statistics and Analysis 1200 New Jersey Avenue SE Washington DC 20590
_______________________________________________________________________
were involved in ROR crashes while among vehicles that were not speeding 595 percent were involved in ROR crashes
Curved road segments are more likely to be the scene of ROR crashes as compared to the straight roadways Among the crashes that occurred on curved roads 902 percent of them were ROR crashes while among those that occurred on straight roadways 621 percent were ROR crashes
Rural roads are more likely to be the scene of ROR crashes as compared to the urban roads Among all crashes that occurred on rural roadways 806 percent of them were ROR crashes while among the crashes that occurred on urban roadways 562 percent of them were ROR crashes
In most cases the actual vehiclersquos pre-crash travel speed is unknown In this analysis the posted speed limit was used as a proxy to a vehiclersquos travel speed Among all the crashes that occurred on roadways with posted speed limits of 60 mph and above 81 percent were in ROR crashes while among the crashes that occurred on roadways with speed limits less than 60 mph 69 percent of the vehicles were in ROR crashes The high speed limit roads are more likely to be the scene of ROR crashes as compared to the low speed limit roads
Roadways with fewer lanes (one or two lanes) are more likely to be the scene of ROR crashes as compared to the roadways with three and more lanes (divided or undivided) Among all the crashes that occurred on roadways with fewer lanes 678 percent (divided) and 766 percent (undivided) were ROR crashes while among the crashes that occurred on roads with three and more lanes 62 percent (divided) and 40 percent (undivided) were ROR crashes
ROR crashes are more likely to occur in adverse weather conditions (rain sleet snow fog fog and others - smog smoke blowing sand or dust) as compared to good weather conditions (normal or clear) Among the crashes that occurred in adverse weather conditions 755 percent of the crashes were ROR crashes while among those crashes that occurred in good weather conditions 70 percent were ROR crashes
ROR crashes are more likely to occur during nighttime as compared to the daytime Among the crashes that occurred during nighttime (8 pm ndash 559 am) 742 percent were ROR crashes while among those crashes that occurred during the day time period (6 am ndash 759 pm) 665 percent were ROR crashes
Vehicles with high occupancy (two or more occupants) are more likely to be involved in ROR crashes as compared to the vehicles with drivers alone Among crashes involving vehicles with the drivers as the only occupants 680 percent were ROR crashes while among vehicles involved with two or more occupants 748 percent were ROR crashes
2
NHTSArsquos National Center for Statistics and Analysis 1200 New Jersey Avenue SE Washington DC 20590
_______________________________________________________________________
Vehicles driven by young drivers (age 15 to 24) are more likely to be involved in ROR crashes as compared to other age groups of drivers
Vehicles with male drivers are more likely to be involved in ROR crashes as compared to the vehicles with female drivers
Drivers with performance-related factors such as sleepiness inattentiveness over-correction of the vehicle or crash-avoiding are more likely to be involved in ROR crashes as compared to other driver-performance-related factors The percentages of sleepy (912) inattentive (754) over-correction of the vehicle (856) and crash-avoiding (798) drivers involved in fatal single-vehicle ROR crashes are significantly greater (p lt00001) than the drivers with other performance-related factors that account for 67 percent of ROR crashes
Among all passenger vehicles (passenger cars vans pickup trucks and utility vehicles) passenger cars are more likely to be involved in fatal single-vehicle ROR crashes as compared to other passenger vehicle types
Logistic regression modeling was used to assess their relative influence as well as estimate the amount of risk each factor carries in the occurrence of such crashes It shows that the most influential factor in the occurrence of fatal single-vehicle ROR crashes is the driver performance-related factor sleepy followed by alcohol use roadway alignment with curve vehicle speeding passenger car rural roadway high-speed-limit road adverse weather and crash-avoiding In the adverse weather condition and for the younger drivers (15 to 24 and age 25 to 44) the vehicle speeding would increase the risk of fatal single-vehicle ROR crashes by an additional factor
3
NHTSArsquos National Center for Statistics and Analysis 1200 New Jersey Avenue SE Washington DC 20590
_______________________________________________________________________
NHTSArsquos National Center for Statistics and Analysis 1200 New Jersey Avenue SE Washington DC 20590
4
Total Fatal Single-Vehicle Crashes (Bar Graph) and Percent ROR Crashes (Line Graph) 1991-2007 75
73
71
69
67
65
91 2 3 4 5 6 79 9 9 9 9 99 9 9 9 9 9 98 9 0 1 2 3 04 5 619 19
9 0 0 0 0 0 07
9 0 0 0 0 0 01 1 1 1 1 1 1 2 2 2 2 20 200
2 2Year
19000
18500
s ehsa
Cr 18000
R
t R
Oencre 17500
P
17000
16500
s
ehsar
Cle
ic
heV-el
gin
l S
atal
Fat
oT
Figure 1 Total Passenger Vehicle Fatal Single-Vehicle Crashes (Bar Graph) and the Percent of ROR Crashes (Line Graph) 1991-2007 (FARS 1991-2007)
1 Introduction A vehicle in transport sometimes leaves the travel lane and encroaches onto the shoulder median roadside parking lane gore or a separator and hits one or more natural or artificial objects This event usually involves a single vehicle and is referred to as a runshyoff-road crash ROR crashes contribute to a large proportion of fatalities and serious injuries to the vehicle occupants in fatal single-vehicle crashes -- around 70 percent of the fatal single-vehicle crashes are ROR crashes In contrast there are crashes in which a vehicle remains on the road after the crash and are referred as on-road crashes The single-vehicle OR crashes may involve a pedestrian bicyclist train an animal or it may be an on-road rollover a vehicle hitting a median divider or falling trees on the roadway etc The OR crashes contribute to around 30 percent of the fatal single-vehicle crashes The total number of passenger vehicle fatal single-vehicle crashes (bar graph right label) and the percentage that were ROR crashes (line graph left label) from 1991 to 2007 are shown in Figure 1 The total numbers of fatal single-vehicle crashes fluctuate over the years 1991 to 2007 However the percent of ROR crashes shows an upward trend during the same time period (with 68 percent in 1991 and 73 percent in 2007) Keeping vehicles on the roadway is one of the major goals of Strategic Highway Safety Plan1 2
_______________________________________________________________________
The reasons for an ROR crash are varied and include avoiding a vehicle object or an animal in the travel lane over-correction during the operation of the vehicle inattentive driving due to distraction fatigue sleep or alcohol the effects of weather on pavement conditions and traveling too fast through a curve There are also a number of roadway design factors (eg travel lanes that are too narrow substandard curves) that can increase the probability that a driver error may result into an ROR crash 2-6
This study aims to identify the roadway factors (eg ruralurban nature and curve existence) driver factors (eg age gender sleepy and alcohol use) environmental factors (eg weather lighting condition) and vehicle-related factors (eg speeding) associated with the fatal single-vehicle ROR crashes The analyses on the relationship between selected factors (variables) and the likelihood of fatal single-vehicle ROR and OR crashes are presented
The study is focused only on fatal crashes that is a crash that involve a motor vehicle in transport traveling on a traffic way customarily open to the public and resulting in the death of a person (occupant of a vehicle or a non-motorist) within 30 days of the crash Therefore the results presented in this study can not be generalized to the entire crash population Also because the comparisons are made between single-vehicle ROR and OR crashes it is possible that the factors that differ between these two types of crashes are not necessarily associated solely with these two types of crashes
The outline of this report is as follows Section 2 presents the data and the method used in this report Section 3 presents the descriptive (univariate) statistics through the percentage frequency distributions of fatal single-vehicle ROR versus fatal single-vehicle OR crashes by various roadway- environment- occupant- and vehicle-related factors Section 4 assesses their relative influence as well as estimates the amount of risk each factor carries in the occurrence of such crashes using logistic regression The conclusions are presented in Section 5
5
NHTSArsquos National Center for Statistics and Analysis 1200 New Jersey Avenue SE Washington DC 20590
_______________________________________________________________________
2 Data and Methodology
The data used in this study comes from the Fatality Analysis Reporting System for fatal crashes during the period 1991 to 2007 All analyses in this report pertain to fatal single-vehicle ROR crashes that involve passenger vehicles including cars vans pickup trucks and utility vehicles with gross vehicle weight ratings under 10000 lbs
In this study the fatal single-vehicle crashes were categorized into two groups ROR crashes and OR crashes in which the vehicles were still on the road after the crashdagger The descriptive (univariate) analysis of the relationship between selected factors (variables) was conducted to estimate the likelihood of a vehicle involvement in fatal single-vehicle ROR and OR crashes The chi-square test is used to assess the differences in percentages between groups and is statistically significant at α = 005 significance level when p lt005 The impact of these related factors is also assessed by logistic regression procedure in which the OR crashes essentially form one element of the binary outcome (on-road versus off- road) This procedure helps to assess their relative influence as well as estimate the amount of risk each carries in the occurrence of such crashes
dagger For the designation of ROR and OR crash refer to FARS Analytical Reference Guide 1975-2006 DOT HS 810 605 May 2006
6
NHTSArsquos National Center for Statistics and Analysis 1200 New Jersey Avenue SE Washington DC 20590
_______________________________________________________________________
3 Factors Related to Fatal Single-Vehicle ROR Crashes
In this section a descriptive (univariate) approach is used to identify the roadway- driver- environment- and vehicle-related factors (variables) that may have strong association with the fatal single-vehicle ROR crashes Based on other studies several variables were considered that include the curvature of the road roadway function class (ruralurban) number of lanes posted speed limit weather and lighting conditions age gender and alcohol use by the driver7 8 9 10 11
31 Environment-Related Factors
The environment-related factors examined in the study are roadway alignment roadway function class number of lanes posted speed limit weather and lighting conditions
311 Road Environment
Road Alignment
Roadway alignment plays a significant role in the occurrence of ROR crashes Figure 2 shows the percentage frequency distributions of passenger vehicles involved in fatal single-vehicle ROR and OR crashes by road alignment (curved or straight)
902 621
98 379
0
50
100
Curve (N=95190) Straight (N=212832)
Pe
rce
nt
ROR OR
Figure 2 Percentage Frequency Distributions of Fatal Single-Vehicle ROR and OR Crashes by Road Alignment (FARS 1991-2007)
7
NHTSArsquos National Center for Statistics and Analysis 1200 New Jersey Avenue SE Washington DC 20590
_______________________________________________________________________
The statistics show that among all fatal single-vehicle crashes that occurred on the curved roads 902 percent were ROR crashes while among crashes that occurred on straight roadways 621 percent were ROR crashes In contrast the occurrence of OR crashes are more frequent on straight roadways A χ2 test shows that the difference between two percentages is statistically significant (p lt00001) thereby indicating that the curved road segments are more likely to be the scene of ROR crashes as compared to the straight roadways Improving roadway design (eg flattening curves signing or the more general curve delineation) could reduce the likelihood of ROR crashes
Roadway Function Class
It is also of interest to see if the roadway function class makes a difference in the occurrence of ROR crashes Figure 3 shows the percentage frequency distributions of passenger vehicles involved in fatal single-vehicle ROR and OR crashes by roadway function (rural or urban)
In fatal single-vehicle crashes among those that occurred on rural roads 806 percent were ROR crashes while among those that occurred on urban roadways 562 percent were ROR crashes In contrast the occurrence of OR crashes were more frequent on urban roadways A χ2 test shows that the difference between two percentages of ROR crashes is statistically significant (p lt00001) This shows that the rural roads are more likely to be the scene of ROR crashes as compared to the urban roads
806 562
194 438
0
50
100
Rural (N=183363) Urban (N=124248)
Pe
rce
nt
ROR OR
Figure 3 Percentage Frequency Distributions of Fatal Single-Vehicle ROR and OR Crashes by Roadway Function (FARS 1991-2007)
8
NHTSArsquos National Center for Statistics and Analysis 1200 New Jersey Avenue SE Washington DC 20590
_______________________________________________________________________
Road Posted Speed Limit
In most cases the actual vehiclersquos pre-crash travel speed is unknown In this analysis the posted speed limit was used as a proxy to a vehiclersquos travel speed Figure 4 shows the percentage frequency distributions of passenger vehicles involved in fatal single-vehicle ROR and OR crashes by posted speed limits (lt 60 mph and 60+ mph)
Among fatal single-vehicle crashes that occurred on roadways with posted speed limits of 60 mph and above 81 percent were ROR crashes while among the crashes that occurred on roadways with posted speed limits less than 60 mph 69 percent were ROR crashes A χ2 test shows that the difference between these two percentages is statistically significant (p lt00001) This in turn shows that the high speed limit roads are more likely to be the scene of ROR crashes as compared to the low speed limit roads
810 690
190 310
0
50
100
60+ mph (N=49687) lt 60 mph (N=251554)
Pe
rce
nt
ROR OR
Figure 4 Percentage Frequency Distributions of Fatal Single-Vehicle ROR and OR Crashes by Road Posted Speed Limits (FARS 1991-2007)
9
NHTSArsquos National Center for Statistics and Analysis 1200 New Jersey Avenue SE Washington DC 20590
_______________________________________________________________________
Roadway Number of Lanes
Another factor that is worth investigating is the roadway number of lanes Figure 5 shows the percentage frequency distributions of passenger vehicles involved in fatal single-vehicle ROR and OR crashes by roadway number of lanes Four categories of roadways were considered with reference to the number of lanes one or two lanes (divided or undivided) and three or more lanes (divided or undivided) The number of lanes refers to the number of lanes of a continuous cross-section of roadway For example a local roadway with one lane going north and one lane going south would be coded as two lanes However if a trafficway is a divided highway with two lanes going north a median and two lanes going south then the number of lanes is coded as two If a trafficway has two lanes going north immediately adjacent to two lanes going south one continuous cross-section of roadway then the number of lanes is coded as four
The results in Figure 5 show that among the fatal single-vehicle crashes that occurred on roadways with fewer lanes (one or two lanes) 678 percent (divided) and 766 percent (undivided) were ROR crashes while among the crashes that occurred on roads with three and more lanes 62 percent (divided) and 40 percent (undivided) were ROR crashes In contrast the occurrence of OR crashes were more frequent on roadways with three and more lanes as compared to one or more lanes both in the case of divided and undivided roadways
Statistically significant (p lt00001) difference shows that the roadways with fewer lanes (one or two lanes) are more likely to be the scene of ROR crashes as compared to the roadway with three and more lanes (divided or undivided) The roadway design or rehabilitation strategy such as building more lanes is likely to reduce ROR crashes 8
400 620 678 766
600 380 326 234
0
50
100
One or Tw o Lanes Divided
(N=53563)
One or Tw o Lanes Undivided (N=191462)
Three and More Lanes Divided
(N=35615)
Three and More Lanes Undivided
(N=18395)
Pe
rce
nt
ROR OR
Figure 5 Percentage Frequency Distributions of Fatal Single-Vehicle ROR and OR Crashes by Roadway Number of Lanes (FARS 1991-2007)
10
NHTSArsquos National Center for Statistics and Analysis 1200 New Jersey Avenue SE Washington DC 20590
_______________________________________________________________________
312 Weather Conditions
To investigate if certain weather conditions contribute to the occurrence of ROR crashes the percentage frequency distributions of passenger vehicles involved in fatal single-vehicle ROR and OR crashes by weather conditions were obtained Two weather conditions were considered for this purpose adverse (rain sleet snow fog fog and others - smog smoke blowing sand or dust) and good weather conditions (normal or clear) The results are presented in Figure 6
Among fatal single-vehicle crashes that occurred during adverse weather conditions 755 percent were ROR crashes while among crashes that occurred during good weather conditions 70 percent were ROR crashes On the other hand OR crashes were more frequent in good weather conditions
The significant difference between the two percentages (p lt00001) shows that ROR crashes are more likely to occur in adverse weather conditions as compared to good weather conditions Improving roadway design (eg providing skid-resistant pavement surfaces) could reduce the likelihood of ROR crashes
755 700
245 300
0
50
100
Adverse Weather (N=34152) Good Weather (N=273242)
Pe
rce
nt
ROR OR
Figure 6 Percentage Frequency Distributions of Fatal Single-Vehicle ROR and OR Crashes by Weather Conditions (FARS 1991-2007)
11
NHTSArsquos National Center for Statistics and Analysis 1200 New Jersey Avenue SE Washington DC 20590
_______________________________________________________________________
ROR OR
100
50
0
Night Time (N=155199) Day Time (N=149945)
742 665
258 335
Pe
rce
nt
313 Natural Lighting Conditions
Could visibility due to natural lighting be an issue in the occurrence of ROR crashes To answer this question frequency analysis was conducted for two lighting conditions nighttime and daytime Figure 7 shows the percentage frequency distributions of passenger vehicles involved in fatal single-vehicle ROR and OR crashes by lighting conditions
Among fatal single-vehicle crashes that occurred during nighttime (8 pm ndash 559 am) 742 percent were ROR crashes while among the crashes that occurred during daytime (6 am ndash 759 pm) 665 percent were ROR crashes In contrast the occurrence of OR crashes are more frequent during day time
A χ2 test confirms that the difference between two percentages is statistically significant (p lt00001) This shows that the night time driving is more likely to result into ROR crashes as compared to the day time period Reduced lighting like adverse weather is associated with a significant increase in the likelihood of single-vehicle ROR crashes
Figure 7 Percentage Frequency Distributions of Fatal Single-Vehicle ROR and OR Crashes by Lighting Conditions (FARS 1991-2007)
12
NHTSArsquos National Center for Statistics and Analysis 1200 New Jersey Avenue SE Washington DC 20590
_______________________________________________________________________
ROR OR
680 748
320 252
0
50
100
Pe
rce
nt
One Occupant (Driver Alone) Two or More Occupants (N=183611) (N=125559)
32 Occupant-Related Factors
The occupant-related factors examined in the study include vehicle occupancy driverrsquos gender age alcohol use and driver performance-related factors such as sleep inattention over-correction of the vehicle etc
321 Occupancy
It is of interest to see if the occupancy of a vehicle makes a difference in the occurrence of ROR crashes Figure 8 shows the percentage frequency distributions of passenger vehicles involved in fatal single-vehicle ROR and OR crashes by vehicle occupancy
Among fatal single-vehicle crashes involving a vehicle with only one occupant (driver alone) 680 percent were ROR crashes while among crashes involving a vehicle with two or more occupants 748 percent were ROR crashes A χ2 test confirms the difference between these two percentages to be statistically significant (p lt00001)
This shows that vehicles with high occupancy (two or more occupants) are more likely to be involved in ROR crashes as compared to a vehicle with the driver alone The reason for this is not immediately clear However a possible explanation could be the fact that the presence of other occupants in the vehicle is a likely source of distraction to the driver due to conversation and other activities 12
Figure 8 Percentage Frequency Distributions of Fatal Single-Vehicle ROR and OR Crashes by Vehicle Occupancy (FARS 1991-2007)
13
NHTSArsquos National Center for Statistics and Analysis 1200 New Jersey Avenue SE Washington DC 20590
_______________________________________________________________________
722 665
278 335
ROR OR
100
50
0
Male Driver (N=230416) Female Driver (N=78754)
Pe
rce
nt
322 Driverrsquos Gender
Among many driver-related factors driver gender that could possibly contribute to the occurrence of ROR crashes was studied Figure 9 shows the percentage frequency distributions of passenger vehicles involved in fatal single-vehicle ROR and OR crashes by driverrsquos gender
Among fatal single-vehicle crashes involving male drivers 722 percent were ROR crashes while 665 percent crashes involving female drivers were ROR crashes In contrast the occurrence of OR crashes are more frequent for female drivers A χ2 test shows that the difference between the two percentages is statistically significant (p lt00001)
Thus one could infer that vehicles with the male drivers are more likely to be involved in ROR crashes as compared to the vehicles with the female drivers
Figure 9 Percentage Frequency Distributions of Fatal Single-Vehicle ROR and OR Crashes by Driverrsquos Gender (FARS 1991-2007)
14
NHTSArsquos National Center for Statistics and Analysis 1200 New Jersey Avenue SE Washington DC 20590
_______________________________________________________________________
323 Driverrsquos Age
To look into driver age as a contributing factor in ROR crashes four age groups were considered 15 to 24 25 to 44 45 to 64 and 65 and older Figure 10 shows the percentage frequency distributions of passenger vehicles involved in fatal single-vehicle ROR and OR crashes by these age groups
Among fatal single-vehicle crashes involving young drivers 15 to 24 a higher percentage (752 percent) were of ROR crashes as compared to other age groups This shows that vehicles with young drivers 15 to 24 are more likely to be involved in ROR crashes as compared to other three age groups
727 664 752 686
273 336 248 314
0
50
100
15-24 (N=102962)
25-44 (N=121728)
45-64 (N=55303)
65+ (N=27195)
Pe
rce
nt
ROR OR
Figure 10 Percentage Frequency Distributions of Fatal Single-Vehicle ROR and OR Crashes by Driverrsquos Age (FARS 1991-2007)
15
NHTSArsquos National Center for Statistics and Analysis 1200 New Jersey Avenue SE Washington DC 20590
_______________________________________________________________________
583 865
417 135
0
50
100
BAC=0 (N=172537) BAC=001+ (N=136633)
Pe
rce
nt
ROR OR
Figure 11 Percentage Frequency Distributions of Fatal Single-Vehicle ROR and OR Crashes by Driverrsquos Alcohol Use (FARS 1991-2007)
324 Alcohol-Related Driving
Alcohol involvement of a driver often leads to safety issues such as loss of vehicle control that may result into a ROR crash Two categories of drivers sober (BAC=0) and alcohol involved (BAC=01+) were considered in the analysis to see if alcohol use contributes to ROR crashes Figure 11 shows the percentage frequency distributions of passenger vehicles involved in fatal single-vehicle ROR and OR crashes by driverrsquos alcohol use
Among fatal single-vehicle crashes involving drivers with alcohol use (BAC=01+) 865 percent were ROR crashes while among those drivers with no alcohol (BAC=0) 583 percent were ROR crashes The difference between these two percentages is statistically significant (p lt00001) This indicates that the drivers with alcohol use are more likely to be involved in ROR crashes as compared to sober drivers
16
NHTSArsquos National Center for Statistics and Analysis 1200 New Jersey Avenue SE Washington DC 20590
_______________________________________________________________________
325 Driver-Performance-Related Factors
Some of the driver performance-related factors that are likely to contribute to the occurrence of ROR crashes were also examined
These include (1) sleepy (drowsy asleep fatigued and sleepy) (2) inattentive (talking eating etc) (3) over-correcting of the vehicle (4) avoiding (avoiding swerving or sliding due to severe crosswind tire blow-out or flat live animals in road vehicle in road etc) (5) distractions inside vehicles (cellular telephone computer fax machine etc) and (6) other driver-performance-related factors such as mentally challenged following improperly failure to signal intensions etc
Figure 12 shows the percentage frequency distributions of passenger vehicles involved in fatal single-vehicle ROR and OR crashes based on the driver performance-related factors The statistics show that the percentages of sleepy (912) inattentive (754) over correction of the vehicle (856) and crash avoiding (798) drivers involved in fatal single-vehicle ROR crashes are significantly greater (p lt00001) than the drivers with lsquoOther driver performance-related factorsrsquo that account for 67 percent of ROR crashes
This means that drivers with these performance-related factors (sleepy inattentive over correction avoiding etc) are more likely to be involved in ROR crashes as compared to drivers with other performance-related factors These results are consistent with those obtained from other studies using different approaches and other crash databases 2-11
17
NHTSArsquos National Center for Statistics and Analysis 1200 New Jersey Avenue SE Washington DC 20590
_______________________________________________________________________
672 671 798 856 754 912
328 329 202 144 246 88
0
20
40
60
80
100
Sleepy (N=14774)
Inattention (N=28081)
Overcorrect (N=19289)
Avoiding (N=14145)
Possible Distraction (N=1429)
Others (N=227587)
Per
cen
t
ROR OR
Figure 12 Percentage Frequency Distributions of Fatal Single-Vehicle ROR and OR Crashes by Driver Performance-Related Factors (FARS 1991-2007)
18
NHTSArsquos National Center for Statistics and Analysis 1200 New Jersey Avenue SE Washington DC 20590
_______________________________________________________________________
33 Vehicle-Related Factors
It is generally believed that ROR crashes are likely to occur due to some vehicle-related factors such as vehicle speeding or vehicle type
331 Vehicle Speeding Status
A crash is considered speeding-related if any driver involved in the crash is charged with a speeding-related offense or if a police officer indicates that racing driving too fast for the conditions or exceeding the posted speed limit was a related factor in the crash 13
Figure 13 shows the percentage frequency distributions of passenger vehicles involved in fatal single-vehicle ROR and OR crashes by vehicle speeding status
Among fatal single-vehicle crashes that involved a speeding vehicle 90 percent were ROR crashes while among crashes that did not involve a speeding vehicle 595 percent were ROR crashes A χ2 test shows that the difference between two percentages is statistically significant (p lt00001) thereby showing that speeding vehicles are more likely to be involved in ROR crashes as compared to non-speeding vehicles
900 595
100 405
0
50
100
Speeding (N=113825) Non-Speeding (N=195345)
Pe
rce
nt
ROR OR
Figure 13 Percentage Frequency Distributions of Fatal Single-Vehicle ROR and OR Crashes by Vehicle Speeding Status (FARS 1991-2007)
19
NHTSArsquos National Center for Statistics and Analysis 1200 New Jersey Avenue SE Washington DC 20590
_______________________________________________________________________
500 520 600 670 730 710
500 480 400 330 270 290
00
200
400
600
800
1000
Passenger Car
(N=178430)
LT Pickup
(N=72065)
LT Utility
(N=38970)
LT MiniVan
(N=11159)
LT Other Van (N=7904)
LT Others (N=642)
Pe
rce
nt
ROR OR
Figure 14 shows the percentage frequency distributions of passenger vehicles involved in fatal single-vehicle ROR and OR crashes by passenger vehicle type passenger car light truck (LT) including pickup utility minivan other van and other light trucks) It shows that passenger cars are more likely to be involved in ROR crashes as compared to other passenger vehicle types Minivans (60) are more likely to be involved in ROR crashes (p lt00001) as compared to other vans (52)
332 Vehicle Type
Figure 14 Percentage Frequency Distributions of Fatal Single-Vehicle ROR and OR Crashes by Vehicle Type (FARS 1991-2007)
20
NHTSArsquos National Center for Statistics and Analysis 1200 New Jersey Avenue SE Washington DC 20590
_______________________________________________________________________
4 Logistic Regression
The analysis in the previous sections shows that factors such as driver sleepiness alcohol use vehicle speeding curved roadway rural roads etc are significant contributors to the occurrence of fatal single-vehicle ROR crashes It remains to assess their relative influence as well as estimate the amount of risk each carries in the occurrence of such crashes Logistic regression was used for this purpose This is a modeling procedure that predicts the probability (p) of occurrence of an event (fatal single-vehicle ROR crash in the present case) as a consequence of certain roadway- driver- environment- and vehicle-related factors such as sleepy alcohol use weather condition lighting condition speeding status road function etc Generally the logistic regression model provides log of odds as a function of the predictors
Log (odds) = a0 + a1timesdriver performance-related factor + a2timesalcohol use + a3timesspeeding status + a4timesweather condition + a5timeslighting conditionhellip + aktimesspeeding statustimesweather condition + ak+1timesspeeding statustimesdriverrsquos age +helliphellip
where a0 is the intercept and a1 a2 a3 helliphellip ak ak+1 helliphellip are the regression coefficients
As in the previous analysis FARS data was used in the modeling procedure Since in FARS driverrsquos alcohol involvement is estimated by Multiple Imputation (MI) 16 17
procedure the SAS MIANALYZE procedure was used in this study to perform the analysis of the MI data generated from the logistic regression18
21
NHTSArsquos National Center for Statistics and Analysis 1200 New Jersey Avenue SE Washington DC 20590
_______________________________________________________________________
41 Logistic Regression Results and Interpretation
Of all the variables considered in the logistic regression only 10 showed up as significant predictors (95 confidence level) As regards the interaction effect of these factors only the interaction of speeding with other variables was considered However only three of these interactions emerged as significant (95 confidence level) The results in Table 1 present estimates of regression coefficients and the corresponding odds ratio only for significant main effects and interactions Since the independent variables (predictors) are dichotomous the influence of the corresponding factors can be compared simply by comparing their regression coefficients
The ordered (decreasing) estimates of regression coefficients in Table 1 show that the most influential factor in the occurrence of fatal single-vehicle ROR crashes is the driver performance-related factor sleepy followed by alcohol use roadway alignment with curve speeding passenger car rural roadway number of lanes high-speed-limit road adverse weather and avoiding With regard to the interaction effect of speeding with other factors speeding with drivers of age groups 15 to 24 and 25 to 44 as well as speeding under adverse weather are significant contributors to the likelihood of ROR crashes
Table 1 Multiple Imputation Parameter Estimates Dagger
Variables Estimate Odds Ratio Driver performance-related factor sleepy vs others 11675 Dagger 321 Driver with alcohol BAC=01+ gdL vs BAC=0 06605 Dagger 194 Road alignment curve vs straight 05535 Dagger 174 Vehicle speeding status speeding vs non-speeding 04966 Dagger 164 Vehicle type passenger car vs other LTs 04780 Dagger 161 Road function rural vs urban 03637 Dagger 144 Roadway of lanes one or two (undivided) vs three amp more (undivided) 03346 Dagger 141 Road speed limit ge 60 mph vs lt60 mph 02659 Dagger 130 Weather adverse vs good 02130 Dagger 124 Driver performance-related factor avoiding vs others 02007 Dagger 122 Weather timesSpeeding status adverse amp speeding vs good amp non-speeding 01056 Dagger 111 Driver Age times Speeding status 25-44 amp speeding vs 65+ amp non-speeding 01003 Dagger 111 Driver Age times Speeding status 15-24 amp speeding vs 65+ amp non-speeding 00578 Dagger 106
Statistically significant variables (α = 005) associated with the high risk (odds ratio gt100) Other variables with low risk (odds ratio lt100) or insignificance (pgt005) after jointly estimating the effect are not shown here Dagger p-value lt00001
One of the most important by-product of logistic regression is the estimate of odds ratio that tells a great deal about the risk a certain factor carries in contributing to the occurrence of ROR crashes Specifically odds ratio measures the magnitude of increase in odds of happening of an event as a result of a unit increase in a predictor (eg sober and alcohol-used driver) An odds ratio value of 1 is indicative of no influence Table 1 also shows odds ratio estimates of significant factors and interactions
22
NHTSArsquos National Center for Statistics and Analysis 1200 New Jersey Avenue SE Washington DC 20590
_______________________________________________________________________
1
250 226
o 200
ita 164
Rd
s 150
d 124
O 100 100
050
Non-Speeding+Good Weather Non-Speeding+Adverse Weather
Speeding+Good Weather Speeding+Adverse Weather
Figure 15 Odds Ratio by Speeding Status and Weather Conditions
The odds ratio 321 for the factor ldquodriver performance-related factorrdquo shows that the odds of being involved in an ROR crash for a sleepy driver are three times as large as that for the driver who is not sleepy
The odds ratio 194 for the factor ldquodriver with alcoholrdquo shows that the odds of being involved in an ROR crash for an alcohol used driver (BAC=01+ gdL) are almost two times as large as that for a sober driver (BAC=0)
The odds ratio 174 for the factor ldquoroad alignmentrdquo shows that the odds of being involved in an ROR crash on curved roadways are 174 times as large as that on straight roadways in fatal single-vehicle crashes
The odds ratio 164 for the factor ldquovehicle speeding statusrdquo shows that the odds of being involved in an ROR crash for speeding vehicles are 164 times as large as that for non-speeding vehicles
The odds ratio 161 for the factor ldquovehicle typerdquo shows that the odds of being involved in an ROR crash for passenger cars are 161 times as large as that for other LTs
The odds ratio 144 for the factor ldquoroad functionrdquo shows that the odds of being involved in an ROR crash on rural roadways are 144 times as large as that on urban roadways
The odds ratio 266 for the factor ldquoweather amp speeding statusrdquo shows that the odds of being involved in an ROR crash under the adverse weather and in speeding vehicle are 266 (=164times124times111) times as large as that under the good weather and in non-speeding vehicle (Figure 15)
23
NHTSArsquos National Center for Statistics and Analysis 1200 New Jersey Avenue SE Washington DC 20590
_______________________________________________________________________
5 Conclusions
Run-off-road crashes account for a significant percentage (around 70) of all fatal single-vehicle crashes FARS data (1991 to 2007) that includes detailed information about ROR crashes provided sufficient statistical evidence to conclude that certain roadway- driver- environment- and vehicle-related factors closely associated with the occurrence of these crashes Appropriate crash countermeasures based on the identified factors can reduce the occurrence of single-vehicle ROR crashes and hence of the fatalities
Curved road segments rural roads high-speed-limit roadways and roadways with fewer lanes (divided or undivided) are found to be more likely to be the scene of fatal single-vehicle ROR crashes as compared to the fatal single-vehicle OR crashes Similarly among environmental factors adverse weather and night time periods are the factors associated with high risk of fatal single-vehicle ROR crashes
Vehicles with high occupancy (two and more occupants) male driver younger driver and alcohol used by driver are more likely to be involved in fatal single-vehicle ROR crashes as compared to the fatal single-vehicle OR crashes Drivers with performance-related factors (sleepy inattentive over-correction avoiding etc) are more likely to be involved in the fatal single-vehicle ROR crashes Speeding vehicles and passenger cars are also associated with high risks of the fatal single-vehicle ROR crashes
In the adverse weather condition and for the younger drivers (15 to 24 and 25 to 44) the speeding vehicle would increase the risk of fatal single-vehicle ROR crashes by an additional factor
The above facts based on statistical evidence suggest several crash countermeasures For example improving roadway design such as flattening curves and installing shoulder rumble strips or rehabilitation strategies such as building wide lanes or adding additional unpaved shoulder width on entire system providing skid-resistant pavement surfaces could reduce the likelihood of ROR crashes
24
NHTSArsquos National Center for Statistics and Analysis 1200 New Jersey Avenue SE Washington DC 20590
_______________________________________________________________________
6 References
1 FHWA (Undated) Reducing Highway Fatalities Washington DC Federal Highway Administration httpsafetyfhwadotgovroadway5Fdept
2 Neuman T RPfefer R Slack K L Council F McGee H Prothe L amp Eccles K (1998) Guidance for Implementation of the AASHTO Strategic Highway Safety Plan Report 500 Volume 6 A Guide for Addressing Run-Off Road Collisions Washington DC Transportation Research Board Available at httponlinepubstrborgonlinepubsnchrpnchrp_rpt_500v6pdf
3 Spainhour L K amp Mishra A (2007) Analysis of Fatal Run-off-the-Road Crashes Involving Overcorrection TRB 87th Annual Meeting Paper No 08-0661 Washington DC Transportation Research Board
4 McGee H W amp Hanscom F R Low-Cost Treatments for Horizontal Curve Safety FHWA-SA-07-002 December 2006
5 Johnston I Corben B TriggsT Candappa N amp Lenneacute M Reducing Serious Injury and Death from Run-off-Road Crashes in Victoria ndash Turning Knowledge into Action (2006 June) RACV Research Report Victoria Australia Royal Automobile Club of Victoria Ltd
6 Dissanayake S (2003 August) Young Drivers and Run-Off-the-Road Crashes Proceedings of the 2003 Mid-Continent Transportation Research Symposium Ames Iowa
7 Knapp K K Giese K L amp Lee W (2003 August) Urban Four-Lane Undivided to Three-Lane Roadway Conversion Guidelines Proceedings of the 2003 Mid-Continent Transportation Research Symposium Ames Iowa
8 Őrnek E amp Drakopoulos A (2007 August) Analysis of Run-Off-Road Crashes in Relation to Roadway Features and Driver Behavior Proceedings of the 2007 Mid-Continent Transportation Research Symposium Ames Iowa
9 Ray M H amp McGinnis R G (1997) Guardrail and Median Barrier Crashworthiness A Synthesis of Highway Practice NCHRP Synthesis 244 Washington DC Transportation Research Board National Research Council
10 Roadside Design Guide (2006) 3rd Edition Washington DC American Association of State Highway and Transportation Officials
25
NHTSArsquos National Center for Statistics and Analysis 1200 New Jersey Avenue SE Washington DC 20590
_______________________________________________________________________
11 Elvik R (1995) The Safety Value of Guardrails and Crash Cushions A Meta-Analysis of Evidence from Evaluation Studies Accident Analysis and Prevention 27 (4)
12 Stutts J C Reinfurth D W Staplin L amp Rodgman EA (2001 May) The Role of Driver Distraction in Traffic Crashes Washington DC AAA Foundation for Traffic Safety
13 Liu C Chen C-L Subramanian R amp Utter D (2005 June) Analysis of Speeding-Related Fatal Motor Vehicle Traffic Crashes NHTSA Technical Report DOT HS 809 839 Washington DC National Highway Traffic Safety Administration
14 Hosmer Jr D W and Lemeshow S (1989) Applied Logistic Regression New York John Wiley amp Sons Inc
15 SAS Institute Inc (1995) Logistic Regression Examples using SAS system Cary NC SAS Institute Inc
16 Rubin D B Schafer J L amp Subramanian R (1998 October) Multiple Imputation of Missing Blood Alcohol Concentration (BAC) Values in FARS NHTSA Technical Report DOT HS 808 816 Washington DC National Highway Traffic Safety Administration
17 Subramanian R (2005 March) Alcohol Involvement in Fatal Motor Vehicle Traffic Crashes NHTSA Technical Report DOT HS 809 822 Washington DC National Highway Traffic Safety Administration
18 SASSTAT Userrsquos Guide Version 8 1999 Cary NC SAS Institute Inc
26
NHTSArsquos National Center for Statistics and Analysis 1200 New Jersey Avenue SE Washington DC 20590
DOT HS 811 232November 2009
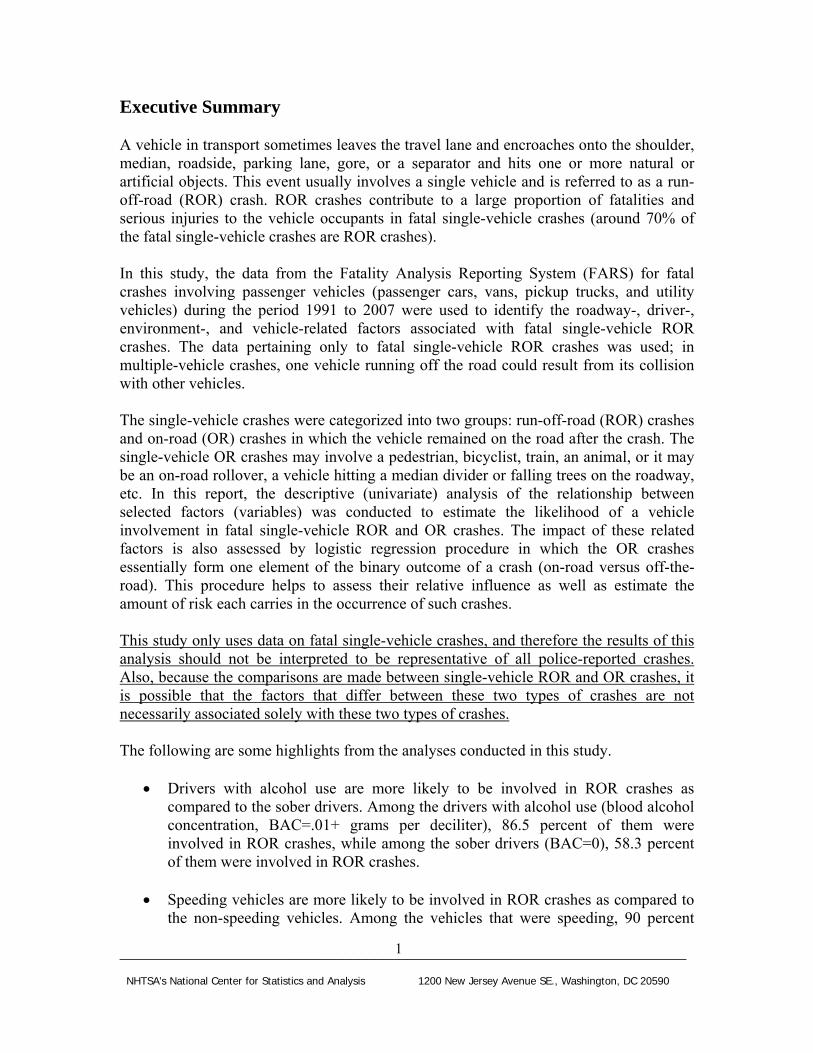
_______________________________________________________________________
Executive Summary
A vehicle in transport sometimes leaves the travel lane and encroaches onto the shoulder median roadside parking lane gore or a separator and hits one or more natural or artificial objects This event usually involves a single vehicle and is referred to as a runshyoff-road (ROR) crash ROR crashes contribute to a large proportion of fatalities and serious injuries to the vehicle occupants in fatal single-vehicle crashes (around 70 of the fatal single-vehicle crashes are ROR crashes)
In this study the data from the Fatality Analysis Reporting System (FARS) for fatal crashes involving passenger vehicles (passenger cars vans pickup trucks and utility vehicles) during the period 1991 to 2007 were used to identify the roadway- driver- environment- and vehicle-related factors associated with fatal single-vehicle ROR crashes The data pertaining only to fatal single-vehicle ROR crashes was used in multiple-vehicle crashes one vehicle running off the road could result from its collision with other vehicles
The single-vehicle crashes were categorized into two groups run-off-road (ROR) crashes and on-road (OR) crashes in which the vehicle remained on the road after the crash The single-vehicle OR crashes may involve a pedestrian bicyclist train an animal or it may be an on-road rollover a vehicle hitting a median divider or falling trees on the roadway etc In this report the descriptive (univariate) analysis of the relationship between selected factors (variables) was conducted to estimate the likelihood of a vehicle involvement in fatal single-vehicle ROR and OR crashes The impact of these related factors is also assessed by logistic regression procedure in which the OR crashes essentially form one element of the binary outcome of a crash (on-road versus off-theshyroad) This procedure helps to assess their relative influence as well as estimate the amount of risk each carries in the occurrence of such crashes
This study only uses data on fatal single-vehicle crashes and therefore the results of this analysis should not be interpreted to be representative of all police-reported crashes Also because the comparisons are made between single-vehicle ROR and OR crashes it is possible that the factors that differ between these two types of crashes are not necessarily associated solely with these two types of crashes
The following are some highlights from the analyses conducted in this study
Drivers with alcohol use are more likely to be involved in ROR crashes as compared to the sober drivers Among the drivers with alcohol use (blood alcohol concentration BAC=01+ grams per deciliter) 865 percent of them were involved in ROR crashes while among the sober drivers (BAC=0) 583 percent of them were involved in ROR crashes
Speeding vehicles are more likely to be involved in ROR crashes as compared to the non-speeding vehicles Among the vehicles that were speeding 90 percent
1
NHTSArsquos National Center for Statistics and Analysis 1200 New Jersey Avenue SE Washington DC 20590
_______________________________________________________________________
were involved in ROR crashes while among vehicles that were not speeding 595 percent were involved in ROR crashes
Curved road segments are more likely to be the scene of ROR crashes as compared to the straight roadways Among the crashes that occurred on curved roads 902 percent of them were ROR crashes while among those that occurred on straight roadways 621 percent were ROR crashes
Rural roads are more likely to be the scene of ROR crashes as compared to the urban roads Among all crashes that occurred on rural roadways 806 percent of them were ROR crashes while among the crashes that occurred on urban roadways 562 percent of them were ROR crashes
In most cases the actual vehiclersquos pre-crash travel speed is unknown In this analysis the posted speed limit was used as a proxy to a vehiclersquos travel speed Among all the crashes that occurred on roadways with posted speed limits of 60 mph and above 81 percent were in ROR crashes while among the crashes that occurred on roadways with speed limits less than 60 mph 69 percent of the vehicles were in ROR crashes The high speed limit roads are more likely to be the scene of ROR crashes as compared to the low speed limit roads
Roadways with fewer lanes (one or two lanes) are more likely to be the scene of ROR crashes as compared to the roadways with three and more lanes (divided or undivided) Among all the crashes that occurred on roadways with fewer lanes 678 percent (divided) and 766 percent (undivided) were ROR crashes while among the crashes that occurred on roads with three and more lanes 62 percent (divided) and 40 percent (undivided) were ROR crashes
ROR crashes are more likely to occur in adverse weather conditions (rain sleet snow fog fog and others - smog smoke blowing sand or dust) as compared to good weather conditions (normal or clear) Among the crashes that occurred in adverse weather conditions 755 percent of the crashes were ROR crashes while among those crashes that occurred in good weather conditions 70 percent were ROR crashes
ROR crashes are more likely to occur during nighttime as compared to the daytime Among the crashes that occurred during nighttime (8 pm ndash 559 am) 742 percent were ROR crashes while among those crashes that occurred during the day time period (6 am ndash 759 pm) 665 percent were ROR crashes
Vehicles with high occupancy (two or more occupants) are more likely to be involved in ROR crashes as compared to the vehicles with drivers alone Among crashes involving vehicles with the drivers as the only occupants 680 percent were ROR crashes while among vehicles involved with two or more occupants 748 percent were ROR crashes
2
NHTSArsquos National Center for Statistics and Analysis 1200 New Jersey Avenue SE Washington DC 20590
_______________________________________________________________________
Vehicles driven by young drivers (age 15 to 24) are more likely to be involved in ROR crashes as compared to other age groups of drivers
Vehicles with male drivers are more likely to be involved in ROR crashes as compared to the vehicles with female drivers
Drivers with performance-related factors such as sleepiness inattentiveness over-correction of the vehicle or crash-avoiding are more likely to be involved in ROR crashes as compared to other driver-performance-related factors The percentages of sleepy (912) inattentive (754) over-correction of the vehicle (856) and crash-avoiding (798) drivers involved in fatal single-vehicle ROR crashes are significantly greater (p lt00001) than the drivers with other performance-related factors that account for 67 percent of ROR crashes
Among all passenger vehicles (passenger cars vans pickup trucks and utility vehicles) passenger cars are more likely to be involved in fatal single-vehicle ROR crashes as compared to other passenger vehicle types
Logistic regression modeling was used to assess their relative influence as well as estimate the amount of risk each factor carries in the occurrence of such crashes It shows that the most influential factor in the occurrence of fatal single-vehicle ROR crashes is the driver performance-related factor sleepy followed by alcohol use roadway alignment with curve vehicle speeding passenger car rural roadway high-speed-limit road adverse weather and crash-avoiding In the adverse weather condition and for the younger drivers (15 to 24 and age 25 to 44) the vehicle speeding would increase the risk of fatal single-vehicle ROR crashes by an additional factor
3
NHTSArsquos National Center for Statistics and Analysis 1200 New Jersey Avenue SE Washington DC 20590
_______________________________________________________________________
NHTSArsquos National Center for Statistics and Analysis 1200 New Jersey Avenue SE Washington DC 20590
4
Total Fatal Single-Vehicle Crashes (Bar Graph) and Percent ROR Crashes (Line Graph) 1991-2007 75
73
71
69
67
65
91 2 3 4 5 6 79 9 9 9 9 99 9 9 9 9 9 98 9 0 1 2 3 04 5 619 19
9 0 0 0 0 0 07
9 0 0 0 0 0 01 1 1 1 1 1 1 2 2 2 2 20 200
2 2Year
19000
18500
s ehsa
Cr 18000
R
t R
Oencre 17500
P
17000
16500
s
ehsar
Cle
ic
heV-el
gin
l S
atal
Fat
oT
Figure 1 Total Passenger Vehicle Fatal Single-Vehicle Crashes (Bar Graph) and the Percent of ROR Crashes (Line Graph) 1991-2007 (FARS 1991-2007)
1 Introduction A vehicle in transport sometimes leaves the travel lane and encroaches onto the shoulder median roadside parking lane gore or a separator and hits one or more natural or artificial objects This event usually involves a single vehicle and is referred to as a runshyoff-road crash ROR crashes contribute to a large proportion of fatalities and serious injuries to the vehicle occupants in fatal single-vehicle crashes -- around 70 percent of the fatal single-vehicle crashes are ROR crashes In contrast there are crashes in which a vehicle remains on the road after the crash and are referred as on-road crashes The single-vehicle OR crashes may involve a pedestrian bicyclist train an animal or it may be an on-road rollover a vehicle hitting a median divider or falling trees on the roadway etc The OR crashes contribute to around 30 percent of the fatal single-vehicle crashes The total number of passenger vehicle fatal single-vehicle crashes (bar graph right label) and the percentage that were ROR crashes (line graph left label) from 1991 to 2007 are shown in Figure 1 The total numbers of fatal single-vehicle crashes fluctuate over the years 1991 to 2007 However the percent of ROR crashes shows an upward trend during the same time period (with 68 percent in 1991 and 73 percent in 2007) Keeping vehicles on the roadway is one of the major goals of Strategic Highway Safety Plan1 2
_______________________________________________________________________
The reasons for an ROR crash are varied and include avoiding a vehicle object or an animal in the travel lane over-correction during the operation of the vehicle inattentive driving due to distraction fatigue sleep or alcohol the effects of weather on pavement conditions and traveling too fast through a curve There are also a number of roadway design factors (eg travel lanes that are too narrow substandard curves) that can increase the probability that a driver error may result into an ROR crash 2-6
This study aims to identify the roadway factors (eg ruralurban nature and curve existence) driver factors (eg age gender sleepy and alcohol use) environmental factors (eg weather lighting condition) and vehicle-related factors (eg speeding) associated with the fatal single-vehicle ROR crashes The analyses on the relationship between selected factors (variables) and the likelihood of fatal single-vehicle ROR and OR crashes are presented
The study is focused only on fatal crashes that is a crash that involve a motor vehicle in transport traveling on a traffic way customarily open to the public and resulting in the death of a person (occupant of a vehicle or a non-motorist) within 30 days of the crash Therefore the results presented in this study can not be generalized to the entire crash population Also because the comparisons are made between single-vehicle ROR and OR crashes it is possible that the factors that differ between these two types of crashes are not necessarily associated solely with these two types of crashes
The outline of this report is as follows Section 2 presents the data and the method used in this report Section 3 presents the descriptive (univariate) statistics through the percentage frequency distributions of fatal single-vehicle ROR versus fatal single-vehicle OR crashes by various roadway- environment- occupant- and vehicle-related factors Section 4 assesses their relative influence as well as estimates the amount of risk each factor carries in the occurrence of such crashes using logistic regression The conclusions are presented in Section 5
5
NHTSArsquos National Center for Statistics and Analysis 1200 New Jersey Avenue SE Washington DC 20590
_______________________________________________________________________
2 Data and Methodology
The data used in this study comes from the Fatality Analysis Reporting System for fatal crashes during the period 1991 to 2007 All analyses in this report pertain to fatal single-vehicle ROR crashes that involve passenger vehicles including cars vans pickup trucks and utility vehicles with gross vehicle weight ratings under 10000 lbs
In this study the fatal single-vehicle crashes were categorized into two groups ROR crashes and OR crashes in which the vehicles were still on the road after the crashdagger The descriptive (univariate) analysis of the relationship between selected factors (variables) was conducted to estimate the likelihood of a vehicle involvement in fatal single-vehicle ROR and OR crashes The chi-square test is used to assess the differences in percentages between groups and is statistically significant at α = 005 significance level when p lt005 The impact of these related factors is also assessed by logistic regression procedure in which the OR crashes essentially form one element of the binary outcome (on-road versus off- road) This procedure helps to assess their relative influence as well as estimate the amount of risk each carries in the occurrence of such crashes
dagger For the designation of ROR and OR crash refer to FARS Analytical Reference Guide 1975-2006 DOT HS 810 605 May 2006
6
NHTSArsquos National Center for Statistics and Analysis 1200 New Jersey Avenue SE Washington DC 20590
_______________________________________________________________________
3 Factors Related to Fatal Single-Vehicle ROR Crashes
In this section a descriptive (univariate) approach is used to identify the roadway- driver- environment- and vehicle-related factors (variables) that may have strong association with the fatal single-vehicle ROR crashes Based on other studies several variables were considered that include the curvature of the road roadway function class (ruralurban) number of lanes posted speed limit weather and lighting conditions age gender and alcohol use by the driver7 8 9 10 11
31 Environment-Related Factors
The environment-related factors examined in the study are roadway alignment roadway function class number of lanes posted speed limit weather and lighting conditions
311 Road Environment
Road Alignment
Roadway alignment plays a significant role in the occurrence of ROR crashes Figure 2 shows the percentage frequency distributions of passenger vehicles involved in fatal single-vehicle ROR and OR crashes by road alignment (curved or straight)
902 621
98 379
0
50
100
Curve (N=95190) Straight (N=212832)
Pe
rce
nt
ROR OR
Figure 2 Percentage Frequency Distributions of Fatal Single-Vehicle ROR and OR Crashes by Road Alignment (FARS 1991-2007)
7
NHTSArsquos National Center for Statistics and Analysis 1200 New Jersey Avenue SE Washington DC 20590
_______________________________________________________________________
The statistics show that among all fatal single-vehicle crashes that occurred on the curved roads 902 percent were ROR crashes while among crashes that occurred on straight roadways 621 percent were ROR crashes In contrast the occurrence of OR crashes are more frequent on straight roadways A χ2 test shows that the difference between two percentages is statistically significant (p lt00001) thereby indicating that the curved road segments are more likely to be the scene of ROR crashes as compared to the straight roadways Improving roadway design (eg flattening curves signing or the more general curve delineation) could reduce the likelihood of ROR crashes
Roadway Function Class
It is also of interest to see if the roadway function class makes a difference in the occurrence of ROR crashes Figure 3 shows the percentage frequency distributions of passenger vehicles involved in fatal single-vehicle ROR and OR crashes by roadway function (rural or urban)
In fatal single-vehicle crashes among those that occurred on rural roads 806 percent were ROR crashes while among those that occurred on urban roadways 562 percent were ROR crashes In contrast the occurrence of OR crashes were more frequent on urban roadways A χ2 test shows that the difference between two percentages of ROR crashes is statistically significant (p lt00001) This shows that the rural roads are more likely to be the scene of ROR crashes as compared to the urban roads
806 562
194 438
0
50
100
Rural (N=183363) Urban (N=124248)
Pe
rce
nt
ROR OR
Figure 3 Percentage Frequency Distributions of Fatal Single-Vehicle ROR and OR Crashes by Roadway Function (FARS 1991-2007)
8
NHTSArsquos National Center for Statistics and Analysis 1200 New Jersey Avenue SE Washington DC 20590
_______________________________________________________________________
Road Posted Speed Limit
In most cases the actual vehiclersquos pre-crash travel speed is unknown In this analysis the posted speed limit was used as a proxy to a vehiclersquos travel speed Figure 4 shows the percentage frequency distributions of passenger vehicles involved in fatal single-vehicle ROR and OR crashes by posted speed limits (lt 60 mph and 60+ mph)
Among fatal single-vehicle crashes that occurred on roadways with posted speed limits of 60 mph and above 81 percent were ROR crashes while among the crashes that occurred on roadways with posted speed limits less than 60 mph 69 percent were ROR crashes A χ2 test shows that the difference between these two percentages is statistically significant (p lt00001) This in turn shows that the high speed limit roads are more likely to be the scene of ROR crashes as compared to the low speed limit roads
810 690
190 310
0
50
100
60+ mph (N=49687) lt 60 mph (N=251554)
Pe
rce
nt
ROR OR
Figure 4 Percentage Frequency Distributions of Fatal Single-Vehicle ROR and OR Crashes by Road Posted Speed Limits (FARS 1991-2007)
9
NHTSArsquos National Center for Statistics and Analysis 1200 New Jersey Avenue SE Washington DC 20590
_______________________________________________________________________
Roadway Number of Lanes
Another factor that is worth investigating is the roadway number of lanes Figure 5 shows the percentage frequency distributions of passenger vehicles involved in fatal single-vehicle ROR and OR crashes by roadway number of lanes Four categories of roadways were considered with reference to the number of lanes one or two lanes (divided or undivided) and three or more lanes (divided or undivided) The number of lanes refers to the number of lanes of a continuous cross-section of roadway For example a local roadway with one lane going north and one lane going south would be coded as two lanes However if a trafficway is a divided highway with two lanes going north a median and two lanes going south then the number of lanes is coded as two If a trafficway has two lanes going north immediately adjacent to two lanes going south one continuous cross-section of roadway then the number of lanes is coded as four
The results in Figure 5 show that among the fatal single-vehicle crashes that occurred on roadways with fewer lanes (one or two lanes) 678 percent (divided) and 766 percent (undivided) were ROR crashes while among the crashes that occurred on roads with three and more lanes 62 percent (divided) and 40 percent (undivided) were ROR crashes In contrast the occurrence of OR crashes were more frequent on roadways with three and more lanes as compared to one or more lanes both in the case of divided and undivided roadways
Statistically significant (p lt00001) difference shows that the roadways with fewer lanes (one or two lanes) are more likely to be the scene of ROR crashes as compared to the roadway with three and more lanes (divided or undivided) The roadway design or rehabilitation strategy such as building more lanes is likely to reduce ROR crashes 8
400 620 678 766
600 380 326 234
0
50
100
One or Tw o Lanes Divided
(N=53563)
One or Tw o Lanes Undivided (N=191462)
Three and More Lanes Divided
(N=35615)
Three and More Lanes Undivided
(N=18395)
Pe
rce
nt
ROR OR
Figure 5 Percentage Frequency Distributions of Fatal Single-Vehicle ROR and OR Crashes by Roadway Number of Lanes (FARS 1991-2007)
10
NHTSArsquos National Center for Statistics and Analysis 1200 New Jersey Avenue SE Washington DC 20590
_______________________________________________________________________
312 Weather Conditions
To investigate if certain weather conditions contribute to the occurrence of ROR crashes the percentage frequency distributions of passenger vehicles involved in fatal single-vehicle ROR and OR crashes by weather conditions were obtained Two weather conditions were considered for this purpose adverse (rain sleet snow fog fog and others - smog smoke blowing sand or dust) and good weather conditions (normal or clear) The results are presented in Figure 6
Among fatal single-vehicle crashes that occurred during adverse weather conditions 755 percent were ROR crashes while among crashes that occurred during good weather conditions 70 percent were ROR crashes On the other hand OR crashes were more frequent in good weather conditions
The significant difference between the two percentages (p lt00001) shows that ROR crashes are more likely to occur in adverse weather conditions as compared to good weather conditions Improving roadway design (eg providing skid-resistant pavement surfaces) could reduce the likelihood of ROR crashes
755 700
245 300
0
50
100
Adverse Weather (N=34152) Good Weather (N=273242)
Pe
rce
nt
ROR OR
Figure 6 Percentage Frequency Distributions of Fatal Single-Vehicle ROR and OR Crashes by Weather Conditions (FARS 1991-2007)
11
NHTSArsquos National Center for Statistics and Analysis 1200 New Jersey Avenue SE Washington DC 20590
_______________________________________________________________________
ROR OR
100
50
0
Night Time (N=155199) Day Time (N=149945)
742 665
258 335
Pe
rce
nt
313 Natural Lighting Conditions
Could visibility due to natural lighting be an issue in the occurrence of ROR crashes To answer this question frequency analysis was conducted for two lighting conditions nighttime and daytime Figure 7 shows the percentage frequency distributions of passenger vehicles involved in fatal single-vehicle ROR and OR crashes by lighting conditions
Among fatal single-vehicle crashes that occurred during nighttime (8 pm ndash 559 am) 742 percent were ROR crashes while among the crashes that occurred during daytime (6 am ndash 759 pm) 665 percent were ROR crashes In contrast the occurrence of OR crashes are more frequent during day time
A χ2 test confirms that the difference between two percentages is statistically significant (p lt00001) This shows that the night time driving is more likely to result into ROR crashes as compared to the day time period Reduced lighting like adverse weather is associated with a significant increase in the likelihood of single-vehicle ROR crashes
Figure 7 Percentage Frequency Distributions of Fatal Single-Vehicle ROR and OR Crashes by Lighting Conditions (FARS 1991-2007)
12
NHTSArsquos National Center for Statistics and Analysis 1200 New Jersey Avenue SE Washington DC 20590
_______________________________________________________________________
ROR OR
680 748
320 252
0
50
100
Pe
rce
nt
One Occupant (Driver Alone) Two or More Occupants (N=183611) (N=125559)
32 Occupant-Related Factors
The occupant-related factors examined in the study include vehicle occupancy driverrsquos gender age alcohol use and driver performance-related factors such as sleep inattention over-correction of the vehicle etc
321 Occupancy
It is of interest to see if the occupancy of a vehicle makes a difference in the occurrence of ROR crashes Figure 8 shows the percentage frequency distributions of passenger vehicles involved in fatal single-vehicle ROR and OR crashes by vehicle occupancy
Among fatal single-vehicle crashes involving a vehicle with only one occupant (driver alone) 680 percent were ROR crashes while among crashes involving a vehicle with two or more occupants 748 percent were ROR crashes A χ2 test confirms the difference between these two percentages to be statistically significant (p lt00001)
This shows that vehicles with high occupancy (two or more occupants) are more likely to be involved in ROR crashes as compared to a vehicle with the driver alone The reason for this is not immediately clear However a possible explanation could be the fact that the presence of other occupants in the vehicle is a likely source of distraction to the driver due to conversation and other activities 12
Figure 8 Percentage Frequency Distributions of Fatal Single-Vehicle ROR and OR Crashes by Vehicle Occupancy (FARS 1991-2007)
13
NHTSArsquos National Center for Statistics and Analysis 1200 New Jersey Avenue SE Washington DC 20590
_______________________________________________________________________
722 665
278 335
ROR OR
100
50
0
Male Driver (N=230416) Female Driver (N=78754)
Pe
rce
nt
322 Driverrsquos Gender
Among many driver-related factors driver gender that could possibly contribute to the occurrence of ROR crashes was studied Figure 9 shows the percentage frequency distributions of passenger vehicles involved in fatal single-vehicle ROR and OR crashes by driverrsquos gender
Among fatal single-vehicle crashes involving male drivers 722 percent were ROR crashes while 665 percent crashes involving female drivers were ROR crashes In contrast the occurrence of OR crashes are more frequent for female drivers A χ2 test shows that the difference between the two percentages is statistically significant (p lt00001)
Thus one could infer that vehicles with the male drivers are more likely to be involved in ROR crashes as compared to the vehicles with the female drivers
Figure 9 Percentage Frequency Distributions of Fatal Single-Vehicle ROR and OR Crashes by Driverrsquos Gender (FARS 1991-2007)
14
NHTSArsquos National Center for Statistics and Analysis 1200 New Jersey Avenue SE Washington DC 20590
_______________________________________________________________________
323 Driverrsquos Age
To look into driver age as a contributing factor in ROR crashes four age groups were considered 15 to 24 25 to 44 45 to 64 and 65 and older Figure 10 shows the percentage frequency distributions of passenger vehicles involved in fatal single-vehicle ROR and OR crashes by these age groups
Among fatal single-vehicle crashes involving young drivers 15 to 24 a higher percentage (752 percent) were of ROR crashes as compared to other age groups This shows that vehicles with young drivers 15 to 24 are more likely to be involved in ROR crashes as compared to other three age groups
727 664 752 686
273 336 248 314
0
50
100
15-24 (N=102962)
25-44 (N=121728)
45-64 (N=55303)
65+ (N=27195)
Pe
rce
nt
ROR OR
Figure 10 Percentage Frequency Distributions of Fatal Single-Vehicle ROR and OR Crashes by Driverrsquos Age (FARS 1991-2007)
15
NHTSArsquos National Center for Statistics and Analysis 1200 New Jersey Avenue SE Washington DC 20590
_______________________________________________________________________
583 865
417 135
0
50
100
BAC=0 (N=172537) BAC=001+ (N=136633)
Pe
rce
nt
ROR OR
Figure 11 Percentage Frequency Distributions of Fatal Single-Vehicle ROR and OR Crashes by Driverrsquos Alcohol Use (FARS 1991-2007)
324 Alcohol-Related Driving
Alcohol involvement of a driver often leads to safety issues such as loss of vehicle control that may result into a ROR crash Two categories of drivers sober (BAC=0) and alcohol involved (BAC=01+) were considered in the analysis to see if alcohol use contributes to ROR crashes Figure 11 shows the percentage frequency distributions of passenger vehicles involved in fatal single-vehicle ROR and OR crashes by driverrsquos alcohol use
Among fatal single-vehicle crashes involving drivers with alcohol use (BAC=01+) 865 percent were ROR crashes while among those drivers with no alcohol (BAC=0) 583 percent were ROR crashes The difference between these two percentages is statistically significant (p lt00001) This indicates that the drivers with alcohol use are more likely to be involved in ROR crashes as compared to sober drivers
16
NHTSArsquos National Center for Statistics and Analysis 1200 New Jersey Avenue SE Washington DC 20590
_______________________________________________________________________
325 Driver-Performance-Related Factors
Some of the driver performance-related factors that are likely to contribute to the occurrence of ROR crashes were also examined
These include (1) sleepy (drowsy asleep fatigued and sleepy) (2) inattentive (talking eating etc) (3) over-correcting of the vehicle (4) avoiding (avoiding swerving or sliding due to severe crosswind tire blow-out or flat live animals in road vehicle in road etc) (5) distractions inside vehicles (cellular telephone computer fax machine etc) and (6) other driver-performance-related factors such as mentally challenged following improperly failure to signal intensions etc
Figure 12 shows the percentage frequency distributions of passenger vehicles involved in fatal single-vehicle ROR and OR crashes based on the driver performance-related factors The statistics show that the percentages of sleepy (912) inattentive (754) over correction of the vehicle (856) and crash avoiding (798) drivers involved in fatal single-vehicle ROR crashes are significantly greater (p lt00001) than the drivers with lsquoOther driver performance-related factorsrsquo that account for 67 percent of ROR crashes
This means that drivers with these performance-related factors (sleepy inattentive over correction avoiding etc) are more likely to be involved in ROR crashes as compared to drivers with other performance-related factors These results are consistent with those obtained from other studies using different approaches and other crash databases 2-11
17
NHTSArsquos National Center for Statistics and Analysis 1200 New Jersey Avenue SE Washington DC 20590
_______________________________________________________________________
672 671 798 856 754 912
328 329 202 144 246 88
0
20
40
60
80
100
Sleepy (N=14774)
Inattention (N=28081)
Overcorrect (N=19289)
Avoiding (N=14145)
Possible Distraction (N=1429)
Others (N=227587)
Per
cen
t
ROR OR
Figure 12 Percentage Frequency Distributions of Fatal Single-Vehicle ROR and OR Crashes by Driver Performance-Related Factors (FARS 1991-2007)
18
NHTSArsquos National Center for Statistics and Analysis 1200 New Jersey Avenue SE Washington DC 20590
_______________________________________________________________________
33 Vehicle-Related Factors
It is generally believed that ROR crashes are likely to occur due to some vehicle-related factors such as vehicle speeding or vehicle type
331 Vehicle Speeding Status
A crash is considered speeding-related if any driver involved in the crash is charged with a speeding-related offense or if a police officer indicates that racing driving too fast for the conditions or exceeding the posted speed limit was a related factor in the crash 13
Figure 13 shows the percentage frequency distributions of passenger vehicles involved in fatal single-vehicle ROR and OR crashes by vehicle speeding status
Among fatal single-vehicle crashes that involved a speeding vehicle 90 percent were ROR crashes while among crashes that did not involve a speeding vehicle 595 percent were ROR crashes A χ2 test shows that the difference between two percentages is statistically significant (p lt00001) thereby showing that speeding vehicles are more likely to be involved in ROR crashes as compared to non-speeding vehicles
900 595
100 405
0
50
100
Speeding (N=113825) Non-Speeding (N=195345)
Pe
rce
nt
ROR OR
Figure 13 Percentage Frequency Distributions of Fatal Single-Vehicle ROR and OR Crashes by Vehicle Speeding Status (FARS 1991-2007)
19
NHTSArsquos National Center for Statistics and Analysis 1200 New Jersey Avenue SE Washington DC 20590
_______________________________________________________________________
500 520 600 670 730 710
500 480 400 330 270 290
00
200
400
600
800
1000
Passenger Car
(N=178430)
LT Pickup
(N=72065)
LT Utility
(N=38970)
LT MiniVan
(N=11159)
LT Other Van (N=7904)
LT Others (N=642)
Pe
rce
nt
ROR OR
Figure 14 shows the percentage frequency distributions of passenger vehicles involved in fatal single-vehicle ROR and OR crashes by passenger vehicle type passenger car light truck (LT) including pickup utility minivan other van and other light trucks) It shows that passenger cars are more likely to be involved in ROR crashes as compared to other passenger vehicle types Minivans (60) are more likely to be involved in ROR crashes (p lt00001) as compared to other vans (52)
332 Vehicle Type
Figure 14 Percentage Frequency Distributions of Fatal Single-Vehicle ROR and OR Crashes by Vehicle Type (FARS 1991-2007)
20
NHTSArsquos National Center for Statistics and Analysis 1200 New Jersey Avenue SE Washington DC 20590
_______________________________________________________________________
4 Logistic Regression
The analysis in the previous sections shows that factors such as driver sleepiness alcohol use vehicle speeding curved roadway rural roads etc are significant contributors to the occurrence of fatal single-vehicle ROR crashes It remains to assess their relative influence as well as estimate the amount of risk each carries in the occurrence of such crashes Logistic regression was used for this purpose This is a modeling procedure that predicts the probability (p) of occurrence of an event (fatal single-vehicle ROR crash in the present case) as a consequence of certain roadway- driver- environment- and vehicle-related factors such as sleepy alcohol use weather condition lighting condition speeding status road function etc Generally the logistic regression model provides log of odds as a function of the predictors
Log (odds) = a0 + a1timesdriver performance-related factor + a2timesalcohol use + a3timesspeeding status + a4timesweather condition + a5timeslighting conditionhellip + aktimesspeeding statustimesweather condition + ak+1timesspeeding statustimesdriverrsquos age +helliphellip
where a0 is the intercept and a1 a2 a3 helliphellip ak ak+1 helliphellip are the regression coefficients
As in the previous analysis FARS data was used in the modeling procedure Since in FARS driverrsquos alcohol involvement is estimated by Multiple Imputation (MI) 16 17
procedure the SAS MIANALYZE procedure was used in this study to perform the analysis of the MI data generated from the logistic regression18
21
NHTSArsquos National Center for Statistics and Analysis 1200 New Jersey Avenue SE Washington DC 20590
_______________________________________________________________________
41 Logistic Regression Results and Interpretation
Of all the variables considered in the logistic regression only 10 showed up as significant predictors (95 confidence level) As regards the interaction effect of these factors only the interaction of speeding with other variables was considered However only three of these interactions emerged as significant (95 confidence level) The results in Table 1 present estimates of regression coefficients and the corresponding odds ratio only for significant main effects and interactions Since the independent variables (predictors) are dichotomous the influence of the corresponding factors can be compared simply by comparing their regression coefficients
The ordered (decreasing) estimates of regression coefficients in Table 1 show that the most influential factor in the occurrence of fatal single-vehicle ROR crashes is the driver performance-related factor sleepy followed by alcohol use roadway alignment with curve speeding passenger car rural roadway number of lanes high-speed-limit road adverse weather and avoiding With regard to the interaction effect of speeding with other factors speeding with drivers of age groups 15 to 24 and 25 to 44 as well as speeding under adverse weather are significant contributors to the likelihood of ROR crashes
Table 1 Multiple Imputation Parameter Estimates Dagger
Variables Estimate Odds Ratio Driver performance-related factor sleepy vs others 11675 Dagger 321 Driver with alcohol BAC=01+ gdL vs BAC=0 06605 Dagger 194 Road alignment curve vs straight 05535 Dagger 174 Vehicle speeding status speeding vs non-speeding 04966 Dagger 164 Vehicle type passenger car vs other LTs 04780 Dagger 161 Road function rural vs urban 03637 Dagger 144 Roadway of lanes one or two (undivided) vs three amp more (undivided) 03346 Dagger 141 Road speed limit ge 60 mph vs lt60 mph 02659 Dagger 130 Weather adverse vs good 02130 Dagger 124 Driver performance-related factor avoiding vs others 02007 Dagger 122 Weather timesSpeeding status adverse amp speeding vs good amp non-speeding 01056 Dagger 111 Driver Age times Speeding status 25-44 amp speeding vs 65+ amp non-speeding 01003 Dagger 111 Driver Age times Speeding status 15-24 amp speeding vs 65+ amp non-speeding 00578 Dagger 106
Statistically significant variables (α = 005) associated with the high risk (odds ratio gt100) Other variables with low risk (odds ratio lt100) or insignificance (pgt005) after jointly estimating the effect are not shown here Dagger p-value lt00001
One of the most important by-product of logistic regression is the estimate of odds ratio that tells a great deal about the risk a certain factor carries in contributing to the occurrence of ROR crashes Specifically odds ratio measures the magnitude of increase in odds of happening of an event as a result of a unit increase in a predictor (eg sober and alcohol-used driver) An odds ratio value of 1 is indicative of no influence Table 1 also shows odds ratio estimates of significant factors and interactions
22
NHTSArsquos National Center for Statistics and Analysis 1200 New Jersey Avenue SE Washington DC 20590
_______________________________________________________________________
1
250 226
o 200
ita 164
Rd
s 150
d 124
O 100 100
050
Non-Speeding+Good Weather Non-Speeding+Adverse Weather
Speeding+Good Weather Speeding+Adverse Weather
Figure 15 Odds Ratio by Speeding Status and Weather Conditions
The odds ratio 321 for the factor ldquodriver performance-related factorrdquo shows that the odds of being involved in an ROR crash for a sleepy driver are three times as large as that for the driver who is not sleepy
The odds ratio 194 for the factor ldquodriver with alcoholrdquo shows that the odds of being involved in an ROR crash for an alcohol used driver (BAC=01+ gdL) are almost two times as large as that for a sober driver (BAC=0)
The odds ratio 174 for the factor ldquoroad alignmentrdquo shows that the odds of being involved in an ROR crash on curved roadways are 174 times as large as that on straight roadways in fatal single-vehicle crashes
The odds ratio 164 for the factor ldquovehicle speeding statusrdquo shows that the odds of being involved in an ROR crash for speeding vehicles are 164 times as large as that for non-speeding vehicles
The odds ratio 161 for the factor ldquovehicle typerdquo shows that the odds of being involved in an ROR crash for passenger cars are 161 times as large as that for other LTs
The odds ratio 144 for the factor ldquoroad functionrdquo shows that the odds of being involved in an ROR crash on rural roadways are 144 times as large as that on urban roadways
The odds ratio 266 for the factor ldquoweather amp speeding statusrdquo shows that the odds of being involved in an ROR crash under the adverse weather and in speeding vehicle are 266 (=164times124times111) times as large as that under the good weather and in non-speeding vehicle (Figure 15)
23
NHTSArsquos National Center for Statistics and Analysis 1200 New Jersey Avenue SE Washington DC 20590
_______________________________________________________________________
5 Conclusions
Run-off-road crashes account for a significant percentage (around 70) of all fatal single-vehicle crashes FARS data (1991 to 2007) that includes detailed information about ROR crashes provided sufficient statistical evidence to conclude that certain roadway- driver- environment- and vehicle-related factors closely associated with the occurrence of these crashes Appropriate crash countermeasures based on the identified factors can reduce the occurrence of single-vehicle ROR crashes and hence of the fatalities
Curved road segments rural roads high-speed-limit roadways and roadways with fewer lanes (divided or undivided) are found to be more likely to be the scene of fatal single-vehicle ROR crashes as compared to the fatal single-vehicle OR crashes Similarly among environmental factors adverse weather and night time periods are the factors associated with high risk of fatal single-vehicle ROR crashes
Vehicles with high occupancy (two and more occupants) male driver younger driver and alcohol used by driver are more likely to be involved in fatal single-vehicle ROR crashes as compared to the fatal single-vehicle OR crashes Drivers with performance-related factors (sleepy inattentive over-correction avoiding etc) are more likely to be involved in the fatal single-vehicle ROR crashes Speeding vehicles and passenger cars are also associated with high risks of the fatal single-vehicle ROR crashes
In the adverse weather condition and for the younger drivers (15 to 24 and 25 to 44) the speeding vehicle would increase the risk of fatal single-vehicle ROR crashes by an additional factor
The above facts based on statistical evidence suggest several crash countermeasures For example improving roadway design such as flattening curves and installing shoulder rumble strips or rehabilitation strategies such as building wide lanes or adding additional unpaved shoulder width on entire system providing skid-resistant pavement surfaces could reduce the likelihood of ROR crashes
24
NHTSArsquos National Center for Statistics and Analysis 1200 New Jersey Avenue SE Washington DC 20590
_______________________________________________________________________
6 References
1 FHWA (Undated) Reducing Highway Fatalities Washington DC Federal Highway Administration httpsafetyfhwadotgovroadway5Fdept
2 Neuman T RPfefer R Slack K L Council F McGee H Prothe L amp Eccles K (1998) Guidance for Implementation of the AASHTO Strategic Highway Safety Plan Report 500 Volume 6 A Guide for Addressing Run-Off Road Collisions Washington DC Transportation Research Board Available at httponlinepubstrborgonlinepubsnchrpnchrp_rpt_500v6pdf
3 Spainhour L K amp Mishra A (2007) Analysis of Fatal Run-off-the-Road Crashes Involving Overcorrection TRB 87th Annual Meeting Paper No 08-0661 Washington DC Transportation Research Board
4 McGee H W amp Hanscom F R Low-Cost Treatments for Horizontal Curve Safety FHWA-SA-07-002 December 2006
5 Johnston I Corben B TriggsT Candappa N amp Lenneacute M Reducing Serious Injury and Death from Run-off-Road Crashes in Victoria ndash Turning Knowledge into Action (2006 June) RACV Research Report Victoria Australia Royal Automobile Club of Victoria Ltd
6 Dissanayake S (2003 August) Young Drivers and Run-Off-the-Road Crashes Proceedings of the 2003 Mid-Continent Transportation Research Symposium Ames Iowa
7 Knapp K K Giese K L amp Lee W (2003 August) Urban Four-Lane Undivided to Three-Lane Roadway Conversion Guidelines Proceedings of the 2003 Mid-Continent Transportation Research Symposium Ames Iowa
8 Őrnek E amp Drakopoulos A (2007 August) Analysis of Run-Off-Road Crashes in Relation to Roadway Features and Driver Behavior Proceedings of the 2007 Mid-Continent Transportation Research Symposium Ames Iowa
9 Ray M H amp McGinnis R G (1997) Guardrail and Median Barrier Crashworthiness A Synthesis of Highway Practice NCHRP Synthesis 244 Washington DC Transportation Research Board National Research Council
10 Roadside Design Guide (2006) 3rd Edition Washington DC American Association of State Highway and Transportation Officials
25
NHTSArsquos National Center for Statistics and Analysis 1200 New Jersey Avenue SE Washington DC 20590
_______________________________________________________________________
11 Elvik R (1995) The Safety Value of Guardrails and Crash Cushions A Meta-Analysis of Evidence from Evaluation Studies Accident Analysis and Prevention 27 (4)
12 Stutts J C Reinfurth D W Staplin L amp Rodgman EA (2001 May) The Role of Driver Distraction in Traffic Crashes Washington DC AAA Foundation for Traffic Safety
13 Liu C Chen C-L Subramanian R amp Utter D (2005 June) Analysis of Speeding-Related Fatal Motor Vehicle Traffic Crashes NHTSA Technical Report DOT HS 809 839 Washington DC National Highway Traffic Safety Administration
14 Hosmer Jr D W and Lemeshow S (1989) Applied Logistic Regression New York John Wiley amp Sons Inc
15 SAS Institute Inc (1995) Logistic Regression Examples using SAS system Cary NC SAS Institute Inc
16 Rubin D B Schafer J L amp Subramanian R (1998 October) Multiple Imputation of Missing Blood Alcohol Concentration (BAC) Values in FARS NHTSA Technical Report DOT HS 808 816 Washington DC National Highway Traffic Safety Administration
17 Subramanian R (2005 March) Alcohol Involvement in Fatal Motor Vehicle Traffic Crashes NHTSA Technical Report DOT HS 809 822 Washington DC National Highway Traffic Safety Administration
18 SASSTAT Userrsquos Guide Version 8 1999 Cary NC SAS Institute Inc
26
NHTSArsquos National Center for Statistics and Analysis 1200 New Jersey Avenue SE Washington DC 20590
DOT HS 811 232November 2009
_______________________________________________________________________
Vehicles driven by young drivers (age 15 to 24) are more likely to be involved in ROR crashes as compared to other age groups of drivers
Vehicles with male drivers are more likely to be involved in ROR crashes as compared to the vehicles with female drivers
Drivers with performance-related factors such as sleepiness inattentiveness over-correction of the vehicle or crash-avoiding are more likely to be involved in ROR crashes as compared to other driver-performance-related factors The percentages of sleepy (912) inattentive (754) over-correction of the vehicle (856) and crash-avoiding (798) drivers involved in fatal single-vehicle ROR crashes are significantly greater (p lt00001) than the drivers with other performance-related factors that account for 67 percent of ROR crashes
Among all passenger vehicles (passenger cars vans pickup trucks and utility vehicles) passenger cars are more likely to be involved in fatal single-vehicle ROR crashes as compared to other passenger vehicle types
Logistic regression modeling was used to assess their relative influence as well as estimate the amount of risk each factor carries in the occurrence of such crashes It shows that the most influential factor in the occurrence of fatal single-vehicle ROR crashes is the driver performance-related factor sleepy followed by alcohol use roadway alignment with curve vehicle speeding passenger car rural roadway high-speed-limit road adverse weather and crash-avoiding In the adverse weather condition and for the younger drivers (15 to 24 and age 25 to 44) the vehicle speeding would increase the risk of fatal single-vehicle ROR crashes by an additional factor
3
NHTSArsquos National Center for Statistics and Analysis 1200 New Jersey Avenue SE Washington DC 20590
_______________________________________________________________________
NHTSArsquos National Center for Statistics and Analysis 1200 New Jersey Avenue SE Washington DC 20590
4
Total Fatal Single-Vehicle Crashes (Bar Graph) and Percent ROR Crashes (Line Graph) 1991-2007 75
73
71
69
67
65
91 2 3 4 5 6 79 9 9 9 9 99 9 9 9 9 9 98 9 0 1 2 3 04 5 619 19
9 0 0 0 0 0 07
9 0 0 0 0 0 01 1 1 1 1 1 1 2 2 2 2 20 200
2 2Year
19000
18500
s ehsa
Cr 18000
R
t R
Oencre 17500
P
17000
16500
s
ehsar
Cle
ic
heV-el
gin
l S
atal
Fat
oT
Figure 1 Total Passenger Vehicle Fatal Single-Vehicle Crashes (Bar Graph) and the Percent of ROR Crashes (Line Graph) 1991-2007 (FARS 1991-2007)
1 Introduction A vehicle in transport sometimes leaves the travel lane and encroaches onto the shoulder median roadside parking lane gore or a separator and hits one or more natural or artificial objects This event usually involves a single vehicle and is referred to as a runshyoff-road crash ROR crashes contribute to a large proportion of fatalities and serious injuries to the vehicle occupants in fatal single-vehicle crashes -- around 70 percent of the fatal single-vehicle crashes are ROR crashes In contrast there are crashes in which a vehicle remains on the road after the crash and are referred as on-road crashes The single-vehicle OR crashes may involve a pedestrian bicyclist train an animal or it may be an on-road rollover a vehicle hitting a median divider or falling trees on the roadway etc The OR crashes contribute to around 30 percent of the fatal single-vehicle crashes The total number of passenger vehicle fatal single-vehicle crashes (bar graph right label) and the percentage that were ROR crashes (line graph left label) from 1991 to 2007 are shown in Figure 1 The total numbers of fatal single-vehicle crashes fluctuate over the years 1991 to 2007 However the percent of ROR crashes shows an upward trend during the same time period (with 68 percent in 1991 and 73 percent in 2007) Keeping vehicles on the roadway is one of the major goals of Strategic Highway Safety Plan1 2
_______________________________________________________________________
The reasons for an ROR crash are varied and include avoiding a vehicle object or an animal in the travel lane over-correction during the operation of the vehicle inattentive driving due to distraction fatigue sleep or alcohol the effects of weather on pavement conditions and traveling too fast through a curve There are also a number of roadway design factors (eg travel lanes that are too narrow substandard curves) that can increase the probability that a driver error may result into an ROR crash 2-6
This study aims to identify the roadway factors (eg ruralurban nature and curve existence) driver factors (eg age gender sleepy and alcohol use) environmental factors (eg weather lighting condition) and vehicle-related factors (eg speeding) associated with the fatal single-vehicle ROR crashes The analyses on the relationship between selected factors (variables) and the likelihood of fatal single-vehicle ROR and OR crashes are presented
The study is focused only on fatal crashes that is a crash that involve a motor vehicle in transport traveling on a traffic way customarily open to the public and resulting in the death of a person (occupant of a vehicle or a non-motorist) within 30 days of the crash Therefore the results presented in this study can not be generalized to the entire crash population Also because the comparisons are made between single-vehicle ROR and OR crashes it is possible that the factors that differ between these two types of crashes are not necessarily associated solely with these two types of crashes
The outline of this report is as follows Section 2 presents the data and the method used in this report Section 3 presents the descriptive (univariate) statistics through the percentage frequency distributions of fatal single-vehicle ROR versus fatal single-vehicle OR crashes by various roadway- environment- occupant- and vehicle-related factors Section 4 assesses their relative influence as well as estimates the amount of risk each factor carries in the occurrence of such crashes using logistic regression The conclusions are presented in Section 5
5
NHTSArsquos National Center for Statistics and Analysis 1200 New Jersey Avenue SE Washington DC 20590
_______________________________________________________________________
2 Data and Methodology
The data used in this study comes from the Fatality Analysis Reporting System for fatal crashes during the period 1991 to 2007 All analyses in this report pertain to fatal single-vehicle ROR crashes that involve passenger vehicles including cars vans pickup trucks and utility vehicles with gross vehicle weight ratings under 10000 lbs
In this study the fatal single-vehicle crashes were categorized into two groups ROR crashes and OR crashes in which the vehicles were still on the road after the crashdagger The descriptive (univariate) analysis of the relationship between selected factors (variables) was conducted to estimate the likelihood of a vehicle involvement in fatal single-vehicle ROR and OR crashes The chi-square test is used to assess the differences in percentages between groups and is statistically significant at α = 005 significance level when p lt005 The impact of these related factors is also assessed by logistic regression procedure in which the OR crashes essentially form one element of the binary outcome (on-road versus off- road) This procedure helps to assess their relative influence as well as estimate the amount of risk each carries in the occurrence of such crashes
dagger For the designation of ROR and OR crash refer to FARS Analytical Reference Guide 1975-2006 DOT HS 810 605 May 2006
6
NHTSArsquos National Center for Statistics and Analysis 1200 New Jersey Avenue SE Washington DC 20590
_______________________________________________________________________
3 Factors Related to Fatal Single-Vehicle ROR Crashes
In this section a descriptive (univariate) approach is used to identify the roadway- driver- environment- and vehicle-related factors (variables) that may have strong association with the fatal single-vehicle ROR crashes Based on other studies several variables were considered that include the curvature of the road roadway function class (ruralurban) number of lanes posted speed limit weather and lighting conditions age gender and alcohol use by the driver7 8 9 10 11
31 Environment-Related Factors
The environment-related factors examined in the study are roadway alignment roadway function class number of lanes posted speed limit weather and lighting conditions
311 Road Environment
Road Alignment
Roadway alignment plays a significant role in the occurrence of ROR crashes Figure 2 shows the percentage frequency distributions of passenger vehicles involved in fatal single-vehicle ROR and OR crashes by road alignment (curved or straight)
902 621
98 379
0
50
100
Curve (N=95190) Straight (N=212832)
Pe
rce
nt
ROR OR
Figure 2 Percentage Frequency Distributions of Fatal Single-Vehicle ROR and OR Crashes by Road Alignment (FARS 1991-2007)
7
NHTSArsquos National Center for Statistics and Analysis 1200 New Jersey Avenue SE Washington DC 20590
_______________________________________________________________________
The statistics show that among all fatal single-vehicle crashes that occurred on the curved roads 902 percent were ROR crashes while among crashes that occurred on straight roadways 621 percent were ROR crashes In contrast the occurrence of OR crashes are more frequent on straight roadways A χ2 test shows that the difference between two percentages is statistically significant (p lt00001) thereby indicating that the curved road segments are more likely to be the scene of ROR crashes as compared to the straight roadways Improving roadway design (eg flattening curves signing or the more general curve delineation) could reduce the likelihood of ROR crashes
Roadway Function Class
It is also of interest to see if the roadway function class makes a difference in the occurrence of ROR crashes Figure 3 shows the percentage frequency distributions of passenger vehicles involved in fatal single-vehicle ROR and OR crashes by roadway function (rural or urban)
In fatal single-vehicle crashes among those that occurred on rural roads 806 percent were ROR crashes while among those that occurred on urban roadways 562 percent were ROR crashes In contrast the occurrence of OR crashes were more frequent on urban roadways A χ2 test shows that the difference between two percentages of ROR crashes is statistically significant (p lt00001) This shows that the rural roads are more likely to be the scene of ROR crashes as compared to the urban roads
806 562
194 438
0
50
100
Rural (N=183363) Urban (N=124248)
Pe
rce
nt
ROR OR
Figure 3 Percentage Frequency Distributions of Fatal Single-Vehicle ROR and OR Crashes by Roadway Function (FARS 1991-2007)
8
NHTSArsquos National Center for Statistics and Analysis 1200 New Jersey Avenue SE Washington DC 20590
_______________________________________________________________________
Road Posted Speed Limit
In most cases the actual vehiclersquos pre-crash travel speed is unknown In this analysis the posted speed limit was used as a proxy to a vehiclersquos travel speed Figure 4 shows the percentage frequency distributions of passenger vehicles involved in fatal single-vehicle ROR and OR crashes by posted speed limits (lt 60 mph and 60+ mph)
Among fatal single-vehicle crashes that occurred on roadways with posted speed limits of 60 mph and above 81 percent were ROR crashes while among the crashes that occurred on roadways with posted speed limits less than 60 mph 69 percent were ROR crashes A χ2 test shows that the difference between these two percentages is statistically significant (p lt00001) This in turn shows that the high speed limit roads are more likely to be the scene of ROR crashes as compared to the low speed limit roads
810 690
190 310
0
50
100
60+ mph (N=49687) lt 60 mph (N=251554)
Pe
rce
nt
ROR OR
Figure 4 Percentage Frequency Distributions of Fatal Single-Vehicle ROR and OR Crashes by Road Posted Speed Limits (FARS 1991-2007)
9
NHTSArsquos National Center for Statistics and Analysis 1200 New Jersey Avenue SE Washington DC 20590
_______________________________________________________________________
Roadway Number of Lanes
Another factor that is worth investigating is the roadway number of lanes Figure 5 shows the percentage frequency distributions of passenger vehicles involved in fatal single-vehicle ROR and OR crashes by roadway number of lanes Four categories of roadways were considered with reference to the number of lanes one or two lanes (divided or undivided) and three or more lanes (divided or undivided) The number of lanes refers to the number of lanes of a continuous cross-section of roadway For example a local roadway with one lane going north and one lane going south would be coded as two lanes However if a trafficway is a divided highway with two lanes going north a median and two lanes going south then the number of lanes is coded as two If a trafficway has two lanes going north immediately adjacent to two lanes going south one continuous cross-section of roadway then the number of lanes is coded as four
The results in Figure 5 show that among the fatal single-vehicle crashes that occurred on roadways with fewer lanes (one or two lanes) 678 percent (divided) and 766 percent (undivided) were ROR crashes while among the crashes that occurred on roads with three and more lanes 62 percent (divided) and 40 percent (undivided) were ROR crashes In contrast the occurrence of OR crashes were more frequent on roadways with three and more lanes as compared to one or more lanes both in the case of divided and undivided roadways
Statistically significant (p lt00001) difference shows that the roadways with fewer lanes (one or two lanes) are more likely to be the scene of ROR crashes as compared to the roadway with three and more lanes (divided or undivided) The roadway design or rehabilitation strategy such as building more lanes is likely to reduce ROR crashes 8
400 620 678 766
600 380 326 234
0
50
100
One or Tw o Lanes Divided
(N=53563)
One or Tw o Lanes Undivided (N=191462)
Three and More Lanes Divided
(N=35615)
Three and More Lanes Undivided
(N=18395)
Pe
rce
nt
ROR OR
Figure 5 Percentage Frequency Distributions of Fatal Single-Vehicle ROR and OR Crashes by Roadway Number of Lanes (FARS 1991-2007)
10
NHTSArsquos National Center for Statistics and Analysis 1200 New Jersey Avenue SE Washington DC 20590
_______________________________________________________________________
312 Weather Conditions
To investigate if certain weather conditions contribute to the occurrence of ROR crashes the percentage frequency distributions of passenger vehicles involved in fatal single-vehicle ROR and OR crashes by weather conditions were obtained Two weather conditions were considered for this purpose adverse (rain sleet snow fog fog and others - smog smoke blowing sand or dust) and good weather conditions (normal or clear) The results are presented in Figure 6
Among fatal single-vehicle crashes that occurred during adverse weather conditions 755 percent were ROR crashes while among crashes that occurred during good weather conditions 70 percent were ROR crashes On the other hand OR crashes were more frequent in good weather conditions
The significant difference between the two percentages (p lt00001) shows that ROR crashes are more likely to occur in adverse weather conditions as compared to good weather conditions Improving roadway design (eg providing skid-resistant pavement surfaces) could reduce the likelihood of ROR crashes
755 700
245 300
0
50
100
Adverse Weather (N=34152) Good Weather (N=273242)
Pe
rce
nt
ROR OR
Figure 6 Percentage Frequency Distributions of Fatal Single-Vehicle ROR and OR Crashes by Weather Conditions (FARS 1991-2007)
11
NHTSArsquos National Center for Statistics and Analysis 1200 New Jersey Avenue SE Washington DC 20590
_______________________________________________________________________
ROR OR
100
50
0
Night Time (N=155199) Day Time (N=149945)
742 665
258 335
Pe
rce
nt
313 Natural Lighting Conditions
Could visibility due to natural lighting be an issue in the occurrence of ROR crashes To answer this question frequency analysis was conducted for two lighting conditions nighttime and daytime Figure 7 shows the percentage frequency distributions of passenger vehicles involved in fatal single-vehicle ROR and OR crashes by lighting conditions
Among fatal single-vehicle crashes that occurred during nighttime (8 pm ndash 559 am) 742 percent were ROR crashes while among the crashes that occurred during daytime (6 am ndash 759 pm) 665 percent were ROR crashes In contrast the occurrence of OR crashes are more frequent during day time
A χ2 test confirms that the difference between two percentages is statistically significant (p lt00001) This shows that the night time driving is more likely to result into ROR crashes as compared to the day time period Reduced lighting like adverse weather is associated with a significant increase in the likelihood of single-vehicle ROR crashes
Figure 7 Percentage Frequency Distributions of Fatal Single-Vehicle ROR and OR Crashes by Lighting Conditions (FARS 1991-2007)
12
NHTSArsquos National Center for Statistics and Analysis 1200 New Jersey Avenue SE Washington DC 20590
_______________________________________________________________________
ROR OR
680 748
320 252
0
50
100
Pe
rce
nt
One Occupant (Driver Alone) Two or More Occupants (N=183611) (N=125559)
32 Occupant-Related Factors
The occupant-related factors examined in the study include vehicle occupancy driverrsquos gender age alcohol use and driver performance-related factors such as sleep inattention over-correction of the vehicle etc
321 Occupancy
It is of interest to see if the occupancy of a vehicle makes a difference in the occurrence of ROR crashes Figure 8 shows the percentage frequency distributions of passenger vehicles involved in fatal single-vehicle ROR and OR crashes by vehicle occupancy
Among fatal single-vehicle crashes involving a vehicle with only one occupant (driver alone) 680 percent were ROR crashes while among crashes involving a vehicle with two or more occupants 748 percent were ROR crashes A χ2 test confirms the difference between these two percentages to be statistically significant (p lt00001)
This shows that vehicles with high occupancy (two or more occupants) are more likely to be involved in ROR crashes as compared to a vehicle with the driver alone The reason for this is not immediately clear However a possible explanation could be the fact that the presence of other occupants in the vehicle is a likely source of distraction to the driver due to conversation and other activities 12
Figure 8 Percentage Frequency Distributions of Fatal Single-Vehicle ROR and OR Crashes by Vehicle Occupancy (FARS 1991-2007)
13
NHTSArsquos National Center for Statistics and Analysis 1200 New Jersey Avenue SE Washington DC 20590
_______________________________________________________________________
722 665
278 335
ROR OR
100
50
0
Male Driver (N=230416) Female Driver (N=78754)
Pe
rce
nt
322 Driverrsquos Gender
Among many driver-related factors driver gender that could possibly contribute to the occurrence of ROR crashes was studied Figure 9 shows the percentage frequency distributions of passenger vehicles involved in fatal single-vehicle ROR and OR crashes by driverrsquos gender
Among fatal single-vehicle crashes involving male drivers 722 percent were ROR crashes while 665 percent crashes involving female drivers were ROR crashes In contrast the occurrence of OR crashes are more frequent for female drivers A χ2 test shows that the difference between the two percentages is statistically significant (p lt00001)
Thus one could infer that vehicles with the male drivers are more likely to be involved in ROR crashes as compared to the vehicles with the female drivers
Figure 9 Percentage Frequency Distributions of Fatal Single-Vehicle ROR and OR Crashes by Driverrsquos Gender (FARS 1991-2007)
14
NHTSArsquos National Center for Statistics and Analysis 1200 New Jersey Avenue SE Washington DC 20590
_______________________________________________________________________
323 Driverrsquos Age
To look into driver age as a contributing factor in ROR crashes four age groups were considered 15 to 24 25 to 44 45 to 64 and 65 and older Figure 10 shows the percentage frequency distributions of passenger vehicles involved in fatal single-vehicle ROR and OR crashes by these age groups
Among fatal single-vehicle crashes involving young drivers 15 to 24 a higher percentage (752 percent) were of ROR crashes as compared to other age groups This shows that vehicles with young drivers 15 to 24 are more likely to be involved in ROR crashes as compared to other three age groups
727 664 752 686
273 336 248 314
0
50
100
15-24 (N=102962)
25-44 (N=121728)
45-64 (N=55303)
65+ (N=27195)
Pe
rce
nt
ROR OR
Figure 10 Percentage Frequency Distributions of Fatal Single-Vehicle ROR and OR Crashes by Driverrsquos Age (FARS 1991-2007)
15
NHTSArsquos National Center for Statistics and Analysis 1200 New Jersey Avenue SE Washington DC 20590
_______________________________________________________________________
583 865
417 135
0
50
100
BAC=0 (N=172537) BAC=001+ (N=136633)
Pe
rce
nt
ROR OR
Figure 11 Percentage Frequency Distributions of Fatal Single-Vehicle ROR and OR Crashes by Driverrsquos Alcohol Use (FARS 1991-2007)
324 Alcohol-Related Driving
Alcohol involvement of a driver often leads to safety issues such as loss of vehicle control that may result into a ROR crash Two categories of drivers sober (BAC=0) and alcohol involved (BAC=01+) were considered in the analysis to see if alcohol use contributes to ROR crashes Figure 11 shows the percentage frequency distributions of passenger vehicles involved in fatal single-vehicle ROR and OR crashes by driverrsquos alcohol use
Among fatal single-vehicle crashes involving drivers with alcohol use (BAC=01+) 865 percent were ROR crashes while among those drivers with no alcohol (BAC=0) 583 percent were ROR crashes The difference between these two percentages is statistically significant (p lt00001) This indicates that the drivers with alcohol use are more likely to be involved in ROR crashes as compared to sober drivers
16
NHTSArsquos National Center for Statistics and Analysis 1200 New Jersey Avenue SE Washington DC 20590
_______________________________________________________________________
325 Driver-Performance-Related Factors
Some of the driver performance-related factors that are likely to contribute to the occurrence of ROR crashes were also examined
These include (1) sleepy (drowsy asleep fatigued and sleepy) (2) inattentive (talking eating etc) (3) over-correcting of the vehicle (4) avoiding (avoiding swerving or sliding due to severe crosswind tire blow-out or flat live animals in road vehicle in road etc) (5) distractions inside vehicles (cellular telephone computer fax machine etc) and (6) other driver-performance-related factors such as mentally challenged following improperly failure to signal intensions etc
Figure 12 shows the percentage frequency distributions of passenger vehicles involved in fatal single-vehicle ROR and OR crashes based on the driver performance-related factors The statistics show that the percentages of sleepy (912) inattentive (754) over correction of the vehicle (856) and crash avoiding (798) drivers involved in fatal single-vehicle ROR crashes are significantly greater (p lt00001) than the drivers with lsquoOther driver performance-related factorsrsquo that account for 67 percent of ROR crashes
This means that drivers with these performance-related factors (sleepy inattentive over correction avoiding etc) are more likely to be involved in ROR crashes as compared to drivers with other performance-related factors These results are consistent with those obtained from other studies using different approaches and other crash databases 2-11
17
NHTSArsquos National Center for Statistics and Analysis 1200 New Jersey Avenue SE Washington DC 20590
_______________________________________________________________________
672 671 798 856 754 912
328 329 202 144 246 88
0
20
40
60
80
100
Sleepy (N=14774)
Inattention (N=28081)
Overcorrect (N=19289)
Avoiding (N=14145)
Possible Distraction (N=1429)
Others (N=227587)
Per
cen
t
ROR OR
Figure 12 Percentage Frequency Distributions of Fatal Single-Vehicle ROR and OR Crashes by Driver Performance-Related Factors (FARS 1991-2007)
18
NHTSArsquos National Center for Statistics and Analysis 1200 New Jersey Avenue SE Washington DC 20590
_______________________________________________________________________
33 Vehicle-Related Factors
It is generally believed that ROR crashes are likely to occur due to some vehicle-related factors such as vehicle speeding or vehicle type
331 Vehicle Speeding Status
A crash is considered speeding-related if any driver involved in the crash is charged with a speeding-related offense or if a police officer indicates that racing driving too fast for the conditions or exceeding the posted speed limit was a related factor in the crash 13
Figure 13 shows the percentage frequency distributions of passenger vehicles involved in fatal single-vehicle ROR and OR crashes by vehicle speeding status
Among fatal single-vehicle crashes that involved a speeding vehicle 90 percent were ROR crashes while among crashes that did not involve a speeding vehicle 595 percent were ROR crashes A χ2 test shows that the difference between two percentages is statistically significant (p lt00001) thereby showing that speeding vehicles are more likely to be involved in ROR crashes as compared to non-speeding vehicles
900 595
100 405
0
50
100
Speeding (N=113825) Non-Speeding (N=195345)
Pe
rce
nt
ROR OR
Figure 13 Percentage Frequency Distributions of Fatal Single-Vehicle ROR and OR Crashes by Vehicle Speeding Status (FARS 1991-2007)
19
NHTSArsquos National Center for Statistics and Analysis 1200 New Jersey Avenue SE Washington DC 20590
_______________________________________________________________________
500 520 600 670 730 710
500 480 400 330 270 290
00
200
400
600
800
1000
Passenger Car
(N=178430)
LT Pickup
(N=72065)
LT Utility
(N=38970)
LT MiniVan
(N=11159)
LT Other Van (N=7904)
LT Others (N=642)
Pe
rce
nt
ROR OR
Figure 14 shows the percentage frequency distributions of passenger vehicles involved in fatal single-vehicle ROR and OR crashes by passenger vehicle type passenger car light truck (LT) including pickup utility minivan other van and other light trucks) It shows that passenger cars are more likely to be involved in ROR crashes as compared to other passenger vehicle types Minivans (60) are more likely to be involved in ROR crashes (p lt00001) as compared to other vans (52)
332 Vehicle Type
Figure 14 Percentage Frequency Distributions of Fatal Single-Vehicle ROR and OR Crashes by Vehicle Type (FARS 1991-2007)
20
NHTSArsquos National Center for Statistics and Analysis 1200 New Jersey Avenue SE Washington DC 20590
_______________________________________________________________________
4 Logistic Regression
The analysis in the previous sections shows that factors such as driver sleepiness alcohol use vehicle speeding curved roadway rural roads etc are significant contributors to the occurrence of fatal single-vehicle ROR crashes It remains to assess their relative influence as well as estimate the amount of risk each carries in the occurrence of such crashes Logistic regression was used for this purpose This is a modeling procedure that predicts the probability (p) of occurrence of an event (fatal single-vehicle ROR crash in the present case) as a consequence of certain roadway- driver- environment- and vehicle-related factors such as sleepy alcohol use weather condition lighting condition speeding status road function etc Generally the logistic regression model provides log of odds as a function of the predictors
Log (odds) = a0 + a1timesdriver performance-related factor + a2timesalcohol use + a3timesspeeding status + a4timesweather condition + a5timeslighting conditionhellip + aktimesspeeding statustimesweather condition + ak+1timesspeeding statustimesdriverrsquos age +helliphellip
where a0 is the intercept and a1 a2 a3 helliphellip ak ak+1 helliphellip are the regression coefficients
As in the previous analysis FARS data was used in the modeling procedure Since in FARS driverrsquos alcohol involvement is estimated by Multiple Imputation (MI) 16 17
procedure the SAS MIANALYZE procedure was used in this study to perform the analysis of the MI data generated from the logistic regression18
21
NHTSArsquos National Center for Statistics and Analysis 1200 New Jersey Avenue SE Washington DC 20590
_______________________________________________________________________
41 Logistic Regression Results and Interpretation
Of all the variables considered in the logistic regression only 10 showed up as significant predictors (95 confidence level) As regards the interaction effect of these factors only the interaction of speeding with other variables was considered However only three of these interactions emerged as significant (95 confidence level) The results in Table 1 present estimates of regression coefficients and the corresponding odds ratio only for significant main effects and interactions Since the independent variables (predictors) are dichotomous the influence of the corresponding factors can be compared simply by comparing their regression coefficients
The ordered (decreasing) estimates of regression coefficients in Table 1 show that the most influential factor in the occurrence of fatal single-vehicle ROR crashes is the driver performance-related factor sleepy followed by alcohol use roadway alignment with curve speeding passenger car rural roadway number of lanes high-speed-limit road adverse weather and avoiding With regard to the interaction effect of speeding with other factors speeding with drivers of age groups 15 to 24 and 25 to 44 as well as speeding under adverse weather are significant contributors to the likelihood of ROR crashes
Table 1 Multiple Imputation Parameter Estimates Dagger
Variables Estimate Odds Ratio Driver performance-related factor sleepy vs others 11675 Dagger 321 Driver with alcohol BAC=01+ gdL vs BAC=0 06605 Dagger 194 Road alignment curve vs straight 05535 Dagger 174 Vehicle speeding status speeding vs non-speeding 04966 Dagger 164 Vehicle type passenger car vs other LTs 04780 Dagger 161 Road function rural vs urban 03637 Dagger 144 Roadway of lanes one or two (undivided) vs three amp more (undivided) 03346 Dagger 141 Road speed limit ge 60 mph vs lt60 mph 02659 Dagger 130 Weather adverse vs good 02130 Dagger 124 Driver performance-related factor avoiding vs others 02007 Dagger 122 Weather timesSpeeding status adverse amp speeding vs good amp non-speeding 01056 Dagger 111 Driver Age times Speeding status 25-44 amp speeding vs 65+ amp non-speeding 01003 Dagger 111 Driver Age times Speeding status 15-24 amp speeding vs 65+ amp non-speeding 00578 Dagger 106
Statistically significant variables (α = 005) associated with the high risk (odds ratio gt100) Other variables with low risk (odds ratio lt100) or insignificance (pgt005) after jointly estimating the effect are not shown here Dagger p-value lt00001
One of the most important by-product of logistic regression is the estimate of odds ratio that tells a great deal about the risk a certain factor carries in contributing to the occurrence of ROR crashes Specifically odds ratio measures the magnitude of increase in odds of happening of an event as a result of a unit increase in a predictor (eg sober and alcohol-used driver) An odds ratio value of 1 is indicative of no influence Table 1 also shows odds ratio estimates of significant factors and interactions
22
NHTSArsquos National Center for Statistics and Analysis 1200 New Jersey Avenue SE Washington DC 20590
_______________________________________________________________________
1
250 226
o 200
ita 164
Rd
s 150
d 124
O 100 100
050
Non-Speeding+Good Weather Non-Speeding+Adverse Weather
Speeding+Good Weather Speeding+Adverse Weather
Figure 15 Odds Ratio by Speeding Status and Weather Conditions
The odds ratio 321 for the factor ldquodriver performance-related factorrdquo shows that the odds of being involved in an ROR crash for a sleepy driver are three times as large as that for the driver who is not sleepy
The odds ratio 194 for the factor ldquodriver with alcoholrdquo shows that the odds of being involved in an ROR crash for an alcohol used driver (BAC=01+ gdL) are almost two times as large as that for a sober driver (BAC=0)
The odds ratio 174 for the factor ldquoroad alignmentrdquo shows that the odds of being involved in an ROR crash on curved roadways are 174 times as large as that on straight roadways in fatal single-vehicle crashes
The odds ratio 164 for the factor ldquovehicle speeding statusrdquo shows that the odds of being involved in an ROR crash for speeding vehicles are 164 times as large as that for non-speeding vehicles
The odds ratio 161 for the factor ldquovehicle typerdquo shows that the odds of being involved in an ROR crash for passenger cars are 161 times as large as that for other LTs
The odds ratio 144 for the factor ldquoroad functionrdquo shows that the odds of being involved in an ROR crash on rural roadways are 144 times as large as that on urban roadways
The odds ratio 266 for the factor ldquoweather amp speeding statusrdquo shows that the odds of being involved in an ROR crash under the adverse weather and in speeding vehicle are 266 (=164times124times111) times as large as that under the good weather and in non-speeding vehicle (Figure 15)
23
NHTSArsquos National Center for Statistics and Analysis 1200 New Jersey Avenue SE Washington DC 20590
_______________________________________________________________________
5 Conclusions
Run-off-road crashes account for a significant percentage (around 70) of all fatal single-vehicle crashes FARS data (1991 to 2007) that includes detailed information about ROR crashes provided sufficient statistical evidence to conclude that certain roadway- driver- environment- and vehicle-related factors closely associated with the occurrence of these crashes Appropriate crash countermeasures based on the identified factors can reduce the occurrence of single-vehicle ROR crashes and hence of the fatalities
Curved road segments rural roads high-speed-limit roadways and roadways with fewer lanes (divided or undivided) are found to be more likely to be the scene of fatal single-vehicle ROR crashes as compared to the fatal single-vehicle OR crashes Similarly among environmental factors adverse weather and night time periods are the factors associated with high risk of fatal single-vehicle ROR crashes
Vehicles with high occupancy (two and more occupants) male driver younger driver and alcohol used by driver are more likely to be involved in fatal single-vehicle ROR crashes as compared to the fatal single-vehicle OR crashes Drivers with performance-related factors (sleepy inattentive over-correction avoiding etc) are more likely to be involved in the fatal single-vehicle ROR crashes Speeding vehicles and passenger cars are also associated with high risks of the fatal single-vehicle ROR crashes
In the adverse weather condition and for the younger drivers (15 to 24 and 25 to 44) the speeding vehicle would increase the risk of fatal single-vehicle ROR crashes by an additional factor
The above facts based on statistical evidence suggest several crash countermeasures For example improving roadway design such as flattening curves and installing shoulder rumble strips or rehabilitation strategies such as building wide lanes or adding additional unpaved shoulder width on entire system providing skid-resistant pavement surfaces could reduce the likelihood of ROR crashes
24
NHTSArsquos National Center for Statistics and Analysis 1200 New Jersey Avenue SE Washington DC 20590
_______________________________________________________________________
6 References
1 FHWA (Undated) Reducing Highway Fatalities Washington DC Federal Highway Administration httpsafetyfhwadotgovroadway5Fdept
2 Neuman T RPfefer R Slack K L Council F McGee H Prothe L amp Eccles K (1998) Guidance for Implementation of the AASHTO Strategic Highway Safety Plan Report 500 Volume 6 A Guide for Addressing Run-Off Road Collisions Washington DC Transportation Research Board Available at httponlinepubstrborgonlinepubsnchrpnchrp_rpt_500v6pdf
3 Spainhour L K amp Mishra A (2007) Analysis of Fatal Run-off-the-Road Crashes Involving Overcorrection TRB 87th Annual Meeting Paper No 08-0661 Washington DC Transportation Research Board
4 McGee H W amp Hanscom F R Low-Cost Treatments for Horizontal Curve Safety FHWA-SA-07-002 December 2006
5 Johnston I Corben B TriggsT Candappa N amp Lenneacute M Reducing Serious Injury and Death from Run-off-Road Crashes in Victoria ndash Turning Knowledge into Action (2006 June) RACV Research Report Victoria Australia Royal Automobile Club of Victoria Ltd
6 Dissanayake S (2003 August) Young Drivers and Run-Off-the-Road Crashes Proceedings of the 2003 Mid-Continent Transportation Research Symposium Ames Iowa
7 Knapp K K Giese K L amp Lee W (2003 August) Urban Four-Lane Undivided to Three-Lane Roadway Conversion Guidelines Proceedings of the 2003 Mid-Continent Transportation Research Symposium Ames Iowa
8 Őrnek E amp Drakopoulos A (2007 August) Analysis of Run-Off-Road Crashes in Relation to Roadway Features and Driver Behavior Proceedings of the 2007 Mid-Continent Transportation Research Symposium Ames Iowa
9 Ray M H amp McGinnis R G (1997) Guardrail and Median Barrier Crashworthiness A Synthesis of Highway Practice NCHRP Synthesis 244 Washington DC Transportation Research Board National Research Council
10 Roadside Design Guide (2006) 3rd Edition Washington DC American Association of State Highway and Transportation Officials
25
NHTSArsquos National Center for Statistics and Analysis 1200 New Jersey Avenue SE Washington DC 20590
_______________________________________________________________________
11 Elvik R (1995) The Safety Value of Guardrails and Crash Cushions A Meta-Analysis of Evidence from Evaluation Studies Accident Analysis and Prevention 27 (4)
12 Stutts J C Reinfurth D W Staplin L amp Rodgman EA (2001 May) The Role of Driver Distraction in Traffic Crashes Washington DC AAA Foundation for Traffic Safety
13 Liu C Chen C-L Subramanian R amp Utter D (2005 June) Analysis of Speeding-Related Fatal Motor Vehicle Traffic Crashes NHTSA Technical Report DOT HS 809 839 Washington DC National Highway Traffic Safety Administration
14 Hosmer Jr D W and Lemeshow S (1989) Applied Logistic Regression New York John Wiley amp Sons Inc
15 SAS Institute Inc (1995) Logistic Regression Examples using SAS system Cary NC SAS Institute Inc
16 Rubin D B Schafer J L amp Subramanian R (1998 October) Multiple Imputation of Missing Blood Alcohol Concentration (BAC) Values in FARS NHTSA Technical Report DOT HS 808 816 Washington DC National Highway Traffic Safety Administration
17 Subramanian R (2005 March) Alcohol Involvement in Fatal Motor Vehicle Traffic Crashes NHTSA Technical Report DOT HS 809 822 Washington DC National Highway Traffic Safety Administration
18 SASSTAT Userrsquos Guide Version 8 1999 Cary NC SAS Institute Inc
26
NHTSArsquos National Center for Statistics and Analysis 1200 New Jersey Avenue SE Washington DC 20590
DOT HS 811 232November 2009
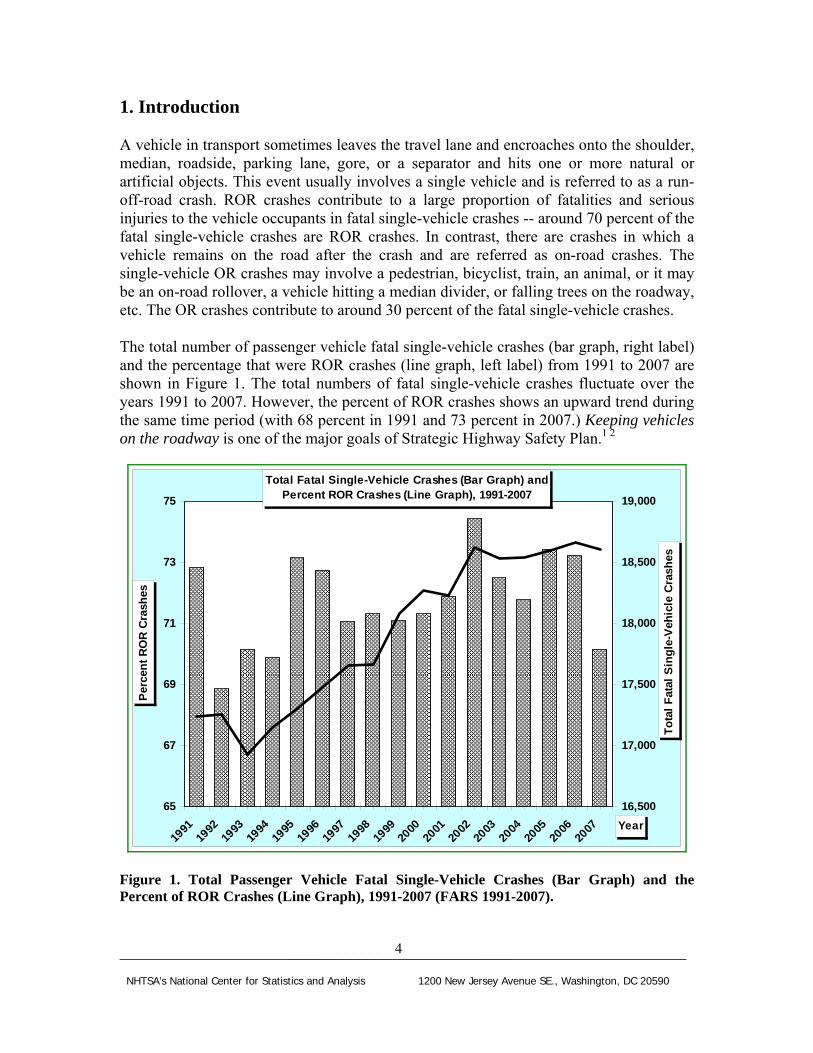
_______________________________________________________________________
NHTSArsquos National Center for Statistics and Analysis 1200 New Jersey Avenue SE Washington DC 20590
4
Total Fatal Single-Vehicle Crashes (Bar Graph) and Percent ROR Crashes (Line Graph) 1991-2007 75
73
71
69
67
65
91 2 3 4 5 6 79 9 9 9 9 99 9 9 9 9 9 98 9 0 1 2 3 04 5 619 19
9 0 0 0 0 0 07
9 0 0 0 0 0 01 1 1 1 1 1 1 2 2 2 2 20 200
2 2Year
19000
18500
s ehsa
Cr 18000
R
t R
Oencre 17500
P
17000
16500
s
ehsar
Cle
ic
heV-el
gin
l S
atal
Fat
oT
Figure 1 Total Passenger Vehicle Fatal Single-Vehicle Crashes (Bar Graph) and the Percent of ROR Crashes (Line Graph) 1991-2007 (FARS 1991-2007)
1 Introduction A vehicle in transport sometimes leaves the travel lane and encroaches onto the shoulder median roadside parking lane gore or a separator and hits one or more natural or artificial objects This event usually involves a single vehicle and is referred to as a runshyoff-road crash ROR crashes contribute to a large proportion of fatalities and serious injuries to the vehicle occupants in fatal single-vehicle crashes -- around 70 percent of the fatal single-vehicle crashes are ROR crashes In contrast there are crashes in which a vehicle remains on the road after the crash and are referred as on-road crashes The single-vehicle OR crashes may involve a pedestrian bicyclist train an animal or it may be an on-road rollover a vehicle hitting a median divider or falling trees on the roadway etc The OR crashes contribute to around 30 percent of the fatal single-vehicle crashes The total number of passenger vehicle fatal single-vehicle crashes (bar graph right label) and the percentage that were ROR crashes (line graph left label) from 1991 to 2007 are shown in Figure 1 The total numbers of fatal single-vehicle crashes fluctuate over the years 1991 to 2007 However the percent of ROR crashes shows an upward trend during the same time period (with 68 percent in 1991 and 73 percent in 2007) Keeping vehicles on the roadway is one of the major goals of Strategic Highway Safety Plan1 2
_______________________________________________________________________
The reasons for an ROR crash are varied and include avoiding a vehicle object or an animal in the travel lane over-correction during the operation of the vehicle inattentive driving due to distraction fatigue sleep or alcohol the effects of weather on pavement conditions and traveling too fast through a curve There are also a number of roadway design factors (eg travel lanes that are too narrow substandard curves) that can increase the probability that a driver error may result into an ROR crash 2-6
This study aims to identify the roadway factors (eg ruralurban nature and curve existence) driver factors (eg age gender sleepy and alcohol use) environmental factors (eg weather lighting condition) and vehicle-related factors (eg speeding) associated with the fatal single-vehicle ROR crashes The analyses on the relationship between selected factors (variables) and the likelihood of fatal single-vehicle ROR and OR crashes are presented
The study is focused only on fatal crashes that is a crash that involve a motor vehicle in transport traveling on a traffic way customarily open to the public and resulting in the death of a person (occupant of a vehicle or a non-motorist) within 30 days of the crash Therefore the results presented in this study can not be generalized to the entire crash population Also because the comparisons are made between single-vehicle ROR and OR crashes it is possible that the factors that differ between these two types of crashes are not necessarily associated solely with these two types of crashes
The outline of this report is as follows Section 2 presents the data and the method used in this report Section 3 presents the descriptive (univariate) statistics through the percentage frequency distributions of fatal single-vehicle ROR versus fatal single-vehicle OR crashes by various roadway- environment- occupant- and vehicle-related factors Section 4 assesses their relative influence as well as estimates the amount of risk each factor carries in the occurrence of such crashes using logistic regression The conclusions are presented in Section 5
5
NHTSArsquos National Center for Statistics and Analysis 1200 New Jersey Avenue SE Washington DC 20590
_______________________________________________________________________
2 Data and Methodology
The data used in this study comes from the Fatality Analysis Reporting System for fatal crashes during the period 1991 to 2007 All analyses in this report pertain to fatal single-vehicle ROR crashes that involve passenger vehicles including cars vans pickup trucks and utility vehicles with gross vehicle weight ratings under 10000 lbs
In this study the fatal single-vehicle crashes were categorized into two groups ROR crashes and OR crashes in which the vehicles were still on the road after the crashdagger The descriptive (univariate) analysis of the relationship between selected factors (variables) was conducted to estimate the likelihood of a vehicle involvement in fatal single-vehicle ROR and OR crashes The chi-square test is used to assess the differences in percentages between groups and is statistically significant at α = 005 significance level when p lt005 The impact of these related factors is also assessed by logistic regression procedure in which the OR crashes essentially form one element of the binary outcome (on-road versus off- road) This procedure helps to assess their relative influence as well as estimate the amount of risk each carries in the occurrence of such crashes
dagger For the designation of ROR and OR crash refer to FARS Analytical Reference Guide 1975-2006 DOT HS 810 605 May 2006
6
NHTSArsquos National Center for Statistics and Analysis 1200 New Jersey Avenue SE Washington DC 20590
_______________________________________________________________________
3 Factors Related to Fatal Single-Vehicle ROR Crashes
In this section a descriptive (univariate) approach is used to identify the roadway- driver- environment- and vehicle-related factors (variables) that may have strong association with the fatal single-vehicle ROR crashes Based on other studies several variables were considered that include the curvature of the road roadway function class (ruralurban) number of lanes posted speed limit weather and lighting conditions age gender and alcohol use by the driver7 8 9 10 11
31 Environment-Related Factors
The environment-related factors examined in the study are roadway alignment roadway function class number of lanes posted speed limit weather and lighting conditions
311 Road Environment
Road Alignment
Roadway alignment plays a significant role in the occurrence of ROR crashes Figure 2 shows the percentage frequency distributions of passenger vehicles involved in fatal single-vehicle ROR and OR crashes by road alignment (curved or straight)
902 621
98 379
0
50
100
Curve (N=95190) Straight (N=212832)
Pe
rce
nt
ROR OR
Figure 2 Percentage Frequency Distributions of Fatal Single-Vehicle ROR and OR Crashes by Road Alignment (FARS 1991-2007)
7
NHTSArsquos National Center for Statistics and Analysis 1200 New Jersey Avenue SE Washington DC 20590
_______________________________________________________________________
The statistics show that among all fatal single-vehicle crashes that occurred on the curved roads 902 percent were ROR crashes while among crashes that occurred on straight roadways 621 percent were ROR crashes In contrast the occurrence of OR crashes are more frequent on straight roadways A χ2 test shows that the difference between two percentages is statistically significant (p lt00001) thereby indicating that the curved road segments are more likely to be the scene of ROR crashes as compared to the straight roadways Improving roadway design (eg flattening curves signing or the more general curve delineation) could reduce the likelihood of ROR crashes
Roadway Function Class
It is also of interest to see if the roadway function class makes a difference in the occurrence of ROR crashes Figure 3 shows the percentage frequency distributions of passenger vehicles involved in fatal single-vehicle ROR and OR crashes by roadway function (rural or urban)
In fatal single-vehicle crashes among those that occurred on rural roads 806 percent were ROR crashes while among those that occurred on urban roadways 562 percent were ROR crashes In contrast the occurrence of OR crashes were more frequent on urban roadways A χ2 test shows that the difference between two percentages of ROR crashes is statistically significant (p lt00001) This shows that the rural roads are more likely to be the scene of ROR crashes as compared to the urban roads
806 562
194 438
0
50
100
Rural (N=183363) Urban (N=124248)
Pe
rce
nt
ROR OR
Figure 3 Percentage Frequency Distributions of Fatal Single-Vehicle ROR and OR Crashes by Roadway Function (FARS 1991-2007)
8
NHTSArsquos National Center for Statistics and Analysis 1200 New Jersey Avenue SE Washington DC 20590
_______________________________________________________________________
Road Posted Speed Limit
In most cases the actual vehiclersquos pre-crash travel speed is unknown In this analysis the posted speed limit was used as a proxy to a vehiclersquos travel speed Figure 4 shows the percentage frequency distributions of passenger vehicles involved in fatal single-vehicle ROR and OR crashes by posted speed limits (lt 60 mph and 60+ mph)
Among fatal single-vehicle crashes that occurred on roadways with posted speed limits of 60 mph and above 81 percent were ROR crashes while among the crashes that occurred on roadways with posted speed limits less than 60 mph 69 percent were ROR crashes A χ2 test shows that the difference between these two percentages is statistically significant (p lt00001) This in turn shows that the high speed limit roads are more likely to be the scene of ROR crashes as compared to the low speed limit roads
810 690
190 310
0
50
100
60+ mph (N=49687) lt 60 mph (N=251554)
Pe
rce
nt
ROR OR
Figure 4 Percentage Frequency Distributions of Fatal Single-Vehicle ROR and OR Crashes by Road Posted Speed Limits (FARS 1991-2007)
9
NHTSArsquos National Center for Statistics and Analysis 1200 New Jersey Avenue SE Washington DC 20590
_______________________________________________________________________
Roadway Number of Lanes
Another factor that is worth investigating is the roadway number of lanes Figure 5 shows the percentage frequency distributions of passenger vehicles involved in fatal single-vehicle ROR and OR crashes by roadway number of lanes Four categories of roadways were considered with reference to the number of lanes one or two lanes (divided or undivided) and three or more lanes (divided or undivided) The number of lanes refers to the number of lanes of a continuous cross-section of roadway For example a local roadway with one lane going north and one lane going south would be coded as two lanes However if a trafficway is a divided highway with two lanes going north a median and two lanes going south then the number of lanes is coded as two If a trafficway has two lanes going north immediately adjacent to two lanes going south one continuous cross-section of roadway then the number of lanes is coded as four
The results in Figure 5 show that among the fatal single-vehicle crashes that occurred on roadways with fewer lanes (one or two lanes) 678 percent (divided) and 766 percent (undivided) were ROR crashes while among the crashes that occurred on roads with three and more lanes 62 percent (divided) and 40 percent (undivided) were ROR crashes In contrast the occurrence of OR crashes were more frequent on roadways with three and more lanes as compared to one or more lanes both in the case of divided and undivided roadways
Statistically significant (p lt00001) difference shows that the roadways with fewer lanes (one or two lanes) are more likely to be the scene of ROR crashes as compared to the roadway with three and more lanes (divided or undivided) The roadway design or rehabilitation strategy such as building more lanes is likely to reduce ROR crashes 8
400 620 678 766
600 380 326 234
0
50
100
One or Tw o Lanes Divided
(N=53563)
One or Tw o Lanes Undivided (N=191462)
Three and More Lanes Divided
(N=35615)
Three and More Lanes Undivided
(N=18395)
Pe
rce
nt
ROR OR
Figure 5 Percentage Frequency Distributions of Fatal Single-Vehicle ROR and OR Crashes by Roadway Number of Lanes (FARS 1991-2007)
10
NHTSArsquos National Center for Statistics and Analysis 1200 New Jersey Avenue SE Washington DC 20590
_______________________________________________________________________
312 Weather Conditions
To investigate if certain weather conditions contribute to the occurrence of ROR crashes the percentage frequency distributions of passenger vehicles involved in fatal single-vehicle ROR and OR crashes by weather conditions were obtained Two weather conditions were considered for this purpose adverse (rain sleet snow fog fog and others - smog smoke blowing sand or dust) and good weather conditions (normal or clear) The results are presented in Figure 6
Among fatal single-vehicle crashes that occurred during adverse weather conditions 755 percent were ROR crashes while among crashes that occurred during good weather conditions 70 percent were ROR crashes On the other hand OR crashes were more frequent in good weather conditions
The significant difference between the two percentages (p lt00001) shows that ROR crashes are more likely to occur in adverse weather conditions as compared to good weather conditions Improving roadway design (eg providing skid-resistant pavement surfaces) could reduce the likelihood of ROR crashes
755 700
245 300
0
50
100
Adverse Weather (N=34152) Good Weather (N=273242)
Pe
rce
nt
ROR OR
Figure 6 Percentage Frequency Distributions of Fatal Single-Vehicle ROR and OR Crashes by Weather Conditions (FARS 1991-2007)
11
NHTSArsquos National Center for Statistics and Analysis 1200 New Jersey Avenue SE Washington DC 20590
_______________________________________________________________________
ROR OR
100
50
0
Night Time (N=155199) Day Time (N=149945)
742 665
258 335
Pe
rce
nt
313 Natural Lighting Conditions
Could visibility due to natural lighting be an issue in the occurrence of ROR crashes To answer this question frequency analysis was conducted for two lighting conditions nighttime and daytime Figure 7 shows the percentage frequency distributions of passenger vehicles involved in fatal single-vehicle ROR and OR crashes by lighting conditions
Among fatal single-vehicle crashes that occurred during nighttime (8 pm ndash 559 am) 742 percent were ROR crashes while among the crashes that occurred during daytime (6 am ndash 759 pm) 665 percent were ROR crashes In contrast the occurrence of OR crashes are more frequent during day time
A χ2 test confirms that the difference between two percentages is statistically significant (p lt00001) This shows that the night time driving is more likely to result into ROR crashes as compared to the day time period Reduced lighting like adverse weather is associated with a significant increase in the likelihood of single-vehicle ROR crashes
Figure 7 Percentage Frequency Distributions of Fatal Single-Vehicle ROR and OR Crashes by Lighting Conditions (FARS 1991-2007)
12
NHTSArsquos National Center for Statistics and Analysis 1200 New Jersey Avenue SE Washington DC 20590
_______________________________________________________________________
ROR OR
680 748
320 252
0
50
100
Pe
rce
nt
One Occupant (Driver Alone) Two or More Occupants (N=183611) (N=125559)
32 Occupant-Related Factors
The occupant-related factors examined in the study include vehicle occupancy driverrsquos gender age alcohol use and driver performance-related factors such as sleep inattention over-correction of the vehicle etc
321 Occupancy
It is of interest to see if the occupancy of a vehicle makes a difference in the occurrence of ROR crashes Figure 8 shows the percentage frequency distributions of passenger vehicles involved in fatal single-vehicle ROR and OR crashes by vehicle occupancy
Among fatal single-vehicle crashes involving a vehicle with only one occupant (driver alone) 680 percent were ROR crashes while among crashes involving a vehicle with two or more occupants 748 percent were ROR crashes A χ2 test confirms the difference between these two percentages to be statistically significant (p lt00001)
This shows that vehicles with high occupancy (two or more occupants) are more likely to be involved in ROR crashes as compared to a vehicle with the driver alone The reason for this is not immediately clear However a possible explanation could be the fact that the presence of other occupants in the vehicle is a likely source of distraction to the driver due to conversation and other activities 12
Figure 8 Percentage Frequency Distributions of Fatal Single-Vehicle ROR and OR Crashes by Vehicle Occupancy (FARS 1991-2007)
13
NHTSArsquos National Center for Statistics and Analysis 1200 New Jersey Avenue SE Washington DC 20590
_______________________________________________________________________
722 665
278 335
ROR OR
100
50
0
Male Driver (N=230416) Female Driver (N=78754)
Pe
rce
nt
322 Driverrsquos Gender
Among many driver-related factors driver gender that could possibly contribute to the occurrence of ROR crashes was studied Figure 9 shows the percentage frequency distributions of passenger vehicles involved in fatal single-vehicle ROR and OR crashes by driverrsquos gender
Among fatal single-vehicle crashes involving male drivers 722 percent were ROR crashes while 665 percent crashes involving female drivers were ROR crashes In contrast the occurrence of OR crashes are more frequent for female drivers A χ2 test shows that the difference between the two percentages is statistically significant (p lt00001)
Thus one could infer that vehicles with the male drivers are more likely to be involved in ROR crashes as compared to the vehicles with the female drivers
Figure 9 Percentage Frequency Distributions of Fatal Single-Vehicle ROR and OR Crashes by Driverrsquos Gender (FARS 1991-2007)
14
NHTSArsquos National Center for Statistics and Analysis 1200 New Jersey Avenue SE Washington DC 20590
_______________________________________________________________________
323 Driverrsquos Age
To look into driver age as a contributing factor in ROR crashes four age groups were considered 15 to 24 25 to 44 45 to 64 and 65 and older Figure 10 shows the percentage frequency distributions of passenger vehicles involved in fatal single-vehicle ROR and OR crashes by these age groups
Among fatal single-vehicle crashes involving young drivers 15 to 24 a higher percentage (752 percent) were of ROR crashes as compared to other age groups This shows that vehicles with young drivers 15 to 24 are more likely to be involved in ROR crashes as compared to other three age groups
727 664 752 686
273 336 248 314
0
50
100
15-24 (N=102962)
25-44 (N=121728)
45-64 (N=55303)
65+ (N=27195)
Pe
rce
nt
ROR OR
Figure 10 Percentage Frequency Distributions of Fatal Single-Vehicle ROR and OR Crashes by Driverrsquos Age (FARS 1991-2007)
15
NHTSArsquos National Center for Statistics and Analysis 1200 New Jersey Avenue SE Washington DC 20590
_______________________________________________________________________
583 865
417 135
0
50
100
BAC=0 (N=172537) BAC=001+ (N=136633)
Pe
rce
nt
ROR OR
Figure 11 Percentage Frequency Distributions of Fatal Single-Vehicle ROR and OR Crashes by Driverrsquos Alcohol Use (FARS 1991-2007)
324 Alcohol-Related Driving
Alcohol involvement of a driver often leads to safety issues such as loss of vehicle control that may result into a ROR crash Two categories of drivers sober (BAC=0) and alcohol involved (BAC=01+) were considered in the analysis to see if alcohol use contributes to ROR crashes Figure 11 shows the percentage frequency distributions of passenger vehicles involved in fatal single-vehicle ROR and OR crashes by driverrsquos alcohol use
Among fatal single-vehicle crashes involving drivers with alcohol use (BAC=01+) 865 percent were ROR crashes while among those drivers with no alcohol (BAC=0) 583 percent were ROR crashes The difference between these two percentages is statistically significant (p lt00001) This indicates that the drivers with alcohol use are more likely to be involved in ROR crashes as compared to sober drivers
16
NHTSArsquos National Center for Statistics and Analysis 1200 New Jersey Avenue SE Washington DC 20590
_______________________________________________________________________
325 Driver-Performance-Related Factors
Some of the driver performance-related factors that are likely to contribute to the occurrence of ROR crashes were also examined
These include (1) sleepy (drowsy asleep fatigued and sleepy) (2) inattentive (talking eating etc) (3) over-correcting of the vehicle (4) avoiding (avoiding swerving or sliding due to severe crosswind tire blow-out or flat live animals in road vehicle in road etc) (5) distractions inside vehicles (cellular telephone computer fax machine etc) and (6) other driver-performance-related factors such as mentally challenged following improperly failure to signal intensions etc
Figure 12 shows the percentage frequency distributions of passenger vehicles involved in fatal single-vehicle ROR and OR crashes based on the driver performance-related factors The statistics show that the percentages of sleepy (912) inattentive (754) over correction of the vehicle (856) and crash avoiding (798) drivers involved in fatal single-vehicle ROR crashes are significantly greater (p lt00001) than the drivers with lsquoOther driver performance-related factorsrsquo that account for 67 percent of ROR crashes
This means that drivers with these performance-related factors (sleepy inattentive over correction avoiding etc) are more likely to be involved in ROR crashes as compared to drivers with other performance-related factors These results are consistent with those obtained from other studies using different approaches and other crash databases 2-11
17
NHTSArsquos National Center for Statistics and Analysis 1200 New Jersey Avenue SE Washington DC 20590
_______________________________________________________________________
672 671 798 856 754 912
328 329 202 144 246 88
0
20
40
60
80
100
Sleepy (N=14774)
Inattention (N=28081)
Overcorrect (N=19289)
Avoiding (N=14145)
Possible Distraction (N=1429)
Others (N=227587)
Per
cen
t
ROR OR
Figure 12 Percentage Frequency Distributions of Fatal Single-Vehicle ROR and OR Crashes by Driver Performance-Related Factors (FARS 1991-2007)
18
NHTSArsquos National Center for Statistics and Analysis 1200 New Jersey Avenue SE Washington DC 20590
_______________________________________________________________________
33 Vehicle-Related Factors
It is generally believed that ROR crashes are likely to occur due to some vehicle-related factors such as vehicle speeding or vehicle type
331 Vehicle Speeding Status
A crash is considered speeding-related if any driver involved in the crash is charged with a speeding-related offense or if a police officer indicates that racing driving too fast for the conditions or exceeding the posted speed limit was a related factor in the crash 13
Figure 13 shows the percentage frequency distributions of passenger vehicles involved in fatal single-vehicle ROR and OR crashes by vehicle speeding status
Among fatal single-vehicle crashes that involved a speeding vehicle 90 percent were ROR crashes while among crashes that did not involve a speeding vehicle 595 percent were ROR crashes A χ2 test shows that the difference between two percentages is statistically significant (p lt00001) thereby showing that speeding vehicles are more likely to be involved in ROR crashes as compared to non-speeding vehicles
900 595
100 405
0
50
100
Speeding (N=113825) Non-Speeding (N=195345)
Pe
rce
nt
ROR OR
Figure 13 Percentage Frequency Distributions of Fatal Single-Vehicle ROR and OR Crashes by Vehicle Speeding Status (FARS 1991-2007)
19
NHTSArsquos National Center for Statistics and Analysis 1200 New Jersey Avenue SE Washington DC 20590
_______________________________________________________________________
500 520 600 670 730 710
500 480 400 330 270 290
00
200
400
600
800
1000
Passenger Car
(N=178430)
LT Pickup
(N=72065)
LT Utility
(N=38970)
LT MiniVan
(N=11159)
LT Other Van (N=7904)
LT Others (N=642)
Pe
rce
nt
ROR OR
Figure 14 shows the percentage frequency distributions of passenger vehicles involved in fatal single-vehicle ROR and OR crashes by passenger vehicle type passenger car light truck (LT) including pickup utility minivan other van and other light trucks) It shows that passenger cars are more likely to be involved in ROR crashes as compared to other passenger vehicle types Minivans (60) are more likely to be involved in ROR crashes (p lt00001) as compared to other vans (52)
332 Vehicle Type
Figure 14 Percentage Frequency Distributions of Fatal Single-Vehicle ROR and OR Crashes by Vehicle Type (FARS 1991-2007)
20
NHTSArsquos National Center for Statistics and Analysis 1200 New Jersey Avenue SE Washington DC 20590
_______________________________________________________________________
4 Logistic Regression
The analysis in the previous sections shows that factors such as driver sleepiness alcohol use vehicle speeding curved roadway rural roads etc are significant contributors to the occurrence of fatal single-vehicle ROR crashes It remains to assess their relative influence as well as estimate the amount of risk each carries in the occurrence of such crashes Logistic regression was used for this purpose This is a modeling procedure that predicts the probability (p) of occurrence of an event (fatal single-vehicle ROR crash in the present case) as a consequence of certain roadway- driver- environment- and vehicle-related factors such as sleepy alcohol use weather condition lighting condition speeding status road function etc Generally the logistic regression model provides log of odds as a function of the predictors
Log (odds) = a0 + a1timesdriver performance-related factor + a2timesalcohol use + a3timesspeeding status + a4timesweather condition + a5timeslighting conditionhellip + aktimesspeeding statustimesweather condition + ak+1timesspeeding statustimesdriverrsquos age +helliphellip
where a0 is the intercept and a1 a2 a3 helliphellip ak ak+1 helliphellip are the regression coefficients
As in the previous analysis FARS data was used in the modeling procedure Since in FARS driverrsquos alcohol involvement is estimated by Multiple Imputation (MI) 16 17
procedure the SAS MIANALYZE procedure was used in this study to perform the analysis of the MI data generated from the logistic regression18
21
NHTSArsquos National Center for Statistics and Analysis 1200 New Jersey Avenue SE Washington DC 20590
_______________________________________________________________________
41 Logistic Regression Results and Interpretation
Of all the variables considered in the logistic regression only 10 showed up as significant predictors (95 confidence level) As regards the interaction effect of these factors only the interaction of speeding with other variables was considered However only three of these interactions emerged as significant (95 confidence level) The results in Table 1 present estimates of regression coefficients and the corresponding odds ratio only for significant main effects and interactions Since the independent variables (predictors) are dichotomous the influence of the corresponding factors can be compared simply by comparing their regression coefficients
The ordered (decreasing) estimates of regression coefficients in Table 1 show that the most influential factor in the occurrence of fatal single-vehicle ROR crashes is the driver performance-related factor sleepy followed by alcohol use roadway alignment with curve speeding passenger car rural roadway number of lanes high-speed-limit road adverse weather and avoiding With regard to the interaction effect of speeding with other factors speeding with drivers of age groups 15 to 24 and 25 to 44 as well as speeding under adverse weather are significant contributors to the likelihood of ROR crashes
Table 1 Multiple Imputation Parameter Estimates Dagger
Variables Estimate Odds Ratio Driver performance-related factor sleepy vs others 11675 Dagger 321 Driver with alcohol BAC=01+ gdL vs BAC=0 06605 Dagger 194 Road alignment curve vs straight 05535 Dagger 174 Vehicle speeding status speeding vs non-speeding 04966 Dagger 164 Vehicle type passenger car vs other LTs 04780 Dagger 161 Road function rural vs urban 03637 Dagger 144 Roadway of lanes one or two (undivided) vs three amp more (undivided) 03346 Dagger 141 Road speed limit ge 60 mph vs lt60 mph 02659 Dagger 130 Weather adverse vs good 02130 Dagger 124 Driver performance-related factor avoiding vs others 02007 Dagger 122 Weather timesSpeeding status adverse amp speeding vs good amp non-speeding 01056 Dagger 111 Driver Age times Speeding status 25-44 amp speeding vs 65+ amp non-speeding 01003 Dagger 111 Driver Age times Speeding status 15-24 amp speeding vs 65+ amp non-speeding 00578 Dagger 106
Statistically significant variables (α = 005) associated with the high risk (odds ratio gt100) Other variables with low risk (odds ratio lt100) or insignificance (pgt005) after jointly estimating the effect are not shown here Dagger p-value lt00001
One of the most important by-product of logistic regression is the estimate of odds ratio that tells a great deal about the risk a certain factor carries in contributing to the occurrence of ROR crashes Specifically odds ratio measures the magnitude of increase in odds of happening of an event as a result of a unit increase in a predictor (eg sober and alcohol-used driver) An odds ratio value of 1 is indicative of no influence Table 1 also shows odds ratio estimates of significant factors and interactions
22
NHTSArsquos National Center for Statistics and Analysis 1200 New Jersey Avenue SE Washington DC 20590
_______________________________________________________________________
1
250 226
o 200
ita 164
Rd
s 150
d 124
O 100 100
050
Non-Speeding+Good Weather Non-Speeding+Adverse Weather
Speeding+Good Weather Speeding+Adverse Weather
Figure 15 Odds Ratio by Speeding Status and Weather Conditions
The odds ratio 321 for the factor ldquodriver performance-related factorrdquo shows that the odds of being involved in an ROR crash for a sleepy driver are three times as large as that for the driver who is not sleepy
The odds ratio 194 for the factor ldquodriver with alcoholrdquo shows that the odds of being involved in an ROR crash for an alcohol used driver (BAC=01+ gdL) are almost two times as large as that for a sober driver (BAC=0)
The odds ratio 174 for the factor ldquoroad alignmentrdquo shows that the odds of being involved in an ROR crash on curved roadways are 174 times as large as that on straight roadways in fatal single-vehicle crashes
The odds ratio 164 for the factor ldquovehicle speeding statusrdquo shows that the odds of being involved in an ROR crash for speeding vehicles are 164 times as large as that for non-speeding vehicles
The odds ratio 161 for the factor ldquovehicle typerdquo shows that the odds of being involved in an ROR crash for passenger cars are 161 times as large as that for other LTs
The odds ratio 144 for the factor ldquoroad functionrdquo shows that the odds of being involved in an ROR crash on rural roadways are 144 times as large as that on urban roadways
The odds ratio 266 for the factor ldquoweather amp speeding statusrdquo shows that the odds of being involved in an ROR crash under the adverse weather and in speeding vehicle are 266 (=164times124times111) times as large as that under the good weather and in non-speeding vehicle (Figure 15)
23
NHTSArsquos National Center for Statistics and Analysis 1200 New Jersey Avenue SE Washington DC 20590
_______________________________________________________________________
5 Conclusions
Run-off-road crashes account for a significant percentage (around 70) of all fatal single-vehicle crashes FARS data (1991 to 2007) that includes detailed information about ROR crashes provided sufficient statistical evidence to conclude that certain roadway- driver- environment- and vehicle-related factors closely associated with the occurrence of these crashes Appropriate crash countermeasures based on the identified factors can reduce the occurrence of single-vehicle ROR crashes and hence of the fatalities
Curved road segments rural roads high-speed-limit roadways and roadways with fewer lanes (divided or undivided) are found to be more likely to be the scene of fatal single-vehicle ROR crashes as compared to the fatal single-vehicle OR crashes Similarly among environmental factors adverse weather and night time periods are the factors associated with high risk of fatal single-vehicle ROR crashes
Vehicles with high occupancy (two and more occupants) male driver younger driver and alcohol used by driver are more likely to be involved in fatal single-vehicle ROR crashes as compared to the fatal single-vehicle OR crashes Drivers with performance-related factors (sleepy inattentive over-correction avoiding etc) are more likely to be involved in the fatal single-vehicle ROR crashes Speeding vehicles and passenger cars are also associated with high risks of the fatal single-vehicle ROR crashes
In the adverse weather condition and for the younger drivers (15 to 24 and 25 to 44) the speeding vehicle would increase the risk of fatal single-vehicle ROR crashes by an additional factor
The above facts based on statistical evidence suggest several crash countermeasures For example improving roadway design such as flattening curves and installing shoulder rumble strips or rehabilitation strategies such as building wide lanes or adding additional unpaved shoulder width on entire system providing skid-resistant pavement surfaces could reduce the likelihood of ROR crashes
24
NHTSArsquos National Center for Statistics and Analysis 1200 New Jersey Avenue SE Washington DC 20590
_______________________________________________________________________
6 References
1 FHWA (Undated) Reducing Highway Fatalities Washington DC Federal Highway Administration httpsafetyfhwadotgovroadway5Fdept
2 Neuman T RPfefer R Slack K L Council F McGee H Prothe L amp Eccles K (1998) Guidance for Implementation of the AASHTO Strategic Highway Safety Plan Report 500 Volume 6 A Guide for Addressing Run-Off Road Collisions Washington DC Transportation Research Board Available at httponlinepubstrborgonlinepubsnchrpnchrp_rpt_500v6pdf
3 Spainhour L K amp Mishra A (2007) Analysis of Fatal Run-off-the-Road Crashes Involving Overcorrection TRB 87th Annual Meeting Paper No 08-0661 Washington DC Transportation Research Board
4 McGee H W amp Hanscom F R Low-Cost Treatments for Horizontal Curve Safety FHWA-SA-07-002 December 2006
5 Johnston I Corben B TriggsT Candappa N amp Lenneacute M Reducing Serious Injury and Death from Run-off-Road Crashes in Victoria ndash Turning Knowledge into Action (2006 June) RACV Research Report Victoria Australia Royal Automobile Club of Victoria Ltd
6 Dissanayake S (2003 August) Young Drivers and Run-Off-the-Road Crashes Proceedings of the 2003 Mid-Continent Transportation Research Symposium Ames Iowa
7 Knapp K K Giese K L amp Lee W (2003 August) Urban Four-Lane Undivided to Three-Lane Roadway Conversion Guidelines Proceedings of the 2003 Mid-Continent Transportation Research Symposium Ames Iowa
8 Őrnek E amp Drakopoulos A (2007 August) Analysis of Run-Off-Road Crashes in Relation to Roadway Features and Driver Behavior Proceedings of the 2007 Mid-Continent Transportation Research Symposium Ames Iowa
9 Ray M H amp McGinnis R G (1997) Guardrail and Median Barrier Crashworthiness A Synthesis of Highway Practice NCHRP Synthesis 244 Washington DC Transportation Research Board National Research Council
10 Roadside Design Guide (2006) 3rd Edition Washington DC American Association of State Highway and Transportation Officials
25
NHTSArsquos National Center for Statistics and Analysis 1200 New Jersey Avenue SE Washington DC 20590
_______________________________________________________________________
11 Elvik R (1995) The Safety Value of Guardrails and Crash Cushions A Meta-Analysis of Evidence from Evaluation Studies Accident Analysis and Prevention 27 (4)
12 Stutts J C Reinfurth D W Staplin L amp Rodgman EA (2001 May) The Role of Driver Distraction in Traffic Crashes Washington DC AAA Foundation for Traffic Safety
13 Liu C Chen C-L Subramanian R amp Utter D (2005 June) Analysis of Speeding-Related Fatal Motor Vehicle Traffic Crashes NHTSA Technical Report DOT HS 809 839 Washington DC National Highway Traffic Safety Administration
14 Hosmer Jr D W and Lemeshow S (1989) Applied Logistic Regression New York John Wiley amp Sons Inc
15 SAS Institute Inc (1995) Logistic Regression Examples using SAS system Cary NC SAS Institute Inc
16 Rubin D B Schafer J L amp Subramanian R (1998 October) Multiple Imputation of Missing Blood Alcohol Concentration (BAC) Values in FARS NHTSA Technical Report DOT HS 808 816 Washington DC National Highway Traffic Safety Administration
17 Subramanian R (2005 March) Alcohol Involvement in Fatal Motor Vehicle Traffic Crashes NHTSA Technical Report DOT HS 809 822 Washington DC National Highway Traffic Safety Administration
18 SASSTAT Userrsquos Guide Version 8 1999 Cary NC SAS Institute Inc
26
NHTSArsquos National Center for Statistics and Analysis 1200 New Jersey Avenue SE Washington DC 20590
DOT HS 811 232November 2009
_______________________________________________________________________
2 Data and Methodology
The data used in this study comes from the Fatality Analysis Reporting System for fatal crashes during the period 1991 to 2007 All analyses in this report pertain to fatal single-vehicle ROR crashes that involve passenger vehicles including cars vans pickup trucks and utility vehicles with gross vehicle weight ratings under 10000 lbs
In this study the fatal single-vehicle crashes were categorized into two groups ROR crashes and OR crashes in which the vehicles were still on the road after the crashdagger The descriptive (univariate) analysis of the relationship between selected factors (variables) was conducted to estimate the likelihood of a vehicle involvement in fatal single-vehicle ROR and OR crashes The chi-square test is used to assess the differences in percentages between groups and is statistically significant at α = 005 significance level when p lt005 The impact of these related factors is also assessed by logistic regression procedure in which the OR crashes essentially form one element of the binary outcome (on-road versus off- road) This procedure helps to assess their relative influence as well as estimate the amount of risk each carries in the occurrence of such crashes
dagger For the designation of ROR and OR crash refer to FARS Analytical Reference Guide 1975-2006 DOT HS 810 605 May 2006
6
NHTSArsquos National Center for Statistics and Analysis 1200 New Jersey Avenue SE Washington DC 20590
_______________________________________________________________________
3 Factors Related to Fatal Single-Vehicle ROR Crashes
In this section a descriptive (univariate) approach is used to identify the roadway- driver- environment- and vehicle-related factors (variables) that may have strong association with the fatal single-vehicle ROR crashes Based on other studies several variables were considered that include the curvature of the road roadway function class (ruralurban) number of lanes posted speed limit weather and lighting conditions age gender and alcohol use by the driver7 8 9 10 11
31 Environment-Related Factors
The environment-related factors examined in the study are roadway alignment roadway function class number of lanes posted speed limit weather and lighting conditions
311 Road Environment
Road Alignment
Roadway alignment plays a significant role in the occurrence of ROR crashes Figure 2 shows the percentage frequency distributions of passenger vehicles involved in fatal single-vehicle ROR and OR crashes by road alignment (curved or straight)
902 621
98 379
0
50
100
Curve (N=95190) Straight (N=212832)
Pe
rce
nt
ROR OR
Figure 2 Percentage Frequency Distributions of Fatal Single-Vehicle ROR and OR Crashes by Road Alignment (FARS 1991-2007)
7
NHTSArsquos National Center for Statistics and Analysis 1200 New Jersey Avenue SE Washington DC 20590
_______________________________________________________________________
The statistics show that among all fatal single-vehicle crashes that occurred on the curved roads 902 percent were ROR crashes while among crashes that occurred on straight roadways 621 percent were ROR crashes In contrast the occurrence of OR crashes are more frequent on straight roadways A χ2 test shows that the difference between two percentages is statistically significant (p lt00001) thereby indicating that the curved road segments are more likely to be the scene of ROR crashes as compared to the straight roadways Improving roadway design (eg flattening curves signing or the more general curve delineation) could reduce the likelihood of ROR crashes
Roadway Function Class
It is also of interest to see if the roadway function class makes a difference in the occurrence of ROR crashes Figure 3 shows the percentage frequency distributions of passenger vehicles involved in fatal single-vehicle ROR and OR crashes by roadway function (rural or urban)
In fatal single-vehicle crashes among those that occurred on rural roads 806 percent were ROR crashes while among those that occurred on urban roadways 562 percent were ROR crashes In contrast the occurrence of OR crashes were more frequent on urban roadways A χ2 test shows that the difference between two percentages of ROR crashes is statistically significant (p lt00001) This shows that the rural roads are more likely to be the scene of ROR crashes as compared to the urban roads
806 562
194 438
0
50
100
Rural (N=183363) Urban (N=124248)
Pe
rce
nt
ROR OR
Figure 3 Percentage Frequency Distributions of Fatal Single-Vehicle ROR and OR Crashes by Roadway Function (FARS 1991-2007)
8
NHTSArsquos National Center for Statistics and Analysis 1200 New Jersey Avenue SE Washington DC 20590
_______________________________________________________________________
Road Posted Speed Limit
In most cases the actual vehiclersquos pre-crash travel speed is unknown In this analysis the posted speed limit was used as a proxy to a vehiclersquos travel speed Figure 4 shows the percentage frequency distributions of passenger vehicles involved in fatal single-vehicle ROR and OR crashes by posted speed limits (lt 60 mph and 60+ mph)
Among fatal single-vehicle crashes that occurred on roadways with posted speed limits of 60 mph and above 81 percent were ROR crashes while among the crashes that occurred on roadways with posted speed limits less than 60 mph 69 percent were ROR crashes A χ2 test shows that the difference between these two percentages is statistically significant (p lt00001) This in turn shows that the high speed limit roads are more likely to be the scene of ROR crashes as compared to the low speed limit roads
810 690
190 310
0
50
100
60+ mph (N=49687) lt 60 mph (N=251554)
Pe
rce
nt
ROR OR
Figure 4 Percentage Frequency Distributions of Fatal Single-Vehicle ROR and OR Crashes by Road Posted Speed Limits (FARS 1991-2007)
9
NHTSArsquos National Center for Statistics and Analysis 1200 New Jersey Avenue SE Washington DC 20590
_______________________________________________________________________
Roadway Number of Lanes
Another factor that is worth investigating is the roadway number of lanes Figure 5 shows the percentage frequency distributions of passenger vehicles involved in fatal single-vehicle ROR and OR crashes by roadway number of lanes Four categories of roadways were considered with reference to the number of lanes one or two lanes (divided or undivided) and three or more lanes (divided or undivided) The number of lanes refers to the number of lanes of a continuous cross-section of roadway For example a local roadway with one lane going north and one lane going south would be coded as two lanes However if a trafficway is a divided highway with two lanes going north a median and two lanes going south then the number of lanes is coded as two If a trafficway has two lanes going north immediately adjacent to two lanes going south one continuous cross-section of roadway then the number of lanes is coded as four
The results in Figure 5 show that among the fatal single-vehicle crashes that occurred on roadways with fewer lanes (one or two lanes) 678 percent (divided) and 766 percent (undivided) were ROR crashes while among the crashes that occurred on roads with three and more lanes 62 percent (divided) and 40 percent (undivided) were ROR crashes In contrast the occurrence of OR crashes were more frequent on roadways with three and more lanes as compared to one or more lanes both in the case of divided and undivided roadways
Statistically significant (p lt00001) difference shows that the roadways with fewer lanes (one or two lanes) are more likely to be the scene of ROR crashes as compared to the roadway with three and more lanes (divided or undivided) The roadway design or rehabilitation strategy such as building more lanes is likely to reduce ROR crashes 8
400 620 678 766
600 380 326 234
0
50
100
One or Tw o Lanes Divided
(N=53563)
One or Tw o Lanes Undivided (N=191462)
Three and More Lanes Divided
(N=35615)
Three and More Lanes Undivided
(N=18395)
Pe
rce
nt
ROR OR
Figure 5 Percentage Frequency Distributions of Fatal Single-Vehicle ROR and OR Crashes by Roadway Number of Lanes (FARS 1991-2007)
10
NHTSArsquos National Center for Statistics and Analysis 1200 New Jersey Avenue SE Washington DC 20590
_______________________________________________________________________
312 Weather Conditions
To investigate if certain weather conditions contribute to the occurrence of ROR crashes the percentage frequency distributions of passenger vehicles involved in fatal single-vehicle ROR and OR crashes by weather conditions were obtained Two weather conditions were considered for this purpose adverse (rain sleet snow fog fog and others - smog smoke blowing sand or dust) and good weather conditions (normal or clear) The results are presented in Figure 6
Among fatal single-vehicle crashes that occurred during adverse weather conditions 755 percent were ROR crashes while among crashes that occurred during good weather conditions 70 percent were ROR crashes On the other hand OR crashes were more frequent in good weather conditions
The significant difference between the two percentages (p lt00001) shows that ROR crashes are more likely to occur in adverse weather conditions as compared to good weather conditions Improving roadway design (eg providing skid-resistant pavement surfaces) could reduce the likelihood of ROR crashes
755 700
245 300
0
50
100
Adverse Weather (N=34152) Good Weather (N=273242)
Pe
rce
nt
ROR OR
Figure 6 Percentage Frequency Distributions of Fatal Single-Vehicle ROR and OR Crashes by Weather Conditions (FARS 1991-2007)
11
NHTSArsquos National Center for Statistics and Analysis 1200 New Jersey Avenue SE Washington DC 20590
_______________________________________________________________________
ROR OR
100
50
0
Night Time (N=155199) Day Time (N=149945)
742 665
258 335
Pe
rce
nt
313 Natural Lighting Conditions
Could visibility due to natural lighting be an issue in the occurrence of ROR crashes To answer this question frequency analysis was conducted for two lighting conditions nighttime and daytime Figure 7 shows the percentage frequency distributions of passenger vehicles involved in fatal single-vehicle ROR and OR crashes by lighting conditions
Among fatal single-vehicle crashes that occurred during nighttime (8 pm ndash 559 am) 742 percent were ROR crashes while among the crashes that occurred during daytime (6 am ndash 759 pm) 665 percent were ROR crashes In contrast the occurrence of OR crashes are more frequent during day time
A χ2 test confirms that the difference between two percentages is statistically significant (p lt00001) This shows that the night time driving is more likely to result into ROR crashes as compared to the day time period Reduced lighting like adverse weather is associated with a significant increase in the likelihood of single-vehicle ROR crashes
Figure 7 Percentage Frequency Distributions of Fatal Single-Vehicle ROR and OR Crashes by Lighting Conditions (FARS 1991-2007)
12
NHTSArsquos National Center for Statistics and Analysis 1200 New Jersey Avenue SE Washington DC 20590
_______________________________________________________________________
ROR OR
680 748
320 252
0
50
100
Pe
rce
nt
One Occupant (Driver Alone) Two or More Occupants (N=183611) (N=125559)
32 Occupant-Related Factors
The occupant-related factors examined in the study include vehicle occupancy driverrsquos gender age alcohol use and driver performance-related factors such as sleep inattention over-correction of the vehicle etc
321 Occupancy
It is of interest to see if the occupancy of a vehicle makes a difference in the occurrence of ROR crashes Figure 8 shows the percentage frequency distributions of passenger vehicles involved in fatal single-vehicle ROR and OR crashes by vehicle occupancy
Among fatal single-vehicle crashes involving a vehicle with only one occupant (driver alone) 680 percent were ROR crashes while among crashes involving a vehicle with two or more occupants 748 percent were ROR crashes A χ2 test confirms the difference between these two percentages to be statistically significant (p lt00001)
This shows that vehicles with high occupancy (two or more occupants) are more likely to be involved in ROR crashes as compared to a vehicle with the driver alone The reason for this is not immediately clear However a possible explanation could be the fact that the presence of other occupants in the vehicle is a likely source of distraction to the driver due to conversation and other activities 12
Figure 8 Percentage Frequency Distributions of Fatal Single-Vehicle ROR and OR Crashes by Vehicle Occupancy (FARS 1991-2007)
13
NHTSArsquos National Center for Statistics and Analysis 1200 New Jersey Avenue SE Washington DC 20590
_______________________________________________________________________
722 665
278 335
ROR OR
100
50
0
Male Driver (N=230416) Female Driver (N=78754)
Pe
rce
nt
322 Driverrsquos Gender
Among many driver-related factors driver gender that could possibly contribute to the occurrence of ROR crashes was studied Figure 9 shows the percentage frequency distributions of passenger vehicles involved in fatal single-vehicle ROR and OR crashes by driverrsquos gender
Among fatal single-vehicle crashes involving male drivers 722 percent were ROR crashes while 665 percent crashes involving female drivers were ROR crashes In contrast the occurrence of OR crashes are more frequent for female drivers A χ2 test shows that the difference between the two percentages is statistically significant (p lt00001)
Thus one could infer that vehicles with the male drivers are more likely to be involved in ROR crashes as compared to the vehicles with the female drivers
Figure 9 Percentage Frequency Distributions of Fatal Single-Vehicle ROR and OR Crashes by Driverrsquos Gender (FARS 1991-2007)
14
NHTSArsquos National Center for Statistics and Analysis 1200 New Jersey Avenue SE Washington DC 20590
_______________________________________________________________________
323 Driverrsquos Age
To look into driver age as a contributing factor in ROR crashes four age groups were considered 15 to 24 25 to 44 45 to 64 and 65 and older Figure 10 shows the percentage frequency distributions of passenger vehicles involved in fatal single-vehicle ROR and OR crashes by these age groups
Among fatal single-vehicle crashes involving young drivers 15 to 24 a higher percentage (752 percent) were of ROR crashes as compared to other age groups This shows that vehicles with young drivers 15 to 24 are more likely to be involved in ROR crashes as compared to other three age groups
727 664 752 686
273 336 248 314
0
50
100
15-24 (N=102962)
25-44 (N=121728)
45-64 (N=55303)
65+ (N=27195)
Pe
rce
nt
ROR OR
Figure 10 Percentage Frequency Distributions of Fatal Single-Vehicle ROR and OR Crashes by Driverrsquos Age (FARS 1991-2007)
15
NHTSArsquos National Center for Statistics and Analysis 1200 New Jersey Avenue SE Washington DC 20590
_______________________________________________________________________
583 865
417 135
0
50
100
BAC=0 (N=172537) BAC=001+ (N=136633)
Pe
rce
nt
ROR OR
Figure 11 Percentage Frequency Distributions of Fatal Single-Vehicle ROR and OR Crashes by Driverrsquos Alcohol Use (FARS 1991-2007)
324 Alcohol-Related Driving
Alcohol involvement of a driver often leads to safety issues such as loss of vehicle control that may result into a ROR crash Two categories of drivers sober (BAC=0) and alcohol involved (BAC=01+) were considered in the analysis to see if alcohol use contributes to ROR crashes Figure 11 shows the percentage frequency distributions of passenger vehicles involved in fatal single-vehicle ROR and OR crashes by driverrsquos alcohol use
Among fatal single-vehicle crashes involving drivers with alcohol use (BAC=01+) 865 percent were ROR crashes while among those drivers with no alcohol (BAC=0) 583 percent were ROR crashes The difference between these two percentages is statistically significant (p lt00001) This indicates that the drivers with alcohol use are more likely to be involved in ROR crashes as compared to sober drivers
16
NHTSArsquos National Center for Statistics and Analysis 1200 New Jersey Avenue SE Washington DC 20590
_______________________________________________________________________
325 Driver-Performance-Related Factors
Some of the driver performance-related factors that are likely to contribute to the occurrence of ROR crashes were also examined
These include (1) sleepy (drowsy asleep fatigued and sleepy) (2) inattentive (talking eating etc) (3) over-correcting of the vehicle (4) avoiding (avoiding swerving or sliding due to severe crosswind tire blow-out or flat live animals in road vehicle in road etc) (5) distractions inside vehicles (cellular telephone computer fax machine etc) and (6) other driver-performance-related factors such as mentally challenged following improperly failure to signal intensions etc
Figure 12 shows the percentage frequency distributions of passenger vehicles involved in fatal single-vehicle ROR and OR crashes based on the driver performance-related factors The statistics show that the percentages of sleepy (912) inattentive (754) over correction of the vehicle (856) and crash avoiding (798) drivers involved in fatal single-vehicle ROR crashes are significantly greater (p lt00001) than the drivers with lsquoOther driver performance-related factorsrsquo that account for 67 percent of ROR crashes
This means that drivers with these performance-related factors (sleepy inattentive over correction avoiding etc) are more likely to be involved in ROR crashes as compared to drivers with other performance-related factors These results are consistent with those obtained from other studies using different approaches and other crash databases 2-11
17
NHTSArsquos National Center for Statistics and Analysis 1200 New Jersey Avenue SE Washington DC 20590
_______________________________________________________________________
672 671 798 856 754 912
328 329 202 144 246 88
0
20
40
60
80
100
Sleepy (N=14774)
Inattention (N=28081)
Overcorrect (N=19289)
Avoiding (N=14145)
Possible Distraction (N=1429)
Others (N=227587)
Per
cen
t
ROR OR
Figure 12 Percentage Frequency Distributions of Fatal Single-Vehicle ROR and OR Crashes by Driver Performance-Related Factors (FARS 1991-2007)
18
NHTSArsquos National Center for Statistics and Analysis 1200 New Jersey Avenue SE Washington DC 20590
_______________________________________________________________________
33 Vehicle-Related Factors
It is generally believed that ROR crashes are likely to occur due to some vehicle-related factors such as vehicle speeding or vehicle type
331 Vehicle Speeding Status
A crash is considered speeding-related if any driver involved in the crash is charged with a speeding-related offense or if a police officer indicates that racing driving too fast for the conditions or exceeding the posted speed limit was a related factor in the crash 13
Figure 13 shows the percentage frequency distributions of passenger vehicles involved in fatal single-vehicle ROR and OR crashes by vehicle speeding status
Among fatal single-vehicle crashes that involved a speeding vehicle 90 percent were ROR crashes while among crashes that did not involve a speeding vehicle 595 percent were ROR crashes A χ2 test shows that the difference between two percentages is statistically significant (p lt00001) thereby showing that speeding vehicles are more likely to be involved in ROR crashes as compared to non-speeding vehicles
900 595
100 405
0
50
100
Speeding (N=113825) Non-Speeding (N=195345)
Pe
rce
nt
ROR OR
Figure 13 Percentage Frequency Distributions of Fatal Single-Vehicle ROR and OR Crashes by Vehicle Speeding Status (FARS 1991-2007)
19
NHTSArsquos National Center for Statistics and Analysis 1200 New Jersey Avenue SE Washington DC 20590
_______________________________________________________________________
500 520 600 670 730 710
500 480 400 330 270 290
00
200
400
600
800
1000
Passenger Car
(N=178430)
LT Pickup
(N=72065)
LT Utility
(N=38970)
LT MiniVan
(N=11159)
LT Other Van (N=7904)
LT Others (N=642)
Pe
rce
nt
ROR OR
Figure 14 shows the percentage frequency distributions of passenger vehicles involved in fatal single-vehicle ROR and OR crashes by passenger vehicle type passenger car light truck (LT) including pickup utility minivan other van and other light trucks) It shows that passenger cars are more likely to be involved in ROR crashes as compared to other passenger vehicle types Minivans (60) are more likely to be involved in ROR crashes (p lt00001) as compared to other vans (52)
332 Vehicle Type
Figure 14 Percentage Frequency Distributions of Fatal Single-Vehicle ROR and OR Crashes by Vehicle Type (FARS 1991-2007)
20
NHTSArsquos National Center for Statistics and Analysis 1200 New Jersey Avenue SE Washington DC 20590
_______________________________________________________________________
4 Logistic Regression
The analysis in the previous sections shows that factors such as driver sleepiness alcohol use vehicle speeding curved roadway rural roads etc are significant contributors to the occurrence of fatal single-vehicle ROR crashes It remains to assess their relative influence as well as estimate the amount of risk each carries in the occurrence of such crashes Logistic regression was used for this purpose This is a modeling procedure that predicts the probability (p) of occurrence of an event (fatal single-vehicle ROR crash in the present case) as a consequence of certain roadway- driver- environment- and vehicle-related factors such as sleepy alcohol use weather condition lighting condition speeding status road function etc Generally the logistic regression model provides log of odds as a function of the predictors
Log (odds) = a0 + a1timesdriver performance-related factor + a2timesalcohol use + a3timesspeeding status + a4timesweather condition + a5timeslighting conditionhellip + aktimesspeeding statustimesweather condition + ak+1timesspeeding statustimesdriverrsquos age +helliphellip
where a0 is the intercept and a1 a2 a3 helliphellip ak ak+1 helliphellip are the regression coefficients
As in the previous analysis FARS data was used in the modeling procedure Since in FARS driverrsquos alcohol involvement is estimated by Multiple Imputation (MI) 16 17
procedure the SAS MIANALYZE procedure was used in this study to perform the analysis of the MI data generated from the logistic regression18
21
NHTSArsquos National Center for Statistics and Analysis 1200 New Jersey Avenue SE Washington DC 20590
_______________________________________________________________________
41 Logistic Regression Results and Interpretation
Of all the variables considered in the logistic regression only 10 showed up as significant predictors (95 confidence level) As regards the interaction effect of these factors only the interaction of speeding with other variables was considered However only three of these interactions emerged as significant (95 confidence level) The results in Table 1 present estimates of regression coefficients and the corresponding odds ratio only for significant main effects and interactions Since the independent variables (predictors) are dichotomous the influence of the corresponding factors can be compared simply by comparing their regression coefficients
The ordered (decreasing) estimates of regression coefficients in Table 1 show that the most influential factor in the occurrence of fatal single-vehicle ROR crashes is the driver performance-related factor sleepy followed by alcohol use roadway alignment with curve speeding passenger car rural roadway number of lanes high-speed-limit road adverse weather and avoiding With regard to the interaction effect of speeding with other factors speeding with drivers of age groups 15 to 24 and 25 to 44 as well as speeding under adverse weather are significant contributors to the likelihood of ROR crashes
Table 1 Multiple Imputation Parameter Estimates Dagger
Variables Estimate Odds Ratio Driver performance-related factor sleepy vs others 11675 Dagger 321 Driver with alcohol BAC=01+ gdL vs BAC=0 06605 Dagger 194 Road alignment curve vs straight 05535 Dagger 174 Vehicle speeding status speeding vs non-speeding 04966 Dagger 164 Vehicle type passenger car vs other LTs 04780 Dagger 161 Road function rural vs urban 03637 Dagger 144 Roadway of lanes one or two (undivided) vs three amp more (undivided) 03346 Dagger 141 Road speed limit ge 60 mph vs lt60 mph 02659 Dagger 130 Weather adverse vs good 02130 Dagger 124 Driver performance-related factor avoiding vs others 02007 Dagger 122 Weather timesSpeeding status adverse amp speeding vs good amp non-speeding 01056 Dagger 111 Driver Age times Speeding status 25-44 amp speeding vs 65+ amp non-speeding 01003 Dagger 111 Driver Age times Speeding status 15-24 amp speeding vs 65+ amp non-speeding 00578 Dagger 106
Statistically significant variables (α = 005) associated with the high risk (odds ratio gt100) Other variables with low risk (odds ratio lt100) or insignificance (pgt005) after jointly estimating the effect are not shown here Dagger p-value lt00001
One of the most important by-product of logistic regression is the estimate of odds ratio that tells a great deal about the risk a certain factor carries in contributing to the occurrence of ROR crashes Specifically odds ratio measures the magnitude of increase in odds of happening of an event as a result of a unit increase in a predictor (eg sober and alcohol-used driver) An odds ratio value of 1 is indicative of no influence Table 1 also shows odds ratio estimates of significant factors and interactions
22
NHTSArsquos National Center for Statistics and Analysis 1200 New Jersey Avenue SE Washington DC 20590
_______________________________________________________________________
1
250 226
o 200
ita 164
Rd
s 150
d 124
O 100 100
050
Non-Speeding+Good Weather Non-Speeding+Adverse Weather
Speeding+Good Weather Speeding+Adverse Weather
Figure 15 Odds Ratio by Speeding Status and Weather Conditions
The odds ratio 321 for the factor ldquodriver performance-related factorrdquo shows that the odds of being involved in an ROR crash for a sleepy driver are three times as large as that for the driver who is not sleepy
The odds ratio 194 for the factor ldquodriver with alcoholrdquo shows that the odds of being involved in an ROR crash for an alcohol used driver (BAC=01+ gdL) are almost two times as large as that for a sober driver (BAC=0)
The odds ratio 174 for the factor ldquoroad alignmentrdquo shows that the odds of being involved in an ROR crash on curved roadways are 174 times as large as that on straight roadways in fatal single-vehicle crashes
The odds ratio 164 for the factor ldquovehicle speeding statusrdquo shows that the odds of being involved in an ROR crash for speeding vehicles are 164 times as large as that for non-speeding vehicles
The odds ratio 161 for the factor ldquovehicle typerdquo shows that the odds of being involved in an ROR crash for passenger cars are 161 times as large as that for other LTs
The odds ratio 144 for the factor ldquoroad functionrdquo shows that the odds of being involved in an ROR crash on rural roadways are 144 times as large as that on urban roadways
The odds ratio 266 for the factor ldquoweather amp speeding statusrdquo shows that the odds of being involved in an ROR crash under the adverse weather and in speeding vehicle are 266 (=164times124times111) times as large as that under the good weather and in non-speeding vehicle (Figure 15)
23
NHTSArsquos National Center for Statistics and Analysis 1200 New Jersey Avenue SE Washington DC 20590
_______________________________________________________________________
5 Conclusions
Run-off-road crashes account for a significant percentage (around 70) of all fatal single-vehicle crashes FARS data (1991 to 2007) that includes detailed information about ROR crashes provided sufficient statistical evidence to conclude that certain roadway- driver- environment- and vehicle-related factors closely associated with the occurrence of these crashes Appropriate crash countermeasures based on the identified factors can reduce the occurrence of single-vehicle ROR crashes and hence of the fatalities
Curved road segments rural roads high-speed-limit roadways and roadways with fewer lanes (divided or undivided) are found to be more likely to be the scene of fatal single-vehicle ROR crashes as compared to the fatal single-vehicle OR crashes Similarly among environmental factors adverse weather and night time periods are the factors associated with high risk of fatal single-vehicle ROR crashes
Vehicles with high occupancy (two and more occupants) male driver younger driver and alcohol used by driver are more likely to be involved in fatal single-vehicle ROR crashes as compared to the fatal single-vehicle OR crashes Drivers with performance-related factors (sleepy inattentive over-correction avoiding etc) are more likely to be involved in the fatal single-vehicle ROR crashes Speeding vehicles and passenger cars are also associated with high risks of the fatal single-vehicle ROR crashes
In the adverse weather condition and for the younger drivers (15 to 24 and 25 to 44) the speeding vehicle would increase the risk of fatal single-vehicle ROR crashes by an additional factor
The above facts based on statistical evidence suggest several crash countermeasures For example improving roadway design such as flattening curves and installing shoulder rumble strips or rehabilitation strategies such as building wide lanes or adding additional unpaved shoulder width on entire system providing skid-resistant pavement surfaces could reduce the likelihood of ROR crashes
24
NHTSArsquos National Center for Statistics and Analysis 1200 New Jersey Avenue SE Washington DC 20590
_______________________________________________________________________
6 References
1 FHWA (Undated) Reducing Highway Fatalities Washington DC Federal Highway Administration httpsafetyfhwadotgovroadway5Fdept
2 Neuman T RPfefer R Slack K L Council F McGee H Prothe L amp Eccles K (1998) Guidance for Implementation of the AASHTO Strategic Highway Safety Plan Report 500 Volume 6 A Guide for Addressing Run-Off Road Collisions Washington DC Transportation Research Board Available at httponlinepubstrborgonlinepubsnchrpnchrp_rpt_500v6pdf
3 Spainhour L K amp Mishra A (2007) Analysis of Fatal Run-off-the-Road Crashes Involving Overcorrection TRB 87th Annual Meeting Paper No 08-0661 Washington DC Transportation Research Board
4 McGee H W amp Hanscom F R Low-Cost Treatments for Horizontal Curve Safety FHWA-SA-07-002 December 2006
5 Johnston I Corben B TriggsT Candappa N amp Lenneacute M Reducing Serious Injury and Death from Run-off-Road Crashes in Victoria ndash Turning Knowledge into Action (2006 June) RACV Research Report Victoria Australia Royal Automobile Club of Victoria Ltd
6 Dissanayake S (2003 August) Young Drivers and Run-Off-the-Road Crashes Proceedings of the 2003 Mid-Continent Transportation Research Symposium Ames Iowa
7 Knapp K K Giese K L amp Lee W (2003 August) Urban Four-Lane Undivided to Three-Lane Roadway Conversion Guidelines Proceedings of the 2003 Mid-Continent Transportation Research Symposium Ames Iowa
8 Őrnek E amp Drakopoulos A (2007 August) Analysis of Run-Off-Road Crashes in Relation to Roadway Features and Driver Behavior Proceedings of the 2007 Mid-Continent Transportation Research Symposium Ames Iowa
9 Ray M H amp McGinnis R G (1997) Guardrail and Median Barrier Crashworthiness A Synthesis of Highway Practice NCHRP Synthesis 244 Washington DC Transportation Research Board National Research Council
10 Roadside Design Guide (2006) 3rd Edition Washington DC American Association of State Highway and Transportation Officials
25
NHTSArsquos National Center for Statistics and Analysis 1200 New Jersey Avenue SE Washington DC 20590
_______________________________________________________________________
11 Elvik R (1995) The Safety Value of Guardrails and Crash Cushions A Meta-Analysis of Evidence from Evaluation Studies Accident Analysis and Prevention 27 (4)
12 Stutts J C Reinfurth D W Staplin L amp Rodgman EA (2001 May) The Role of Driver Distraction in Traffic Crashes Washington DC AAA Foundation for Traffic Safety
13 Liu C Chen C-L Subramanian R amp Utter D (2005 June) Analysis of Speeding-Related Fatal Motor Vehicle Traffic Crashes NHTSA Technical Report DOT HS 809 839 Washington DC National Highway Traffic Safety Administration
14 Hosmer Jr D W and Lemeshow S (1989) Applied Logistic Regression New York John Wiley amp Sons Inc
15 SAS Institute Inc (1995) Logistic Regression Examples using SAS system Cary NC SAS Institute Inc
16 Rubin D B Schafer J L amp Subramanian R (1998 October) Multiple Imputation of Missing Blood Alcohol Concentration (BAC) Values in FARS NHTSA Technical Report DOT HS 808 816 Washington DC National Highway Traffic Safety Administration
17 Subramanian R (2005 March) Alcohol Involvement in Fatal Motor Vehicle Traffic Crashes NHTSA Technical Report DOT HS 809 822 Washington DC National Highway Traffic Safety Administration
18 SASSTAT Userrsquos Guide Version 8 1999 Cary NC SAS Institute Inc
26
NHTSArsquos National Center for Statistics and Analysis 1200 New Jersey Avenue SE Washington DC 20590
DOT HS 811 232November 2009
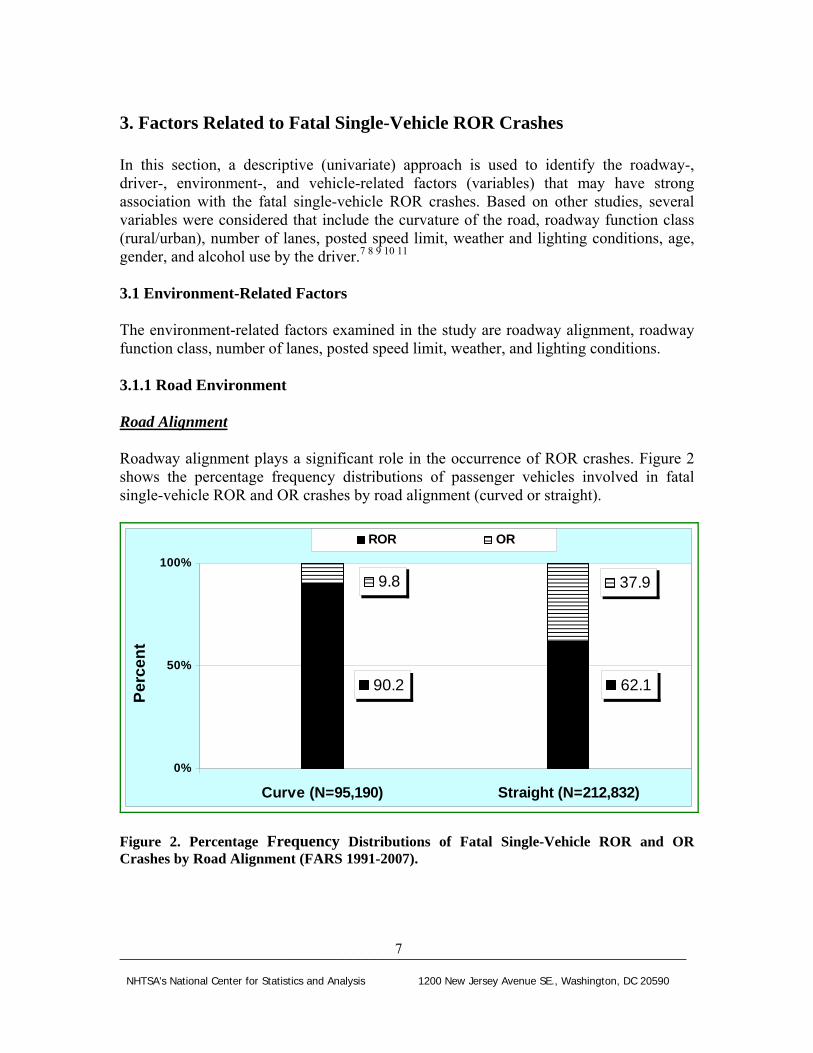
_______________________________________________________________________
3 Factors Related to Fatal Single-Vehicle ROR Crashes
In this section a descriptive (univariate) approach is used to identify the roadway- driver- environment- and vehicle-related factors (variables) that may have strong association with the fatal single-vehicle ROR crashes Based on other studies several variables were considered that include the curvature of the road roadway function class (ruralurban) number of lanes posted speed limit weather and lighting conditions age gender and alcohol use by the driver7 8 9 10 11
31 Environment-Related Factors
The environment-related factors examined in the study are roadway alignment roadway function class number of lanes posted speed limit weather and lighting conditions
311 Road Environment
Road Alignment
Roadway alignment plays a significant role in the occurrence of ROR crashes Figure 2 shows the percentage frequency distributions of passenger vehicles involved in fatal single-vehicle ROR and OR crashes by road alignment (curved or straight)
902 621
98 379
0
50
100
Curve (N=95190) Straight (N=212832)
Pe
rce
nt
ROR OR
Figure 2 Percentage Frequency Distributions of Fatal Single-Vehicle ROR and OR Crashes by Road Alignment (FARS 1991-2007)
7
NHTSArsquos National Center for Statistics and Analysis 1200 New Jersey Avenue SE Washington DC 20590
_______________________________________________________________________
The statistics show that among all fatal single-vehicle crashes that occurred on the curved roads 902 percent were ROR crashes while among crashes that occurred on straight roadways 621 percent were ROR crashes In contrast the occurrence of OR crashes are more frequent on straight roadways A χ2 test shows that the difference between two percentages is statistically significant (p lt00001) thereby indicating that the curved road segments are more likely to be the scene of ROR crashes as compared to the straight roadways Improving roadway design (eg flattening curves signing or the more general curve delineation) could reduce the likelihood of ROR crashes
Roadway Function Class
It is also of interest to see if the roadway function class makes a difference in the occurrence of ROR crashes Figure 3 shows the percentage frequency distributions of passenger vehicles involved in fatal single-vehicle ROR and OR crashes by roadway function (rural or urban)
In fatal single-vehicle crashes among those that occurred on rural roads 806 percent were ROR crashes while among those that occurred on urban roadways 562 percent were ROR crashes In contrast the occurrence of OR crashes were more frequent on urban roadways A χ2 test shows that the difference between two percentages of ROR crashes is statistically significant (p lt00001) This shows that the rural roads are more likely to be the scene of ROR crashes as compared to the urban roads
806 562
194 438
0
50
100
Rural (N=183363) Urban (N=124248)
Pe
rce
nt
ROR OR
Figure 3 Percentage Frequency Distributions of Fatal Single-Vehicle ROR and OR Crashes by Roadway Function (FARS 1991-2007)
8
NHTSArsquos National Center for Statistics and Analysis 1200 New Jersey Avenue SE Washington DC 20590
_______________________________________________________________________
Road Posted Speed Limit
In most cases the actual vehiclersquos pre-crash travel speed is unknown In this analysis the posted speed limit was used as a proxy to a vehiclersquos travel speed Figure 4 shows the percentage frequency distributions of passenger vehicles involved in fatal single-vehicle ROR and OR crashes by posted speed limits (lt 60 mph and 60+ mph)
Among fatal single-vehicle crashes that occurred on roadways with posted speed limits of 60 mph and above 81 percent were ROR crashes while among the crashes that occurred on roadways with posted speed limits less than 60 mph 69 percent were ROR crashes A χ2 test shows that the difference between these two percentages is statistically significant (p lt00001) This in turn shows that the high speed limit roads are more likely to be the scene of ROR crashes as compared to the low speed limit roads
810 690
190 310
0
50
100
60+ mph (N=49687) lt 60 mph (N=251554)
Pe
rce
nt
ROR OR
Figure 4 Percentage Frequency Distributions of Fatal Single-Vehicle ROR and OR Crashes by Road Posted Speed Limits (FARS 1991-2007)
9
NHTSArsquos National Center for Statistics and Analysis 1200 New Jersey Avenue SE Washington DC 20590
_______________________________________________________________________
Roadway Number of Lanes
Another factor that is worth investigating is the roadway number of lanes Figure 5 shows the percentage frequency distributions of passenger vehicles involved in fatal single-vehicle ROR and OR crashes by roadway number of lanes Four categories of roadways were considered with reference to the number of lanes one or two lanes (divided or undivided) and three or more lanes (divided or undivided) The number of lanes refers to the number of lanes of a continuous cross-section of roadway For example a local roadway with one lane going north and one lane going south would be coded as two lanes However if a trafficway is a divided highway with two lanes going north a median and two lanes going south then the number of lanes is coded as two If a trafficway has two lanes going north immediately adjacent to two lanes going south one continuous cross-section of roadway then the number of lanes is coded as four
The results in Figure 5 show that among the fatal single-vehicle crashes that occurred on roadways with fewer lanes (one or two lanes) 678 percent (divided) and 766 percent (undivided) were ROR crashes while among the crashes that occurred on roads with three and more lanes 62 percent (divided) and 40 percent (undivided) were ROR crashes In contrast the occurrence of OR crashes were more frequent on roadways with three and more lanes as compared to one or more lanes both in the case of divided and undivided roadways
Statistically significant (p lt00001) difference shows that the roadways with fewer lanes (one or two lanes) are more likely to be the scene of ROR crashes as compared to the roadway with three and more lanes (divided or undivided) The roadway design or rehabilitation strategy such as building more lanes is likely to reduce ROR crashes 8
400 620 678 766
600 380 326 234
0
50
100
One or Tw o Lanes Divided
(N=53563)
One or Tw o Lanes Undivided (N=191462)
Three and More Lanes Divided
(N=35615)
Three and More Lanes Undivided
(N=18395)
Pe
rce
nt
ROR OR
Figure 5 Percentage Frequency Distributions of Fatal Single-Vehicle ROR and OR Crashes by Roadway Number of Lanes (FARS 1991-2007)
10
NHTSArsquos National Center for Statistics and Analysis 1200 New Jersey Avenue SE Washington DC 20590
_______________________________________________________________________
312 Weather Conditions
To investigate if certain weather conditions contribute to the occurrence of ROR crashes the percentage frequency distributions of passenger vehicles involved in fatal single-vehicle ROR and OR crashes by weather conditions were obtained Two weather conditions were considered for this purpose adverse (rain sleet snow fog fog and others - smog smoke blowing sand or dust) and good weather conditions (normal or clear) The results are presented in Figure 6
Among fatal single-vehicle crashes that occurred during adverse weather conditions 755 percent were ROR crashes while among crashes that occurred during good weather conditions 70 percent were ROR crashes On the other hand OR crashes were more frequent in good weather conditions
The significant difference between the two percentages (p lt00001) shows that ROR crashes are more likely to occur in adverse weather conditions as compared to good weather conditions Improving roadway design (eg providing skid-resistant pavement surfaces) could reduce the likelihood of ROR crashes
755 700
245 300
0
50
100
Adverse Weather (N=34152) Good Weather (N=273242)
Pe
rce
nt
ROR OR
Figure 6 Percentage Frequency Distributions of Fatal Single-Vehicle ROR and OR Crashes by Weather Conditions (FARS 1991-2007)
11
NHTSArsquos National Center for Statistics and Analysis 1200 New Jersey Avenue SE Washington DC 20590
_______________________________________________________________________
ROR OR
100
50
0
Night Time (N=155199) Day Time (N=149945)
742 665
258 335
Pe
rce
nt
313 Natural Lighting Conditions
Could visibility due to natural lighting be an issue in the occurrence of ROR crashes To answer this question frequency analysis was conducted for two lighting conditions nighttime and daytime Figure 7 shows the percentage frequency distributions of passenger vehicles involved in fatal single-vehicle ROR and OR crashes by lighting conditions
Among fatal single-vehicle crashes that occurred during nighttime (8 pm ndash 559 am) 742 percent were ROR crashes while among the crashes that occurred during daytime (6 am ndash 759 pm) 665 percent were ROR crashes In contrast the occurrence of OR crashes are more frequent during day time
A χ2 test confirms that the difference between two percentages is statistically significant (p lt00001) This shows that the night time driving is more likely to result into ROR crashes as compared to the day time period Reduced lighting like adverse weather is associated with a significant increase in the likelihood of single-vehicle ROR crashes
Figure 7 Percentage Frequency Distributions of Fatal Single-Vehicle ROR and OR Crashes by Lighting Conditions (FARS 1991-2007)
12
NHTSArsquos National Center for Statistics and Analysis 1200 New Jersey Avenue SE Washington DC 20590
_______________________________________________________________________
ROR OR
680 748
320 252
0
50
100
Pe
rce
nt
One Occupant (Driver Alone) Two or More Occupants (N=183611) (N=125559)
32 Occupant-Related Factors
The occupant-related factors examined in the study include vehicle occupancy driverrsquos gender age alcohol use and driver performance-related factors such as sleep inattention over-correction of the vehicle etc
321 Occupancy
It is of interest to see if the occupancy of a vehicle makes a difference in the occurrence of ROR crashes Figure 8 shows the percentage frequency distributions of passenger vehicles involved in fatal single-vehicle ROR and OR crashes by vehicle occupancy
Among fatal single-vehicle crashes involving a vehicle with only one occupant (driver alone) 680 percent were ROR crashes while among crashes involving a vehicle with two or more occupants 748 percent were ROR crashes A χ2 test confirms the difference between these two percentages to be statistically significant (p lt00001)
This shows that vehicles with high occupancy (two or more occupants) are more likely to be involved in ROR crashes as compared to a vehicle with the driver alone The reason for this is not immediately clear However a possible explanation could be the fact that the presence of other occupants in the vehicle is a likely source of distraction to the driver due to conversation and other activities 12
Figure 8 Percentage Frequency Distributions of Fatal Single-Vehicle ROR and OR Crashes by Vehicle Occupancy (FARS 1991-2007)
13
NHTSArsquos National Center for Statistics and Analysis 1200 New Jersey Avenue SE Washington DC 20590
_______________________________________________________________________
722 665
278 335
ROR OR
100
50
0
Male Driver (N=230416) Female Driver (N=78754)
Pe
rce
nt
322 Driverrsquos Gender
Among many driver-related factors driver gender that could possibly contribute to the occurrence of ROR crashes was studied Figure 9 shows the percentage frequency distributions of passenger vehicles involved in fatal single-vehicle ROR and OR crashes by driverrsquos gender
Among fatal single-vehicle crashes involving male drivers 722 percent were ROR crashes while 665 percent crashes involving female drivers were ROR crashes In contrast the occurrence of OR crashes are more frequent for female drivers A χ2 test shows that the difference between the two percentages is statistically significant (p lt00001)
Thus one could infer that vehicles with the male drivers are more likely to be involved in ROR crashes as compared to the vehicles with the female drivers
Figure 9 Percentage Frequency Distributions of Fatal Single-Vehicle ROR and OR Crashes by Driverrsquos Gender (FARS 1991-2007)
14
NHTSArsquos National Center for Statistics and Analysis 1200 New Jersey Avenue SE Washington DC 20590
_______________________________________________________________________
323 Driverrsquos Age
To look into driver age as a contributing factor in ROR crashes four age groups were considered 15 to 24 25 to 44 45 to 64 and 65 and older Figure 10 shows the percentage frequency distributions of passenger vehicles involved in fatal single-vehicle ROR and OR crashes by these age groups
Among fatal single-vehicle crashes involving young drivers 15 to 24 a higher percentage (752 percent) were of ROR crashes as compared to other age groups This shows that vehicles with young drivers 15 to 24 are more likely to be involved in ROR crashes as compared to other three age groups
727 664 752 686
273 336 248 314
0
50
100
15-24 (N=102962)
25-44 (N=121728)
45-64 (N=55303)
65+ (N=27195)
Pe
rce
nt
ROR OR
Figure 10 Percentage Frequency Distributions of Fatal Single-Vehicle ROR and OR Crashes by Driverrsquos Age (FARS 1991-2007)
15
NHTSArsquos National Center for Statistics and Analysis 1200 New Jersey Avenue SE Washington DC 20590
_______________________________________________________________________
583 865
417 135
0
50
100
BAC=0 (N=172537) BAC=001+ (N=136633)
Pe
rce
nt
ROR OR
Figure 11 Percentage Frequency Distributions of Fatal Single-Vehicle ROR and OR Crashes by Driverrsquos Alcohol Use (FARS 1991-2007)
324 Alcohol-Related Driving
Alcohol involvement of a driver often leads to safety issues such as loss of vehicle control that may result into a ROR crash Two categories of drivers sober (BAC=0) and alcohol involved (BAC=01+) were considered in the analysis to see if alcohol use contributes to ROR crashes Figure 11 shows the percentage frequency distributions of passenger vehicles involved in fatal single-vehicle ROR and OR crashes by driverrsquos alcohol use
Among fatal single-vehicle crashes involving drivers with alcohol use (BAC=01+) 865 percent were ROR crashes while among those drivers with no alcohol (BAC=0) 583 percent were ROR crashes The difference between these two percentages is statistically significant (p lt00001) This indicates that the drivers with alcohol use are more likely to be involved in ROR crashes as compared to sober drivers
16
NHTSArsquos National Center for Statistics and Analysis 1200 New Jersey Avenue SE Washington DC 20590
_______________________________________________________________________
325 Driver-Performance-Related Factors
Some of the driver performance-related factors that are likely to contribute to the occurrence of ROR crashes were also examined
These include (1) sleepy (drowsy asleep fatigued and sleepy) (2) inattentive (talking eating etc) (3) over-correcting of the vehicle (4) avoiding (avoiding swerving or sliding due to severe crosswind tire blow-out or flat live animals in road vehicle in road etc) (5) distractions inside vehicles (cellular telephone computer fax machine etc) and (6) other driver-performance-related factors such as mentally challenged following improperly failure to signal intensions etc
Figure 12 shows the percentage frequency distributions of passenger vehicles involved in fatal single-vehicle ROR and OR crashes based on the driver performance-related factors The statistics show that the percentages of sleepy (912) inattentive (754) over correction of the vehicle (856) and crash avoiding (798) drivers involved in fatal single-vehicle ROR crashes are significantly greater (p lt00001) than the drivers with lsquoOther driver performance-related factorsrsquo that account for 67 percent of ROR crashes
This means that drivers with these performance-related factors (sleepy inattentive over correction avoiding etc) are more likely to be involved in ROR crashes as compared to drivers with other performance-related factors These results are consistent with those obtained from other studies using different approaches and other crash databases 2-11
17
NHTSArsquos National Center for Statistics and Analysis 1200 New Jersey Avenue SE Washington DC 20590
_______________________________________________________________________
672 671 798 856 754 912
328 329 202 144 246 88
0
20
40
60
80
100
Sleepy (N=14774)
Inattention (N=28081)
Overcorrect (N=19289)
Avoiding (N=14145)
Possible Distraction (N=1429)
Others (N=227587)
Per
cen
t
ROR OR
Figure 12 Percentage Frequency Distributions of Fatal Single-Vehicle ROR and OR Crashes by Driver Performance-Related Factors (FARS 1991-2007)
18
NHTSArsquos National Center for Statistics and Analysis 1200 New Jersey Avenue SE Washington DC 20590
_______________________________________________________________________
33 Vehicle-Related Factors
It is generally believed that ROR crashes are likely to occur due to some vehicle-related factors such as vehicle speeding or vehicle type
331 Vehicle Speeding Status
A crash is considered speeding-related if any driver involved in the crash is charged with a speeding-related offense or if a police officer indicates that racing driving too fast for the conditions or exceeding the posted speed limit was a related factor in the crash 13
Figure 13 shows the percentage frequency distributions of passenger vehicles involved in fatal single-vehicle ROR and OR crashes by vehicle speeding status
Among fatal single-vehicle crashes that involved a speeding vehicle 90 percent were ROR crashes while among crashes that did not involve a speeding vehicle 595 percent were ROR crashes A χ2 test shows that the difference between two percentages is statistically significant (p lt00001) thereby showing that speeding vehicles are more likely to be involved in ROR crashes as compared to non-speeding vehicles
900 595
100 405
0
50
100
Speeding (N=113825) Non-Speeding (N=195345)
Pe
rce
nt
ROR OR
Figure 13 Percentage Frequency Distributions of Fatal Single-Vehicle ROR and OR Crashes by Vehicle Speeding Status (FARS 1991-2007)
19
NHTSArsquos National Center for Statistics and Analysis 1200 New Jersey Avenue SE Washington DC 20590
_______________________________________________________________________
500 520 600 670 730 710
500 480 400 330 270 290
00
200
400
600
800
1000
Passenger Car
(N=178430)
LT Pickup
(N=72065)
LT Utility
(N=38970)
LT MiniVan
(N=11159)
LT Other Van (N=7904)
LT Others (N=642)
Pe
rce
nt
ROR OR
Figure 14 shows the percentage frequency distributions of passenger vehicles involved in fatal single-vehicle ROR and OR crashes by passenger vehicle type passenger car light truck (LT) including pickup utility minivan other van and other light trucks) It shows that passenger cars are more likely to be involved in ROR crashes as compared to other passenger vehicle types Minivans (60) are more likely to be involved in ROR crashes (p lt00001) as compared to other vans (52)
332 Vehicle Type
Figure 14 Percentage Frequency Distributions of Fatal Single-Vehicle ROR and OR Crashes by Vehicle Type (FARS 1991-2007)
20
NHTSArsquos National Center for Statistics and Analysis 1200 New Jersey Avenue SE Washington DC 20590
_______________________________________________________________________
4 Logistic Regression
The analysis in the previous sections shows that factors such as driver sleepiness alcohol use vehicle speeding curved roadway rural roads etc are significant contributors to the occurrence of fatal single-vehicle ROR crashes It remains to assess their relative influence as well as estimate the amount of risk each carries in the occurrence of such crashes Logistic regression was used for this purpose This is a modeling procedure that predicts the probability (p) of occurrence of an event (fatal single-vehicle ROR crash in the present case) as a consequence of certain roadway- driver- environment- and vehicle-related factors such as sleepy alcohol use weather condition lighting condition speeding status road function etc Generally the logistic regression model provides log of odds as a function of the predictors
Log (odds) = a0 + a1timesdriver performance-related factor + a2timesalcohol use + a3timesspeeding status + a4timesweather condition + a5timeslighting conditionhellip + aktimesspeeding statustimesweather condition + ak+1timesspeeding statustimesdriverrsquos age +helliphellip
where a0 is the intercept and a1 a2 a3 helliphellip ak ak+1 helliphellip are the regression coefficients
As in the previous analysis FARS data was used in the modeling procedure Since in FARS driverrsquos alcohol involvement is estimated by Multiple Imputation (MI) 16 17
procedure the SAS MIANALYZE procedure was used in this study to perform the analysis of the MI data generated from the logistic regression18
21
NHTSArsquos National Center for Statistics and Analysis 1200 New Jersey Avenue SE Washington DC 20590
_______________________________________________________________________
41 Logistic Regression Results and Interpretation
Of all the variables considered in the logistic regression only 10 showed up as significant predictors (95 confidence level) As regards the interaction effect of these factors only the interaction of speeding with other variables was considered However only three of these interactions emerged as significant (95 confidence level) The results in Table 1 present estimates of regression coefficients and the corresponding odds ratio only for significant main effects and interactions Since the independent variables (predictors) are dichotomous the influence of the corresponding factors can be compared simply by comparing their regression coefficients
The ordered (decreasing) estimates of regression coefficients in Table 1 show that the most influential factor in the occurrence of fatal single-vehicle ROR crashes is the driver performance-related factor sleepy followed by alcohol use roadway alignment with curve speeding passenger car rural roadway number of lanes high-speed-limit road adverse weather and avoiding With regard to the interaction effect of speeding with other factors speeding with drivers of age groups 15 to 24 and 25 to 44 as well as speeding under adverse weather are significant contributors to the likelihood of ROR crashes
Table 1 Multiple Imputation Parameter Estimates Dagger
Variables Estimate Odds Ratio Driver performance-related factor sleepy vs others 11675 Dagger 321 Driver with alcohol BAC=01+ gdL vs BAC=0 06605 Dagger 194 Road alignment curve vs straight 05535 Dagger 174 Vehicle speeding status speeding vs non-speeding 04966 Dagger 164 Vehicle type passenger car vs other LTs 04780 Dagger 161 Road function rural vs urban 03637 Dagger 144 Roadway of lanes one or two (undivided) vs three amp more (undivided) 03346 Dagger 141 Road speed limit ge 60 mph vs lt60 mph 02659 Dagger 130 Weather adverse vs good 02130 Dagger 124 Driver performance-related factor avoiding vs others 02007 Dagger 122 Weather timesSpeeding status adverse amp speeding vs good amp non-speeding 01056 Dagger 111 Driver Age times Speeding status 25-44 amp speeding vs 65+ amp non-speeding 01003 Dagger 111 Driver Age times Speeding status 15-24 amp speeding vs 65+ amp non-speeding 00578 Dagger 106
Statistically significant variables (α = 005) associated with the high risk (odds ratio gt100) Other variables with low risk (odds ratio lt100) or insignificance (pgt005) after jointly estimating the effect are not shown here Dagger p-value lt00001
One of the most important by-product of logistic regression is the estimate of odds ratio that tells a great deal about the risk a certain factor carries in contributing to the occurrence of ROR crashes Specifically odds ratio measures the magnitude of increase in odds of happening of an event as a result of a unit increase in a predictor (eg sober and alcohol-used driver) An odds ratio value of 1 is indicative of no influence Table 1 also shows odds ratio estimates of significant factors and interactions
22
NHTSArsquos National Center for Statistics and Analysis 1200 New Jersey Avenue SE Washington DC 20590
_______________________________________________________________________
1
250 226
o 200
ita 164
Rd
s 150
d 124
O 100 100
050
Non-Speeding+Good Weather Non-Speeding+Adverse Weather
Speeding+Good Weather Speeding+Adverse Weather
Figure 15 Odds Ratio by Speeding Status and Weather Conditions
The odds ratio 321 for the factor ldquodriver performance-related factorrdquo shows that the odds of being involved in an ROR crash for a sleepy driver are three times as large as that for the driver who is not sleepy
The odds ratio 194 for the factor ldquodriver with alcoholrdquo shows that the odds of being involved in an ROR crash for an alcohol used driver (BAC=01+ gdL) are almost two times as large as that for a sober driver (BAC=0)
The odds ratio 174 for the factor ldquoroad alignmentrdquo shows that the odds of being involved in an ROR crash on curved roadways are 174 times as large as that on straight roadways in fatal single-vehicle crashes
The odds ratio 164 for the factor ldquovehicle speeding statusrdquo shows that the odds of being involved in an ROR crash for speeding vehicles are 164 times as large as that for non-speeding vehicles
The odds ratio 161 for the factor ldquovehicle typerdquo shows that the odds of being involved in an ROR crash for passenger cars are 161 times as large as that for other LTs
The odds ratio 144 for the factor ldquoroad functionrdquo shows that the odds of being involved in an ROR crash on rural roadways are 144 times as large as that on urban roadways
The odds ratio 266 for the factor ldquoweather amp speeding statusrdquo shows that the odds of being involved in an ROR crash under the adverse weather and in speeding vehicle are 266 (=164times124times111) times as large as that under the good weather and in non-speeding vehicle (Figure 15)
23
NHTSArsquos National Center for Statistics and Analysis 1200 New Jersey Avenue SE Washington DC 20590
_______________________________________________________________________
5 Conclusions
Run-off-road crashes account for a significant percentage (around 70) of all fatal single-vehicle crashes FARS data (1991 to 2007) that includes detailed information about ROR crashes provided sufficient statistical evidence to conclude that certain roadway- driver- environment- and vehicle-related factors closely associated with the occurrence of these crashes Appropriate crash countermeasures based on the identified factors can reduce the occurrence of single-vehicle ROR crashes and hence of the fatalities
Curved road segments rural roads high-speed-limit roadways and roadways with fewer lanes (divided or undivided) are found to be more likely to be the scene of fatal single-vehicle ROR crashes as compared to the fatal single-vehicle OR crashes Similarly among environmental factors adverse weather and night time periods are the factors associated with high risk of fatal single-vehicle ROR crashes
Vehicles with high occupancy (two and more occupants) male driver younger driver and alcohol used by driver are more likely to be involved in fatal single-vehicle ROR crashes as compared to the fatal single-vehicle OR crashes Drivers with performance-related factors (sleepy inattentive over-correction avoiding etc) are more likely to be involved in the fatal single-vehicle ROR crashes Speeding vehicles and passenger cars are also associated with high risks of the fatal single-vehicle ROR crashes
In the adverse weather condition and for the younger drivers (15 to 24 and 25 to 44) the speeding vehicle would increase the risk of fatal single-vehicle ROR crashes by an additional factor
The above facts based on statistical evidence suggest several crash countermeasures For example improving roadway design such as flattening curves and installing shoulder rumble strips or rehabilitation strategies such as building wide lanes or adding additional unpaved shoulder width on entire system providing skid-resistant pavement surfaces could reduce the likelihood of ROR crashes
24
NHTSArsquos National Center for Statistics and Analysis 1200 New Jersey Avenue SE Washington DC 20590
_______________________________________________________________________
6 References
1 FHWA (Undated) Reducing Highway Fatalities Washington DC Federal Highway Administration httpsafetyfhwadotgovroadway5Fdept
2 Neuman T RPfefer R Slack K L Council F McGee H Prothe L amp Eccles K (1998) Guidance for Implementation of the AASHTO Strategic Highway Safety Plan Report 500 Volume 6 A Guide for Addressing Run-Off Road Collisions Washington DC Transportation Research Board Available at httponlinepubstrborgonlinepubsnchrpnchrp_rpt_500v6pdf
3 Spainhour L K amp Mishra A (2007) Analysis of Fatal Run-off-the-Road Crashes Involving Overcorrection TRB 87th Annual Meeting Paper No 08-0661 Washington DC Transportation Research Board
4 McGee H W amp Hanscom F R Low-Cost Treatments for Horizontal Curve Safety FHWA-SA-07-002 December 2006
5 Johnston I Corben B TriggsT Candappa N amp Lenneacute M Reducing Serious Injury and Death from Run-off-Road Crashes in Victoria ndash Turning Knowledge into Action (2006 June) RACV Research Report Victoria Australia Royal Automobile Club of Victoria Ltd
6 Dissanayake S (2003 August) Young Drivers and Run-Off-the-Road Crashes Proceedings of the 2003 Mid-Continent Transportation Research Symposium Ames Iowa
7 Knapp K K Giese K L amp Lee W (2003 August) Urban Four-Lane Undivided to Three-Lane Roadway Conversion Guidelines Proceedings of the 2003 Mid-Continent Transportation Research Symposium Ames Iowa
8 Őrnek E amp Drakopoulos A (2007 August) Analysis of Run-Off-Road Crashes in Relation to Roadway Features and Driver Behavior Proceedings of the 2007 Mid-Continent Transportation Research Symposium Ames Iowa
9 Ray M H amp McGinnis R G (1997) Guardrail and Median Barrier Crashworthiness A Synthesis of Highway Practice NCHRP Synthesis 244 Washington DC Transportation Research Board National Research Council
10 Roadside Design Guide (2006) 3rd Edition Washington DC American Association of State Highway and Transportation Officials
25
NHTSArsquos National Center for Statistics and Analysis 1200 New Jersey Avenue SE Washington DC 20590
_______________________________________________________________________
11 Elvik R (1995) The Safety Value of Guardrails and Crash Cushions A Meta-Analysis of Evidence from Evaluation Studies Accident Analysis and Prevention 27 (4)
12 Stutts J C Reinfurth D W Staplin L amp Rodgman EA (2001 May) The Role of Driver Distraction in Traffic Crashes Washington DC AAA Foundation for Traffic Safety
13 Liu C Chen C-L Subramanian R amp Utter D (2005 June) Analysis of Speeding-Related Fatal Motor Vehicle Traffic Crashes NHTSA Technical Report DOT HS 809 839 Washington DC National Highway Traffic Safety Administration
14 Hosmer Jr D W and Lemeshow S (1989) Applied Logistic Regression New York John Wiley amp Sons Inc
15 SAS Institute Inc (1995) Logistic Regression Examples using SAS system Cary NC SAS Institute Inc
16 Rubin D B Schafer J L amp Subramanian R (1998 October) Multiple Imputation of Missing Blood Alcohol Concentration (BAC) Values in FARS NHTSA Technical Report DOT HS 808 816 Washington DC National Highway Traffic Safety Administration
17 Subramanian R (2005 March) Alcohol Involvement in Fatal Motor Vehicle Traffic Crashes NHTSA Technical Report DOT HS 809 822 Washington DC National Highway Traffic Safety Administration
18 SASSTAT Userrsquos Guide Version 8 1999 Cary NC SAS Institute Inc
26
NHTSArsquos National Center for Statistics and Analysis 1200 New Jersey Avenue SE Washington DC 20590
DOT HS 811 232November 2009
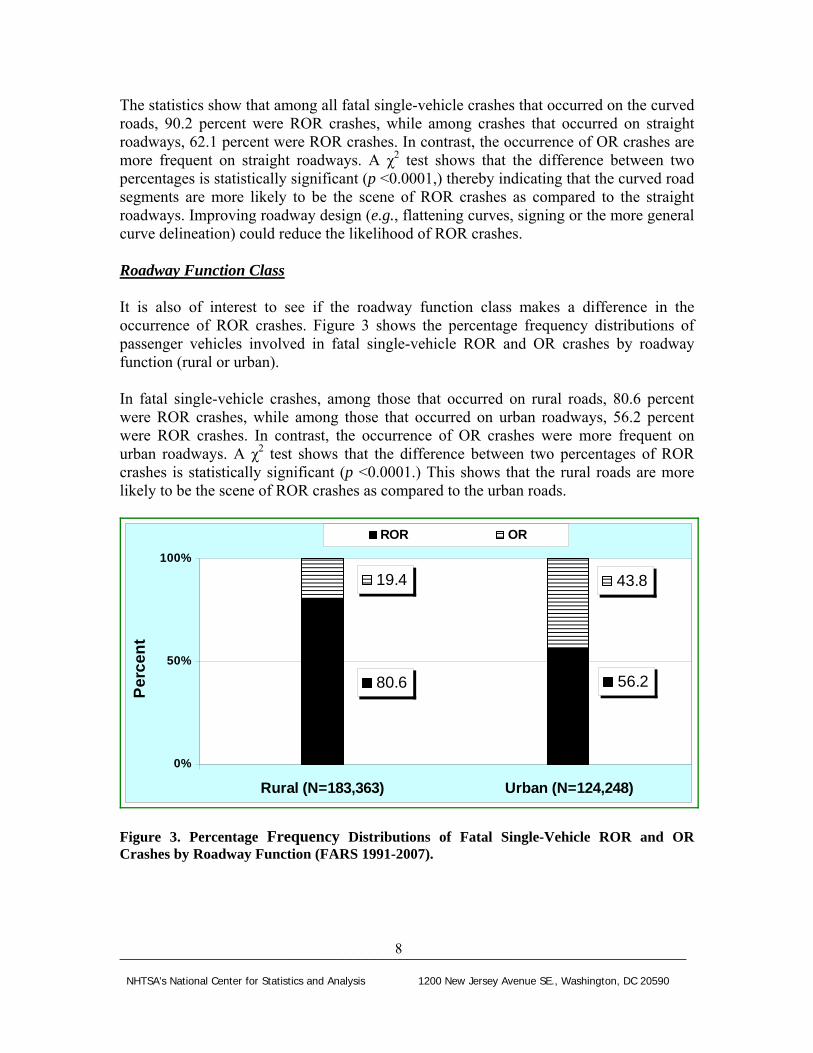
_______________________________________________________________________
The statistics show that among all fatal single-vehicle crashes that occurred on the curved roads 902 percent were ROR crashes while among crashes that occurred on straight roadways 621 percent were ROR crashes In contrast the occurrence of OR crashes are more frequent on straight roadways A χ2 test shows that the difference between two percentages is statistically significant (p lt00001) thereby indicating that the curved road segments are more likely to be the scene of ROR crashes as compared to the straight roadways Improving roadway design (eg flattening curves signing or the more general curve delineation) could reduce the likelihood of ROR crashes
Roadway Function Class
It is also of interest to see if the roadway function class makes a difference in the occurrence of ROR crashes Figure 3 shows the percentage frequency distributions of passenger vehicles involved in fatal single-vehicle ROR and OR crashes by roadway function (rural or urban)
In fatal single-vehicle crashes among those that occurred on rural roads 806 percent were ROR crashes while among those that occurred on urban roadways 562 percent were ROR crashes In contrast the occurrence of OR crashes were more frequent on urban roadways A χ2 test shows that the difference between two percentages of ROR crashes is statistically significant (p lt00001) This shows that the rural roads are more likely to be the scene of ROR crashes as compared to the urban roads
806 562
194 438
0
50
100
Rural (N=183363) Urban (N=124248)
Pe
rce
nt
ROR OR
Figure 3 Percentage Frequency Distributions of Fatal Single-Vehicle ROR and OR Crashes by Roadway Function (FARS 1991-2007)
8
NHTSArsquos National Center for Statistics and Analysis 1200 New Jersey Avenue SE Washington DC 20590
_______________________________________________________________________
Road Posted Speed Limit
In most cases the actual vehiclersquos pre-crash travel speed is unknown In this analysis the posted speed limit was used as a proxy to a vehiclersquos travel speed Figure 4 shows the percentage frequency distributions of passenger vehicles involved in fatal single-vehicle ROR and OR crashes by posted speed limits (lt 60 mph and 60+ mph)
Among fatal single-vehicle crashes that occurred on roadways with posted speed limits of 60 mph and above 81 percent were ROR crashes while among the crashes that occurred on roadways with posted speed limits less than 60 mph 69 percent were ROR crashes A χ2 test shows that the difference between these two percentages is statistically significant (p lt00001) This in turn shows that the high speed limit roads are more likely to be the scene of ROR crashes as compared to the low speed limit roads
810 690
190 310
0
50
100
60+ mph (N=49687) lt 60 mph (N=251554)
Pe
rce
nt
ROR OR
Figure 4 Percentage Frequency Distributions of Fatal Single-Vehicle ROR and OR Crashes by Road Posted Speed Limits (FARS 1991-2007)
9
NHTSArsquos National Center for Statistics and Analysis 1200 New Jersey Avenue SE Washington DC 20590
_______________________________________________________________________
Roadway Number of Lanes
Another factor that is worth investigating is the roadway number of lanes Figure 5 shows the percentage frequency distributions of passenger vehicles involved in fatal single-vehicle ROR and OR crashes by roadway number of lanes Four categories of roadways were considered with reference to the number of lanes one or two lanes (divided or undivided) and three or more lanes (divided or undivided) The number of lanes refers to the number of lanes of a continuous cross-section of roadway For example a local roadway with one lane going north and one lane going south would be coded as two lanes However if a trafficway is a divided highway with two lanes going north a median and two lanes going south then the number of lanes is coded as two If a trafficway has two lanes going north immediately adjacent to two lanes going south one continuous cross-section of roadway then the number of lanes is coded as four
The results in Figure 5 show that among the fatal single-vehicle crashes that occurred on roadways with fewer lanes (one or two lanes) 678 percent (divided) and 766 percent (undivided) were ROR crashes while among the crashes that occurred on roads with three and more lanes 62 percent (divided) and 40 percent (undivided) were ROR crashes In contrast the occurrence of OR crashes were more frequent on roadways with three and more lanes as compared to one or more lanes both in the case of divided and undivided roadways
Statistically significant (p lt00001) difference shows that the roadways with fewer lanes (one or two lanes) are more likely to be the scene of ROR crashes as compared to the roadway with three and more lanes (divided or undivided) The roadway design or rehabilitation strategy such as building more lanes is likely to reduce ROR crashes 8
400 620 678 766
600 380 326 234
0
50
100
One or Tw o Lanes Divided
(N=53563)
One or Tw o Lanes Undivided (N=191462)
Three and More Lanes Divided
(N=35615)
Three and More Lanes Undivided
(N=18395)
Pe
rce
nt
ROR OR
Figure 5 Percentage Frequency Distributions of Fatal Single-Vehicle ROR and OR Crashes by Roadway Number of Lanes (FARS 1991-2007)
10
NHTSArsquos National Center for Statistics and Analysis 1200 New Jersey Avenue SE Washington DC 20590
_______________________________________________________________________
312 Weather Conditions
To investigate if certain weather conditions contribute to the occurrence of ROR crashes the percentage frequency distributions of passenger vehicles involved in fatal single-vehicle ROR and OR crashes by weather conditions were obtained Two weather conditions were considered for this purpose adverse (rain sleet snow fog fog and others - smog smoke blowing sand or dust) and good weather conditions (normal or clear) The results are presented in Figure 6
Among fatal single-vehicle crashes that occurred during adverse weather conditions 755 percent were ROR crashes while among crashes that occurred during good weather conditions 70 percent were ROR crashes On the other hand OR crashes were more frequent in good weather conditions
The significant difference between the two percentages (p lt00001) shows that ROR crashes are more likely to occur in adverse weather conditions as compared to good weather conditions Improving roadway design (eg providing skid-resistant pavement surfaces) could reduce the likelihood of ROR crashes
755 700
245 300
0
50
100
Adverse Weather (N=34152) Good Weather (N=273242)
Pe
rce
nt
ROR OR
Figure 6 Percentage Frequency Distributions of Fatal Single-Vehicle ROR and OR Crashes by Weather Conditions (FARS 1991-2007)
11
NHTSArsquos National Center for Statistics and Analysis 1200 New Jersey Avenue SE Washington DC 20590
_______________________________________________________________________
ROR OR
100
50
0
Night Time (N=155199) Day Time (N=149945)
742 665
258 335
Pe
rce
nt
313 Natural Lighting Conditions
Could visibility due to natural lighting be an issue in the occurrence of ROR crashes To answer this question frequency analysis was conducted for two lighting conditions nighttime and daytime Figure 7 shows the percentage frequency distributions of passenger vehicles involved in fatal single-vehicle ROR and OR crashes by lighting conditions
Among fatal single-vehicle crashes that occurred during nighttime (8 pm ndash 559 am) 742 percent were ROR crashes while among the crashes that occurred during daytime (6 am ndash 759 pm) 665 percent were ROR crashes In contrast the occurrence of OR crashes are more frequent during day time
A χ2 test confirms that the difference between two percentages is statistically significant (p lt00001) This shows that the night time driving is more likely to result into ROR crashes as compared to the day time period Reduced lighting like adverse weather is associated with a significant increase in the likelihood of single-vehicle ROR crashes
Figure 7 Percentage Frequency Distributions of Fatal Single-Vehicle ROR and OR Crashes by Lighting Conditions (FARS 1991-2007)
12
NHTSArsquos National Center for Statistics and Analysis 1200 New Jersey Avenue SE Washington DC 20590
_______________________________________________________________________
ROR OR
680 748
320 252
0
50
100
Pe
rce
nt
One Occupant (Driver Alone) Two or More Occupants (N=183611) (N=125559)
32 Occupant-Related Factors
The occupant-related factors examined in the study include vehicle occupancy driverrsquos gender age alcohol use and driver performance-related factors such as sleep inattention over-correction of the vehicle etc
321 Occupancy
It is of interest to see if the occupancy of a vehicle makes a difference in the occurrence of ROR crashes Figure 8 shows the percentage frequency distributions of passenger vehicles involved in fatal single-vehicle ROR and OR crashes by vehicle occupancy
Among fatal single-vehicle crashes involving a vehicle with only one occupant (driver alone) 680 percent were ROR crashes while among crashes involving a vehicle with two or more occupants 748 percent were ROR crashes A χ2 test confirms the difference between these two percentages to be statistically significant (p lt00001)
This shows that vehicles with high occupancy (two or more occupants) are more likely to be involved in ROR crashes as compared to a vehicle with the driver alone The reason for this is not immediately clear However a possible explanation could be the fact that the presence of other occupants in the vehicle is a likely source of distraction to the driver due to conversation and other activities 12
Figure 8 Percentage Frequency Distributions of Fatal Single-Vehicle ROR and OR Crashes by Vehicle Occupancy (FARS 1991-2007)
13
NHTSArsquos National Center for Statistics and Analysis 1200 New Jersey Avenue SE Washington DC 20590
_______________________________________________________________________
722 665
278 335
ROR OR
100
50
0
Male Driver (N=230416) Female Driver (N=78754)
Pe
rce
nt
322 Driverrsquos Gender
Among many driver-related factors driver gender that could possibly contribute to the occurrence of ROR crashes was studied Figure 9 shows the percentage frequency distributions of passenger vehicles involved in fatal single-vehicle ROR and OR crashes by driverrsquos gender
Among fatal single-vehicle crashes involving male drivers 722 percent were ROR crashes while 665 percent crashes involving female drivers were ROR crashes In contrast the occurrence of OR crashes are more frequent for female drivers A χ2 test shows that the difference between the two percentages is statistically significant (p lt00001)
Thus one could infer that vehicles with the male drivers are more likely to be involved in ROR crashes as compared to the vehicles with the female drivers
Figure 9 Percentage Frequency Distributions of Fatal Single-Vehicle ROR and OR Crashes by Driverrsquos Gender (FARS 1991-2007)
14
NHTSArsquos National Center for Statistics and Analysis 1200 New Jersey Avenue SE Washington DC 20590
_______________________________________________________________________
323 Driverrsquos Age
To look into driver age as a contributing factor in ROR crashes four age groups were considered 15 to 24 25 to 44 45 to 64 and 65 and older Figure 10 shows the percentage frequency distributions of passenger vehicles involved in fatal single-vehicle ROR and OR crashes by these age groups
Among fatal single-vehicle crashes involving young drivers 15 to 24 a higher percentage (752 percent) were of ROR crashes as compared to other age groups This shows that vehicles with young drivers 15 to 24 are more likely to be involved in ROR crashes as compared to other three age groups
727 664 752 686
273 336 248 314
0
50
100
15-24 (N=102962)
25-44 (N=121728)
45-64 (N=55303)
65+ (N=27195)
Pe
rce
nt
ROR OR
Figure 10 Percentage Frequency Distributions of Fatal Single-Vehicle ROR and OR Crashes by Driverrsquos Age (FARS 1991-2007)
15
NHTSArsquos National Center for Statistics and Analysis 1200 New Jersey Avenue SE Washington DC 20590
_______________________________________________________________________
583 865
417 135
0
50
100
BAC=0 (N=172537) BAC=001+ (N=136633)
Pe
rce
nt
ROR OR
Figure 11 Percentage Frequency Distributions of Fatal Single-Vehicle ROR and OR Crashes by Driverrsquos Alcohol Use (FARS 1991-2007)
324 Alcohol-Related Driving
Alcohol involvement of a driver often leads to safety issues such as loss of vehicle control that may result into a ROR crash Two categories of drivers sober (BAC=0) and alcohol involved (BAC=01+) were considered in the analysis to see if alcohol use contributes to ROR crashes Figure 11 shows the percentage frequency distributions of passenger vehicles involved in fatal single-vehicle ROR and OR crashes by driverrsquos alcohol use
Among fatal single-vehicle crashes involving drivers with alcohol use (BAC=01+) 865 percent were ROR crashes while among those drivers with no alcohol (BAC=0) 583 percent were ROR crashes The difference between these two percentages is statistically significant (p lt00001) This indicates that the drivers with alcohol use are more likely to be involved in ROR crashes as compared to sober drivers
16
NHTSArsquos National Center for Statistics and Analysis 1200 New Jersey Avenue SE Washington DC 20590
_______________________________________________________________________
325 Driver-Performance-Related Factors
Some of the driver performance-related factors that are likely to contribute to the occurrence of ROR crashes were also examined
These include (1) sleepy (drowsy asleep fatigued and sleepy) (2) inattentive (talking eating etc) (3) over-correcting of the vehicle (4) avoiding (avoiding swerving or sliding due to severe crosswind tire blow-out or flat live animals in road vehicle in road etc) (5) distractions inside vehicles (cellular telephone computer fax machine etc) and (6) other driver-performance-related factors such as mentally challenged following improperly failure to signal intensions etc
Figure 12 shows the percentage frequency distributions of passenger vehicles involved in fatal single-vehicle ROR and OR crashes based on the driver performance-related factors The statistics show that the percentages of sleepy (912) inattentive (754) over correction of the vehicle (856) and crash avoiding (798) drivers involved in fatal single-vehicle ROR crashes are significantly greater (p lt00001) than the drivers with lsquoOther driver performance-related factorsrsquo that account for 67 percent of ROR crashes
This means that drivers with these performance-related factors (sleepy inattentive over correction avoiding etc) are more likely to be involved in ROR crashes as compared to drivers with other performance-related factors These results are consistent with those obtained from other studies using different approaches and other crash databases 2-11
17
NHTSArsquos National Center for Statistics and Analysis 1200 New Jersey Avenue SE Washington DC 20590
_______________________________________________________________________
672 671 798 856 754 912
328 329 202 144 246 88
0
20
40
60
80
100
Sleepy (N=14774)
Inattention (N=28081)
Overcorrect (N=19289)
Avoiding (N=14145)
Possible Distraction (N=1429)
Others (N=227587)
Per
cen
t
ROR OR
Figure 12 Percentage Frequency Distributions of Fatal Single-Vehicle ROR and OR Crashes by Driver Performance-Related Factors (FARS 1991-2007)
18
NHTSArsquos National Center for Statistics and Analysis 1200 New Jersey Avenue SE Washington DC 20590
_______________________________________________________________________
33 Vehicle-Related Factors
It is generally believed that ROR crashes are likely to occur due to some vehicle-related factors such as vehicle speeding or vehicle type
331 Vehicle Speeding Status
A crash is considered speeding-related if any driver involved in the crash is charged with a speeding-related offense or if a police officer indicates that racing driving too fast for the conditions or exceeding the posted speed limit was a related factor in the crash 13
Figure 13 shows the percentage frequency distributions of passenger vehicles involved in fatal single-vehicle ROR and OR crashes by vehicle speeding status
Among fatal single-vehicle crashes that involved a speeding vehicle 90 percent were ROR crashes while among crashes that did not involve a speeding vehicle 595 percent were ROR crashes A χ2 test shows that the difference between two percentages is statistically significant (p lt00001) thereby showing that speeding vehicles are more likely to be involved in ROR crashes as compared to non-speeding vehicles
900 595
100 405
0
50
100
Speeding (N=113825) Non-Speeding (N=195345)
Pe
rce
nt
ROR OR
Figure 13 Percentage Frequency Distributions of Fatal Single-Vehicle ROR and OR Crashes by Vehicle Speeding Status (FARS 1991-2007)
19
NHTSArsquos National Center for Statistics and Analysis 1200 New Jersey Avenue SE Washington DC 20590
_______________________________________________________________________
500 520 600 670 730 710
500 480 400 330 270 290
00
200
400
600
800
1000
Passenger Car
(N=178430)
LT Pickup
(N=72065)
LT Utility
(N=38970)
LT MiniVan
(N=11159)
LT Other Van (N=7904)
LT Others (N=642)
Pe
rce
nt
ROR OR
Figure 14 shows the percentage frequency distributions of passenger vehicles involved in fatal single-vehicle ROR and OR crashes by passenger vehicle type passenger car light truck (LT) including pickup utility minivan other van and other light trucks) It shows that passenger cars are more likely to be involved in ROR crashes as compared to other passenger vehicle types Minivans (60) are more likely to be involved in ROR crashes (p lt00001) as compared to other vans (52)
332 Vehicle Type
Figure 14 Percentage Frequency Distributions of Fatal Single-Vehicle ROR and OR Crashes by Vehicle Type (FARS 1991-2007)
20
NHTSArsquos National Center for Statistics and Analysis 1200 New Jersey Avenue SE Washington DC 20590
_______________________________________________________________________
4 Logistic Regression
The analysis in the previous sections shows that factors such as driver sleepiness alcohol use vehicle speeding curved roadway rural roads etc are significant contributors to the occurrence of fatal single-vehicle ROR crashes It remains to assess their relative influence as well as estimate the amount of risk each carries in the occurrence of such crashes Logistic regression was used for this purpose This is a modeling procedure that predicts the probability (p) of occurrence of an event (fatal single-vehicle ROR crash in the present case) as a consequence of certain roadway- driver- environment- and vehicle-related factors such as sleepy alcohol use weather condition lighting condition speeding status road function etc Generally the logistic regression model provides log of odds as a function of the predictors
Log (odds) = a0 + a1timesdriver performance-related factor + a2timesalcohol use + a3timesspeeding status + a4timesweather condition + a5timeslighting conditionhellip + aktimesspeeding statustimesweather condition + ak+1timesspeeding statustimesdriverrsquos age +helliphellip
where a0 is the intercept and a1 a2 a3 helliphellip ak ak+1 helliphellip are the regression coefficients
As in the previous analysis FARS data was used in the modeling procedure Since in FARS driverrsquos alcohol involvement is estimated by Multiple Imputation (MI) 16 17
procedure the SAS MIANALYZE procedure was used in this study to perform the analysis of the MI data generated from the logistic regression18
21
NHTSArsquos National Center for Statistics and Analysis 1200 New Jersey Avenue SE Washington DC 20590
_______________________________________________________________________
41 Logistic Regression Results and Interpretation
Of all the variables considered in the logistic regression only 10 showed up as significant predictors (95 confidence level) As regards the interaction effect of these factors only the interaction of speeding with other variables was considered However only three of these interactions emerged as significant (95 confidence level) The results in Table 1 present estimates of regression coefficients and the corresponding odds ratio only for significant main effects and interactions Since the independent variables (predictors) are dichotomous the influence of the corresponding factors can be compared simply by comparing their regression coefficients
The ordered (decreasing) estimates of regression coefficients in Table 1 show that the most influential factor in the occurrence of fatal single-vehicle ROR crashes is the driver performance-related factor sleepy followed by alcohol use roadway alignment with curve speeding passenger car rural roadway number of lanes high-speed-limit road adverse weather and avoiding With regard to the interaction effect of speeding with other factors speeding with drivers of age groups 15 to 24 and 25 to 44 as well as speeding under adverse weather are significant contributors to the likelihood of ROR crashes
Table 1 Multiple Imputation Parameter Estimates Dagger
Variables Estimate Odds Ratio Driver performance-related factor sleepy vs others 11675 Dagger 321 Driver with alcohol BAC=01+ gdL vs BAC=0 06605 Dagger 194 Road alignment curve vs straight 05535 Dagger 174 Vehicle speeding status speeding vs non-speeding 04966 Dagger 164 Vehicle type passenger car vs other LTs 04780 Dagger 161 Road function rural vs urban 03637 Dagger 144 Roadway of lanes one or two (undivided) vs three amp more (undivided) 03346 Dagger 141 Road speed limit ge 60 mph vs lt60 mph 02659 Dagger 130 Weather adverse vs good 02130 Dagger 124 Driver performance-related factor avoiding vs others 02007 Dagger 122 Weather timesSpeeding status adverse amp speeding vs good amp non-speeding 01056 Dagger 111 Driver Age times Speeding status 25-44 amp speeding vs 65+ amp non-speeding 01003 Dagger 111 Driver Age times Speeding status 15-24 amp speeding vs 65+ amp non-speeding 00578 Dagger 106
Statistically significant variables (α = 005) associated with the high risk (odds ratio gt100) Other variables with low risk (odds ratio lt100) or insignificance (pgt005) after jointly estimating the effect are not shown here Dagger p-value lt00001
One of the most important by-product of logistic regression is the estimate of odds ratio that tells a great deal about the risk a certain factor carries in contributing to the occurrence of ROR crashes Specifically odds ratio measures the magnitude of increase in odds of happening of an event as a result of a unit increase in a predictor (eg sober and alcohol-used driver) An odds ratio value of 1 is indicative of no influence Table 1 also shows odds ratio estimates of significant factors and interactions
22
NHTSArsquos National Center for Statistics and Analysis 1200 New Jersey Avenue SE Washington DC 20590
_______________________________________________________________________
1
250 226
o 200
ita 164
Rd
s 150
d 124
O 100 100
050
Non-Speeding+Good Weather Non-Speeding+Adverse Weather
Speeding+Good Weather Speeding+Adverse Weather
Figure 15 Odds Ratio by Speeding Status and Weather Conditions
The odds ratio 321 for the factor ldquodriver performance-related factorrdquo shows that the odds of being involved in an ROR crash for a sleepy driver are three times as large as that for the driver who is not sleepy
The odds ratio 194 for the factor ldquodriver with alcoholrdquo shows that the odds of being involved in an ROR crash for an alcohol used driver (BAC=01+ gdL) are almost two times as large as that for a sober driver (BAC=0)
The odds ratio 174 for the factor ldquoroad alignmentrdquo shows that the odds of being involved in an ROR crash on curved roadways are 174 times as large as that on straight roadways in fatal single-vehicle crashes
The odds ratio 164 for the factor ldquovehicle speeding statusrdquo shows that the odds of being involved in an ROR crash for speeding vehicles are 164 times as large as that for non-speeding vehicles
The odds ratio 161 for the factor ldquovehicle typerdquo shows that the odds of being involved in an ROR crash for passenger cars are 161 times as large as that for other LTs
The odds ratio 144 for the factor ldquoroad functionrdquo shows that the odds of being involved in an ROR crash on rural roadways are 144 times as large as that on urban roadways
The odds ratio 266 for the factor ldquoweather amp speeding statusrdquo shows that the odds of being involved in an ROR crash under the adverse weather and in speeding vehicle are 266 (=164times124times111) times as large as that under the good weather and in non-speeding vehicle (Figure 15)
23
NHTSArsquos National Center for Statistics and Analysis 1200 New Jersey Avenue SE Washington DC 20590
_______________________________________________________________________
5 Conclusions
Run-off-road crashes account for a significant percentage (around 70) of all fatal single-vehicle crashes FARS data (1991 to 2007) that includes detailed information about ROR crashes provided sufficient statistical evidence to conclude that certain roadway- driver- environment- and vehicle-related factors closely associated with the occurrence of these crashes Appropriate crash countermeasures based on the identified factors can reduce the occurrence of single-vehicle ROR crashes and hence of the fatalities
Curved road segments rural roads high-speed-limit roadways and roadways with fewer lanes (divided or undivided) are found to be more likely to be the scene of fatal single-vehicle ROR crashes as compared to the fatal single-vehicle OR crashes Similarly among environmental factors adverse weather and night time periods are the factors associated with high risk of fatal single-vehicle ROR crashes
Vehicles with high occupancy (two and more occupants) male driver younger driver and alcohol used by driver are more likely to be involved in fatal single-vehicle ROR crashes as compared to the fatal single-vehicle OR crashes Drivers with performance-related factors (sleepy inattentive over-correction avoiding etc) are more likely to be involved in the fatal single-vehicle ROR crashes Speeding vehicles and passenger cars are also associated with high risks of the fatal single-vehicle ROR crashes
In the adverse weather condition and for the younger drivers (15 to 24 and 25 to 44) the speeding vehicle would increase the risk of fatal single-vehicle ROR crashes by an additional factor
The above facts based on statistical evidence suggest several crash countermeasures For example improving roadway design such as flattening curves and installing shoulder rumble strips or rehabilitation strategies such as building wide lanes or adding additional unpaved shoulder width on entire system providing skid-resistant pavement surfaces could reduce the likelihood of ROR crashes
24
NHTSArsquos National Center for Statistics and Analysis 1200 New Jersey Avenue SE Washington DC 20590
_______________________________________________________________________
6 References
1 FHWA (Undated) Reducing Highway Fatalities Washington DC Federal Highway Administration httpsafetyfhwadotgovroadway5Fdept
2 Neuman T RPfefer R Slack K L Council F McGee H Prothe L amp Eccles K (1998) Guidance for Implementation of the AASHTO Strategic Highway Safety Plan Report 500 Volume 6 A Guide for Addressing Run-Off Road Collisions Washington DC Transportation Research Board Available at httponlinepubstrborgonlinepubsnchrpnchrp_rpt_500v6pdf
3 Spainhour L K amp Mishra A (2007) Analysis of Fatal Run-off-the-Road Crashes Involving Overcorrection TRB 87th Annual Meeting Paper No 08-0661 Washington DC Transportation Research Board
4 McGee H W amp Hanscom F R Low-Cost Treatments for Horizontal Curve Safety FHWA-SA-07-002 December 2006
5 Johnston I Corben B TriggsT Candappa N amp Lenneacute M Reducing Serious Injury and Death from Run-off-Road Crashes in Victoria ndash Turning Knowledge into Action (2006 June) RACV Research Report Victoria Australia Royal Automobile Club of Victoria Ltd
6 Dissanayake S (2003 August) Young Drivers and Run-Off-the-Road Crashes Proceedings of the 2003 Mid-Continent Transportation Research Symposium Ames Iowa
7 Knapp K K Giese K L amp Lee W (2003 August) Urban Four-Lane Undivided to Three-Lane Roadway Conversion Guidelines Proceedings of the 2003 Mid-Continent Transportation Research Symposium Ames Iowa
8 Őrnek E amp Drakopoulos A (2007 August) Analysis of Run-Off-Road Crashes in Relation to Roadway Features and Driver Behavior Proceedings of the 2007 Mid-Continent Transportation Research Symposium Ames Iowa
9 Ray M H amp McGinnis R G (1997) Guardrail and Median Barrier Crashworthiness A Synthesis of Highway Practice NCHRP Synthesis 244 Washington DC Transportation Research Board National Research Council
10 Roadside Design Guide (2006) 3rd Edition Washington DC American Association of State Highway and Transportation Officials
25
NHTSArsquos National Center for Statistics and Analysis 1200 New Jersey Avenue SE Washington DC 20590
_______________________________________________________________________
11 Elvik R (1995) The Safety Value of Guardrails and Crash Cushions A Meta-Analysis of Evidence from Evaluation Studies Accident Analysis and Prevention 27 (4)
12 Stutts J C Reinfurth D W Staplin L amp Rodgman EA (2001 May) The Role of Driver Distraction in Traffic Crashes Washington DC AAA Foundation for Traffic Safety
13 Liu C Chen C-L Subramanian R amp Utter D (2005 June) Analysis of Speeding-Related Fatal Motor Vehicle Traffic Crashes NHTSA Technical Report DOT HS 809 839 Washington DC National Highway Traffic Safety Administration
14 Hosmer Jr D W and Lemeshow S (1989) Applied Logistic Regression New York John Wiley amp Sons Inc
15 SAS Institute Inc (1995) Logistic Regression Examples using SAS system Cary NC SAS Institute Inc
16 Rubin D B Schafer J L amp Subramanian R (1998 October) Multiple Imputation of Missing Blood Alcohol Concentration (BAC) Values in FARS NHTSA Technical Report DOT HS 808 816 Washington DC National Highway Traffic Safety Administration
17 Subramanian R (2005 March) Alcohol Involvement in Fatal Motor Vehicle Traffic Crashes NHTSA Technical Report DOT HS 809 822 Washington DC National Highway Traffic Safety Administration
18 SASSTAT Userrsquos Guide Version 8 1999 Cary NC SAS Institute Inc
26
NHTSArsquos National Center for Statistics and Analysis 1200 New Jersey Avenue SE Washington DC 20590
DOT HS 811 232November 2009
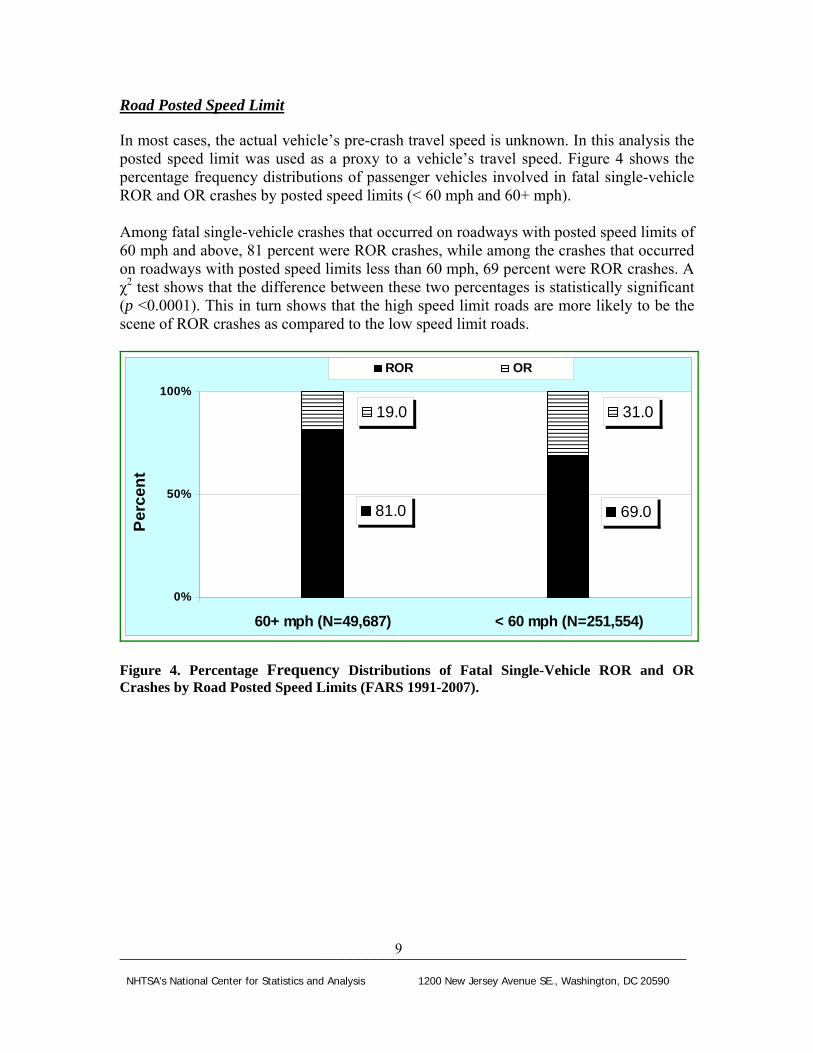
_______________________________________________________________________
Road Posted Speed Limit
In most cases the actual vehiclersquos pre-crash travel speed is unknown In this analysis the posted speed limit was used as a proxy to a vehiclersquos travel speed Figure 4 shows the percentage frequency distributions of passenger vehicles involved in fatal single-vehicle ROR and OR crashes by posted speed limits (lt 60 mph and 60+ mph)
Among fatal single-vehicle crashes that occurred on roadways with posted speed limits of 60 mph and above 81 percent were ROR crashes while among the crashes that occurred on roadways with posted speed limits less than 60 mph 69 percent were ROR crashes A χ2 test shows that the difference between these two percentages is statistically significant (p lt00001) This in turn shows that the high speed limit roads are more likely to be the scene of ROR crashes as compared to the low speed limit roads
810 690
190 310
0
50
100
60+ mph (N=49687) lt 60 mph (N=251554)
Pe
rce
nt
ROR OR
Figure 4 Percentage Frequency Distributions of Fatal Single-Vehicle ROR and OR Crashes by Road Posted Speed Limits (FARS 1991-2007)
9
NHTSArsquos National Center for Statistics and Analysis 1200 New Jersey Avenue SE Washington DC 20590
_______________________________________________________________________
Roadway Number of Lanes
Another factor that is worth investigating is the roadway number of lanes Figure 5 shows the percentage frequency distributions of passenger vehicles involved in fatal single-vehicle ROR and OR crashes by roadway number of lanes Four categories of roadways were considered with reference to the number of lanes one or two lanes (divided or undivided) and three or more lanes (divided or undivided) The number of lanes refers to the number of lanes of a continuous cross-section of roadway For example a local roadway with one lane going north and one lane going south would be coded as two lanes However if a trafficway is a divided highway with two lanes going north a median and two lanes going south then the number of lanes is coded as two If a trafficway has two lanes going north immediately adjacent to two lanes going south one continuous cross-section of roadway then the number of lanes is coded as four
The results in Figure 5 show that among the fatal single-vehicle crashes that occurred on roadways with fewer lanes (one or two lanes) 678 percent (divided) and 766 percent (undivided) were ROR crashes while among the crashes that occurred on roads with three and more lanes 62 percent (divided) and 40 percent (undivided) were ROR crashes In contrast the occurrence of OR crashes were more frequent on roadways with three and more lanes as compared to one or more lanes both in the case of divided and undivided roadways
Statistically significant (p lt00001) difference shows that the roadways with fewer lanes (one or two lanes) are more likely to be the scene of ROR crashes as compared to the roadway with three and more lanes (divided or undivided) The roadway design or rehabilitation strategy such as building more lanes is likely to reduce ROR crashes 8
400 620 678 766
600 380 326 234
0
50
100
One or Tw o Lanes Divided
(N=53563)
One or Tw o Lanes Undivided (N=191462)
Three and More Lanes Divided
(N=35615)
Three and More Lanes Undivided
(N=18395)
Pe
rce
nt
ROR OR
Figure 5 Percentage Frequency Distributions of Fatal Single-Vehicle ROR and OR Crashes by Roadway Number of Lanes (FARS 1991-2007)
10
NHTSArsquos National Center for Statistics and Analysis 1200 New Jersey Avenue SE Washington DC 20590
_______________________________________________________________________
312 Weather Conditions
To investigate if certain weather conditions contribute to the occurrence of ROR crashes the percentage frequency distributions of passenger vehicles involved in fatal single-vehicle ROR and OR crashes by weather conditions were obtained Two weather conditions were considered for this purpose adverse (rain sleet snow fog fog and others - smog smoke blowing sand or dust) and good weather conditions (normal or clear) The results are presented in Figure 6
Among fatal single-vehicle crashes that occurred during adverse weather conditions 755 percent were ROR crashes while among crashes that occurred during good weather conditions 70 percent were ROR crashes On the other hand OR crashes were more frequent in good weather conditions
The significant difference between the two percentages (p lt00001) shows that ROR crashes are more likely to occur in adverse weather conditions as compared to good weather conditions Improving roadway design (eg providing skid-resistant pavement surfaces) could reduce the likelihood of ROR crashes
755 700
245 300
0
50
100
Adverse Weather (N=34152) Good Weather (N=273242)
Pe
rce
nt
ROR OR
Figure 6 Percentage Frequency Distributions of Fatal Single-Vehicle ROR and OR Crashes by Weather Conditions (FARS 1991-2007)
11
NHTSArsquos National Center for Statistics and Analysis 1200 New Jersey Avenue SE Washington DC 20590
_______________________________________________________________________
ROR OR
100
50
0
Night Time (N=155199) Day Time (N=149945)
742 665
258 335
Pe
rce
nt
313 Natural Lighting Conditions
Could visibility due to natural lighting be an issue in the occurrence of ROR crashes To answer this question frequency analysis was conducted for two lighting conditions nighttime and daytime Figure 7 shows the percentage frequency distributions of passenger vehicles involved in fatal single-vehicle ROR and OR crashes by lighting conditions
Among fatal single-vehicle crashes that occurred during nighttime (8 pm ndash 559 am) 742 percent were ROR crashes while among the crashes that occurred during daytime (6 am ndash 759 pm) 665 percent were ROR crashes In contrast the occurrence of OR crashes are more frequent during day time
A χ2 test confirms that the difference between two percentages is statistically significant (p lt00001) This shows that the night time driving is more likely to result into ROR crashes as compared to the day time period Reduced lighting like adverse weather is associated with a significant increase in the likelihood of single-vehicle ROR crashes
Figure 7 Percentage Frequency Distributions of Fatal Single-Vehicle ROR and OR Crashes by Lighting Conditions (FARS 1991-2007)
12
NHTSArsquos National Center for Statistics and Analysis 1200 New Jersey Avenue SE Washington DC 20590
_______________________________________________________________________
ROR OR
680 748
320 252
0
50
100
Pe
rce
nt
One Occupant (Driver Alone) Two or More Occupants (N=183611) (N=125559)
32 Occupant-Related Factors
The occupant-related factors examined in the study include vehicle occupancy driverrsquos gender age alcohol use and driver performance-related factors such as sleep inattention over-correction of the vehicle etc
321 Occupancy
It is of interest to see if the occupancy of a vehicle makes a difference in the occurrence of ROR crashes Figure 8 shows the percentage frequency distributions of passenger vehicles involved in fatal single-vehicle ROR and OR crashes by vehicle occupancy
Among fatal single-vehicle crashes involving a vehicle with only one occupant (driver alone) 680 percent were ROR crashes while among crashes involving a vehicle with two or more occupants 748 percent were ROR crashes A χ2 test confirms the difference between these two percentages to be statistically significant (p lt00001)
This shows that vehicles with high occupancy (two or more occupants) are more likely to be involved in ROR crashes as compared to a vehicle with the driver alone The reason for this is not immediately clear However a possible explanation could be the fact that the presence of other occupants in the vehicle is a likely source of distraction to the driver due to conversation and other activities 12
Figure 8 Percentage Frequency Distributions of Fatal Single-Vehicle ROR and OR Crashes by Vehicle Occupancy (FARS 1991-2007)
13
NHTSArsquos National Center for Statistics and Analysis 1200 New Jersey Avenue SE Washington DC 20590
_______________________________________________________________________
722 665
278 335
ROR OR
100
50
0
Male Driver (N=230416) Female Driver (N=78754)
Pe
rce
nt
322 Driverrsquos Gender
Among many driver-related factors driver gender that could possibly contribute to the occurrence of ROR crashes was studied Figure 9 shows the percentage frequency distributions of passenger vehicles involved in fatal single-vehicle ROR and OR crashes by driverrsquos gender
Among fatal single-vehicle crashes involving male drivers 722 percent were ROR crashes while 665 percent crashes involving female drivers were ROR crashes In contrast the occurrence of OR crashes are more frequent for female drivers A χ2 test shows that the difference between the two percentages is statistically significant (p lt00001)
Thus one could infer that vehicles with the male drivers are more likely to be involved in ROR crashes as compared to the vehicles with the female drivers
Figure 9 Percentage Frequency Distributions of Fatal Single-Vehicle ROR and OR Crashes by Driverrsquos Gender (FARS 1991-2007)
14
NHTSArsquos National Center for Statistics and Analysis 1200 New Jersey Avenue SE Washington DC 20590
_______________________________________________________________________
323 Driverrsquos Age
To look into driver age as a contributing factor in ROR crashes four age groups were considered 15 to 24 25 to 44 45 to 64 and 65 and older Figure 10 shows the percentage frequency distributions of passenger vehicles involved in fatal single-vehicle ROR and OR crashes by these age groups
Among fatal single-vehicle crashes involving young drivers 15 to 24 a higher percentage (752 percent) were of ROR crashes as compared to other age groups This shows that vehicles with young drivers 15 to 24 are more likely to be involved in ROR crashes as compared to other three age groups
727 664 752 686
273 336 248 314
0
50
100
15-24 (N=102962)
25-44 (N=121728)
45-64 (N=55303)
65+ (N=27195)
Pe
rce
nt
ROR OR
Figure 10 Percentage Frequency Distributions of Fatal Single-Vehicle ROR and OR Crashes by Driverrsquos Age (FARS 1991-2007)
15
NHTSArsquos National Center for Statistics and Analysis 1200 New Jersey Avenue SE Washington DC 20590
_______________________________________________________________________
583 865
417 135
0
50
100
BAC=0 (N=172537) BAC=001+ (N=136633)
Pe
rce
nt
ROR OR
Figure 11 Percentage Frequency Distributions of Fatal Single-Vehicle ROR and OR Crashes by Driverrsquos Alcohol Use (FARS 1991-2007)
324 Alcohol-Related Driving
Alcohol involvement of a driver often leads to safety issues such as loss of vehicle control that may result into a ROR crash Two categories of drivers sober (BAC=0) and alcohol involved (BAC=01+) were considered in the analysis to see if alcohol use contributes to ROR crashes Figure 11 shows the percentage frequency distributions of passenger vehicles involved in fatal single-vehicle ROR and OR crashes by driverrsquos alcohol use
Among fatal single-vehicle crashes involving drivers with alcohol use (BAC=01+) 865 percent were ROR crashes while among those drivers with no alcohol (BAC=0) 583 percent were ROR crashes The difference between these two percentages is statistically significant (p lt00001) This indicates that the drivers with alcohol use are more likely to be involved in ROR crashes as compared to sober drivers
16
NHTSArsquos National Center for Statistics and Analysis 1200 New Jersey Avenue SE Washington DC 20590
_______________________________________________________________________
325 Driver-Performance-Related Factors
Some of the driver performance-related factors that are likely to contribute to the occurrence of ROR crashes were also examined
These include (1) sleepy (drowsy asleep fatigued and sleepy) (2) inattentive (talking eating etc) (3) over-correcting of the vehicle (4) avoiding (avoiding swerving or sliding due to severe crosswind tire blow-out or flat live animals in road vehicle in road etc) (5) distractions inside vehicles (cellular telephone computer fax machine etc) and (6) other driver-performance-related factors such as mentally challenged following improperly failure to signal intensions etc
Figure 12 shows the percentage frequency distributions of passenger vehicles involved in fatal single-vehicle ROR and OR crashes based on the driver performance-related factors The statistics show that the percentages of sleepy (912) inattentive (754) over correction of the vehicle (856) and crash avoiding (798) drivers involved in fatal single-vehicle ROR crashes are significantly greater (p lt00001) than the drivers with lsquoOther driver performance-related factorsrsquo that account for 67 percent of ROR crashes
This means that drivers with these performance-related factors (sleepy inattentive over correction avoiding etc) are more likely to be involved in ROR crashes as compared to drivers with other performance-related factors These results are consistent with those obtained from other studies using different approaches and other crash databases 2-11
17
NHTSArsquos National Center for Statistics and Analysis 1200 New Jersey Avenue SE Washington DC 20590
_______________________________________________________________________
672 671 798 856 754 912
328 329 202 144 246 88
0
20
40
60
80
100
Sleepy (N=14774)
Inattention (N=28081)
Overcorrect (N=19289)
Avoiding (N=14145)
Possible Distraction (N=1429)
Others (N=227587)
Per
cen
t
ROR OR
Figure 12 Percentage Frequency Distributions of Fatal Single-Vehicle ROR and OR Crashes by Driver Performance-Related Factors (FARS 1991-2007)
18
NHTSArsquos National Center for Statistics and Analysis 1200 New Jersey Avenue SE Washington DC 20590
_______________________________________________________________________
33 Vehicle-Related Factors
It is generally believed that ROR crashes are likely to occur due to some vehicle-related factors such as vehicle speeding or vehicle type
331 Vehicle Speeding Status
A crash is considered speeding-related if any driver involved in the crash is charged with a speeding-related offense or if a police officer indicates that racing driving too fast for the conditions or exceeding the posted speed limit was a related factor in the crash 13
Figure 13 shows the percentage frequency distributions of passenger vehicles involved in fatal single-vehicle ROR and OR crashes by vehicle speeding status
Among fatal single-vehicle crashes that involved a speeding vehicle 90 percent were ROR crashes while among crashes that did not involve a speeding vehicle 595 percent were ROR crashes A χ2 test shows that the difference between two percentages is statistically significant (p lt00001) thereby showing that speeding vehicles are more likely to be involved in ROR crashes as compared to non-speeding vehicles
900 595
100 405
0
50
100
Speeding (N=113825) Non-Speeding (N=195345)
Pe
rce
nt
ROR OR
Figure 13 Percentage Frequency Distributions of Fatal Single-Vehicle ROR and OR Crashes by Vehicle Speeding Status (FARS 1991-2007)
19
NHTSArsquos National Center for Statistics and Analysis 1200 New Jersey Avenue SE Washington DC 20590
_______________________________________________________________________
500 520 600 670 730 710
500 480 400 330 270 290
00
200
400
600
800
1000
Passenger Car
(N=178430)
LT Pickup
(N=72065)
LT Utility
(N=38970)
LT MiniVan
(N=11159)
LT Other Van (N=7904)
LT Others (N=642)
Pe
rce
nt
ROR OR
Figure 14 shows the percentage frequency distributions of passenger vehicles involved in fatal single-vehicle ROR and OR crashes by passenger vehicle type passenger car light truck (LT) including pickup utility minivan other van and other light trucks) It shows that passenger cars are more likely to be involved in ROR crashes as compared to other passenger vehicle types Minivans (60) are more likely to be involved in ROR crashes (p lt00001) as compared to other vans (52)
332 Vehicle Type
Figure 14 Percentage Frequency Distributions of Fatal Single-Vehicle ROR and OR Crashes by Vehicle Type (FARS 1991-2007)
20
NHTSArsquos National Center for Statistics and Analysis 1200 New Jersey Avenue SE Washington DC 20590
_______________________________________________________________________
4 Logistic Regression
The analysis in the previous sections shows that factors such as driver sleepiness alcohol use vehicle speeding curved roadway rural roads etc are significant contributors to the occurrence of fatal single-vehicle ROR crashes It remains to assess their relative influence as well as estimate the amount of risk each carries in the occurrence of such crashes Logistic regression was used for this purpose This is a modeling procedure that predicts the probability (p) of occurrence of an event (fatal single-vehicle ROR crash in the present case) as a consequence of certain roadway- driver- environment- and vehicle-related factors such as sleepy alcohol use weather condition lighting condition speeding status road function etc Generally the logistic regression model provides log of odds as a function of the predictors
Log (odds) = a0 + a1timesdriver performance-related factor + a2timesalcohol use + a3timesspeeding status + a4timesweather condition + a5timeslighting conditionhellip + aktimesspeeding statustimesweather condition + ak+1timesspeeding statustimesdriverrsquos age +helliphellip
where a0 is the intercept and a1 a2 a3 helliphellip ak ak+1 helliphellip are the regression coefficients
As in the previous analysis FARS data was used in the modeling procedure Since in FARS driverrsquos alcohol involvement is estimated by Multiple Imputation (MI) 16 17
procedure the SAS MIANALYZE procedure was used in this study to perform the analysis of the MI data generated from the logistic regression18
21
NHTSArsquos National Center for Statistics and Analysis 1200 New Jersey Avenue SE Washington DC 20590
_______________________________________________________________________
41 Logistic Regression Results and Interpretation
Of all the variables considered in the logistic regression only 10 showed up as significant predictors (95 confidence level) As regards the interaction effect of these factors only the interaction of speeding with other variables was considered However only three of these interactions emerged as significant (95 confidence level) The results in Table 1 present estimates of regression coefficients and the corresponding odds ratio only for significant main effects and interactions Since the independent variables (predictors) are dichotomous the influence of the corresponding factors can be compared simply by comparing their regression coefficients
The ordered (decreasing) estimates of regression coefficients in Table 1 show that the most influential factor in the occurrence of fatal single-vehicle ROR crashes is the driver performance-related factor sleepy followed by alcohol use roadway alignment with curve speeding passenger car rural roadway number of lanes high-speed-limit road adverse weather and avoiding With regard to the interaction effect of speeding with other factors speeding with drivers of age groups 15 to 24 and 25 to 44 as well as speeding under adverse weather are significant contributors to the likelihood of ROR crashes
Table 1 Multiple Imputation Parameter Estimates Dagger
Variables Estimate Odds Ratio Driver performance-related factor sleepy vs others 11675 Dagger 321 Driver with alcohol BAC=01+ gdL vs BAC=0 06605 Dagger 194 Road alignment curve vs straight 05535 Dagger 174 Vehicle speeding status speeding vs non-speeding 04966 Dagger 164 Vehicle type passenger car vs other LTs 04780 Dagger 161 Road function rural vs urban 03637 Dagger 144 Roadway of lanes one or two (undivided) vs three amp more (undivided) 03346 Dagger 141 Road speed limit ge 60 mph vs lt60 mph 02659 Dagger 130 Weather adverse vs good 02130 Dagger 124 Driver performance-related factor avoiding vs others 02007 Dagger 122 Weather timesSpeeding status adverse amp speeding vs good amp non-speeding 01056 Dagger 111 Driver Age times Speeding status 25-44 amp speeding vs 65+ amp non-speeding 01003 Dagger 111 Driver Age times Speeding status 15-24 amp speeding vs 65+ amp non-speeding 00578 Dagger 106
Statistically significant variables (α = 005) associated with the high risk (odds ratio gt100) Other variables with low risk (odds ratio lt100) or insignificance (pgt005) after jointly estimating the effect are not shown here Dagger p-value lt00001
One of the most important by-product of logistic regression is the estimate of odds ratio that tells a great deal about the risk a certain factor carries in contributing to the occurrence of ROR crashes Specifically odds ratio measures the magnitude of increase in odds of happening of an event as a result of a unit increase in a predictor (eg sober and alcohol-used driver) An odds ratio value of 1 is indicative of no influence Table 1 also shows odds ratio estimates of significant factors and interactions
22
NHTSArsquos National Center for Statistics and Analysis 1200 New Jersey Avenue SE Washington DC 20590
_______________________________________________________________________
1
250 226
o 200
ita 164
Rd
s 150
d 124
O 100 100
050
Non-Speeding+Good Weather Non-Speeding+Adverse Weather
Speeding+Good Weather Speeding+Adverse Weather
Figure 15 Odds Ratio by Speeding Status and Weather Conditions
The odds ratio 321 for the factor ldquodriver performance-related factorrdquo shows that the odds of being involved in an ROR crash for a sleepy driver are three times as large as that for the driver who is not sleepy
The odds ratio 194 for the factor ldquodriver with alcoholrdquo shows that the odds of being involved in an ROR crash for an alcohol used driver (BAC=01+ gdL) are almost two times as large as that for a sober driver (BAC=0)
The odds ratio 174 for the factor ldquoroad alignmentrdquo shows that the odds of being involved in an ROR crash on curved roadways are 174 times as large as that on straight roadways in fatal single-vehicle crashes
The odds ratio 164 for the factor ldquovehicle speeding statusrdquo shows that the odds of being involved in an ROR crash for speeding vehicles are 164 times as large as that for non-speeding vehicles
The odds ratio 161 for the factor ldquovehicle typerdquo shows that the odds of being involved in an ROR crash for passenger cars are 161 times as large as that for other LTs
The odds ratio 144 for the factor ldquoroad functionrdquo shows that the odds of being involved in an ROR crash on rural roadways are 144 times as large as that on urban roadways
The odds ratio 266 for the factor ldquoweather amp speeding statusrdquo shows that the odds of being involved in an ROR crash under the adverse weather and in speeding vehicle are 266 (=164times124times111) times as large as that under the good weather and in non-speeding vehicle (Figure 15)
23
NHTSArsquos National Center for Statistics and Analysis 1200 New Jersey Avenue SE Washington DC 20590
_______________________________________________________________________
5 Conclusions
Run-off-road crashes account for a significant percentage (around 70) of all fatal single-vehicle crashes FARS data (1991 to 2007) that includes detailed information about ROR crashes provided sufficient statistical evidence to conclude that certain roadway- driver- environment- and vehicle-related factors closely associated with the occurrence of these crashes Appropriate crash countermeasures based on the identified factors can reduce the occurrence of single-vehicle ROR crashes and hence of the fatalities
Curved road segments rural roads high-speed-limit roadways and roadways with fewer lanes (divided or undivided) are found to be more likely to be the scene of fatal single-vehicle ROR crashes as compared to the fatal single-vehicle OR crashes Similarly among environmental factors adverse weather and night time periods are the factors associated with high risk of fatal single-vehicle ROR crashes
Vehicles with high occupancy (two and more occupants) male driver younger driver and alcohol used by driver are more likely to be involved in fatal single-vehicle ROR crashes as compared to the fatal single-vehicle OR crashes Drivers with performance-related factors (sleepy inattentive over-correction avoiding etc) are more likely to be involved in the fatal single-vehicle ROR crashes Speeding vehicles and passenger cars are also associated with high risks of the fatal single-vehicle ROR crashes
In the adverse weather condition and for the younger drivers (15 to 24 and 25 to 44) the speeding vehicle would increase the risk of fatal single-vehicle ROR crashes by an additional factor
The above facts based on statistical evidence suggest several crash countermeasures For example improving roadway design such as flattening curves and installing shoulder rumble strips or rehabilitation strategies such as building wide lanes or adding additional unpaved shoulder width on entire system providing skid-resistant pavement surfaces could reduce the likelihood of ROR crashes
24
NHTSArsquos National Center for Statistics and Analysis 1200 New Jersey Avenue SE Washington DC 20590
_______________________________________________________________________
6 References
1 FHWA (Undated) Reducing Highway Fatalities Washington DC Federal Highway Administration httpsafetyfhwadotgovroadway5Fdept
2 Neuman T RPfefer R Slack K L Council F McGee H Prothe L amp Eccles K (1998) Guidance for Implementation of the AASHTO Strategic Highway Safety Plan Report 500 Volume 6 A Guide for Addressing Run-Off Road Collisions Washington DC Transportation Research Board Available at httponlinepubstrborgonlinepubsnchrpnchrp_rpt_500v6pdf
3 Spainhour L K amp Mishra A (2007) Analysis of Fatal Run-off-the-Road Crashes Involving Overcorrection TRB 87th Annual Meeting Paper No 08-0661 Washington DC Transportation Research Board
4 McGee H W amp Hanscom F R Low-Cost Treatments for Horizontal Curve Safety FHWA-SA-07-002 December 2006
5 Johnston I Corben B TriggsT Candappa N amp Lenneacute M Reducing Serious Injury and Death from Run-off-Road Crashes in Victoria ndash Turning Knowledge into Action (2006 June) RACV Research Report Victoria Australia Royal Automobile Club of Victoria Ltd
6 Dissanayake S (2003 August) Young Drivers and Run-Off-the-Road Crashes Proceedings of the 2003 Mid-Continent Transportation Research Symposium Ames Iowa
7 Knapp K K Giese K L amp Lee W (2003 August) Urban Four-Lane Undivided to Three-Lane Roadway Conversion Guidelines Proceedings of the 2003 Mid-Continent Transportation Research Symposium Ames Iowa
8 Őrnek E amp Drakopoulos A (2007 August) Analysis of Run-Off-Road Crashes in Relation to Roadway Features and Driver Behavior Proceedings of the 2007 Mid-Continent Transportation Research Symposium Ames Iowa
9 Ray M H amp McGinnis R G (1997) Guardrail and Median Barrier Crashworthiness A Synthesis of Highway Practice NCHRP Synthesis 244 Washington DC Transportation Research Board National Research Council
10 Roadside Design Guide (2006) 3rd Edition Washington DC American Association of State Highway and Transportation Officials
25
NHTSArsquos National Center for Statistics and Analysis 1200 New Jersey Avenue SE Washington DC 20590
_______________________________________________________________________
11 Elvik R (1995) The Safety Value of Guardrails and Crash Cushions A Meta-Analysis of Evidence from Evaluation Studies Accident Analysis and Prevention 27 (4)
12 Stutts J C Reinfurth D W Staplin L amp Rodgman EA (2001 May) The Role of Driver Distraction in Traffic Crashes Washington DC AAA Foundation for Traffic Safety
13 Liu C Chen C-L Subramanian R amp Utter D (2005 June) Analysis of Speeding-Related Fatal Motor Vehicle Traffic Crashes NHTSA Technical Report DOT HS 809 839 Washington DC National Highway Traffic Safety Administration
14 Hosmer Jr D W and Lemeshow S (1989) Applied Logistic Regression New York John Wiley amp Sons Inc
15 SAS Institute Inc (1995) Logistic Regression Examples using SAS system Cary NC SAS Institute Inc
16 Rubin D B Schafer J L amp Subramanian R (1998 October) Multiple Imputation of Missing Blood Alcohol Concentration (BAC) Values in FARS NHTSA Technical Report DOT HS 808 816 Washington DC National Highway Traffic Safety Administration
17 Subramanian R (2005 March) Alcohol Involvement in Fatal Motor Vehicle Traffic Crashes NHTSA Technical Report DOT HS 809 822 Washington DC National Highway Traffic Safety Administration
18 SASSTAT Userrsquos Guide Version 8 1999 Cary NC SAS Institute Inc
26
NHTSArsquos National Center for Statistics and Analysis 1200 New Jersey Avenue SE Washington DC 20590
DOT HS 811 232November 2009
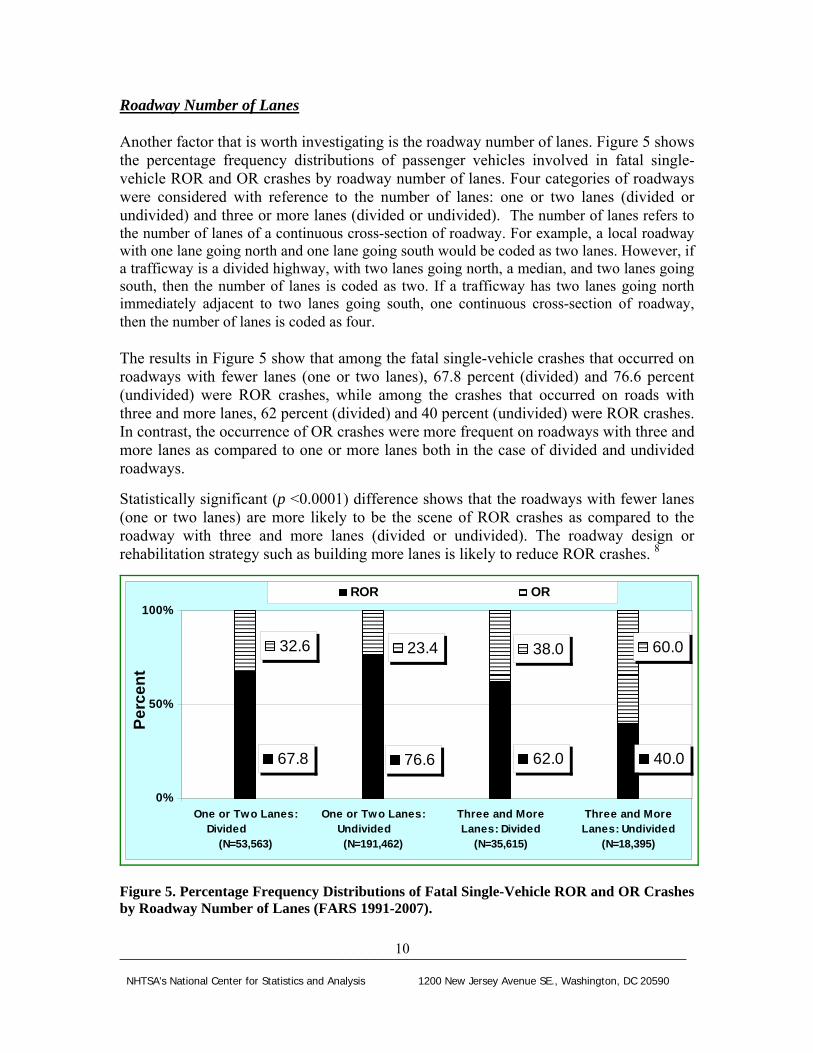
_______________________________________________________________________
312 Weather Conditions
To investigate if certain weather conditions contribute to the occurrence of ROR crashes the percentage frequency distributions of passenger vehicles involved in fatal single-vehicle ROR and OR crashes by weather conditions were obtained Two weather conditions were considered for this purpose adverse (rain sleet snow fog fog and others - smog smoke blowing sand or dust) and good weather conditions (normal or clear) The results are presented in Figure 6
Among fatal single-vehicle crashes that occurred during adverse weather conditions 755 percent were ROR crashes while among crashes that occurred during good weather conditions 70 percent were ROR crashes On the other hand OR crashes were more frequent in good weather conditions
The significant difference between the two percentages (p lt00001) shows that ROR crashes are more likely to occur in adverse weather conditions as compared to good weather conditions Improving roadway design (eg providing skid-resistant pavement surfaces) could reduce the likelihood of ROR crashes
755 700
245 300
0
50
100
Adverse Weather (N=34152) Good Weather (N=273242)
Pe
rce
nt
ROR OR
Figure 6 Percentage Frequency Distributions of Fatal Single-Vehicle ROR and OR Crashes by Weather Conditions (FARS 1991-2007)
11
NHTSArsquos National Center for Statistics and Analysis 1200 New Jersey Avenue SE Washington DC 20590
_______________________________________________________________________
ROR OR
100
50
0
Night Time (N=155199) Day Time (N=149945)
742 665
258 335
Pe
rce
nt
313 Natural Lighting Conditions
Could visibility due to natural lighting be an issue in the occurrence of ROR crashes To answer this question frequency analysis was conducted for two lighting conditions nighttime and daytime Figure 7 shows the percentage frequency distributions of passenger vehicles involved in fatal single-vehicle ROR and OR crashes by lighting conditions
Among fatal single-vehicle crashes that occurred during nighttime (8 pm ndash 559 am) 742 percent were ROR crashes while among the crashes that occurred during daytime (6 am ndash 759 pm) 665 percent were ROR crashes In contrast the occurrence of OR crashes are more frequent during day time
A χ2 test confirms that the difference between two percentages is statistically significant (p lt00001) This shows that the night time driving is more likely to result into ROR crashes as compared to the day time period Reduced lighting like adverse weather is associated with a significant increase in the likelihood of single-vehicle ROR crashes
Figure 7 Percentage Frequency Distributions of Fatal Single-Vehicle ROR and OR Crashes by Lighting Conditions (FARS 1991-2007)
12
NHTSArsquos National Center for Statistics and Analysis 1200 New Jersey Avenue SE Washington DC 20590
_______________________________________________________________________
ROR OR
680 748
320 252
0
50
100
Pe
rce
nt
One Occupant (Driver Alone) Two or More Occupants (N=183611) (N=125559)
32 Occupant-Related Factors
The occupant-related factors examined in the study include vehicle occupancy driverrsquos gender age alcohol use and driver performance-related factors such as sleep inattention over-correction of the vehicle etc
321 Occupancy
It is of interest to see if the occupancy of a vehicle makes a difference in the occurrence of ROR crashes Figure 8 shows the percentage frequency distributions of passenger vehicles involved in fatal single-vehicle ROR and OR crashes by vehicle occupancy
Among fatal single-vehicle crashes involving a vehicle with only one occupant (driver alone) 680 percent were ROR crashes while among crashes involving a vehicle with two or more occupants 748 percent were ROR crashes A χ2 test confirms the difference between these two percentages to be statistically significant (p lt00001)
This shows that vehicles with high occupancy (two or more occupants) are more likely to be involved in ROR crashes as compared to a vehicle with the driver alone The reason for this is not immediately clear However a possible explanation could be the fact that the presence of other occupants in the vehicle is a likely source of distraction to the driver due to conversation and other activities 12
Figure 8 Percentage Frequency Distributions of Fatal Single-Vehicle ROR and OR Crashes by Vehicle Occupancy (FARS 1991-2007)
13
NHTSArsquos National Center for Statistics and Analysis 1200 New Jersey Avenue SE Washington DC 20590
_______________________________________________________________________
722 665
278 335
ROR OR
100
50
0
Male Driver (N=230416) Female Driver (N=78754)
Pe
rce
nt
322 Driverrsquos Gender
Among many driver-related factors driver gender that could possibly contribute to the occurrence of ROR crashes was studied Figure 9 shows the percentage frequency distributions of passenger vehicles involved in fatal single-vehicle ROR and OR crashes by driverrsquos gender
Among fatal single-vehicle crashes involving male drivers 722 percent were ROR crashes while 665 percent crashes involving female drivers were ROR crashes In contrast the occurrence of OR crashes are more frequent for female drivers A χ2 test shows that the difference between the two percentages is statistically significant (p lt00001)
Thus one could infer that vehicles with the male drivers are more likely to be involved in ROR crashes as compared to the vehicles with the female drivers
Figure 9 Percentage Frequency Distributions of Fatal Single-Vehicle ROR and OR Crashes by Driverrsquos Gender (FARS 1991-2007)
14
NHTSArsquos National Center for Statistics and Analysis 1200 New Jersey Avenue SE Washington DC 20590
_______________________________________________________________________
323 Driverrsquos Age
To look into driver age as a contributing factor in ROR crashes four age groups were considered 15 to 24 25 to 44 45 to 64 and 65 and older Figure 10 shows the percentage frequency distributions of passenger vehicles involved in fatal single-vehicle ROR and OR crashes by these age groups
Among fatal single-vehicle crashes involving young drivers 15 to 24 a higher percentage (752 percent) were of ROR crashes as compared to other age groups This shows that vehicles with young drivers 15 to 24 are more likely to be involved in ROR crashes as compared to other three age groups
727 664 752 686
273 336 248 314
0
50
100
15-24 (N=102962)
25-44 (N=121728)
45-64 (N=55303)
65+ (N=27195)
Pe
rce
nt
ROR OR
Figure 10 Percentage Frequency Distributions of Fatal Single-Vehicle ROR and OR Crashes by Driverrsquos Age (FARS 1991-2007)
15
NHTSArsquos National Center for Statistics and Analysis 1200 New Jersey Avenue SE Washington DC 20590
_______________________________________________________________________
583 865
417 135
0
50
100
BAC=0 (N=172537) BAC=001+ (N=136633)
Pe
rce
nt
ROR OR
Figure 11 Percentage Frequency Distributions of Fatal Single-Vehicle ROR and OR Crashes by Driverrsquos Alcohol Use (FARS 1991-2007)
324 Alcohol-Related Driving
Alcohol involvement of a driver often leads to safety issues such as loss of vehicle control that may result into a ROR crash Two categories of drivers sober (BAC=0) and alcohol involved (BAC=01+) were considered in the analysis to see if alcohol use contributes to ROR crashes Figure 11 shows the percentage frequency distributions of passenger vehicles involved in fatal single-vehicle ROR and OR crashes by driverrsquos alcohol use
Among fatal single-vehicle crashes involving drivers with alcohol use (BAC=01+) 865 percent were ROR crashes while among those drivers with no alcohol (BAC=0) 583 percent were ROR crashes The difference between these two percentages is statistically significant (p lt00001) This indicates that the drivers with alcohol use are more likely to be involved in ROR crashes as compared to sober drivers
16
NHTSArsquos National Center for Statistics and Analysis 1200 New Jersey Avenue SE Washington DC 20590
_______________________________________________________________________
325 Driver-Performance-Related Factors
Some of the driver performance-related factors that are likely to contribute to the occurrence of ROR crashes were also examined
These include (1) sleepy (drowsy asleep fatigued and sleepy) (2) inattentive (talking eating etc) (3) over-correcting of the vehicle (4) avoiding (avoiding swerving or sliding due to severe crosswind tire blow-out or flat live animals in road vehicle in road etc) (5) distractions inside vehicles (cellular telephone computer fax machine etc) and (6) other driver-performance-related factors such as mentally challenged following improperly failure to signal intensions etc
Figure 12 shows the percentage frequency distributions of passenger vehicles involved in fatal single-vehicle ROR and OR crashes based on the driver performance-related factors The statistics show that the percentages of sleepy (912) inattentive (754) over correction of the vehicle (856) and crash avoiding (798) drivers involved in fatal single-vehicle ROR crashes are significantly greater (p lt00001) than the drivers with lsquoOther driver performance-related factorsrsquo that account for 67 percent of ROR crashes
This means that drivers with these performance-related factors (sleepy inattentive over correction avoiding etc) are more likely to be involved in ROR crashes as compared to drivers with other performance-related factors These results are consistent with those obtained from other studies using different approaches and other crash databases 2-11
17
NHTSArsquos National Center for Statistics and Analysis 1200 New Jersey Avenue SE Washington DC 20590
_______________________________________________________________________
672 671 798 856 754 912
328 329 202 144 246 88
0
20
40
60
80
100
Sleepy (N=14774)
Inattention (N=28081)
Overcorrect (N=19289)
Avoiding (N=14145)
Possible Distraction (N=1429)
Others (N=227587)
Per
cen
t
ROR OR
Figure 12 Percentage Frequency Distributions of Fatal Single-Vehicle ROR and OR Crashes by Driver Performance-Related Factors (FARS 1991-2007)
18
NHTSArsquos National Center for Statistics and Analysis 1200 New Jersey Avenue SE Washington DC 20590
_______________________________________________________________________
33 Vehicle-Related Factors
It is generally believed that ROR crashes are likely to occur due to some vehicle-related factors such as vehicle speeding or vehicle type
331 Vehicle Speeding Status
A crash is considered speeding-related if any driver involved in the crash is charged with a speeding-related offense or if a police officer indicates that racing driving too fast for the conditions or exceeding the posted speed limit was a related factor in the crash 13
Figure 13 shows the percentage frequency distributions of passenger vehicles involved in fatal single-vehicle ROR and OR crashes by vehicle speeding status
Among fatal single-vehicle crashes that involved a speeding vehicle 90 percent were ROR crashes while among crashes that did not involve a speeding vehicle 595 percent were ROR crashes A χ2 test shows that the difference between two percentages is statistically significant (p lt00001) thereby showing that speeding vehicles are more likely to be involved in ROR crashes as compared to non-speeding vehicles
900 595
100 405
0
50
100
Speeding (N=113825) Non-Speeding (N=195345)
Pe
rce
nt
ROR OR
Figure 13 Percentage Frequency Distributions of Fatal Single-Vehicle ROR and OR Crashes by Vehicle Speeding Status (FARS 1991-2007)
19
NHTSArsquos National Center for Statistics and Analysis 1200 New Jersey Avenue SE Washington DC 20590
_______________________________________________________________________
500 520 600 670 730 710
500 480 400 330 270 290
00
200
400
600
800
1000
Passenger Car
(N=178430)
LT Pickup
(N=72065)
LT Utility
(N=38970)
LT MiniVan
(N=11159)
LT Other Van (N=7904)
LT Others (N=642)
Pe
rce
nt
ROR OR
Figure 14 shows the percentage frequency distributions of passenger vehicles involved in fatal single-vehicle ROR and OR crashes by passenger vehicle type passenger car light truck (LT) including pickup utility minivan other van and other light trucks) It shows that passenger cars are more likely to be involved in ROR crashes as compared to other passenger vehicle types Minivans (60) are more likely to be involved in ROR crashes (p lt00001) as compared to other vans (52)
332 Vehicle Type
Figure 14 Percentage Frequency Distributions of Fatal Single-Vehicle ROR and OR Crashes by Vehicle Type (FARS 1991-2007)
20
NHTSArsquos National Center for Statistics and Analysis 1200 New Jersey Avenue SE Washington DC 20590
_______________________________________________________________________
4 Logistic Regression
The analysis in the previous sections shows that factors such as driver sleepiness alcohol use vehicle speeding curved roadway rural roads etc are significant contributors to the occurrence of fatal single-vehicle ROR crashes It remains to assess their relative influence as well as estimate the amount of risk each carries in the occurrence of such crashes Logistic regression was used for this purpose This is a modeling procedure that predicts the probability (p) of occurrence of an event (fatal single-vehicle ROR crash in the present case) as a consequence of certain roadway- driver- environment- and vehicle-related factors such as sleepy alcohol use weather condition lighting condition speeding status road function etc Generally the logistic regression model provides log of odds as a function of the predictors
Log (odds) = a0 + a1timesdriver performance-related factor + a2timesalcohol use + a3timesspeeding status + a4timesweather condition + a5timeslighting conditionhellip + aktimesspeeding statustimesweather condition + ak+1timesspeeding statustimesdriverrsquos age +helliphellip
where a0 is the intercept and a1 a2 a3 helliphellip ak ak+1 helliphellip are the regression coefficients
As in the previous analysis FARS data was used in the modeling procedure Since in FARS driverrsquos alcohol involvement is estimated by Multiple Imputation (MI) 16 17
procedure the SAS MIANALYZE procedure was used in this study to perform the analysis of the MI data generated from the logistic regression18
21
NHTSArsquos National Center for Statistics and Analysis 1200 New Jersey Avenue SE Washington DC 20590
_______________________________________________________________________
41 Logistic Regression Results and Interpretation
Of all the variables considered in the logistic regression only 10 showed up as significant predictors (95 confidence level) As regards the interaction effect of these factors only the interaction of speeding with other variables was considered However only three of these interactions emerged as significant (95 confidence level) The results in Table 1 present estimates of regression coefficients and the corresponding odds ratio only for significant main effects and interactions Since the independent variables (predictors) are dichotomous the influence of the corresponding factors can be compared simply by comparing their regression coefficients
The ordered (decreasing) estimates of regression coefficients in Table 1 show that the most influential factor in the occurrence of fatal single-vehicle ROR crashes is the driver performance-related factor sleepy followed by alcohol use roadway alignment with curve speeding passenger car rural roadway number of lanes high-speed-limit road adverse weather and avoiding With regard to the interaction effect of speeding with other factors speeding with drivers of age groups 15 to 24 and 25 to 44 as well as speeding under adverse weather are significant contributors to the likelihood of ROR crashes
Table 1 Multiple Imputation Parameter Estimates Dagger
Variables Estimate Odds Ratio Driver performance-related factor sleepy vs others 11675 Dagger 321 Driver with alcohol BAC=01+ gdL vs BAC=0 06605 Dagger 194 Road alignment curve vs straight 05535 Dagger 174 Vehicle speeding status speeding vs non-speeding 04966 Dagger 164 Vehicle type passenger car vs other LTs 04780 Dagger 161 Road function rural vs urban 03637 Dagger 144 Roadway of lanes one or two (undivided) vs three amp more (undivided) 03346 Dagger 141 Road speed limit ge 60 mph vs lt60 mph 02659 Dagger 130 Weather adverse vs good 02130 Dagger 124 Driver performance-related factor avoiding vs others 02007 Dagger 122 Weather timesSpeeding status adverse amp speeding vs good amp non-speeding 01056 Dagger 111 Driver Age times Speeding status 25-44 amp speeding vs 65+ amp non-speeding 01003 Dagger 111 Driver Age times Speeding status 15-24 amp speeding vs 65+ amp non-speeding 00578 Dagger 106
Statistically significant variables (α = 005) associated with the high risk (odds ratio gt100) Other variables with low risk (odds ratio lt100) or insignificance (pgt005) after jointly estimating the effect are not shown here Dagger p-value lt00001
One of the most important by-product of logistic regression is the estimate of odds ratio that tells a great deal about the risk a certain factor carries in contributing to the occurrence of ROR crashes Specifically odds ratio measures the magnitude of increase in odds of happening of an event as a result of a unit increase in a predictor (eg sober and alcohol-used driver) An odds ratio value of 1 is indicative of no influence Table 1 also shows odds ratio estimates of significant factors and interactions
22
NHTSArsquos National Center for Statistics and Analysis 1200 New Jersey Avenue SE Washington DC 20590
_______________________________________________________________________
1
250 226
o 200
ita 164
Rd
s 150
d 124
O 100 100
050
Non-Speeding+Good Weather Non-Speeding+Adverse Weather
Speeding+Good Weather Speeding+Adverse Weather
Figure 15 Odds Ratio by Speeding Status and Weather Conditions
The odds ratio 321 for the factor ldquodriver performance-related factorrdquo shows that the odds of being involved in an ROR crash for a sleepy driver are three times as large as that for the driver who is not sleepy
The odds ratio 194 for the factor ldquodriver with alcoholrdquo shows that the odds of being involved in an ROR crash for an alcohol used driver (BAC=01+ gdL) are almost two times as large as that for a sober driver (BAC=0)
The odds ratio 174 for the factor ldquoroad alignmentrdquo shows that the odds of being involved in an ROR crash on curved roadways are 174 times as large as that on straight roadways in fatal single-vehicle crashes
The odds ratio 164 for the factor ldquovehicle speeding statusrdquo shows that the odds of being involved in an ROR crash for speeding vehicles are 164 times as large as that for non-speeding vehicles
The odds ratio 161 for the factor ldquovehicle typerdquo shows that the odds of being involved in an ROR crash for passenger cars are 161 times as large as that for other LTs
The odds ratio 144 for the factor ldquoroad functionrdquo shows that the odds of being involved in an ROR crash on rural roadways are 144 times as large as that on urban roadways
The odds ratio 266 for the factor ldquoweather amp speeding statusrdquo shows that the odds of being involved in an ROR crash under the adverse weather and in speeding vehicle are 266 (=164times124times111) times as large as that under the good weather and in non-speeding vehicle (Figure 15)
23
NHTSArsquos National Center for Statistics and Analysis 1200 New Jersey Avenue SE Washington DC 20590
_______________________________________________________________________
5 Conclusions
Run-off-road crashes account for a significant percentage (around 70) of all fatal single-vehicle crashes FARS data (1991 to 2007) that includes detailed information about ROR crashes provided sufficient statistical evidence to conclude that certain roadway- driver- environment- and vehicle-related factors closely associated with the occurrence of these crashes Appropriate crash countermeasures based on the identified factors can reduce the occurrence of single-vehicle ROR crashes and hence of the fatalities
Curved road segments rural roads high-speed-limit roadways and roadways with fewer lanes (divided or undivided) are found to be more likely to be the scene of fatal single-vehicle ROR crashes as compared to the fatal single-vehicle OR crashes Similarly among environmental factors adverse weather and night time periods are the factors associated with high risk of fatal single-vehicle ROR crashes
Vehicles with high occupancy (two and more occupants) male driver younger driver and alcohol used by driver are more likely to be involved in fatal single-vehicle ROR crashes as compared to the fatal single-vehicle OR crashes Drivers with performance-related factors (sleepy inattentive over-correction avoiding etc) are more likely to be involved in the fatal single-vehicle ROR crashes Speeding vehicles and passenger cars are also associated with high risks of the fatal single-vehicle ROR crashes
In the adverse weather condition and for the younger drivers (15 to 24 and 25 to 44) the speeding vehicle would increase the risk of fatal single-vehicle ROR crashes by an additional factor
The above facts based on statistical evidence suggest several crash countermeasures For example improving roadway design such as flattening curves and installing shoulder rumble strips or rehabilitation strategies such as building wide lanes or adding additional unpaved shoulder width on entire system providing skid-resistant pavement surfaces could reduce the likelihood of ROR crashes
24
NHTSArsquos National Center for Statistics and Analysis 1200 New Jersey Avenue SE Washington DC 20590
_______________________________________________________________________
6 References
1 FHWA (Undated) Reducing Highway Fatalities Washington DC Federal Highway Administration httpsafetyfhwadotgovroadway5Fdept
2 Neuman T RPfefer R Slack K L Council F McGee H Prothe L amp Eccles K (1998) Guidance for Implementation of the AASHTO Strategic Highway Safety Plan Report 500 Volume 6 A Guide for Addressing Run-Off Road Collisions Washington DC Transportation Research Board Available at httponlinepubstrborgonlinepubsnchrpnchrp_rpt_500v6pdf
3 Spainhour L K amp Mishra A (2007) Analysis of Fatal Run-off-the-Road Crashes Involving Overcorrection TRB 87th Annual Meeting Paper No 08-0661 Washington DC Transportation Research Board
4 McGee H W amp Hanscom F R Low-Cost Treatments for Horizontal Curve Safety FHWA-SA-07-002 December 2006
5 Johnston I Corben B TriggsT Candappa N amp Lenneacute M Reducing Serious Injury and Death from Run-off-Road Crashes in Victoria ndash Turning Knowledge into Action (2006 June) RACV Research Report Victoria Australia Royal Automobile Club of Victoria Ltd
6 Dissanayake S (2003 August) Young Drivers and Run-Off-the-Road Crashes Proceedings of the 2003 Mid-Continent Transportation Research Symposium Ames Iowa
7 Knapp K K Giese K L amp Lee W (2003 August) Urban Four-Lane Undivided to Three-Lane Roadway Conversion Guidelines Proceedings of the 2003 Mid-Continent Transportation Research Symposium Ames Iowa
8 Őrnek E amp Drakopoulos A (2007 August) Analysis of Run-Off-Road Crashes in Relation to Roadway Features and Driver Behavior Proceedings of the 2007 Mid-Continent Transportation Research Symposium Ames Iowa
9 Ray M H amp McGinnis R G (1997) Guardrail and Median Barrier Crashworthiness A Synthesis of Highway Practice NCHRP Synthesis 244 Washington DC Transportation Research Board National Research Council
10 Roadside Design Guide (2006) 3rd Edition Washington DC American Association of State Highway and Transportation Officials
25
NHTSArsquos National Center for Statistics and Analysis 1200 New Jersey Avenue SE Washington DC 20590
_______________________________________________________________________
11 Elvik R (1995) The Safety Value of Guardrails and Crash Cushions A Meta-Analysis of Evidence from Evaluation Studies Accident Analysis and Prevention 27 (4)
12 Stutts J C Reinfurth D W Staplin L amp Rodgman EA (2001 May) The Role of Driver Distraction in Traffic Crashes Washington DC AAA Foundation for Traffic Safety
13 Liu C Chen C-L Subramanian R amp Utter D (2005 June) Analysis of Speeding-Related Fatal Motor Vehicle Traffic Crashes NHTSA Technical Report DOT HS 809 839 Washington DC National Highway Traffic Safety Administration
14 Hosmer Jr D W and Lemeshow S (1989) Applied Logistic Regression New York John Wiley amp Sons Inc
15 SAS Institute Inc (1995) Logistic Regression Examples using SAS system Cary NC SAS Institute Inc
16 Rubin D B Schafer J L amp Subramanian R (1998 October) Multiple Imputation of Missing Blood Alcohol Concentration (BAC) Values in FARS NHTSA Technical Report DOT HS 808 816 Washington DC National Highway Traffic Safety Administration
17 Subramanian R (2005 March) Alcohol Involvement in Fatal Motor Vehicle Traffic Crashes NHTSA Technical Report DOT HS 809 822 Washington DC National Highway Traffic Safety Administration
18 SASSTAT Userrsquos Guide Version 8 1999 Cary NC SAS Institute Inc
26
NHTSArsquos National Center for Statistics and Analysis 1200 New Jersey Avenue SE Washington DC 20590
DOT HS 811 232November 2009
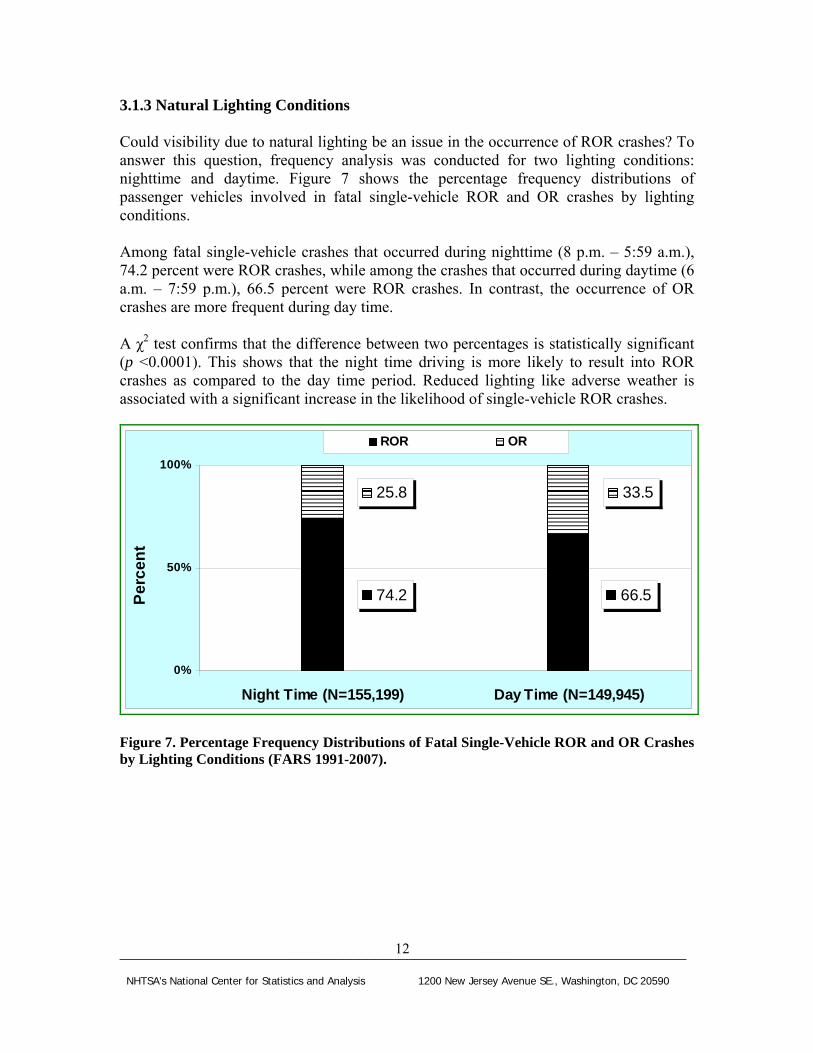
_______________________________________________________________________
ROR OR
100
50
0
Night Time (N=155199) Day Time (N=149945)
742 665
258 335
Pe
rce
nt
313 Natural Lighting Conditions
Could visibility due to natural lighting be an issue in the occurrence of ROR crashes To answer this question frequency analysis was conducted for two lighting conditions nighttime and daytime Figure 7 shows the percentage frequency distributions of passenger vehicles involved in fatal single-vehicle ROR and OR crashes by lighting conditions
Among fatal single-vehicle crashes that occurred during nighttime (8 pm ndash 559 am) 742 percent were ROR crashes while among the crashes that occurred during daytime (6 am ndash 759 pm) 665 percent were ROR crashes In contrast the occurrence of OR crashes are more frequent during day time
A χ2 test confirms that the difference between two percentages is statistically significant (p lt00001) This shows that the night time driving is more likely to result into ROR crashes as compared to the day time period Reduced lighting like adverse weather is associated with a significant increase in the likelihood of single-vehicle ROR crashes
Figure 7 Percentage Frequency Distributions of Fatal Single-Vehicle ROR and OR Crashes by Lighting Conditions (FARS 1991-2007)
12
NHTSArsquos National Center for Statistics and Analysis 1200 New Jersey Avenue SE Washington DC 20590
_______________________________________________________________________
ROR OR
680 748
320 252
0
50
100
Pe
rce
nt
One Occupant (Driver Alone) Two or More Occupants (N=183611) (N=125559)
32 Occupant-Related Factors
The occupant-related factors examined in the study include vehicle occupancy driverrsquos gender age alcohol use and driver performance-related factors such as sleep inattention over-correction of the vehicle etc
321 Occupancy
It is of interest to see if the occupancy of a vehicle makes a difference in the occurrence of ROR crashes Figure 8 shows the percentage frequency distributions of passenger vehicles involved in fatal single-vehicle ROR and OR crashes by vehicle occupancy
Among fatal single-vehicle crashes involving a vehicle with only one occupant (driver alone) 680 percent were ROR crashes while among crashes involving a vehicle with two or more occupants 748 percent were ROR crashes A χ2 test confirms the difference between these two percentages to be statistically significant (p lt00001)
This shows that vehicles with high occupancy (two or more occupants) are more likely to be involved in ROR crashes as compared to a vehicle with the driver alone The reason for this is not immediately clear However a possible explanation could be the fact that the presence of other occupants in the vehicle is a likely source of distraction to the driver due to conversation and other activities 12
Figure 8 Percentage Frequency Distributions of Fatal Single-Vehicle ROR and OR Crashes by Vehicle Occupancy (FARS 1991-2007)
13
NHTSArsquos National Center for Statistics and Analysis 1200 New Jersey Avenue SE Washington DC 20590
_______________________________________________________________________
722 665
278 335
ROR OR
100
50
0
Male Driver (N=230416) Female Driver (N=78754)
Pe
rce
nt
322 Driverrsquos Gender
Among many driver-related factors driver gender that could possibly contribute to the occurrence of ROR crashes was studied Figure 9 shows the percentage frequency distributions of passenger vehicles involved in fatal single-vehicle ROR and OR crashes by driverrsquos gender
Among fatal single-vehicle crashes involving male drivers 722 percent were ROR crashes while 665 percent crashes involving female drivers were ROR crashes In contrast the occurrence of OR crashes are more frequent for female drivers A χ2 test shows that the difference between the two percentages is statistically significant (p lt00001)
Thus one could infer that vehicles with the male drivers are more likely to be involved in ROR crashes as compared to the vehicles with the female drivers
Figure 9 Percentage Frequency Distributions of Fatal Single-Vehicle ROR and OR Crashes by Driverrsquos Gender (FARS 1991-2007)
14
NHTSArsquos National Center for Statistics and Analysis 1200 New Jersey Avenue SE Washington DC 20590
_______________________________________________________________________
323 Driverrsquos Age
To look into driver age as a contributing factor in ROR crashes four age groups were considered 15 to 24 25 to 44 45 to 64 and 65 and older Figure 10 shows the percentage frequency distributions of passenger vehicles involved in fatal single-vehicle ROR and OR crashes by these age groups
Among fatal single-vehicle crashes involving young drivers 15 to 24 a higher percentage (752 percent) were of ROR crashes as compared to other age groups This shows that vehicles with young drivers 15 to 24 are more likely to be involved in ROR crashes as compared to other three age groups
727 664 752 686
273 336 248 314
0
50
100
15-24 (N=102962)
25-44 (N=121728)
45-64 (N=55303)
65+ (N=27195)
Pe
rce
nt
ROR OR
Figure 10 Percentage Frequency Distributions of Fatal Single-Vehicle ROR and OR Crashes by Driverrsquos Age (FARS 1991-2007)
15
NHTSArsquos National Center for Statistics and Analysis 1200 New Jersey Avenue SE Washington DC 20590
_______________________________________________________________________
583 865
417 135
0
50
100
BAC=0 (N=172537) BAC=001+ (N=136633)
Pe
rce
nt
ROR OR
Figure 11 Percentage Frequency Distributions of Fatal Single-Vehicle ROR and OR Crashes by Driverrsquos Alcohol Use (FARS 1991-2007)
324 Alcohol-Related Driving
Alcohol involvement of a driver often leads to safety issues such as loss of vehicle control that may result into a ROR crash Two categories of drivers sober (BAC=0) and alcohol involved (BAC=01+) were considered in the analysis to see if alcohol use contributes to ROR crashes Figure 11 shows the percentage frequency distributions of passenger vehicles involved in fatal single-vehicle ROR and OR crashes by driverrsquos alcohol use
Among fatal single-vehicle crashes involving drivers with alcohol use (BAC=01+) 865 percent were ROR crashes while among those drivers with no alcohol (BAC=0) 583 percent were ROR crashes The difference between these two percentages is statistically significant (p lt00001) This indicates that the drivers with alcohol use are more likely to be involved in ROR crashes as compared to sober drivers
16
NHTSArsquos National Center for Statistics and Analysis 1200 New Jersey Avenue SE Washington DC 20590
_______________________________________________________________________
325 Driver-Performance-Related Factors
Some of the driver performance-related factors that are likely to contribute to the occurrence of ROR crashes were also examined
These include (1) sleepy (drowsy asleep fatigued and sleepy) (2) inattentive (talking eating etc) (3) over-correcting of the vehicle (4) avoiding (avoiding swerving or sliding due to severe crosswind tire blow-out or flat live animals in road vehicle in road etc) (5) distractions inside vehicles (cellular telephone computer fax machine etc) and (6) other driver-performance-related factors such as mentally challenged following improperly failure to signal intensions etc
Figure 12 shows the percentage frequency distributions of passenger vehicles involved in fatal single-vehicle ROR and OR crashes based on the driver performance-related factors The statistics show that the percentages of sleepy (912) inattentive (754) over correction of the vehicle (856) and crash avoiding (798) drivers involved in fatal single-vehicle ROR crashes are significantly greater (p lt00001) than the drivers with lsquoOther driver performance-related factorsrsquo that account for 67 percent of ROR crashes
This means that drivers with these performance-related factors (sleepy inattentive over correction avoiding etc) are more likely to be involved in ROR crashes as compared to drivers with other performance-related factors These results are consistent with those obtained from other studies using different approaches and other crash databases 2-11
17
NHTSArsquos National Center for Statistics and Analysis 1200 New Jersey Avenue SE Washington DC 20590
_______________________________________________________________________
672 671 798 856 754 912
328 329 202 144 246 88
0
20
40
60
80
100
Sleepy (N=14774)
Inattention (N=28081)
Overcorrect (N=19289)
Avoiding (N=14145)
Possible Distraction (N=1429)
Others (N=227587)
Per
cen
t
ROR OR
Figure 12 Percentage Frequency Distributions of Fatal Single-Vehicle ROR and OR Crashes by Driver Performance-Related Factors (FARS 1991-2007)
18
NHTSArsquos National Center for Statistics and Analysis 1200 New Jersey Avenue SE Washington DC 20590
_______________________________________________________________________
33 Vehicle-Related Factors
It is generally believed that ROR crashes are likely to occur due to some vehicle-related factors such as vehicle speeding or vehicle type
331 Vehicle Speeding Status
A crash is considered speeding-related if any driver involved in the crash is charged with a speeding-related offense or if a police officer indicates that racing driving too fast for the conditions or exceeding the posted speed limit was a related factor in the crash 13
Figure 13 shows the percentage frequency distributions of passenger vehicles involved in fatal single-vehicle ROR and OR crashes by vehicle speeding status
Among fatal single-vehicle crashes that involved a speeding vehicle 90 percent were ROR crashes while among crashes that did not involve a speeding vehicle 595 percent were ROR crashes A χ2 test shows that the difference between two percentages is statistically significant (p lt00001) thereby showing that speeding vehicles are more likely to be involved in ROR crashes as compared to non-speeding vehicles
900 595
100 405
0
50
100
Speeding (N=113825) Non-Speeding (N=195345)
Pe
rce
nt
ROR OR
Figure 13 Percentage Frequency Distributions of Fatal Single-Vehicle ROR and OR Crashes by Vehicle Speeding Status (FARS 1991-2007)
19
NHTSArsquos National Center for Statistics and Analysis 1200 New Jersey Avenue SE Washington DC 20590
_______________________________________________________________________
500 520 600 670 730 710
500 480 400 330 270 290
00
200
400
600
800
1000
Passenger Car
(N=178430)
LT Pickup
(N=72065)
LT Utility
(N=38970)
LT MiniVan
(N=11159)
LT Other Van (N=7904)
LT Others (N=642)
Pe
rce
nt
ROR OR
Figure 14 shows the percentage frequency distributions of passenger vehicles involved in fatal single-vehicle ROR and OR crashes by passenger vehicle type passenger car light truck (LT) including pickup utility minivan other van and other light trucks) It shows that passenger cars are more likely to be involved in ROR crashes as compared to other passenger vehicle types Minivans (60) are more likely to be involved in ROR crashes (p lt00001) as compared to other vans (52)
332 Vehicle Type
Figure 14 Percentage Frequency Distributions of Fatal Single-Vehicle ROR and OR Crashes by Vehicle Type (FARS 1991-2007)
20
NHTSArsquos National Center for Statistics and Analysis 1200 New Jersey Avenue SE Washington DC 20590
_______________________________________________________________________
4 Logistic Regression
The analysis in the previous sections shows that factors such as driver sleepiness alcohol use vehicle speeding curved roadway rural roads etc are significant contributors to the occurrence of fatal single-vehicle ROR crashes It remains to assess their relative influence as well as estimate the amount of risk each carries in the occurrence of such crashes Logistic regression was used for this purpose This is a modeling procedure that predicts the probability (p) of occurrence of an event (fatal single-vehicle ROR crash in the present case) as a consequence of certain roadway- driver- environment- and vehicle-related factors such as sleepy alcohol use weather condition lighting condition speeding status road function etc Generally the logistic regression model provides log of odds as a function of the predictors
Log (odds) = a0 + a1timesdriver performance-related factor + a2timesalcohol use + a3timesspeeding status + a4timesweather condition + a5timeslighting conditionhellip + aktimesspeeding statustimesweather condition + ak+1timesspeeding statustimesdriverrsquos age +helliphellip
where a0 is the intercept and a1 a2 a3 helliphellip ak ak+1 helliphellip are the regression coefficients
As in the previous analysis FARS data was used in the modeling procedure Since in FARS driverrsquos alcohol involvement is estimated by Multiple Imputation (MI) 16 17
procedure the SAS MIANALYZE procedure was used in this study to perform the analysis of the MI data generated from the logistic regression18
21
NHTSArsquos National Center for Statistics and Analysis 1200 New Jersey Avenue SE Washington DC 20590
_______________________________________________________________________
41 Logistic Regression Results and Interpretation
Of all the variables considered in the logistic regression only 10 showed up as significant predictors (95 confidence level) As regards the interaction effect of these factors only the interaction of speeding with other variables was considered However only three of these interactions emerged as significant (95 confidence level) The results in Table 1 present estimates of regression coefficients and the corresponding odds ratio only for significant main effects and interactions Since the independent variables (predictors) are dichotomous the influence of the corresponding factors can be compared simply by comparing their regression coefficients
The ordered (decreasing) estimates of regression coefficients in Table 1 show that the most influential factor in the occurrence of fatal single-vehicle ROR crashes is the driver performance-related factor sleepy followed by alcohol use roadway alignment with curve speeding passenger car rural roadway number of lanes high-speed-limit road adverse weather and avoiding With regard to the interaction effect of speeding with other factors speeding with drivers of age groups 15 to 24 and 25 to 44 as well as speeding under adverse weather are significant contributors to the likelihood of ROR crashes
Table 1 Multiple Imputation Parameter Estimates Dagger
Variables Estimate Odds Ratio Driver performance-related factor sleepy vs others 11675 Dagger 321 Driver with alcohol BAC=01+ gdL vs BAC=0 06605 Dagger 194 Road alignment curve vs straight 05535 Dagger 174 Vehicle speeding status speeding vs non-speeding 04966 Dagger 164 Vehicle type passenger car vs other LTs 04780 Dagger 161 Road function rural vs urban 03637 Dagger 144 Roadway of lanes one or two (undivided) vs three amp more (undivided) 03346 Dagger 141 Road speed limit ge 60 mph vs lt60 mph 02659 Dagger 130 Weather adverse vs good 02130 Dagger 124 Driver performance-related factor avoiding vs others 02007 Dagger 122 Weather timesSpeeding status adverse amp speeding vs good amp non-speeding 01056 Dagger 111 Driver Age times Speeding status 25-44 amp speeding vs 65+ amp non-speeding 01003 Dagger 111 Driver Age times Speeding status 15-24 amp speeding vs 65+ amp non-speeding 00578 Dagger 106
Statistically significant variables (α = 005) associated with the high risk (odds ratio gt100) Other variables with low risk (odds ratio lt100) or insignificance (pgt005) after jointly estimating the effect are not shown here Dagger p-value lt00001
One of the most important by-product of logistic regression is the estimate of odds ratio that tells a great deal about the risk a certain factor carries in contributing to the occurrence of ROR crashes Specifically odds ratio measures the magnitude of increase in odds of happening of an event as a result of a unit increase in a predictor (eg sober and alcohol-used driver) An odds ratio value of 1 is indicative of no influence Table 1 also shows odds ratio estimates of significant factors and interactions
22
NHTSArsquos National Center for Statistics and Analysis 1200 New Jersey Avenue SE Washington DC 20590
_______________________________________________________________________
1
250 226
o 200
ita 164
Rd
s 150
d 124
O 100 100
050
Non-Speeding+Good Weather Non-Speeding+Adverse Weather
Speeding+Good Weather Speeding+Adverse Weather
Figure 15 Odds Ratio by Speeding Status and Weather Conditions
The odds ratio 321 for the factor ldquodriver performance-related factorrdquo shows that the odds of being involved in an ROR crash for a sleepy driver are three times as large as that for the driver who is not sleepy
The odds ratio 194 for the factor ldquodriver with alcoholrdquo shows that the odds of being involved in an ROR crash for an alcohol used driver (BAC=01+ gdL) are almost two times as large as that for a sober driver (BAC=0)
The odds ratio 174 for the factor ldquoroad alignmentrdquo shows that the odds of being involved in an ROR crash on curved roadways are 174 times as large as that on straight roadways in fatal single-vehicle crashes
The odds ratio 164 for the factor ldquovehicle speeding statusrdquo shows that the odds of being involved in an ROR crash for speeding vehicles are 164 times as large as that for non-speeding vehicles
The odds ratio 161 for the factor ldquovehicle typerdquo shows that the odds of being involved in an ROR crash for passenger cars are 161 times as large as that for other LTs
The odds ratio 144 for the factor ldquoroad functionrdquo shows that the odds of being involved in an ROR crash on rural roadways are 144 times as large as that on urban roadways
The odds ratio 266 for the factor ldquoweather amp speeding statusrdquo shows that the odds of being involved in an ROR crash under the adverse weather and in speeding vehicle are 266 (=164times124times111) times as large as that under the good weather and in non-speeding vehicle (Figure 15)
23
NHTSArsquos National Center for Statistics and Analysis 1200 New Jersey Avenue SE Washington DC 20590
_______________________________________________________________________
5 Conclusions
Run-off-road crashes account for a significant percentage (around 70) of all fatal single-vehicle crashes FARS data (1991 to 2007) that includes detailed information about ROR crashes provided sufficient statistical evidence to conclude that certain roadway- driver- environment- and vehicle-related factors closely associated with the occurrence of these crashes Appropriate crash countermeasures based on the identified factors can reduce the occurrence of single-vehicle ROR crashes and hence of the fatalities
Curved road segments rural roads high-speed-limit roadways and roadways with fewer lanes (divided or undivided) are found to be more likely to be the scene of fatal single-vehicle ROR crashes as compared to the fatal single-vehicle OR crashes Similarly among environmental factors adverse weather and night time periods are the factors associated with high risk of fatal single-vehicle ROR crashes
Vehicles with high occupancy (two and more occupants) male driver younger driver and alcohol used by driver are more likely to be involved in fatal single-vehicle ROR crashes as compared to the fatal single-vehicle OR crashes Drivers with performance-related factors (sleepy inattentive over-correction avoiding etc) are more likely to be involved in the fatal single-vehicle ROR crashes Speeding vehicles and passenger cars are also associated with high risks of the fatal single-vehicle ROR crashes
In the adverse weather condition and for the younger drivers (15 to 24 and 25 to 44) the speeding vehicle would increase the risk of fatal single-vehicle ROR crashes by an additional factor
The above facts based on statistical evidence suggest several crash countermeasures For example improving roadway design such as flattening curves and installing shoulder rumble strips or rehabilitation strategies such as building wide lanes or adding additional unpaved shoulder width on entire system providing skid-resistant pavement surfaces could reduce the likelihood of ROR crashes
24
NHTSArsquos National Center for Statistics and Analysis 1200 New Jersey Avenue SE Washington DC 20590
_______________________________________________________________________
6 References
1 FHWA (Undated) Reducing Highway Fatalities Washington DC Federal Highway Administration httpsafetyfhwadotgovroadway5Fdept
2 Neuman T RPfefer R Slack K L Council F McGee H Prothe L amp Eccles K (1998) Guidance for Implementation of the AASHTO Strategic Highway Safety Plan Report 500 Volume 6 A Guide for Addressing Run-Off Road Collisions Washington DC Transportation Research Board Available at httponlinepubstrborgonlinepubsnchrpnchrp_rpt_500v6pdf
3 Spainhour L K amp Mishra A (2007) Analysis of Fatal Run-off-the-Road Crashes Involving Overcorrection TRB 87th Annual Meeting Paper No 08-0661 Washington DC Transportation Research Board
4 McGee H W amp Hanscom F R Low-Cost Treatments for Horizontal Curve Safety FHWA-SA-07-002 December 2006
5 Johnston I Corben B TriggsT Candappa N amp Lenneacute M Reducing Serious Injury and Death from Run-off-Road Crashes in Victoria ndash Turning Knowledge into Action (2006 June) RACV Research Report Victoria Australia Royal Automobile Club of Victoria Ltd
6 Dissanayake S (2003 August) Young Drivers and Run-Off-the-Road Crashes Proceedings of the 2003 Mid-Continent Transportation Research Symposium Ames Iowa
7 Knapp K K Giese K L amp Lee W (2003 August) Urban Four-Lane Undivided to Three-Lane Roadway Conversion Guidelines Proceedings of the 2003 Mid-Continent Transportation Research Symposium Ames Iowa
8 Őrnek E amp Drakopoulos A (2007 August) Analysis of Run-Off-Road Crashes in Relation to Roadway Features and Driver Behavior Proceedings of the 2007 Mid-Continent Transportation Research Symposium Ames Iowa
9 Ray M H amp McGinnis R G (1997) Guardrail and Median Barrier Crashworthiness A Synthesis of Highway Practice NCHRP Synthesis 244 Washington DC Transportation Research Board National Research Council
10 Roadside Design Guide (2006) 3rd Edition Washington DC American Association of State Highway and Transportation Officials
25
NHTSArsquos National Center for Statistics and Analysis 1200 New Jersey Avenue SE Washington DC 20590
_______________________________________________________________________
11 Elvik R (1995) The Safety Value of Guardrails and Crash Cushions A Meta-Analysis of Evidence from Evaluation Studies Accident Analysis and Prevention 27 (4)
12 Stutts J C Reinfurth D W Staplin L amp Rodgman EA (2001 May) The Role of Driver Distraction in Traffic Crashes Washington DC AAA Foundation for Traffic Safety
13 Liu C Chen C-L Subramanian R amp Utter D (2005 June) Analysis of Speeding-Related Fatal Motor Vehicle Traffic Crashes NHTSA Technical Report DOT HS 809 839 Washington DC National Highway Traffic Safety Administration
14 Hosmer Jr D W and Lemeshow S (1989) Applied Logistic Regression New York John Wiley amp Sons Inc
15 SAS Institute Inc (1995) Logistic Regression Examples using SAS system Cary NC SAS Institute Inc
16 Rubin D B Schafer J L amp Subramanian R (1998 October) Multiple Imputation of Missing Blood Alcohol Concentration (BAC) Values in FARS NHTSA Technical Report DOT HS 808 816 Washington DC National Highway Traffic Safety Administration
17 Subramanian R (2005 March) Alcohol Involvement in Fatal Motor Vehicle Traffic Crashes NHTSA Technical Report DOT HS 809 822 Washington DC National Highway Traffic Safety Administration
18 SASSTAT Userrsquos Guide Version 8 1999 Cary NC SAS Institute Inc
26
NHTSArsquos National Center for Statistics and Analysis 1200 New Jersey Avenue SE Washington DC 20590
DOT HS 811 232November 2009
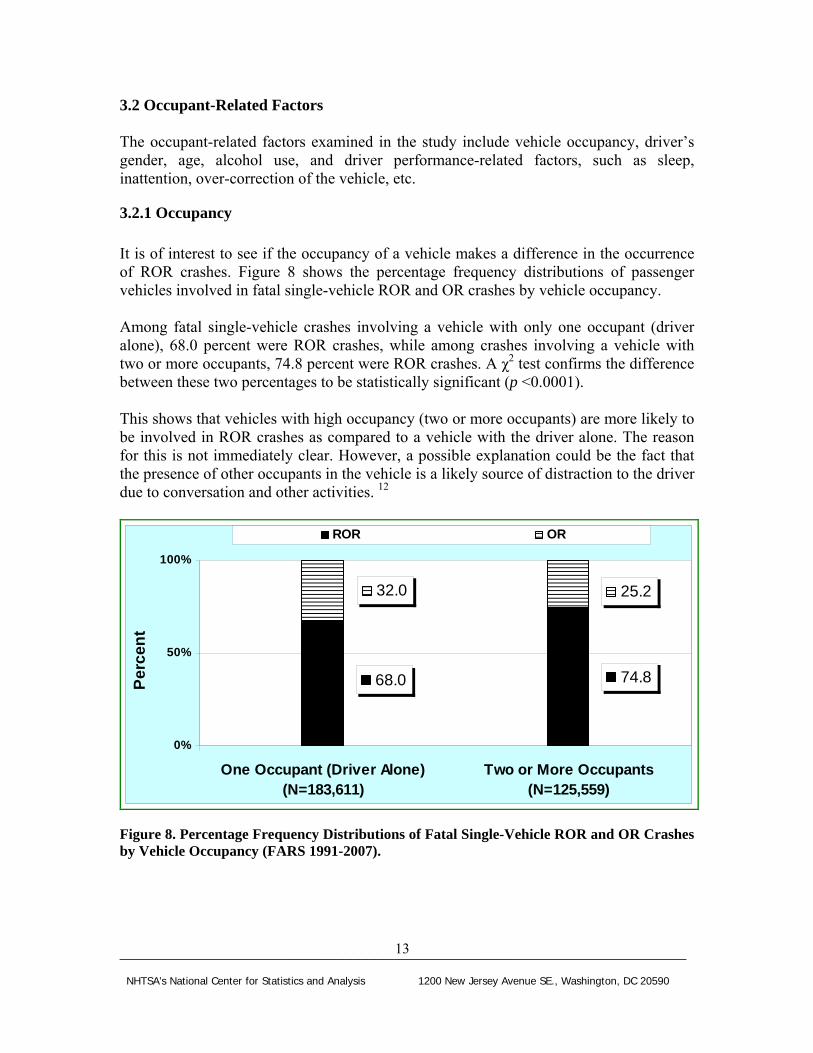
_______________________________________________________________________
ROR OR
680 748
320 252
0
50
100
Pe
rce
nt
One Occupant (Driver Alone) Two or More Occupants (N=183611) (N=125559)
32 Occupant-Related Factors
The occupant-related factors examined in the study include vehicle occupancy driverrsquos gender age alcohol use and driver performance-related factors such as sleep inattention over-correction of the vehicle etc
321 Occupancy
It is of interest to see if the occupancy of a vehicle makes a difference in the occurrence of ROR crashes Figure 8 shows the percentage frequency distributions of passenger vehicles involved in fatal single-vehicle ROR and OR crashes by vehicle occupancy
Among fatal single-vehicle crashes involving a vehicle with only one occupant (driver alone) 680 percent were ROR crashes while among crashes involving a vehicle with two or more occupants 748 percent were ROR crashes A χ2 test confirms the difference between these two percentages to be statistically significant (p lt00001)
This shows that vehicles with high occupancy (two or more occupants) are more likely to be involved in ROR crashes as compared to a vehicle with the driver alone The reason for this is not immediately clear However a possible explanation could be the fact that the presence of other occupants in the vehicle is a likely source of distraction to the driver due to conversation and other activities 12
Figure 8 Percentage Frequency Distributions of Fatal Single-Vehicle ROR and OR Crashes by Vehicle Occupancy (FARS 1991-2007)
13
NHTSArsquos National Center for Statistics and Analysis 1200 New Jersey Avenue SE Washington DC 20590
_______________________________________________________________________
722 665
278 335
ROR OR
100
50
0
Male Driver (N=230416) Female Driver (N=78754)
Pe
rce
nt
322 Driverrsquos Gender
Among many driver-related factors driver gender that could possibly contribute to the occurrence of ROR crashes was studied Figure 9 shows the percentage frequency distributions of passenger vehicles involved in fatal single-vehicle ROR and OR crashes by driverrsquos gender
Among fatal single-vehicle crashes involving male drivers 722 percent were ROR crashes while 665 percent crashes involving female drivers were ROR crashes In contrast the occurrence of OR crashes are more frequent for female drivers A χ2 test shows that the difference between the two percentages is statistically significant (p lt00001)
Thus one could infer that vehicles with the male drivers are more likely to be involved in ROR crashes as compared to the vehicles with the female drivers
Figure 9 Percentage Frequency Distributions of Fatal Single-Vehicle ROR and OR Crashes by Driverrsquos Gender (FARS 1991-2007)
14
NHTSArsquos National Center for Statistics and Analysis 1200 New Jersey Avenue SE Washington DC 20590
_______________________________________________________________________
323 Driverrsquos Age
To look into driver age as a contributing factor in ROR crashes four age groups were considered 15 to 24 25 to 44 45 to 64 and 65 and older Figure 10 shows the percentage frequency distributions of passenger vehicles involved in fatal single-vehicle ROR and OR crashes by these age groups
Among fatal single-vehicle crashes involving young drivers 15 to 24 a higher percentage (752 percent) were of ROR crashes as compared to other age groups This shows that vehicles with young drivers 15 to 24 are more likely to be involved in ROR crashes as compared to other three age groups
727 664 752 686
273 336 248 314
0
50
100
15-24 (N=102962)
25-44 (N=121728)
45-64 (N=55303)
65+ (N=27195)
Pe
rce
nt
ROR OR
Figure 10 Percentage Frequency Distributions of Fatal Single-Vehicle ROR and OR Crashes by Driverrsquos Age (FARS 1991-2007)
15
NHTSArsquos National Center for Statistics and Analysis 1200 New Jersey Avenue SE Washington DC 20590
_______________________________________________________________________
583 865
417 135
0
50
100
BAC=0 (N=172537) BAC=001+ (N=136633)
Pe
rce
nt
ROR OR
Figure 11 Percentage Frequency Distributions of Fatal Single-Vehicle ROR and OR Crashes by Driverrsquos Alcohol Use (FARS 1991-2007)
324 Alcohol-Related Driving
Alcohol involvement of a driver often leads to safety issues such as loss of vehicle control that may result into a ROR crash Two categories of drivers sober (BAC=0) and alcohol involved (BAC=01+) were considered in the analysis to see if alcohol use contributes to ROR crashes Figure 11 shows the percentage frequency distributions of passenger vehicles involved in fatal single-vehicle ROR and OR crashes by driverrsquos alcohol use
Among fatal single-vehicle crashes involving drivers with alcohol use (BAC=01+) 865 percent were ROR crashes while among those drivers with no alcohol (BAC=0) 583 percent were ROR crashes The difference between these two percentages is statistically significant (p lt00001) This indicates that the drivers with alcohol use are more likely to be involved in ROR crashes as compared to sober drivers
16
NHTSArsquos National Center for Statistics and Analysis 1200 New Jersey Avenue SE Washington DC 20590
_______________________________________________________________________
325 Driver-Performance-Related Factors
Some of the driver performance-related factors that are likely to contribute to the occurrence of ROR crashes were also examined
These include (1) sleepy (drowsy asleep fatigued and sleepy) (2) inattentive (talking eating etc) (3) over-correcting of the vehicle (4) avoiding (avoiding swerving or sliding due to severe crosswind tire blow-out or flat live animals in road vehicle in road etc) (5) distractions inside vehicles (cellular telephone computer fax machine etc) and (6) other driver-performance-related factors such as mentally challenged following improperly failure to signal intensions etc
Figure 12 shows the percentage frequency distributions of passenger vehicles involved in fatal single-vehicle ROR and OR crashes based on the driver performance-related factors The statistics show that the percentages of sleepy (912) inattentive (754) over correction of the vehicle (856) and crash avoiding (798) drivers involved in fatal single-vehicle ROR crashes are significantly greater (p lt00001) than the drivers with lsquoOther driver performance-related factorsrsquo that account for 67 percent of ROR crashes
This means that drivers with these performance-related factors (sleepy inattentive over correction avoiding etc) are more likely to be involved in ROR crashes as compared to drivers with other performance-related factors These results are consistent with those obtained from other studies using different approaches and other crash databases 2-11
17
NHTSArsquos National Center for Statistics and Analysis 1200 New Jersey Avenue SE Washington DC 20590
_______________________________________________________________________
672 671 798 856 754 912
328 329 202 144 246 88
0
20
40
60
80
100
Sleepy (N=14774)
Inattention (N=28081)
Overcorrect (N=19289)
Avoiding (N=14145)
Possible Distraction (N=1429)
Others (N=227587)
Per
cen
t
ROR OR
Figure 12 Percentage Frequency Distributions of Fatal Single-Vehicle ROR and OR Crashes by Driver Performance-Related Factors (FARS 1991-2007)
18
NHTSArsquos National Center for Statistics and Analysis 1200 New Jersey Avenue SE Washington DC 20590
_______________________________________________________________________
33 Vehicle-Related Factors
It is generally believed that ROR crashes are likely to occur due to some vehicle-related factors such as vehicle speeding or vehicle type
331 Vehicle Speeding Status
A crash is considered speeding-related if any driver involved in the crash is charged with a speeding-related offense or if a police officer indicates that racing driving too fast for the conditions or exceeding the posted speed limit was a related factor in the crash 13
Figure 13 shows the percentage frequency distributions of passenger vehicles involved in fatal single-vehicle ROR and OR crashes by vehicle speeding status
Among fatal single-vehicle crashes that involved a speeding vehicle 90 percent were ROR crashes while among crashes that did not involve a speeding vehicle 595 percent were ROR crashes A χ2 test shows that the difference between two percentages is statistically significant (p lt00001) thereby showing that speeding vehicles are more likely to be involved in ROR crashes as compared to non-speeding vehicles
900 595
100 405
0
50
100
Speeding (N=113825) Non-Speeding (N=195345)
Pe
rce
nt
ROR OR
Figure 13 Percentage Frequency Distributions of Fatal Single-Vehicle ROR and OR Crashes by Vehicle Speeding Status (FARS 1991-2007)
19
NHTSArsquos National Center for Statistics and Analysis 1200 New Jersey Avenue SE Washington DC 20590
_______________________________________________________________________
500 520 600 670 730 710
500 480 400 330 270 290
00
200
400
600
800
1000
Passenger Car
(N=178430)
LT Pickup
(N=72065)
LT Utility
(N=38970)
LT MiniVan
(N=11159)
LT Other Van (N=7904)
LT Others (N=642)
Pe
rce
nt
ROR OR
Figure 14 shows the percentage frequency distributions of passenger vehicles involved in fatal single-vehicle ROR and OR crashes by passenger vehicle type passenger car light truck (LT) including pickup utility minivan other van and other light trucks) It shows that passenger cars are more likely to be involved in ROR crashes as compared to other passenger vehicle types Minivans (60) are more likely to be involved in ROR crashes (p lt00001) as compared to other vans (52)
332 Vehicle Type
Figure 14 Percentage Frequency Distributions of Fatal Single-Vehicle ROR and OR Crashes by Vehicle Type (FARS 1991-2007)
20
NHTSArsquos National Center for Statistics and Analysis 1200 New Jersey Avenue SE Washington DC 20590
_______________________________________________________________________
4 Logistic Regression
The analysis in the previous sections shows that factors such as driver sleepiness alcohol use vehicle speeding curved roadway rural roads etc are significant contributors to the occurrence of fatal single-vehicle ROR crashes It remains to assess their relative influence as well as estimate the amount of risk each carries in the occurrence of such crashes Logistic regression was used for this purpose This is a modeling procedure that predicts the probability (p) of occurrence of an event (fatal single-vehicle ROR crash in the present case) as a consequence of certain roadway- driver- environment- and vehicle-related factors such as sleepy alcohol use weather condition lighting condition speeding status road function etc Generally the logistic regression model provides log of odds as a function of the predictors
Log (odds) = a0 + a1timesdriver performance-related factor + a2timesalcohol use + a3timesspeeding status + a4timesweather condition + a5timeslighting conditionhellip + aktimesspeeding statustimesweather condition + ak+1timesspeeding statustimesdriverrsquos age +helliphellip
where a0 is the intercept and a1 a2 a3 helliphellip ak ak+1 helliphellip are the regression coefficients
As in the previous analysis FARS data was used in the modeling procedure Since in FARS driverrsquos alcohol involvement is estimated by Multiple Imputation (MI) 16 17
procedure the SAS MIANALYZE procedure was used in this study to perform the analysis of the MI data generated from the logistic regression18
21
NHTSArsquos National Center for Statistics and Analysis 1200 New Jersey Avenue SE Washington DC 20590
_______________________________________________________________________
41 Logistic Regression Results and Interpretation
Of all the variables considered in the logistic regression only 10 showed up as significant predictors (95 confidence level) As regards the interaction effect of these factors only the interaction of speeding with other variables was considered However only three of these interactions emerged as significant (95 confidence level) The results in Table 1 present estimates of regression coefficients and the corresponding odds ratio only for significant main effects and interactions Since the independent variables (predictors) are dichotomous the influence of the corresponding factors can be compared simply by comparing their regression coefficients
The ordered (decreasing) estimates of regression coefficients in Table 1 show that the most influential factor in the occurrence of fatal single-vehicle ROR crashes is the driver performance-related factor sleepy followed by alcohol use roadway alignment with curve speeding passenger car rural roadway number of lanes high-speed-limit road adverse weather and avoiding With regard to the interaction effect of speeding with other factors speeding with drivers of age groups 15 to 24 and 25 to 44 as well as speeding under adverse weather are significant contributors to the likelihood of ROR crashes
Table 1 Multiple Imputation Parameter Estimates Dagger
Variables Estimate Odds Ratio Driver performance-related factor sleepy vs others 11675 Dagger 321 Driver with alcohol BAC=01+ gdL vs BAC=0 06605 Dagger 194 Road alignment curve vs straight 05535 Dagger 174 Vehicle speeding status speeding vs non-speeding 04966 Dagger 164 Vehicle type passenger car vs other LTs 04780 Dagger 161 Road function rural vs urban 03637 Dagger 144 Roadway of lanes one or two (undivided) vs three amp more (undivided) 03346 Dagger 141 Road speed limit ge 60 mph vs lt60 mph 02659 Dagger 130 Weather adverse vs good 02130 Dagger 124 Driver performance-related factor avoiding vs others 02007 Dagger 122 Weather timesSpeeding status adverse amp speeding vs good amp non-speeding 01056 Dagger 111 Driver Age times Speeding status 25-44 amp speeding vs 65+ amp non-speeding 01003 Dagger 111 Driver Age times Speeding status 15-24 amp speeding vs 65+ amp non-speeding 00578 Dagger 106
Statistically significant variables (α = 005) associated with the high risk (odds ratio gt100) Other variables with low risk (odds ratio lt100) or insignificance (pgt005) after jointly estimating the effect are not shown here Dagger p-value lt00001
One of the most important by-product of logistic regression is the estimate of odds ratio that tells a great deal about the risk a certain factor carries in contributing to the occurrence of ROR crashes Specifically odds ratio measures the magnitude of increase in odds of happening of an event as a result of a unit increase in a predictor (eg sober and alcohol-used driver) An odds ratio value of 1 is indicative of no influence Table 1 also shows odds ratio estimates of significant factors and interactions
22
NHTSArsquos National Center for Statistics and Analysis 1200 New Jersey Avenue SE Washington DC 20590
_______________________________________________________________________
1
250 226
o 200
ita 164
Rd
s 150
d 124
O 100 100
050
Non-Speeding+Good Weather Non-Speeding+Adverse Weather
Speeding+Good Weather Speeding+Adverse Weather
Figure 15 Odds Ratio by Speeding Status and Weather Conditions
The odds ratio 321 for the factor ldquodriver performance-related factorrdquo shows that the odds of being involved in an ROR crash for a sleepy driver are three times as large as that for the driver who is not sleepy
The odds ratio 194 for the factor ldquodriver with alcoholrdquo shows that the odds of being involved in an ROR crash for an alcohol used driver (BAC=01+ gdL) are almost two times as large as that for a sober driver (BAC=0)
The odds ratio 174 for the factor ldquoroad alignmentrdquo shows that the odds of being involved in an ROR crash on curved roadways are 174 times as large as that on straight roadways in fatal single-vehicle crashes
The odds ratio 164 for the factor ldquovehicle speeding statusrdquo shows that the odds of being involved in an ROR crash for speeding vehicles are 164 times as large as that for non-speeding vehicles
The odds ratio 161 for the factor ldquovehicle typerdquo shows that the odds of being involved in an ROR crash for passenger cars are 161 times as large as that for other LTs
The odds ratio 144 for the factor ldquoroad functionrdquo shows that the odds of being involved in an ROR crash on rural roadways are 144 times as large as that on urban roadways
The odds ratio 266 for the factor ldquoweather amp speeding statusrdquo shows that the odds of being involved in an ROR crash under the adverse weather and in speeding vehicle are 266 (=164times124times111) times as large as that under the good weather and in non-speeding vehicle (Figure 15)
23
NHTSArsquos National Center for Statistics and Analysis 1200 New Jersey Avenue SE Washington DC 20590
_______________________________________________________________________
5 Conclusions
Run-off-road crashes account for a significant percentage (around 70) of all fatal single-vehicle crashes FARS data (1991 to 2007) that includes detailed information about ROR crashes provided sufficient statistical evidence to conclude that certain roadway- driver- environment- and vehicle-related factors closely associated with the occurrence of these crashes Appropriate crash countermeasures based on the identified factors can reduce the occurrence of single-vehicle ROR crashes and hence of the fatalities
Curved road segments rural roads high-speed-limit roadways and roadways with fewer lanes (divided or undivided) are found to be more likely to be the scene of fatal single-vehicle ROR crashes as compared to the fatal single-vehicle OR crashes Similarly among environmental factors adverse weather and night time periods are the factors associated with high risk of fatal single-vehicle ROR crashes
Vehicles with high occupancy (two and more occupants) male driver younger driver and alcohol used by driver are more likely to be involved in fatal single-vehicle ROR crashes as compared to the fatal single-vehicle OR crashes Drivers with performance-related factors (sleepy inattentive over-correction avoiding etc) are more likely to be involved in the fatal single-vehicle ROR crashes Speeding vehicles and passenger cars are also associated with high risks of the fatal single-vehicle ROR crashes
In the adverse weather condition and for the younger drivers (15 to 24 and 25 to 44) the speeding vehicle would increase the risk of fatal single-vehicle ROR crashes by an additional factor
The above facts based on statistical evidence suggest several crash countermeasures For example improving roadway design such as flattening curves and installing shoulder rumble strips or rehabilitation strategies such as building wide lanes or adding additional unpaved shoulder width on entire system providing skid-resistant pavement surfaces could reduce the likelihood of ROR crashes
24
NHTSArsquos National Center for Statistics and Analysis 1200 New Jersey Avenue SE Washington DC 20590
_______________________________________________________________________
6 References
1 FHWA (Undated) Reducing Highway Fatalities Washington DC Federal Highway Administration httpsafetyfhwadotgovroadway5Fdept
2 Neuman T RPfefer R Slack K L Council F McGee H Prothe L amp Eccles K (1998) Guidance for Implementation of the AASHTO Strategic Highway Safety Plan Report 500 Volume 6 A Guide for Addressing Run-Off Road Collisions Washington DC Transportation Research Board Available at httponlinepubstrborgonlinepubsnchrpnchrp_rpt_500v6pdf
3 Spainhour L K amp Mishra A (2007) Analysis of Fatal Run-off-the-Road Crashes Involving Overcorrection TRB 87th Annual Meeting Paper No 08-0661 Washington DC Transportation Research Board
4 McGee H W amp Hanscom F R Low-Cost Treatments for Horizontal Curve Safety FHWA-SA-07-002 December 2006
5 Johnston I Corben B TriggsT Candappa N amp Lenneacute M Reducing Serious Injury and Death from Run-off-Road Crashes in Victoria ndash Turning Knowledge into Action (2006 June) RACV Research Report Victoria Australia Royal Automobile Club of Victoria Ltd
6 Dissanayake S (2003 August) Young Drivers and Run-Off-the-Road Crashes Proceedings of the 2003 Mid-Continent Transportation Research Symposium Ames Iowa
7 Knapp K K Giese K L amp Lee W (2003 August) Urban Four-Lane Undivided to Three-Lane Roadway Conversion Guidelines Proceedings of the 2003 Mid-Continent Transportation Research Symposium Ames Iowa
8 Őrnek E amp Drakopoulos A (2007 August) Analysis of Run-Off-Road Crashes in Relation to Roadway Features and Driver Behavior Proceedings of the 2007 Mid-Continent Transportation Research Symposium Ames Iowa
9 Ray M H amp McGinnis R G (1997) Guardrail and Median Barrier Crashworthiness A Synthesis of Highway Practice NCHRP Synthesis 244 Washington DC Transportation Research Board National Research Council
10 Roadside Design Guide (2006) 3rd Edition Washington DC American Association of State Highway and Transportation Officials
25
NHTSArsquos National Center for Statistics and Analysis 1200 New Jersey Avenue SE Washington DC 20590
_______________________________________________________________________
11 Elvik R (1995) The Safety Value of Guardrails and Crash Cushions A Meta-Analysis of Evidence from Evaluation Studies Accident Analysis and Prevention 27 (4)
12 Stutts J C Reinfurth D W Staplin L amp Rodgman EA (2001 May) The Role of Driver Distraction in Traffic Crashes Washington DC AAA Foundation for Traffic Safety
13 Liu C Chen C-L Subramanian R amp Utter D (2005 June) Analysis of Speeding-Related Fatal Motor Vehicle Traffic Crashes NHTSA Technical Report DOT HS 809 839 Washington DC National Highway Traffic Safety Administration
14 Hosmer Jr D W and Lemeshow S (1989) Applied Logistic Regression New York John Wiley amp Sons Inc
15 SAS Institute Inc (1995) Logistic Regression Examples using SAS system Cary NC SAS Institute Inc
16 Rubin D B Schafer J L amp Subramanian R (1998 October) Multiple Imputation of Missing Blood Alcohol Concentration (BAC) Values in FARS NHTSA Technical Report DOT HS 808 816 Washington DC National Highway Traffic Safety Administration
17 Subramanian R (2005 March) Alcohol Involvement in Fatal Motor Vehicle Traffic Crashes NHTSA Technical Report DOT HS 809 822 Washington DC National Highway Traffic Safety Administration
18 SASSTAT Userrsquos Guide Version 8 1999 Cary NC SAS Institute Inc
26
NHTSArsquos National Center for Statistics and Analysis 1200 New Jersey Avenue SE Washington DC 20590
DOT HS 811 232November 2009
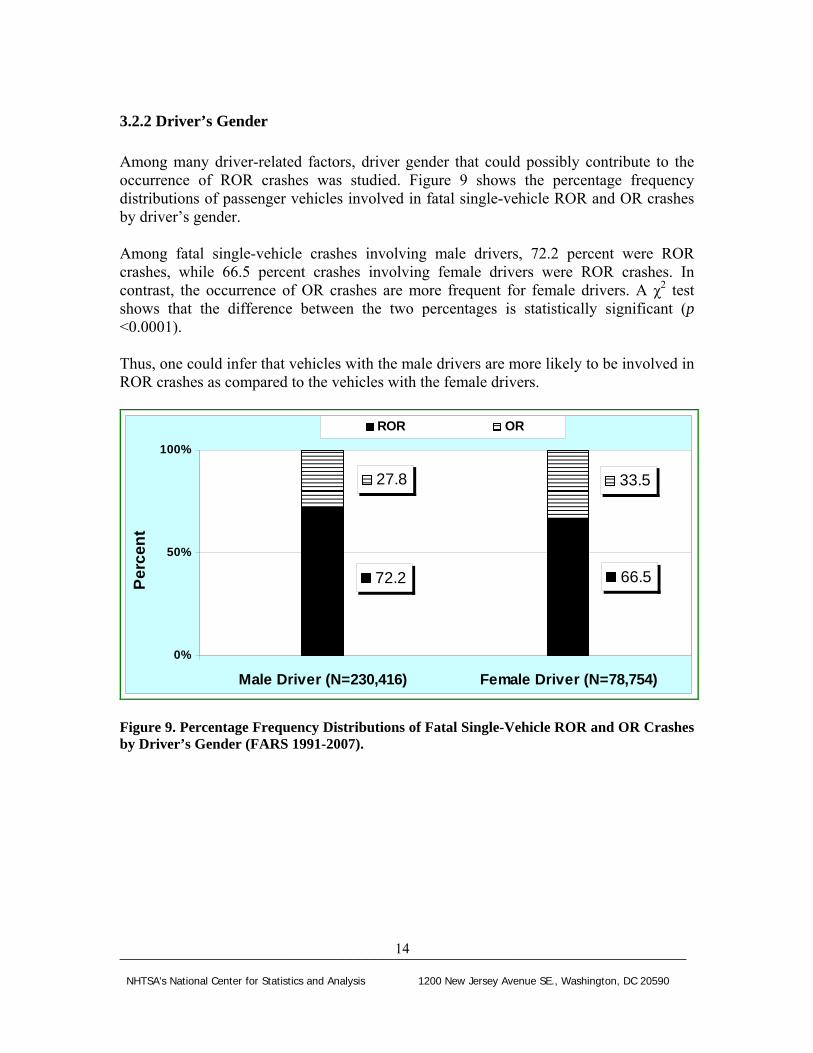
_______________________________________________________________________
722 665
278 335
ROR OR
100
50
0
Male Driver (N=230416) Female Driver (N=78754)
Pe
rce
nt
322 Driverrsquos Gender
Among many driver-related factors driver gender that could possibly contribute to the occurrence of ROR crashes was studied Figure 9 shows the percentage frequency distributions of passenger vehicles involved in fatal single-vehicle ROR and OR crashes by driverrsquos gender
Among fatal single-vehicle crashes involving male drivers 722 percent were ROR crashes while 665 percent crashes involving female drivers were ROR crashes In contrast the occurrence of OR crashes are more frequent for female drivers A χ2 test shows that the difference between the two percentages is statistically significant (p lt00001)
Thus one could infer that vehicles with the male drivers are more likely to be involved in ROR crashes as compared to the vehicles with the female drivers
Figure 9 Percentage Frequency Distributions of Fatal Single-Vehicle ROR and OR Crashes by Driverrsquos Gender (FARS 1991-2007)
14
NHTSArsquos National Center for Statistics and Analysis 1200 New Jersey Avenue SE Washington DC 20590
_______________________________________________________________________
323 Driverrsquos Age
To look into driver age as a contributing factor in ROR crashes four age groups were considered 15 to 24 25 to 44 45 to 64 and 65 and older Figure 10 shows the percentage frequency distributions of passenger vehicles involved in fatal single-vehicle ROR and OR crashes by these age groups
Among fatal single-vehicle crashes involving young drivers 15 to 24 a higher percentage (752 percent) were of ROR crashes as compared to other age groups This shows that vehicles with young drivers 15 to 24 are more likely to be involved in ROR crashes as compared to other three age groups
727 664 752 686
273 336 248 314
0
50
100
15-24 (N=102962)
25-44 (N=121728)
45-64 (N=55303)
65+ (N=27195)
Pe
rce
nt
ROR OR
Figure 10 Percentage Frequency Distributions of Fatal Single-Vehicle ROR and OR Crashes by Driverrsquos Age (FARS 1991-2007)
15
NHTSArsquos National Center for Statistics and Analysis 1200 New Jersey Avenue SE Washington DC 20590
_______________________________________________________________________
583 865
417 135
0
50
100
BAC=0 (N=172537) BAC=001+ (N=136633)
Pe
rce
nt
ROR OR
Figure 11 Percentage Frequency Distributions of Fatal Single-Vehicle ROR and OR Crashes by Driverrsquos Alcohol Use (FARS 1991-2007)
324 Alcohol-Related Driving
Alcohol involvement of a driver often leads to safety issues such as loss of vehicle control that may result into a ROR crash Two categories of drivers sober (BAC=0) and alcohol involved (BAC=01+) were considered in the analysis to see if alcohol use contributes to ROR crashes Figure 11 shows the percentage frequency distributions of passenger vehicles involved in fatal single-vehicle ROR and OR crashes by driverrsquos alcohol use
Among fatal single-vehicle crashes involving drivers with alcohol use (BAC=01+) 865 percent were ROR crashes while among those drivers with no alcohol (BAC=0) 583 percent were ROR crashes The difference between these two percentages is statistically significant (p lt00001) This indicates that the drivers with alcohol use are more likely to be involved in ROR crashes as compared to sober drivers
16
NHTSArsquos National Center for Statistics and Analysis 1200 New Jersey Avenue SE Washington DC 20590
_______________________________________________________________________
325 Driver-Performance-Related Factors
Some of the driver performance-related factors that are likely to contribute to the occurrence of ROR crashes were also examined
These include (1) sleepy (drowsy asleep fatigued and sleepy) (2) inattentive (talking eating etc) (3) over-correcting of the vehicle (4) avoiding (avoiding swerving or sliding due to severe crosswind tire blow-out or flat live animals in road vehicle in road etc) (5) distractions inside vehicles (cellular telephone computer fax machine etc) and (6) other driver-performance-related factors such as mentally challenged following improperly failure to signal intensions etc
Figure 12 shows the percentage frequency distributions of passenger vehicles involved in fatal single-vehicle ROR and OR crashes based on the driver performance-related factors The statistics show that the percentages of sleepy (912) inattentive (754) over correction of the vehicle (856) and crash avoiding (798) drivers involved in fatal single-vehicle ROR crashes are significantly greater (p lt00001) than the drivers with lsquoOther driver performance-related factorsrsquo that account for 67 percent of ROR crashes
This means that drivers with these performance-related factors (sleepy inattentive over correction avoiding etc) are more likely to be involved in ROR crashes as compared to drivers with other performance-related factors These results are consistent with those obtained from other studies using different approaches and other crash databases 2-11
17
NHTSArsquos National Center for Statistics and Analysis 1200 New Jersey Avenue SE Washington DC 20590
_______________________________________________________________________
672 671 798 856 754 912
328 329 202 144 246 88
0
20
40
60
80
100
Sleepy (N=14774)
Inattention (N=28081)
Overcorrect (N=19289)
Avoiding (N=14145)
Possible Distraction (N=1429)
Others (N=227587)
Per
cen
t
ROR OR
Figure 12 Percentage Frequency Distributions of Fatal Single-Vehicle ROR and OR Crashes by Driver Performance-Related Factors (FARS 1991-2007)
18
NHTSArsquos National Center for Statistics and Analysis 1200 New Jersey Avenue SE Washington DC 20590
_______________________________________________________________________
33 Vehicle-Related Factors
It is generally believed that ROR crashes are likely to occur due to some vehicle-related factors such as vehicle speeding or vehicle type
331 Vehicle Speeding Status
A crash is considered speeding-related if any driver involved in the crash is charged with a speeding-related offense or if a police officer indicates that racing driving too fast for the conditions or exceeding the posted speed limit was a related factor in the crash 13
Figure 13 shows the percentage frequency distributions of passenger vehicles involved in fatal single-vehicle ROR and OR crashes by vehicle speeding status
Among fatal single-vehicle crashes that involved a speeding vehicle 90 percent were ROR crashes while among crashes that did not involve a speeding vehicle 595 percent were ROR crashes A χ2 test shows that the difference between two percentages is statistically significant (p lt00001) thereby showing that speeding vehicles are more likely to be involved in ROR crashes as compared to non-speeding vehicles
900 595
100 405
0
50
100
Speeding (N=113825) Non-Speeding (N=195345)
Pe
rce
nt
ROR OR
Figure 13 Percentage Frequency Distributions of Fatal Single-Vehicle ROR and OR Crashes by Vehicle Speeding Status (FARS 1991-2007)
19
NHTSArsquos National Center for Statistics and Analysis 1200 New Jersey Avenue SE Washington DC 20590
_______________________________________________________________________
500 520 600 670 730 710
500 480 400 330 270 290
00
200
400
600
800
1000
Passenger Car
(N=178430)
LT Pickup
(N=72065)
LT Utility
(N=38970)
LT MiniVan
(N=11159)
LT Other Van (N=7904)
LT Others (N=642)
Pe
rce
nt
ROR OR
Figure 14 shows the percentage frequency distributions of passenger vehicles involved in fatal single-vehicle ROR and OR crashes by passenger vehicle type passenger car light truck (LT) including pickup utility minivan other van and other light trucks) It shows that passenger cars are more likely to be involved in ROR crashes as compared to other passenger vehicle types Minivans (60) are more likely to be involved in ROR crashes (p lt00001) as compared to other vans (52)
332 Vehicle Type
Figure 14 Percentage Frequency Distributions of Fatal Single-Vehicle ROR and OR Crashes by Vehicle Type (FARS 1991-2007)
20
NHTSArsquos National Center for Statistics and Analysis 1200 New Jersey Avenue SE Washington DC 20590
_______________________________________________________________________
4 Logistic Regression
The analysis in the previous sections shows that factors such as driver sleepiness alcohol use vehicle speeding curved roadway rural roads etc are significant contributors to the occurrence of fatal single-vehicle ROR crashes It remains to assess their relative influence as well as estimate the amount of risk each carries in the occurrence of such crashes Logistic regression was used for this purpose This is a modeling procedure that predicts the probability (p) of occurrence of an event (fatal single-vehicle ROR crash in the present case) as a consequence of certain roadway- driver- environment- and vehicle-related factors such as sleepy alcohol use weather condition lighting condition speeding status road function etc Generally the logistic regression model provides log of odds as a function of the predictors
Log (odds) = a0 + a1timesdriver performance-related factor + a2timesalcohol use + a3timesspeeding status + a4timesweather condition + a5timeslighting conditionhellip + aktimesspeeding statustimesweather condition + ak+1timesspeeding statustimesdriverrsquos age +helliphellip
where a0 is the intercept and a1 a2 a3 helliphellip ak ak+1 helliphellip are the regression coefficients
As in the previous analysis FARS data was used in the modeling procedure Since in FARS driverrsquos alcohol involvement is estimated by Multiple Imputation (MI) 16 17
procedure the SAS MIANALYZE procedure was used in this study to perform the analysis of the MI data generated from the logistic regression18
21
NHTSArsquos National Center for Statistics and Analysis 1200 New Jersey Avenue SE Washington DC 20590
_______________________________________________________________________
41 Logistic Regression Results and Interpretation
Of all the variables considered in the logistic regression only 10 showed up as significant predictors (95 confidence level) As regards the interaction effect of these factors only the interaction of speeding with other variables was considered However only three of these interactions emerged as significant (95 confidence level) The results in Table 1 present estimates of regression coefficients and the corresponding odds ratio only for significant main effects and interactions Since the independent variables (predictors) are dichotomous the influence of the corresponding factors can be compared simply by comparing their regression coefficients
The ordered (decreasing) estimates of regression coefficients in Table 1 show that the most influential factor in the occurrence of fatal single-vehicle ROR crashes is the driver performance-related factor sleepy followed by alcohol use roadway alignment with curve speeding passenger car rural roadway number of lanes high-speed-limit road adverse weather and avoiding With regard to the interaction effect of speeding with other factors speeding with drivers of age groups 15 to 24 and 25 to 44 as well as speeding under adverse weather are significant contributors to the likelihood of ROR crashes
Table 1 Multiple Imputation Parameter Estimates Dagger
Variables Estimate Odds Ratio Driver performance-related factor sleepy vs others 11675 Dagger 321 Driver with alcohol BAC=01+ gdL vs BAC=0 06605 Dagger 194 Road alignment curve vs straight 05535 Dagger 174 Vehicle speeding status speeding vs non-speeding 04966 Dagger 164 Vehicle type passenger car vs other LTs 04780 Dagger 161 Road function rural vs urban 03637 Dagger 144 Roadway of lanes one or two (undivided) vs three amp more (undivided) 03346 Dagger 141 Road speed limit ge 60 mph vs lt60 mph 02659 Dagger 130 Weather adverse vs good 02130 Dagger 124 Driver performance-related factor avoiding vs others 02007 Dagger 122 Weather timesSpeeding status adverse amp speeding vs good amp non-speeding 01056 Dagger 111 Driver Age times Speeding status 25-44 amp speeding vs 65+ amp non-speeding 01003 Dagger 111 Driver Age times Speeding status 15-24 amp speeding vs 65+ amp non-speeding 00578 Dagger 106
Statistically significant variables (α = 005) associated with the high risk (odds ratio gt100) Other variables with low risk (odds ratio lt100) or insignificance (pgt005) after jointly estimating the effect are not shown here Dagger p-value lt00001
One of the most important by-product of logistic regression is the estimate of odds ratio that tells a great deal about the risk a certain factor carries in contributing to the occurrence of ROR crashes Specifically odds ratio measures the magnitude of increase in odds of happening of an event as a result of a unit increase in a predictor (eg sober and alcohol-used driver) An odds ratio value of 1 is indicative of no influence Table 1 also shows odds ratio estimates of significant factors and interactions
22
NHTSArsquos National Center for Statistics and Analysis 1200 New Jersey Avenue SE Washington DC 20590
_______________________________________________________________________
1
250 226
o 200
ita 164
Rd
s 150
d 124
O 100 100
050
Non-Speeding+Good Weather Non-Speeding+Adverse Weather
Speeding+Good Weather Speeding+Adverse Weather
Figure 15 Odds Ratio by Speeding Status and Weather Conditions
The odds ratio 321 for the factor ldquodriver performance-related factorrdquo shows that the odds of being involved in an ROR crash for a sleepy driver are three times as large as that for the driver who is not sleepy
The odds ratio 194 for the factor ldquodriver with alcoholrdquo shows that the odds of being involved in an ROR crash for an alcohol used driver (BAC=01+ gdL) are almost two times as large as that for a sober driver (BAC=0)
The odds ratio 174 for the factor ldquoroad alignmentrdquo shows that the odds of being involved in an ROR crash on curved roadways are 174 times as large as that on straight roadways in fatal single-vehicle crashes
The odds ratio 164 for the factor ldquovehicle speeding statusrdquo shows that the odds of being involved in an ROR crash for speeding vehicles are 164 times as large as that for non-speeding vehicles
The odds ratio 161 for the factor ldquovehicle typerdquo shows that the odds of being involved in an ROR crash for passenger cars are 161 times as large as that for other LTs
The odds ratio 144 for the factor ldquoroad functionrdquo shows that the odds of being involved in an ROR crash on rural roadways are 144 times as large as that on urban roadways
The odds ratio 266 for the factor ldquoweather amp speeding statusrdquo shows that the odds of being involved in an ROR crash under the adverse weather and in speeding vehicle are 266 (=164times124times111) times as large as that under the good weather and in non-speeding vehicle (Figure 15)
23
NHTSArsquos National Center for Statistics and Analysis 1200 New Jersey Avenue SE Washington DC 20590
_______________________________________________________________________
5 Conclusions
Run-off-road crashes account for a significant percentage (around 70) of all fatal single-vehicle crashes FARS data (1991 to 2007) that includes detailed information about ROR crashes provided sufficient statistical evidence to conclude that certain roadway- driver- environment- and vehicle-related factors closely associated with the occurrence of these crashes Appropriate crash countermeasures based on the identified factors can reduce the occurrence of single-vehicle ROR crashes and hence of the fatalities
Curved road segments rural roads high-speed-limit roadways and roadways with fewer lanes (divided or undivided) are found to be more likely to be the scene of fatal single-vehicle ROR crashes as compared to the fatal single-vehicle OR crashes Similarly among environmental factors adverse weather and night time periods are the factors associated with high risk of fatal single-vehicle ROR crashes
Vehicles with high occupancy (two and more occupants) male driver younger driver and alcohol used by driver are more likely to be involved in fatal single-vehicle ROR crashes as compared to the fatal single-vehicle OR crashes Drivers with performance-related factors (sleepy inattentive over-correction avoiding etc) are more likely to be involved in the fatal single-vehicle ROR crashes Speeding vehicles and passenger cars are also associated with high risks of the fatal single-vehicle ROR crashes
In the adverse weather condition and for the younger drivers (15 to 24 and 25 to 44) the speeding vehicle would increase the risk of fatal single-vehicle ROR crashes by an additional factor
The above facts based on statistical evidence suggest several crash countermeasures For example improving roadway design such as flattening curves and installing shoulder rumble strips or rehabilitation strategies such as building wide lanes or adding additional unpaved shoulder width on entire system providing skid-resistant pavement surfaces could reduce the likelihood of ROR crashes
24
NHTSArsquos National Center for Statistics and Analysis 1200 New Jersey Avenue SE Washington DC 20590
_______________________________________________________________________
6 References
1 FHWA (Undated) Reducing Highway Fatalities Washington DC Federal Highway Administration httpsafetyfhwadotgovroadway5Fdept
2 Neuman T RPfefer R Slack K L Council F McGee H Prothe L amp Eccles K (1998) Guidance for Implementation of the AASHTO Strategic Highway Safety Plan Report 500 Volume 6 A Guide for Addressing Run-Off Road Collisions Washington DC Transportation Research Board Available at httponlinepubstrborgonlinepubsnchrpnchrp_rpt_500v6pdf
3 Spainhour L K amp Mishra A (2007) Analysis of Fatal Run-off-the-Road Crashes Involving Overcorrection TRB 87th Annual Meeting Paper No 08-0661 Washington DC Transportation Research Board
4 McGee H W amp Hanscom F R Low-Cost Treatments for Horizontal Curve Safety FHWA-SA-07-002 December 2006
5 Johnston I Corben B TriggsT Candappa N amp Lenneacute M Reducing Serious Injury and Death from Run-off-Road Crashes in Victoria ndash Turning Knowledge into Action (2006 June) RACV Research Report Victoria Australia Royal Automobile Club of Victoria Ltd
6 Dissanayake S (2003 August) Young Drivers and Run-Off-the-Road Crashes Proceedings of the 2003 Mid-Continent Transportation Research Symposium Ames Iowa
7 Knapp K K Giese K L amp Lee W (2003 August) Urban Four-Lane Undivided to Three-Lane Roadway Conversion Guidelines Proceedings of the 2003 Mid-Continent Transportation Research Symposium Ames Iowa
8 Őrnek E amp Drakopoulos A (2007 August) Analysis of Run-Off-Road Crashes in Relation to Roadway Features and Driver Behavior Proceedings of the 2007 Mid-Continent Transportation Research Symposium Ames Iowa
9 Ray M H amp McGinnis R G (1997) Guardrail and Median Barrier Crashworthiness A Synthesis of Highway Practice NCHRP Synthesis 244 Washington DC Transportation Research Board National Research Council
10 Roadside Design Guide (2006) 3rd Edition Washington DC American Association of State Highway and Transportation Officials
25
NHTSArsquos National Center for Statistics and Analysis 1200 New Jersey Avenue SE Washington DC 20590
_______________________________________________________________________
11 Elvik R (1995) The Safety Value of Guardrails and Crash Cushions A Meta-Analysis of Evidence from Evaluation Studies Accident Analysis and Prevention 27 (4)
12 Stutts J C Reinfurth D W Staplin L amp Rodgman EA (2001 May) The Role of Driver Distraction in Traffic Crashes Washington DC AAA Foundation for Traffic Safety
13 Liu C Chen C-L Subramanian R amp Utter D (2005 June) Analysis of Speeding-Related Fatal Motor Vehicle Traffic Crashes NHTSA Technical Report DOT HS 809 839 Washington DC National Highway Traffic Safety Administration
14 Hosmer Jr D W and Lemeshow S (1989) Applied Logistic Regression New York John Wiley amp Sons Inc
15 SAS Institute Inc (1995) Logistic Regression Examples using SAS system Cary NC SAS Institute Inc
16 Rubin D B Schafer J L amp Subramanian R (1998 October) Multiple Imputation of Missing Blood Alcohol Concentration (BAC) Values in FARS NHTSA Technical Report DOT HS 808 816 Washington DC National Highway Traffic Safety Administration
17 Subramanian R (2005 March) Alcohol Involvement in Fatal Motor Vehicle Traffic Crashes NHTSA Technical Report DOT HS 809 822 Washington DC National Highway Traffic Safety Administration
18 SASSTAT Userrsquos Guide Version 8 1999 Cary NC SAS Institute Inc
26
NHTSArsquos National Center for Statistics and Analysis 1200 New Jersey Avenue SE Washington DC 20590
DOT HS 811 232November 2009
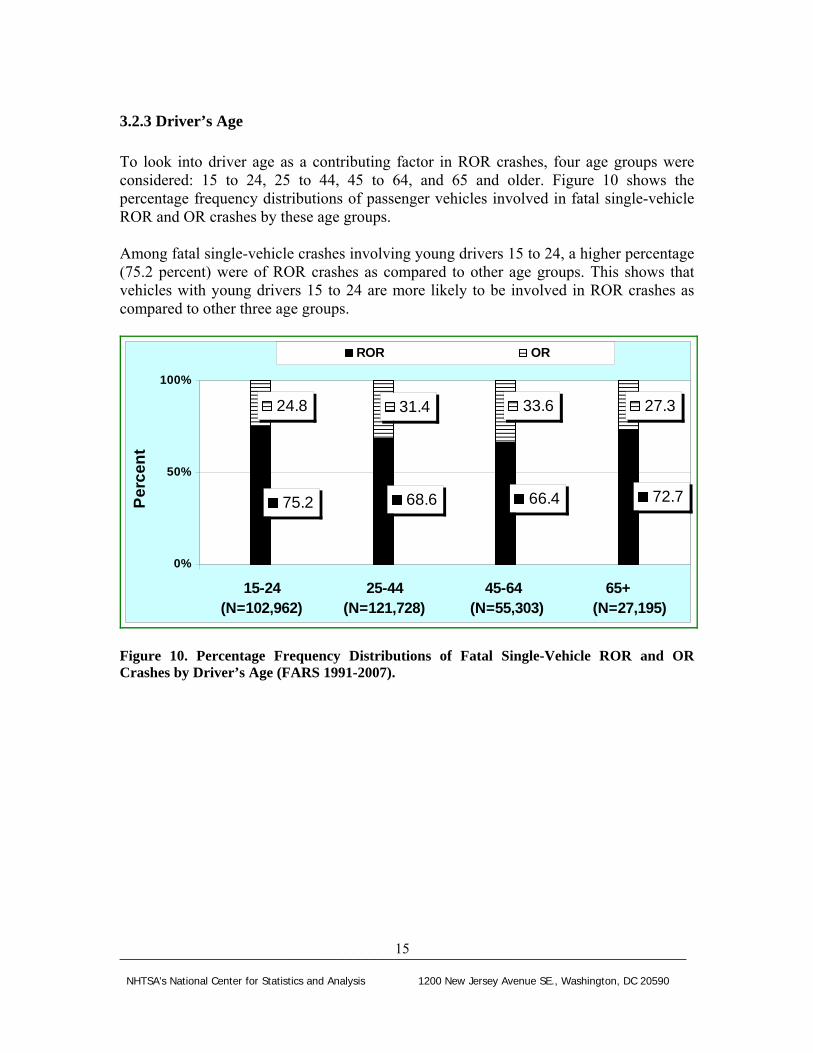
_______________________________________________________________________
323 Driverrsquos Age
To look into driver age as a contributing factor in ROR crashes four age groups were considered 15 to 24 25 to 44 45 to 64 and 65 and older Figure 10 shows the percentage frequency distributions of passenger vehicles involved in fatal single-vehicle ROR and OR crashes by these age groups
Among fatal single-vehicle crashes involving young drivers 15 to 24 a higher percentage (752 percent) were of ROR crashes as compared to other age groups This shows that vehicles with young drivers 15 to 24 are more likely to be involved in ROR crashes as compared to other three age groups
727 664 752 686
273 336 248 314
0
50
100
15-24 (N=102962)
25-44 (N=121728)
45-64 (N=55303)
65+ (N=27195)
Pe
rce
nt
ROR OR
Figure 10 Percentage Frequency Distributions of Fatal Single-Vehicle ROR and OR Crashes by Driverrsquos Age (FARS 1991-2007)
15
NHTSArsquos National Center for Statistics and Analysis 1200 New Jersey Avenue SE Washington DC 20590
_______________________________________________________________________
583 865
417 135
0
50
100
BAC=0 (N=172537) BAC=001+ (N=136633)
Pe
rce
nt
ROR OR
Figure 11 Percentage Frequency Distributions of Fatal Single-Vehicle ROR and OR Crashes by Driverrsquos Alcohol Use (FARS 1991-2007)
324 Alcohol-Related Driving
Alcohol involvement of a driver often leads to safety issues such as loss of vehicle control that may result into a ROR crash Two categories of drivers sober (BAC=0) and alcohol involved (BAC=01+) were considered in the analysis to see if alcohol use contributes to ROR crashes Figure 11 shows the percentage frequency distributions of passenger vehicles involved in fatal single-vehicle ROR and OR crashes by driverrsquos alcohol use
Among fatal single-vehicle crashes involving drivers with alcohol use (BAC=01+) 865 percent were ROR crashes while among those drivers with no alcohol (BAC=0) 583 percent were ROR crashes The difference between these two percentages is statistically significant (p lt00001) This indicates that the drivers with alcohol use are more likely to be involved in ROR crashes as compared to sober drivers
16
NHTSArsquos National Center for Statistics and Analysis 1200 New Jersey Avenue SE Washington DC 20590
_______________________________________________________________________
325 Driver-Performance-Related Factors
Some of the driver performance-related factors that are likely to contribute to the occurrence of ROR crashes were also examined
These include (1) sleepy (drowsy asleep fatigued and sleepy) (2) inattentive (talking eating etc) (3) over-correcting of the vehicle (4) avoiding (avoiding swerving or sliding due to severe crosswind tire blow-out or flat live animals in road vehicle in road etc) (5) distractions inside vehicles (cellular telephone computer fax machine etc) and (6) other driver-performance-related factors such as mentally challenged following improperly failure to signal intensions etc
Figure 12 shows the percentage frequency distributions of passenger vehicles involved in fatal single-vehicle ROR and OR crashes based on the driver performance-related factors The statistics show that the percentages of sleepy (912) inattentive (754) over correction of the vehicle (856) and crash avoiding (798) drivers involved in fatal single-vehicle ROR crashes are significantly greater (p lt00001) than the drivers with lsquoOther driver performance-related factorsrsquo that account for 67 percent of ROR crashes
This means that drivers with these performance-related factors (sleepy inattentive over correction avoiding etc) are more likely to be involved in ROR crashes as compared to drivers with other performance-related factors These results are consistent with those obtained from other studies using different approaches and other crash databases 2-11
17
NHTSArsquos National Center for Statistics and Analysis 1200 New Jersey Avenue SE Washington DC 20590
_______________________________________________________________________
672 671 798 856 754 912
328 329 202 144 246 88
0
20
40
60
80
100
Sleepy (N=14774)
Inattention (N=28081)
Overcorrect (N=19289)
Avoiding (N=14145)
Possible Distraction (N=1429)
Others (N=227587)
Per
cen
t
ROR OR
Figure 12 Percentage Frequency Distributions of Fatal Single-Vehicle ROR and OR Crashes by Driver Performance-Related Factors (FARS 1991-2007)
18
NHTSArsquos National Center for Statistics and Analysis 1200 New Jersey Avenue SE Washington DC 20590
_______________________________________________________________________
33 Vehicle-Related Factors
It is generally believed that ROR crashes are likely to occur due to some vehicle-related factors such as vehicle speeding or vehicle type
331 Vehicle Speeding Status
A crash is considered speeding-related if any driver involved in the crash is charged with a speeding-related offense or if a police officer indicates that racing driving too fast for the conditions or exceeding the posted speed limit was a related factor in the crash 13
Figure 13 shows the percentage frequency distributions of passenger vehicles involved in fatal single-vehicle ROR and OR crashes by vehicle speeding status
Among fatal single-vehicle crashes that involved a speeding vehicle 90 percent were ROR crashes while among crashes that did not involve a speeding vehicle 595 percent were ROR crashes A χ2 test shows that the difference between two percentages is statistically significant (p lt00001) thereby showing that speeding vehicles are more likely to be involved in ROR crashes as compared to non-speeding vehicles
900 595
100 405
0
50
100
Speeding (N=113825) Non-Speeding (N=195345)
Pe
rce
nt
ROR OR
Figure 13 Percentage Frequency Distributions of Fatal Single-Vehicle ROR and OR Crashes by Vehicle Speeding Status (FARS 1991-2007)
19
NHTSArsquos National Center for Statistics and Analysis 1200 New Jersey Avenue SE Washington DC 20590
_______________________________________________________________________
500 520 600 670 730 710
500 480 400 330 270 290
00
200
400
600
800
1000
Passenger Car
(N=178430)
LT Pickup
(N=72065)
LT Utility
(N=38970)
LT MiniVan
(N=11159)
LT Other Van (N=7904)
LT Others (N=642)
Pe
rce
nt
ROR OR
Figure 14 shows the percentage frequency distributions of passenger vehicles involved in fatal single-vehicle ROR and OR crashes by passenger vehicle type passenger car light truck (LT) including pickup utility minivan other van and other light trucks) It shows that passenger cars are more likely to be involved in ROR crashes as compared to other passenger vehicle types Minivans (60) are more likely to be involved in ROR crashes (p lt00001) as compared to other vans (52)
332 Vehicle Type
Figure 14 Percentage Frequency Distributions of Fatal Single-Vehicle ROR and OR Crashes by Vehicle Type (FARS 1991-2007)
20
NHTSArsquos National Center for Statistics and Analysis 1200 New Jersey Avenue SE Washington DC 20590
_______________________________________________________________________
4 Logistic Regression
The analysis in the previous sections shows that factors such as driver sleepiness alcohol use vehicle speeding curved roadway rural roads etc are significant contributors to the occurrence of fatal single-vehicle ROR crashes It remains to assess their relative influence as well as estimate the amount of risk each carries in the occurrence of such crashes Logistic regression was used for this purpose This is a modeling procedure that predicts the probability (p) of occurrence of an event (fatal single-vehicle ROR crash in the present case) as a consequence of certain roadway- driver- environment- and vehicle-related factors such as sleepy alcohol use weather condition lighting condition speeding status road function etc Generally the logistic regression model provides log of odds as a function of the predictors
Log (odds) = a0 + a1timesdriver performance-related factor + a2timesalcohol use + a3timesspeeding status + a4timesweather condition + a5timeslighting conditionhellip + aktimesspeeding statustimesweather condition + ak+1timesspeeding statustimesdriverrsquos age +helliphellip
where a0 is the intercept and a1 a2 a3 helliphellip ak ak+1 helliphellip are the regression coefficients
As in the previous analysis FARS data was used in the modeling procedure Since in FARS driverrsquos alcohol involvement is estimated by Multiple Imputation (MI) 16 17
procedure the SAS MIANALYZE procedure was used in this study to perform the analysis of the MI data generated from the logistic regression18
21
NHTSArsquos National Center for Statistics and Analysis 1200 New Jersey Avenue SE Washington DC 20590
_______________________________________________________________________
41 Logistic Regression Results and Interpretation
Of all the variables considered in the logistic regression only 10 showed up as significant predictors (95 confidence level) As regards the interaction effect of these factors only the interaction of speeding with other variables was considered However only three of these interactions emerged as significant (95 confidence level) The results in Table 1 present estimates of regression coefficients and the corresponding odds ratio only for significant main effects and interactions Since the independent variables (predictors) are dichotomous the influence of the corresponding factors can be compared simply by comparing their regression coefficients
The ordered (decreasing) estimates of regression coefficients in Table 1 show that the most influential factor in the occurrence of fatal single-vehicle ROR crashes is the driver performance-related factor sleepy followed by alcohol use roadway alignment with curve speeding passenger car rural roadway number of lanes high-speed-limit road adverse weather and avoiding With regard to the interaction effect of speeding with other factors speeding with drivers of age groups 15 to 24 and 25 to 44 as well as speeding under adverse weather are significant contributors to the likelihood of ROR crashes
Table 1 Multiple Imputation Parameter Estimates Dagger
Variables Estimate Odds Ratio Driver performance-related factor sleepy vs others 11675 Dagger 321 Driver with alcohol BAC=01+ gdL vs BAC=0 06605 Dagger 194 Road alignment curve vs straight 05535 Dagger 174 Vehicle speeding status speeding vs non-speeding 04966 Dagger 164 Vehicle type passenger car vs other LTs 04780 Dagger 161 Road function rural vs urban 03637 Dagger 144 Roadway of lanes one or two (undivided) vs three amp more (undivided) 03346 Dagger 141 Road speed limit ge 60 mph vs lt60 mph 02659 Dagger 130 Weather adverse vs good 02130 Dagger 124 Driver performance-related factor avoiding vs others 02007 Dagger 122 Weather timesSpeeding status adverse amp speeding vs good amp non-speeding 01056 Dagger 111 Driver Age times Speeding status 25-44 amp speeding vs 65+ amp non-speeding 01003 Dagger 111 Driver Age times Speeding status 15-24 amp speeding vs 65+ amp non-speeding 00578 Dagger 106
Statistically significant variables (α = 005) associated with the high risk (odds ratio gt100) Other variables with low risk (odds ratio lt100) or insignificance (pgt005) after jointly estimating the effect are not shown here Dagger p-value lt00001
One of the most important by-product of logistic regression is the estimate of odds ratio that tells a great deal about the risk a certain factor carries in contributing to the occurrence of ROR crashes Specifically odds ratio measures the magnitude of increase in odds of happening of an event as a result of a unit increase in a predictor (eg sober and alcohol-used driver) An odds ratio value of 1 is indicative of no influence Table 1 also shows odds ratio estimates of significant factors and interactions
22
NHTSArsquos National Center for Statistics and Analysis 1200 New Jersey Avenue SE Washington DC 20590
_______________________________________________________________________
1
250 226
o 200
ita 164
Rd
s 150
d 124
O 100 100
050
Non-Speeding+Good Weather Non-Speeding+Adverse Weather
Speeding+Good Weather Speeding+Adverse Weather
Figure 15 Odds Ratio by Speeding Status and Weather Conditions
The odds ratio 321 for the factor ldquodriver performance-related factorrdquo shows that the odds of being involved in an ROR crash for a sleepy driver are three times as large as that for the driver who is not sleepy
The odds ratio 194 for the factor ldquodriver with alcoholrdquo shows that the odds of being involved in an ROR crash for an alcohol used driver (BAC=01+ gdL) are almost two times as large as that for a sober driver (BAC=0)
The odds ratio 174 for the factor ldquoroad alignmentrdquo shows that the odds of being involved in an ROR crash on curved roadways are 174 times as large as that on straight roadways in fatal single-vehicle crashes
The odds ratio 164 for the factor ldquovehicle speeding statusrdquo shows that the odds of being involved in an ROR crash for speeding vehicles are 164 times as large as that for non-speeding vehicles
The odds ratio 161 for the factor ldquovehicle typerdquo shows that the odds of being involved in an ROR crash for passenger cars are 161 times as large as that for other LTs
The odds ratio 144 for the factor ldquoroad functionrdquo shows that the odds of being involved in an ROR crash on rural roadways are 144 times as large as that on urban roadways
The odds ratio 266 for the factor ldquoweather amp speeding statusrdquo shows that the odds of being involved in an ROR crash under the adverse weather and in speeding vehicle are 266 (=164times124times111) times as large as that under the good weather and in non-speeding vehicle (Figure 15)
23
NHTSArsquos National Center for Statistics and Analysis 1200 New Jersey Avenue SE Washington DC 20590
_______________________________________________________________________
5 Conclusions
Run-off-road crashes account for a significant percentage (around 70) of all fatal single-vehicle crashes FARS data (1991 to 2007) that includes detailed information about ROR crashes provided sufficient statistical evidence to conclude that certain roadway- driver- environment- and vehicle-related factors closely associated with the occurrence of these crashes Appropriate crash countermeasures based on the identified factors can reduce the occurrence of single-vehicle ROR crashes and hence of the fatalities
Curved road segments rural roads high-speed-limit roadways and roadways with fewer lanes (divided or undivided) are found to be more likely to be the scene of fatal single-vehicle ROR crashes as compared to the fatal single-vehicle OR crashes Similarly among environmental factors adverse weather and night time periods are the factors associated with high risk of fatal single-vehicle ROR crashes
Vehicles with high occupancy (two and more occupants) male driver younger driver and alcohol used by driver are more likely to be involved in fatal single-vehicle ROR crashes as compared to the fatal single-vehicle OR crashes Drivers with performance-related factors (sleepy inattentive over-correction avoiding etc) are more likely to be involved in the fatal single-vehicle ROR crashes Speeding vehicles and passenger cars are also associated with high risks of the fatal single-vehicle ROR crashes
In the adverse weather condition and for the younger drivers (15 to 24 and 25 to 44) the speeding vehicle would increase the risk of fatal single-vehicle ROR crashes by an additional factor
The above facts based on statistical evidence suggest several crash countermeasures For example improving roadway design such as flattening curves and installing shoulder rumble strips or rehabilitation strategies such as building wide lanes or adding additional unpaved shoulder width on entire system providing skid-resistant pavement surfaces could reduce the likelihood of ROR crashes
24
NHTSArsquos National Center for Statistics and Analysis 1200 New Jersey Avenue SE Washington DC 20590
_______________________________________________________________________
6 References
1 FHWA (Undated) Reducing Highway Fatalities Washington DC Federal Highway Administration httpsafetyfhwadotgovroadway5Fdept
2 Neuman T RPfefer R Slack K L Council F McGee H Prothe L amp Eccles K (1998) Guidance for Implementation of the AASHTO Strategic Highway Safety Plan Report 500 Volume 6 A Guide for Addressing Run-Off Road Collisions Washington DC Transportation Research Board Available at httponlinepubstrborgonlinepubsnchrpnchrp_rpt_500v6pdf
3 Spainhour L K amp Mishra A (2007) Analysis of Fatal Run-off-the-Road Crashes Involving Overcorrection TRB 87th Annual Meeting Paper No 08-0661 Washington DC Transportation Research Board
4 McGee H W amp Hanscom F R Low-Cost Treatments for Horizontal Curve Safety FHWA-SA-07-002 December 2006
5 Johnston I Corben B TriggsT Candappa N amp Lenneacute M Reducing Serious Injury and Death from Run-off-Road Crashes in Victoria ndash Turning Knowledge into Action (2006 June) RACV Research Report Victoria Australia Royal Automobile Club of Victoria Ltd
6 Dissanayake S (2003 August) Young Drivers and Run-Off-the-Road Crashes Proceedings of the 2003 Mid-Continent Transportation Research Symposium Ames Iowa
7 Knapp K K Giese K L amp Lee W (2003 August) Urban Four-Lane Undivided to Three-Lane Roadway Conversion Guidelines Proceedings of the 2003 Mid-Continent Transportation Research Symposium Ames Iowa
8 Őrnek E amp Drakopoulos A (2007 August) Analysis of Run-Off-Road Crashes in Relation to Roadway Features and Driver Behavior Proceedings of the 2007 Mid-Continent Transportation Research Symposium Ames Iowa
9 Ray M H amp McGinnis R G (1997) Guardrail and Median Barrier Crashworthiness A Synthesis of Highway Practice NCHRP Synthesis 244 Washington DC Transportation Research Board National Research Council
10 Roadside Design Guide (2006) 3rd Edition Washington DC American Association of State Highway and Transportation Officials
25
NHTSArsquos National Center for Statistics and Analysis 1200 New Jersey Avenue SE Washington DC 20590
_______________________________________________________________________
11 Elvik R (1995) The Safety Value of Guardrails and Crash Cushions A Meta-Analysis of Evidence from Evaluation Studies Accident Analysis and Prevention 27 (4)
12 Stutts J C Reinfurth D W Staplin L amp Rodgman EA (2001 May) The Role of Driver Distraction in Traffic Crashes Washington DC AAA Foundation for Traffic Safety
13 Liu C Chen C-L Subramanian R amp Utter D (2005 June) Analysis of Speeding-Related Fatal Motor Vehicle Traffic Crashes NHTSA Technical Report DOT HS 809 839 Washington DC National Highway Traffic Safety Administration
14 Hosmer Jr D W and Lemeshow S (1989) Applied Logistic Regression New York John Wiley amp Sons Inc
15 SAS Institute Inc (1995) Logistic Regression Examples using SAS system Cary NC SAS Institute Inc
16 Rubin D B Schafer J L amp Subramanian R (1998 October) Multiple Imputation of Missing Blood Alcohol Concentration (BAC) Values in FARS NHTSA Technical Report DOT HS 808 816 Washington DC National Highway Traffic Safety Administration
17 Subramanian R (2005 March) Alcohol Involvement in Fatal Motor Vehicle Traffic Crashes NHTSA Technical Report DOT HS 809 822 Washington DC National Highway Traffic Safety Administration
18 SASSTAT Userrsquos Guide Version 8 1999 Cary NC SAS Institute Inc
26
NHTSArsquos National Center for Statistics and Analysis 1200 New Jersey Avenue SE Washington DC 20590
DOT HS 811 232November 2009
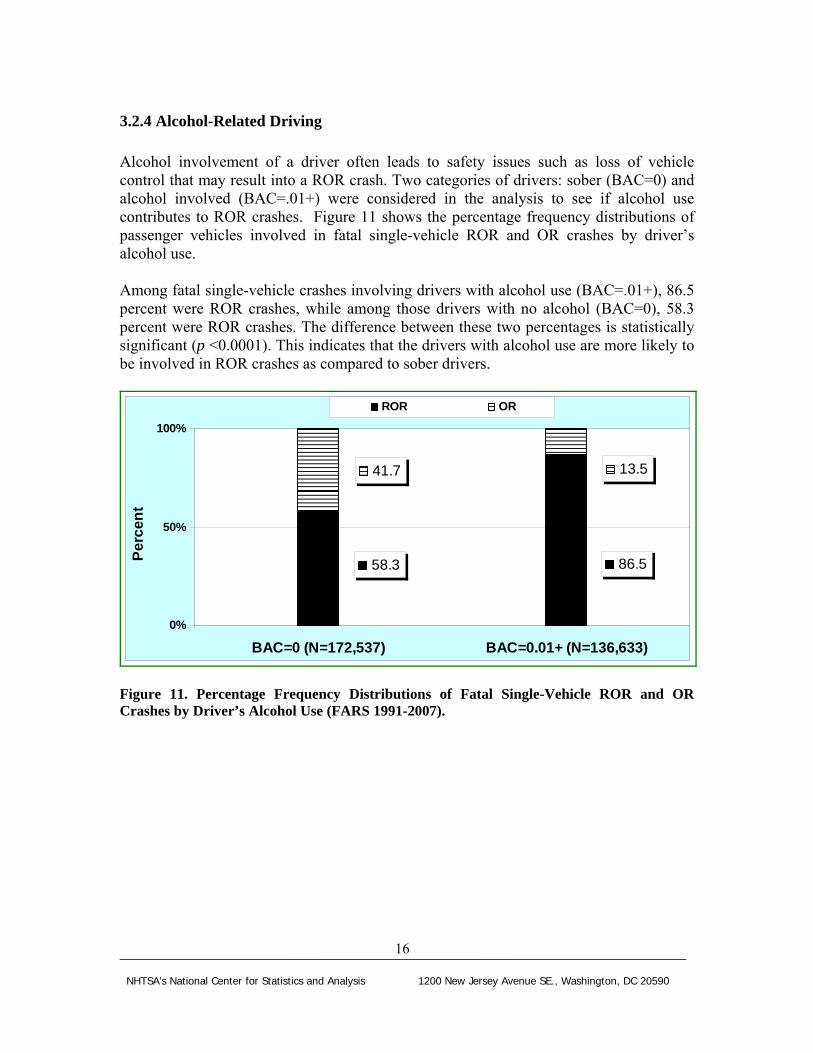
_______________________________________________________________________
583 865
417 135
0
50
100
BAC=0 (N=172537) BAC=001+ (N=136633)
Pe
rce
nt
ROR OR
Figure 11 Percentage Frequency Distributions of Fatal Single-Vehicle ROR and OR Crashes by Driverrsquos Alcohol Use (FARS 1991-2007)
324 Alcohol-Related Driving
Alcohol involvement of a driver often leads to safety issues such as loss of vehicle control that may result into a ROR crash Two categories of drivers sober (BAC=0) and alcohol involved (BAC=01+) were considered in the analysis to see if alcohol use contributes to ROR crashes Figure 11 shows the percentage frequency distributions of passenger vehicles involved in fatal single-vehicle ROR and OR crashes by driverrsquos alcohol use
Among fatal single-vehicle crashes involving drivers with alcohol use (BAC=01+) 865 percent were ROR crashes while among those drivers with no alcohol (BAC=0) 583 percent were ROR crashes The difference between these two percentages is statistically significant (p lt00001) This indicates that the drivers with alcohol use are more likely to be involved in ROR crashes as compared to sober drivers
16
NHTSArsquos National Center for Statistics and Analysis 1200 New Jersey Avenue SE Washington DC 20590
_______________________________________________________________________
325 Driver-Performance-Related Factors
Some of the driver performance-related factors that are likely to contribute to the occurrence of ROR crashes were also examined
These include (1) sleepy (drowsy asleep fatigued and sleepy) (2) inattentive (talking eating etc) (3) over-correcting of the vehicle (4) avoiding (avoiding swerving or sliding due to severe crosswind tire blow-out or flat live animals in road vehicle in road etc) (5) distractions inside vehicles (cellular telephone computer fax machine etc) and (6) other driver-performance-related factors such as mentally challenged following improperly failure to signal intensions etc
Figure 12 shows the percentage frequency distributions of passenger vehicles involved in fatal single-vehicle ROR and OR crashes based on the driver performance-related factors The statistics show that the percentages of sleepy (912) inattentive (754) over correction of the vehicle (856) and crash avoiding (798) drivers involved in fatal single-vehicle ROR crashes are significantly greater (p lt00001) than the drivers with lsquoOther driver performance-related factorsrsquo that account for 67 percent of ROR crashes
This means that drivers with these performance-related factors (sleepy inattentive over correction avoiding etc) are more likely to be involved in ROR crashes as compared to drivers with other performance-related factors These results are consistent with those obtained from other studies using different approaches and other crash databases 2-11
17
NHTSArsquos National Center for Statistics and Analysis 1200 New Jersey Avenue SE Washington DC 20590
_______________________________________________________________________
672 671 798 856 754 912
328 329 202 144 246 88
0
20
40
60
80
100
Sleepy (N=14774)
Inattention (N=28081)
Overcorrect (N=19289)
Avoiding (N=14145)
Possible Distraction (N=1429)
Others (N=227587)
Per
cen
t
ROR OR
Figure 12 Percentage Frequency Distributions of Fatal Single-Vehicle ROR and OR Crashes by Driver Performance-Related Factors (FARS 1991-2007)
18
NHTSArsquos National Center for Statistics and Analysis 1200 New Jersey Avenue SE Washington DC 20590
_______________________________________________________________________
33 Vehicle-Related Factors
It is generally believed that ROR crashes are likely to occur due to some vehicle-related factors such as vehicle speeding or vehicle type
331 Vehicle Speeding Status
A crash is considered speeding-related if any driver involved in the crash is charged with a speeding-related offense or if a police officer indicates that racing driving too fast for the conditions or exceeding the posted speed limit was a related factor in the crash 13
Figure 13 shows the percentage frequency distributions of passenger vehicles involved in fatal single-vehicle ROR and OR crashes by vehicle speeding status
Among fatal single-vehicle crashes that involved a speeding vehicle 90 percent were ROR crashes while among crashes that did not involve a speeding vehicle 595 percent were ROR crashes A χ2 test shows that the difference between two percentages is statistically significant (p lt00001) thereby showing that speeding vehicles are more likely to be involved in ROR crashes as compared to non-speeding vehicles
900 595
100 405
0
50
100
Speeding (N=113825) Non-Speeding (N=195345)
Pe
rce
nt
ROR OR
Figure 13 Percentage Frequency Distributions of Fatal Single-Vehicle ROR and OR Crashes by Vehicle Speeding Status (FARS 1991-2007)
19
NHTSArsquos National Center for Statistics and Analysis 1200 New Jersey Avenue SE Washington DC 20590
_______________________________________________________________________
500 520 600 670 730 710
500 480 400 330 270 290
00
200
400
600
800
1000
Passenger Car
(N=178430)
LT Pickup
(N=72065)
LT Utility
(N=38970)
LT MiniVan
(N=11159)
LT Other Van (N=7904)
LT Others (N=642)
Pe
rce
nt
ROR OR
Figure 14 shows the percentage frequency distributions of passenger vehicles involved in fatal single-vehicle ROR and OR crashes by passenger vehicle type passenger car light truck (LT) including pickup utility minivan other van and other light trucks) It shows that passenger cars are more likely to be involved in ROR crashes as compared to other passenger vehicle types Minivans (60) are more likely to be involved in ROR crashes (p lt00001) as compared to other vans (52)
332 Vehicle Type
Figure 14 Percentage Frequency Distributions of Fatal Single-Vehicle ROR and OR Crashes by Vehicle Type (FARS 1991-2007)
20
NHTSArsquos National Center for Statistics and Analysis 1200 New Jersey Avenue SE Washington DC 20590
_______________________________________________________________________
4 Logistic Regression
The analysis in the previous sections shows that factors such as driver sleepiness alcohol use vehicle speeding curved roadway rural roads etc are significant contributors to the occurrence of fatal single-vehicle ROR crashes It remains to assess their relative influence as well as estimate the amount of risk each carries in the occurrence of such crashes Logistic regression was used for this purpose This is a modeling procedure that predicts the probability (p) of occurrence of an event (fatal single-vehicle ROR crash in the present case) as a consequence of certain roadway- driver- environment- and vehicle-related factors such as sleepy alcohol use weather condition lighting condition speeding status road function etc Generally the logistic regression model provides log of odds as a function of the predictors
Log (odds) = a0 + a1timesdriver performance-related factor + a2timesalcohol use + a3timesspeeding status + a4timesweather condition + a5timeslighting conditionhellip + aktimesspeeding statustimesweather condition + ak+1timesspeeding statustimesdriverrsquos age +helliphellip
where a0 is the intercept and a1 a2 a3 helliphellip ak ak+1 helliphellip are the regression coefficients
As in the previous analysis FARS data was used in the modeling procedure Since in FARS driverrsquos alcohol involvement is estimated by Multiple Imputation (MI) 16 17
procedure the SAS MIANALYZE procedure was used in this study to perform the analysis of the MI data generated from the logistic regression18
21
NHTSArsquos National Center for Statistics and Analysis 1200 New Jersey Avenue SE Washington DC 20590
_______________________________________________________________________
41 Logistic Regression Results and Interpretation
Of all the variables considered in the logistic regression only 10 showed up as significant predictors (95 confidence level) As regards the interaction effect of these factors only the interaction of speeding with other variables was considered However only three of these interactions emerged as significant (95 confidence level) The results in Table 1 present estimates of regression coefficients and the corresponding odds ratio only for significant main effects and interactions Since the independent variables (predictors) are dichotomous the influence of the corresponding factors can be compared simply by comparing their regression coefficients
The ordered (decreasing) estimates of regression coefficients in Table 1 show that the most influential factor in the occurrence of fatal single-vehicle ROR crashes is the driver performance-related factor sleepy followed by alcohol use roadway alignment with curve speeding passenger car rural roadway number of lanes high-speed-limit road adverse weather and avoiding With regard to the interaction effect of speeding with other factors speeding with drivers of age groups 15 to 24 and 25 to 44 as well as speeding under adverse weather are significant contributors to the likelihood of ROR crashes
Table 1 Multiple Imputation Parameter Estimates Dagger
Variables Estimate Odds Ratio Driver performance-related factor sleepy vs others 11675 Dagger 321 Driver with alcohol BAC=01+ gdL vs BAC=0 06605 Dagger 194 Road alignment curve vs straight 05535 Dagger 174 Vehicle speeding status speeding vs non-speeding 04966 Dagger 164 Vehicle type passenger car vs other LTs 04780 Dagger 161 Road function rural vs urban 03637 Dagger 144 Roadway of lanes one or two (undivided) vs three amp more (undivided) 03346 Dagger 141 Road speed limit ge 60 mph vs lt60 mph 02659 Dagger 130 Weather adverse vs good 02130 Dagger 124 Driver performance-related factor avoiding vs others 02007 Dagger 122 Weather timesSpeeding status adverse amp speeding vs good amp non-speeding 01056 Dagger 111 Driver Age times Speeding status 25-44 amp speeding vs 65+ amp non-speeding 01003 Dagger 111 Driver Age times Speeding status 15-24 amp speeding vs 65+ amp non-speeding 00578 Dagger 106
Statistically significant variables (α = 005) associated with the high risk (odds ratio gt100) Other variables with low risk (odds ratio lt100) or insignificance (pgt005) after jointly estimating the effect are not shown here Dagger p-value lt00001
One of the most important by-product of logistic regression is the estimate of odds ratio that tells a great deal about the risk a certain factor carries in contributing to the occurrence of ROR crashes Specifically odds ratio measures the magnitude of increase in odds of happening of an event as a result of a unit increase in a predictor (eg sober and alcohol-used driver) An odds ratio value of 1 is indicative of no influence Table 1 also shows odds ratio estimates of significant factors and interactions
22
NHTSArsquos National Center for Statistics and Analysis 1200 New Jersey Avenue SE Washington DC 20590
_______________________________________________________________________
1
250 226
o 200
ita 164
Rd
s 150
d 124
O 100 100
050
Non-Speeding+Good Weather Non-Speeding+Adverse Weather
Speeding+Good Weather Speeding+Adverse Weather
Figure 15 Odds Ratio by Speeding Status and Weather Conditions
The odds ratio 321 for the factor ldquodriver performance-related factorrdquo shows that the odds of being involved in an ROR crash for a sleepy driver are three times as large as that for the driver who is not sleepy
The odds ratio 194 for the factor ldquodriver with alcoholrdquo shows that the odds of being involved in an ROR crash for an alcohol used driver (BAC=01+ gdL) are almost two times as large as that for a sober driver (BAC=0)
The odds ratio 174 for the factor ldquoroad alignmentrdquo shows that the odds of being involved in an ROR crash on curved roadways are 174 times as large as that on straight roadways in fatal single-vehicle crashes
The odds ratio 164 for the factor ldquovehicle speeding statusrdquo shows that the odds of being involved in an ROR crash for speeding vehicles are 164 times as large as that for non-speeding vehicles
The odds ratio 161 for the factor ldquovehicle typerdquo shows that the odds of being involved in an ROR crash for passenger cars are 161 times as large as that for other LTs
The odds ratio 144 for the factor ldquoroad functionrdquo shows that the odds of being involved in an ROR crash on rural roadways are 144 times as large as that on urban roadways
The odds ratio 266 for the factor ldquoweather amp speeding statusrdquo shows that the odds of being involved in an ROR crash under the adverse weather and in speeding vehicle are 266 (=164times124times111) times as large as that under the good weather and in non-speeding vehicle (Figure 15)
23
NHTSArsquos National Center for Statistics and Analysis 1200 New Jersey Avenue SE Washington DC 20590
_______________________________________________________________________
5 Conclusions
Run-off-road crashes account for a significant percentage (around 70) of all fatal single-vehicle crashes FARS data (1991 to 2007) that includes detailed information about ROR crashes provided sufficient statistical evidence to conclude that certain roadway- driver- environment- and vehicle-related factors closely associated with the occurrence of these crashes Appropriate crash countermeasures based on the identified factors can reduce the occurrence of single-vehicle ROR crashes and hence of the fatalities
Curved road segments rural roads high-speed-limit roadways and roadways with fewer lanes (divided or undivided) are found to be more likely to be the scene of fatal single-vehicle ROR crashes as compared to the fatal single-vehicle OR crashes Similarly among environmental factors adverse weather and night time periods are the factors associated with high risk of fatal single-vehicle ROR crashes
Vehicles with high occupancy (two and more occupants) male driver younger driver and alcohol used by driver are more likely to be involved in fatal single-vehicle ROR crashes as compared to the fatal single-vehicle OR crashes Drivers with performance-related factors (sleepy inattentive over-correction avoiding etc) are more likely to be involved in the fatal single-vehicle ROR crashes Speeding vehicles and passenger cars are also associated with high risks of the fatal single-vehicle ROR crashes
In the adverse weather condition and for the younger drivers (15 to 24 and 25 to 44) the speeding vehicle would increase the risk of fatal single-vehicle ROR crashes by an additional factor
The above facts based on statistical evidence suggest several crash countermeasures For example improving roadway design such as flattening curves and installing shoulder rumble strips or rehabilitation strategies such as building wide lanes or adding additional unpaved shoulder width on entire system providing skid-resistant pavement surfaces could reduce the likelihood of ROR crashes
24
NHTSArsquos National Center for Statistics and Analysis 1200 New Jersey Avenue SE Washington DC 20590
_______________________________________________________________________
6 References
1 FHWA (Undated) Reducing Highway Fatalities Washington DC Federal Highway Administration httpsafetyfhwadotgovroadway5Fdept
2 Neuman T RPfefer R Slack K L Council F McGee H Prothe L amp Eccles K (1998) Guidance for Implementation of the AASHTO Strategic Highway Safety Plan Report 500 Volume 6 A Guide for Addressing Run-Off Road Collisions Washington DC Transportation Research Board Available at httponlinepubstrborgonlinepubsnchrpnchrp_rpt_500v6pdf
3 Spainhour L K amp Mishra A (2007) Analysis of Fatal Run-off-the-Road Crashes Involving Overcorrection TRB 87th Annual Meeting Paper No 08-0661 Washington DC Transportation Research Board
4 McGee H W amp Hanscom F R Low-Cost Treatments for Horizontal Curve Safety FHWA-SA-07-002 December 2006
5 Johnston I Corben B TriggsT Candappa N amp Lenneacute M Reducing Serious Injury and Death from Run-off-Road Crashes in Victoria ndash Turning Knowledge into Action (2006 June) RACV Research Report Victoria Australia Royal Automobile Club of Victoria Ltd
6 Dissanayake S (2003 August) Young Drivers and Run-Off-the-Road Crashes Proceedings of the 2003 Mid-Continent Transportation Research Symposium Ames Iowa
7 Knapp K K Giese K L amp Lee W (2003 August) Urban Four-Lane Undivided to Three-Lane Roadway Conversion Guidelines Proceedings of the 2003 Mid-Continent Transportation Research Symposium Ames Iowa
8 Őrnek E amp Drakopoulos A (2007 August) Analysis of Run-Off-Road Crashes in Relation to Roadway Features and Driver Behavior Proceedings of the 2007 Mid-Continent Transportation Research Symposium Ames Iowa
9 Ray M H amp McGinnis R G (1997) Guardrail and Median Barrier Crashworthiness A Synthesis of Highway Practice NCHRP Synthesis 244 Washington DC Transportation Research Board National Research Council
10 Roadside Design Guide (2006) 3rd Edition Washington DC American Association of State Highway and Transportation Officials
25
NHTSArsquos National Center for Statistics and Analysis 1200 New Jersey Avenue SE Washington DC 20590
_______________________________________________________________________
11 Elvik R (1995) The Safety Value of Guardrails and Crash Cushions A Meta-Analysis of Evidence from Evaluation Studies Accident Analysis and Prevention 27 (4)
12 Stutts J C Reinfurth D W Staplin L amp Rodgman EA (2001 May) The Role of Driver Distraction in Traffic Crashes Washington DC AAA Foundation for Traffic Safety
13 Liu C Chen C-L Subramanian R amp Utter D (2005 June) Analysis of Speeding-Related Fatal Motor Vehicle Traffic Crashes NHTSA Technical Report DOT HS 809 839 Washington DC National Highway Traffic Safety Administration
14 Hosmer Jr D W and Lemeshow S (1989) Applied Logistic Regression New York John Wiley amp Sons Inc
15 SAS Institute Inc (1995) Logistic Regression Examples using SAS system Cary NC SAS Institute Inc
16 Rubin D B Schafer J L amp Subramanian R (1998 October) Multiple Imputation of Missing Blood Alcohol Concentration (BAC) Values in FARS NHTSA Technical Report DOT HS 808 816 Washington DC National Highway Traffic Safety Administration
17 Subramanian R (2005 March) Alcohol Involvement in Fatal Motor Vehicle Traffic Crashes NHTSA Technical Report DOT HS 809 822 Washington DC National Highway Traffic Safety Administration
18 SASSTAT Userrsquos Guide Version 8 1999 Cary NC SAS Institute Inc
26
NHTSArsquos National Center for Statistics and Analysis 1200 New Jersey Avenue SE Washington DC 20590
DOT HS 811 232November 2009
_______________________________________________________________________
325 Driver-Performance-Related Factors
Some of the driver performance-related factors that are likely to contribute to the occurrence of ROR crashes were also examined
These include (1) sleepy (drowsy asleep fatigued and sleepy) (2) inattentive (talking eating etc) (3) over-correcting of the vehicle (4) avoiding (avoiding swerving or sliding due to severe crosswind tire blow-out or flat live animals in road vehicle in road etc) (5) distractions inside vehicles (cellular telephone computer fax machine etc) and (6) other driver-performance-related factors such as mentally challenged following improperly failure to signal intensions etc
Figure 12 shows the percentage frequency distributions of passenger vehicles involved in fatal single-vehicle ROR and OR crashes based on the driver performance-related factors The statistics show that the percentages of sleepy (912) inattentive (754) over correction of the vehicle (856) and crash avoiding (798) drivers involved in fatal single-vehicle ROR crashes are significantly greater (p lt00001) than the drivers with lsquoOther driver performance-related factorsrsquo that account for 67 percent of ROR crashes
This means that drivers with these performance-related factors (sleepy inattentive over correction avoiding etc) are more likely to be involved in ROR crashes as compared to drivers with other performance-related factors These results are consistent with those obtained from other studies using different approaches and other crash databases 2-11
17
NHTSArsquos National Center for Statistics and Analysis 1200 New Jersey Avenue SE Washington DC 20590
_______________________________________________________________________
672 671 798 856 754 912
328 329 202 144 246 88
0
20
40
60
80
100
Sleepy (N=14774)
Inattention (N=28081)
Overcorrect (N=19289)
Avoiding (N=14145)
Possible Distraction (N=1429)
Others (N=227587)
Per
cen
t
ROR OR
Figure 12 Percentage Frequency Distributions of Fatal Single-Vehicle ROR and OR Crashes by Driver Performance-Related Factors (FARS 1991-2007)
18
NHTSArsquos National Center for Statistics and Analysis 1200 New Jersey Avenue SE Washington DC 20590
_______________________________________________________________________
33 Vehicle-Related Factors
It is generally believed that ROR crashes are likely to occur due to some vehicle-related factors such as vehicle speeding or vehicle type
331 Vehicle Speeding Status
A crash is considered speeding-related if any driver involved in the crash is charged with a speeding-related offense or if a police officer indicates that racing driving too fast for the conditions or exceeding the posted speed limit was a related factor in the crash 13
Figure 13 shows the percentage frequency distributions of passenger vehicles involved in fatal single-vehicle ROR and OR crashes by vehicle speeding status
Among fatal single-vehicle crashes that involved a speeding vehicle 90 percent were ROR crashes while among crashes that did not involve a speeding vehicle 595 percent were ROR crashes A χ2 test shows that the difference between two percentages is statistically significant (p lt00001) thereby showing that speeding vehicles are more likely to be involved in ROR crashes as compared to non-speeding vehicles
900 595
100 405
0
50
100
Speeding (N=113825) Non-Speeding (N=195345)
Pe
rce
nt
ROR OR
Figure 13 Percentage Frequency Distributions of Fatal Single-Vehicle ROR and OR Crashes by Vehicle Speeding Status (FARS 1991-2007)
19
NHTSArsquos National Center for Statistics and Analysis 1200 New Jersey Avenue SE Washington DC 20590
_______________________________________________________________________
500 520 600 670 730 710
500 480 400 330 270 290
00
200
400
600
800
1000
Passenger Car
(N=178430)
LT Pickup
(N=72065)
LT Utility
(N=38970)
LT MiniVan
(N=11159)
LT Other Van (N=7904)
LT Others (N=642)
Pe
rce
nt
ROR OR
Figure 14 shows the percentage frequency distributions of passenger vehicles involved in fatal single-vehicle ROR and OR crashes by passenger vehicle type passenger car light truck (LT) including pickup utility minivan other van and other light trucks) It shows that passenger cars are more likely to be involved in ROR crashes as compared to other passenger vehicle types Minivans (60) are more likely to be involved in ROR crashes (p lt00001) as compared to other vans (52)
332 Vehicle Type
Figure 14 Percentage Frequency Distributions of Fatal Single-Vehicle ROR and OR Crashes by Vehicle Type (FARS 1991-2007)
20
NHTSArsquos National Center for Statistics and Analysis 1200 New Jersey Avenue SE Washington DC 20590
_______________________________________________________________________
4 Logistic Regression
The analysis in the previous sections shows that factors such as driver sleepiness alcohol use vehicle speeding curved roadway rural roads etc are significant contributors to the occurrence of fatal single-vehicle ROR crashes It remains to assess their relative influence as well as estimate the amount of risk each carries in the occurrence of such crashes Logistic regression was used for this purpose This is a modeling procedure that predicts the probability (p) of occurrence of an event (fatal single-vehicle ROR crash in the present case) as a consequence of certain roadway- driver- environment- and vehicle-related factors such as sleepy alcohol use weather condition lighting condition speeding status road function etc Generally the logistic regression model provides log of odds as a function of the predictors
Log (odds) = a0 + a1timesdriver performance-related factor + a2timesalcohol use + a3timesspeeding status + a4timesweather condition + a5timeslighting conditionhellip + aktimesspeeding statustimesweather condition + ak+1timesspeeding statustimesdriverrsquos age +helliphellip
where a0 is the intercept and a1 a2 a3 helliphellip ak ak+1 helliphellip are the regression coefficients
As in the previous analysis FARS data was used in the modeling procedure Since in FARS driverrsquos alcohol involvement is estimated by Multiple Imputation (MI) 16 17
procedure the SAS MIANALYZE procedure was used in this study to perform the analysis of the MI data generated from the logistic regression18
21
NHTSArsquos National Center for Statistics and Analysis 1200 New Jersey Avenue SE Washington DC 20590
_______________________________________________________________________
41 Logistic Regression Results and Interpretation
Of all the variables considered in the logistic regression only 10 showed up as significant predictors (95 confidence level) As regards the interaction effect of these factors only the interaction of speeding with other variables was considered However only three of these interactions emerged as significant (95 confidence level) The results in Table 1 present estimates of regression coefficients and the corresponding odds ratio only for significant main effects and interactions Since the independent variables (predictors) are dichotomous the influence of the corresponding factors can be compared simply by comparing their regression coefficients
The ordered (decreasing) estimates of regression coefficients in Table 1 show that the most influential factor in the occurrence of fatal single-vehicle ROR crashes is the driver performance-related factor sleepy followed by alcohol use roadway alignment with curve speeding passenger car rural roadway number of lanes high-speed-limit road adverse weather and avoiding With regard to the interaction effect of speeding with other factors speeding with drivers of age groups 15 to 24 and 25 to 44 as well as speeding under adverse weather are significant contributors to the likelihood of ROR crashes
Table 1 Multiple Imputation Parameter Estimates Dagger
Variables Estimate Odds Ratio Driver performance-related factor sleepy vs others 11675 Dagger 321 Driver with alcohol BAC=01+ gdL vs BAC=0 06605 Dagger 194 Road alignment curve vs straight 05535 Dagger 174 Vehicle speeding status speeding vs non-speeding 04966 Dagger 164 Vehicle type passenger car vs other LTs 04780 Dagger 161 Road function rural vs urban 03637 Dagger 144 Roadway of lanes one or two (undivided) vs three amp more (undivided) 03346 Dagger 141 Road speed limit ge 60 mph vs lt60 mph 02659 Dagger 130 Weather adverse vs good 02130 Dagger 124 Driver performance-related factor avoiding vs others 02007 Dagger 122 Weather timesSpeeding status adverse amp speeding vs good amp non-speeding 01056 Dagger 111 Driver Age times Speeding status 25-44 amp speeding vs 65+ amp non-speeding 01003 Dagger 111 Driver Age times Speeding status 15-24 amp speeding vs 65+ amp non-speeding 00578 Dagger 106
Statistically significant variables (α = 005) associated with the high risk (odds ratio gt100) Other variables with low risk (odds ratio lt100) or insignificance (pgt005) after jointly estimating the effect are not shown here Dagger p-value lt00001
One of the most important by-product of logistic regression is the estimate of odds ratio that tells a great deal about the risk a certain factor carries in contributing to the occurrence of ROR crashes Specifically odds ratio measures the magnitude of increase in odds of happening of an event as a result of a unit increase in a predictor (eg sober and alcohol-used driver) An odds ratio value of 1 is indicative of no influence Table 1 also shows odds ratio estimates of significant factors and interactions
22
NHTSArsquos National Center for Statistics and Analysis 1200 New Jersey Avenue SE Washington DC 20590
_______________________________________________________________________
1
250 226
o 200
ita 164
Rd
s 150
d 124
O 100 100
050
Non-Speeding+Good Weather Non-Speeding+Adverse Weather
Speeding+Good Weather Speeding+Adverse Weather
Figure 15 Odds Ratio by Speeding Status and Weather Conditions
The odds ratio 321 for the factor ldquodriver performance-related factorrdquo shows that the odds of being involved in an ROR crash for a sleepy driver are three times as large as that for the driver who is not sleepy
The odds ratio 194 for the factor ldquodriver with alcoholrdquo shows that the odds of being involved in an ROR crash for an alcohol used driver (BAC=01+ gdL) are almost two times as large as that for a sober driver (BAC=0)
The odds ratio 174 for the factor ldquoroad alignmentrdquo shows that the odds of being involved in an ROR crash on curved roadways are 174 times as large as that on straight roadways in fatal single-vehicle crashes
The odds ratio 164 for the factor ldquovehicle speeding statusrdquo shows that the odds of being involved in an ROR crash for speeding vehicles are 164 times as large as that for non-speeding vehicles
The odds ratio 161 for the factor ldquovehicle typerdquo shows that the odds of being involved in an ROR crash for passenger cars are 161 times as large as that for other LTs
The odds ratio 144 for the factor ldquoroad functionrdquo shows that the odds of being involved in an ROR crash on rural roadways are 144 times as large as that on urban roadways
The odds ratio 266 for the factor ldquoweather amp speeding statusrdquo shows that the odds of being involved in an ROR crash under the adverse weather and in speeding vehicle are 266 (=164times124times111) times as large as that under the good weather and in non-speeding vehicle (Figure 15)
23
NHTSArsquos National Center for Statistics and Analysis 1200 New Jersey Avenue SE Washington DC 20590
_______________________________________________________________________
5 Conclusions
Run-off-road crashes account for a significant percentage (around 70) of all fatal single-vehicle crashes FARS data (1991 to 2007) that includes detailed information about ROR crashes provided sufficient statistical evidence to conclude that certain roadway- driver- environment- and vehicle-related factors closely associated with the occurrence of these crashes Appropriate crash countermeasures based on the identified factors can reduce the occurrence of single-vehicle ROR crashes and hence of the fatalities
Curved road segments rural roads high-speed-limit roadways and roadways with fewer lanes (divided or undivided) are found to be more likely to be the scene of fatal single-vehicle ROR crashes as compared to the fatal single-vehicle OR crashes Similarly among environmental factors adverse weather and night time periods are the factors associated with high risk of fatal single-vehicle ROR crashes
Vehicles with high occupancy (two and more occupants) male driver younger driver and alcohol used by driver are more likely to be involved in fatal single-vehicle ROR crashes as compared to the fatal single-vehicle OR crashes Drivers with performance-related factors (sleepy inattentive over-correction avoiding etc) are more likely to be involved in the fatal single-vehicle ROR crashes Speeding vehicles and passenger cars are also associated with high risks of the fatal single-vehicle ROR crashes
In the adverse weather condition and for the younger drivers (15 to 24 and 25 to 44) the speeding vehicle would increase the risk of fatal single-vehicle ROR crashes by an additional factor
The above facts based on statistical evidence suggest several crash countermeasures For example improving roadway design such as flattening curves and installing shoulder rumble strips or rehabilitation strategies such as building wide lanes or adding additional unpaved shoulder width on entire system providing skid-resistant pavement surfaces could reduce the likelihood of ROR crashes
24
NHTSArsquos National Center for Statistics and Analysis 1200 New Jersey Avenue SE Washington DC 20590
_______________________________________________________________________
6 References
1 FHWA (Undated) Reducing Highway Fatalities Washington DC Federal Highway Administration httpsafetyfhwadotgovroadway5Fdept
2 Neuman T RPfefer R Slack K L Council F McGee H Prothe L amp Eccles K (1998) Guidance for Implementation of the AASHTO Strategic Highway Safety Plan Report 500 Volume 6 A Guide for Addressing Run-Off Road Collisions Washington DC Transportation Research Board Available at httponlinepubstrborgonlinepubsnchrpnchrp_rpt_500v6pdf
3 Spainhour L K amp Mishra A (2007) Analysis of Fatal Run-off-the-Road Crashes Involving Overcorrection TRB 87th Annual Meeting Paper No 08-0661 Washington DC Transportation Research Board
4 McGee H W amp Hanscom F R Low-Cost Treatments for Horizontal Curve Safety FHWA-SA-07-002 December 2006
5 Johnston I Corben B TriggsT Candappa N amp Lenneacute M Reducing Serious Injury and Death from Run-off-Road Crashes in Victoria ndash Turning Knowledge into Action (2006 June) RACV Research Report Victoria Australia Royal Automobile Club of Victoria Ltd
6 Dissanayake S (2003 August) Young Drivers and Run-Off-the-Road Crashes Proceedings of the 2003 Mid-Continent Transportation Research Symposium Ames Iowa
7 Knapp K K Giese K L amp Lee W (2003 August) Urban Four-Lane Undivided to Three-Lane Roadway Conversion Guidelines Proceedings of the 2003 Mid-Continent Transportation Research Symposium Ames Iowa
8 Őrnek E amp Drakopoulos A (2007 August) Analysis of Run-Off-Road Crashes in Relation to Roadway Features and Driver Behavior Proceedings of the 2007 Mid-Continent Transportation Research Symposium Ames Iowa
9 Ray M H amp McGinnis R G (1997) Guardrail and Median Barrier Crashworthiness A Synthesis of Highway Practice NCHRP Synthesis 244 Washington DC Transportation Research Board National Research Council
10 Roadside Design Guide (2006) 3rd Edition Washington DC American Association of State Highway and Transportation Officials
25
NHTSArsquos National Center for Statistics and Analysis 1200 New Jersey Avenue SE Washington DC 20590
_______________________________________________________________________
11 Elvik R (1995) The Safety Value of Guardrails and Crash Cushions A Meta-Analysis of Evidence from Evaluation Studies Accident Analysis and Prevention 27 (4)
12 Stutts J C Reinfurth D W Staplin L amp Rodgman EA (2001 May) The Role of Driver Distraction in Traffic Crashes Washington DC AAA Foundation for Traffic Safety
13 Liu C Chen C-L Subramanian R amp Utter D (2005 June) Analysis of Speeding-Related Fatal Motor Vehicle Traffic Crashes NHTSA Technical Report DOT HS 809 839 Washington DC National Highway Traffic Safety Administration
14 Hosmer Jr D W and Lemeshow S (1989) Applied Logistic Regression New York John Wiley amp Sons Inc
15 SAS Institute Inc (1995) Logistic Regression Examples using SAS system Cary NC SAS Institute Inc
16 Rubin D B Schafer J L amp Subramanian R (1998 October) Multiple Imputation of Missing Blood Alcohol Concentration (BAC) Values in FARS NHTSA Technical Report DOT HS 808 816 Washington DC National Highway Traffic Safety Administration
17 Subramanian R (2005 March) Alcohol Involvement in Fatal Motor Vehicle Traffic Crashes NHTSA Technical Report DOT HS 809 822 Washington DC National Highway Traffic Safety Administration
18 SASSTAT Userrsquos Guide Version 8 1999 Cary NC SAS Institute Inc
26
NHTSArsquos National Center for Statistics and Analysis 1200 New Jersey Avenue SE Washington DC 20590
DOT HS 811 232November 2009
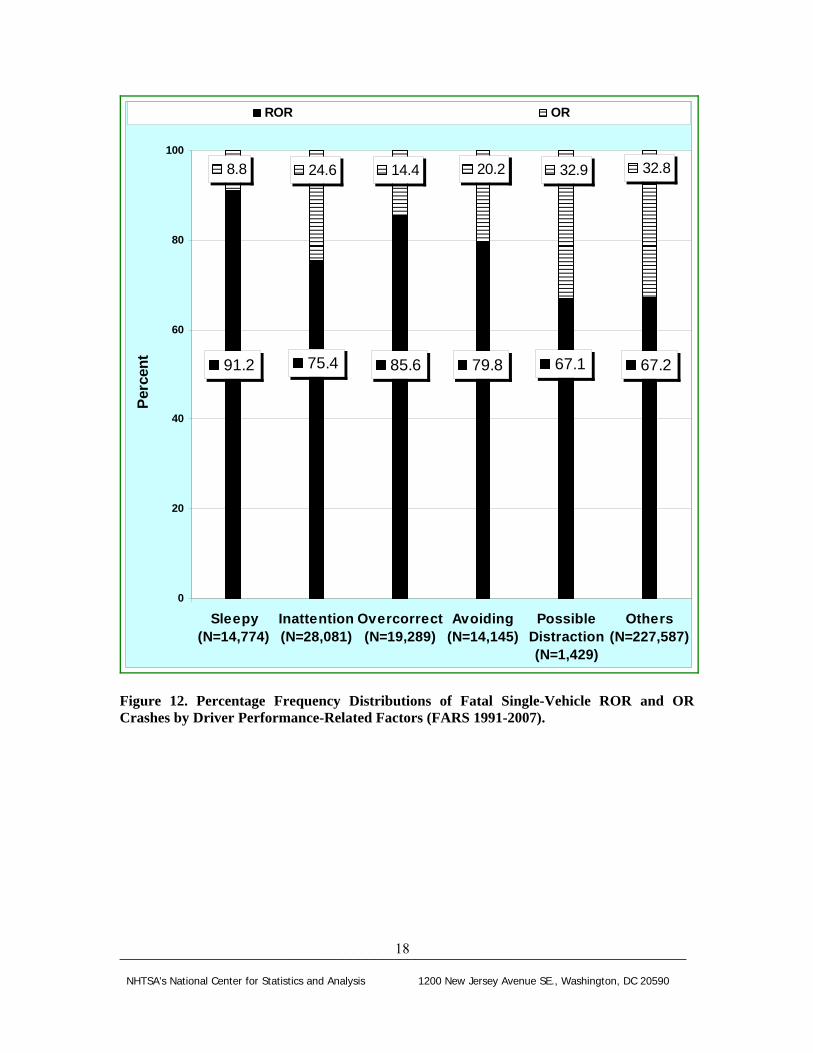
_______________________________________________________________________
672 671 798 856 754 912
328 329 202 144 246 88
0
20
40
60
80
100
Sleepy (N=14774)
Inattention (N=28081)
Overcorrect (N=19289)
Avoiding (N=14145)
Possible Distraction (N=1429)
Others (N=227587)
Per
cen
t
ROR OR
Figure 12 Percentage Frequency Distributions of Fatal Single-Vehicle ROR and OR Crashes by Driver Performance-Related Factors (FARS 1991-2007)
18
NHTSArsquos National Center for Statistics and Analysis 1200 New Jersey Avenue SE Washington DC 20590
_______________________________________________________________________
33 Vehicle-Related Factors
It is generally believed that ROR crashes are likely to occur due to some vehicle-related factors such as vehicle speeding or vehicle type
331 Vehicle Speeding Status
A crash is considered speeding-related if any driver involved in the crash is charged with a speeding-related offense or if a police officer indicates that racing driving too fast for the conditions or exceeding the posted speed limit was a related factor in the crash 13
Figure 13 shows the percentage frequency distributions of passenger vehicles involved in fatal single-vehicle ROR and OR crashes by vehicle speeding status
Among fatal single-vehicle crashes that involved a speeding vehicle 90 percent were ROR crashes while among crashes that did not involve a speeding vehicle 595 percent were ROR crashes A χ2 test shows that the difference between two percentages is statistically significant (p lt00001) thereby showing that speeding vehicles are more likely to be involved in ROR crashes as compared to non-speeding vehicles
900 595
100 405
0
50
100
Speeding (N=113825) Non-Speeding (N=195345)
Pe
rce
nt
ROR OR
Figure 13 Percentage Frequency Distributions of Fatal Single-Vehicle ROR and OR Crashes by Vehicle Speeding Status (FARS 1991-2007)
19
NHTSArsquos National Center for Statistics and Analysis 1200 New Jersey Avenue SE Washington DC 20590
_______________________________________________________________________
500 520 600 670 730 710
500 480 400 330 270 290
00
200
400
600
800
1000
Passenger Car
(N=178430)
LT Pickup
(N=72065)
LT Utility
(N=38970)
LT MiniVan
(N=11159)
LT Other Van (N=7904)
LT Others (N=642)
Pe
rce
nt
ROR OR
Figure 14 shows the percentage frequency distributions of passenger vehicles involved in fatal single-vehicle ROR and OR crashes by passenger vehicle type passenger car light truck (LT) including pickup utility minivan other van and other light trucks) It shows that passenger cars are more likely to be involved in ROR crashes as compared to other passenger vehicle types Minivans (60) are more likely to be involved in ROR crashes (p lt00001) as compared to other vans (52)
332 Vehicle Type
Figure 14 Percentage Frequency Distributions of Fatal Single-Vehicle ROR and OR Crashes by Vehicle Type (FARS 1991-2007)
20
NHTSArsquos National Center for Statistics and Analysis 1200 New Jersey Avenue SE Washington DC 20590
_______________________________________________________________________
4 Logistic Regression
The analysis in the previous sections shows that factors such as driver sleepiness alcohol use vehicle speeding curved roadway rural roads etc are significant contributors to the occurrence of fatal single-vehicle ROR crashes It remains to assess their relative influence as well as estimate the amount of risk each carries in the occurrence of such crashes Logistic regression was used for this purpose This is a modeling procedure that predicts the probability (p) of occurrence of an event (fatal single-vehicle ROR crash in the present case) as a consequence of certain roadway- driver- environment- and vehicle-related factors such as sleepy alcohol use weather condition lighting condition speeding status road function etc Generally the logistic regression model provides log of odds as a function of the predictors
Log (odds) = a0 + a1timesdriver performance-related factor + a2timesalcohol use + a3timesspeeding status + a4timesweather condition + a5timeslighting conditionhellip + aktimesspeeding statustimesweather condition + ak+1timesspeeding statustimesdriverrsquos age +helliphellip
where a0 is the intercept and a1 a2 a3 helliphellip ak ak+1 helliphellip are the regression coefficients
As in the previous analysis FARS data was used in the modeling procedure Since in FARS driverrsquos alcohol involvement is estimated by Multiple Imputation (MI) 16 17
procedure the SAS MIANALYZE procedure was used in this study to perform the analysis of the MI data generated from the logistic regression18
21
NHTSArsquos National Center for Statistics and Analysis 1200 New Jersey Avenue SE Washington DC 20590
_______________________________________________________________________
41 Logistic Regression Results and Interpretation
Of all the variables considered in the logistic regression only 10 showed up as significant predictors (95 confidence level) As regards the interaction effect of these factors only the interaction of speeding with other variables was considered However only three of these interactions emerged as significant (95 confidence level) The results in Table 1 present estimates of regression coefficients and the corresponding odds ratio only for significant main effects and interactions Since the independent variables (predictors) are dichotomous the influence of the corresponding factors can be compared simply by comparing their regression coefficients
The ordered (decreasing) estimates of regression coefficients in Table 1 show that the most influential factor in the occurrence of fatal single-vehicle ROR crashes is the driver performance-related factor sleepy followed by alcohol use roadway alignment with curve speeding passenger car rural roadway number of lanes high-speed-limit road adverse weather and avoiding With regard to the interaction effect of speeding with other factors speeding with drivers of age groups 15 to 24 and 25 to 44 as well as speeding under adverse weather are significant contributors to the likelihood of ROR crashes
Table 1 Multiple Imputation Parameter Estimates Dagger
Variables Estimate Odds Ratio Driver performance-related factor sleepy vs others 11675 Dagger 321 Driver with alcohol BAC=01+ gdL vs BAC=0 06605 Dagger 194 Road alignment curve vs straight 05535 Dagger 174 Vehicle speeding status speeding vs non-speeding 04966 Dagger 164 Vehicle type passenger car vs other LTs 04780 Dagger 161 Road function rural vs urban 03637 Dagger 144 Roadway of lanes one or two (undivided) vs three amp more (undivided) 03346 Dagger 141 Road speed limit ge 60 mph vs lt60 mph 02659 Dagger 130 Weather adverse vs good 02130 Dagger 124 Driver performance-related factor avoiding vs others 02007 Dagger 122 Weather timesSpeeding status adverse amp speeding vs good amp non-speeding 01056 Dagger 111 Driver Age times Speeding status 25-44 amp speeding vs 65+ amp non-speeding 01003 Dagger 111 Driver Age times Speeding status 15-24 amp speeding vs 65+ amp non-speeding 00578 Dagger 106
Statistically significant variables (α = 005) associated with the high risk (odds ratio gt100) Other variables with low risk (odds ratio lt100) or insignificance (pgt005) after jointly estimating the effect are not shown here Dagger p-value lt00001
One of the most important by-product of logistic regression is the estimate of odds ratio that tells a great deal about the risk a certain factor carries in contributing to the occurrence of ROR crashes Specifically odds ratio measures the magnitude of increase in odds of happening of an event as a result of a unit increase in a predictor (eg sober and alcohol-used driver) An odds ratio value of 1 is indicative of no influence Table 1 also shows odds ratio estimates of significant factors and interactions
22
NHTSArsquos National Center for Statistics and Analysis 1200 New Jersey Avenue SE Washington DC 20590
_______________________________________________________________________
1
250 226
o 200
ita 164
Rd
s 150
d 124
O 100 100
050
Non-Speeding+Good Weather Non-Speeding+Adverse Weather
Speeding+Good Weather Speeding+Adverse Weather
Figure 15 Odds Ratio by Speeding Status and Weather Conditions
The odds ratio 321 for the factor ldquodriver performance-related factorrdquo shows that the odds of being involved in an ROR crash for a sleepy driver are three times as large as that for the driver who is not sleepy
The odds ratio 194 for the factor ldquodriver with alcoholrdquo shows that the odds of being involved in an ROR crash for an alcohol used driver (BAC=01+ gdL) are almost two times as large as that for a sober driver (BAC=0)
The odds ratio 174 for the factor ldquoroad alignmentrdquo shows that the odds of being involved in an ROR crash on curved roadways are 174 times as large as that on straight roadways in fatal single-vehicle crashes
The odds ratio 164 for the factor ldquovehicle speeding statusrdquo shows that the odds of being involved in an ROR crash for speeding vehicles are 164 times as large as that for non-speeding vehicles
The odds ratio 161 for the factor ldquovehicle typerdquo shows that the odds of being involved in an ROR crash for passenger cars are 161 times as large as that for other LTs
The odds ratio 144 for the factor ldquoroad functionrdquo shows that the odds of being involved in an ROR crash on rural roadways are 144 times as large as that on urban roadways
The odds ratio 266 for the factor ldquoweather amp speeding statusrdquo shows that the odds of being involved in an ROR crash under the adverse weather and in speeding vehicle are 266 (=164times124times111) times as large as that under the good weather and in non-speeding vehicle (Figure 15)
23
NHTSArsquos National Center for Statistics and Analysis 1200 New Jersey Avenue SE Washington DC 20590
_______________________________________________________________________
5 Conclusions
Run-off-road crashes account for a significant percentage (around 70) of all fatal single-vehicle crashes FARS data (1991 to 2007) that includes detailed information about ROR crashes provided sufficient statistical evidence to conclude that certain roadway- driver- environment- and vehicle-related factors closely associated with the occurrence of these crashes Appropriate crash countermeasures based on the identified factors can reduce the occurrence of single-vehicle ROR crashes and hence of the fatalities
Curved road segments rural roads high-speed-limit roadways and roadways with fewer lanes (divided or undivided) are found to be more likely to be the scene of fatal single-vehicle ROR crashes as compared to the fatal single-vehicle OR crashes Similarly among environmental factors adverse weather and night time periods are the factors associated with high risk of fatal single-vehicle ROR crashes
Vehicles with high occupancy (two and more occupants) male driver younger driver and alcohol used by driver are more likely to be involved in fatal single-vehicle ROR crashes as compared to the fatal single-vehicle OR crashes Drivers with performance-related factors (sleepy inattentive over-correction avoiding etc) are more likely to be involved in the fatal single-vehicle ROR crashes Speeding vehicles and passenger cars are also associated with high risks of the fatal single-vehicle ROR crashes
In the adverse weather condition and for the younger drivers (15 to 24 and 25 to 44) the speeding vehicle would increase the risk of fatal single-vehicle ROR crashes by an additional factor
The above facts based on statistical evidence suggest several crash countermeasures For example improving roadway design such as flattening curves and installing shoulder rumble strips or rehabilitation strategies such as building wide lanes or adding additional unpaved shoulder width on entire system providing skid-resistant pavement surfaces could reduce the likelihood of ROR crashes
24
NHTSArsquos National Center for Statistics and Analysis 1200 New Jersey Avenue SE Washington DC 20590
_______________________________________________________________________
6 References
1 FHWA (Undated) Reducing Highway Fatalities Washington DC Federal Highway Administration httpsafetyfhwadotgovroadway5Fdept
2 Neuman T RPfefer R Slack K L Council F McGee H Prothe L amp Eccles K (1998) Guidance for Implementation of the AASHTO Strategic Highway Safety Plan Report 500 Volume 6 A Guide for Addressing Run-Off Road Collisions Washington DC Transportation Research Board Available at httponlinepubstrborgonlinepubsnchrpnchrp_rpt_500v6pdf
3 Spainhour L K amp Mishra A (2007) Analysis of Fatal Run-off-the-Road Crashes Involving Overcorrection TRB 87th Annual Meeting Paper No 08-0661 Washington DC Transportation Research Board
4 McGee H W amp Hanscom F R Low-Cost Treatments for Horizontal Curve Safety FHWA-SA-07-002 December 2006
5 Johnston I Corben B TriggsT Candappa N amp Lenneacute M Reducing Serious Injury and Death from Run-off-Road Crashes in Victoria ndash Turning Knowledge into Action (2006 June) RACV Research Report Victoria Australia Royal Automobile Club of Victoria Ltd
6 Dissanayake S (2003 August) Young Drivers and Run-Off-the-Road Crashes Proceedings of the 2003 Mid-Continent Transportation Research Symposium Ames Iowa
7 Knapp K K Giese K L amp Lee W (2003 August) Urban Four-Lane Undivided to Three-Lane Roadway Conversion Guidelines Proceedings of the 2003 Mid-Continent Transportation Research Symposium Ames Iowa
8 Őrnek E amp Drakopoulos A (2007 August) Analysis of Run-Off-Road Crashes in Relation to Roadway Features and Driver Behavior Proceedings of the 2007 Mid-Continent Transportation Research Symposium Ames Iowa
9 Ray M H amp McGinnis R G (1997) Guardrail and Median Barrier Crashworthiness A Synthesis of Highway Practice NCHRP Synthesis 244 Washington DC Transportation Research Board National Research Council
10 Roadside Design Guide (2006) 3rd Edition Washington DC American Association of State Highway and Transportation Officials
25
NHTSArsquos National Center for Statistics and Analysis 1200 New Jersey Avenue SE Washington DC 20590
_______________________________________________________________________
11 Elvik R (1995) The Safety Value of Guardrails and Crash Cushions A Meta-Analysis of Evidence from Evaluation Studies Accident Analysis and Prevention 27 (4)
12 Stutts J C Reinfurth D W Staplin L amp Rodgman EA (2001 May) The Role of Driver Distraction in Traffic Crashes Washington DC AAA Foundation for Traffic Safety
13 Liu C Chen C-L Subramanian R amp Utter D (2005 June) Analysis of Speeding-Related Fatal Motor Vehicle Traffic Crashes NHTSA Technical Report DOT HS 809 839 Washington DC National Highway Traffic Safety Administration
14 Hosmer Jr D W and Lemeshow S (1989) Applied Logistic Regression New York John Wiley amp Sons Inc
15 SAS Institute Inc (1995) Logistic Regression Examples using SAS system Cary NC SAS Institute Inc
16 Rubin D B Schafer J L amp Subramanian R (1998 October) Multiple Imputation of Missing Blood Alcohol Concentration (BAC) Values in FARS NHTSA Technical Report DOT HS 808 816 Washington DC National Highway Traffic Safety Administration
17 Subramanian R (2005 March) Alcohol Involvement in Fatal Motor Vehicle Traffic Crashes NHTSA Technical Report DOT HS 809 822 Washington DC National Highway Traffic Safety Administration
18 SASSTAT Userrsquos Guide Version 8 1999 Cary NC SAS Institute Inc
26
NHTSArsquos National Center for Statistics and Analysis 1200 New Jersey Avenue SE Washington DC 20590
DOT HS 811 232November 2009
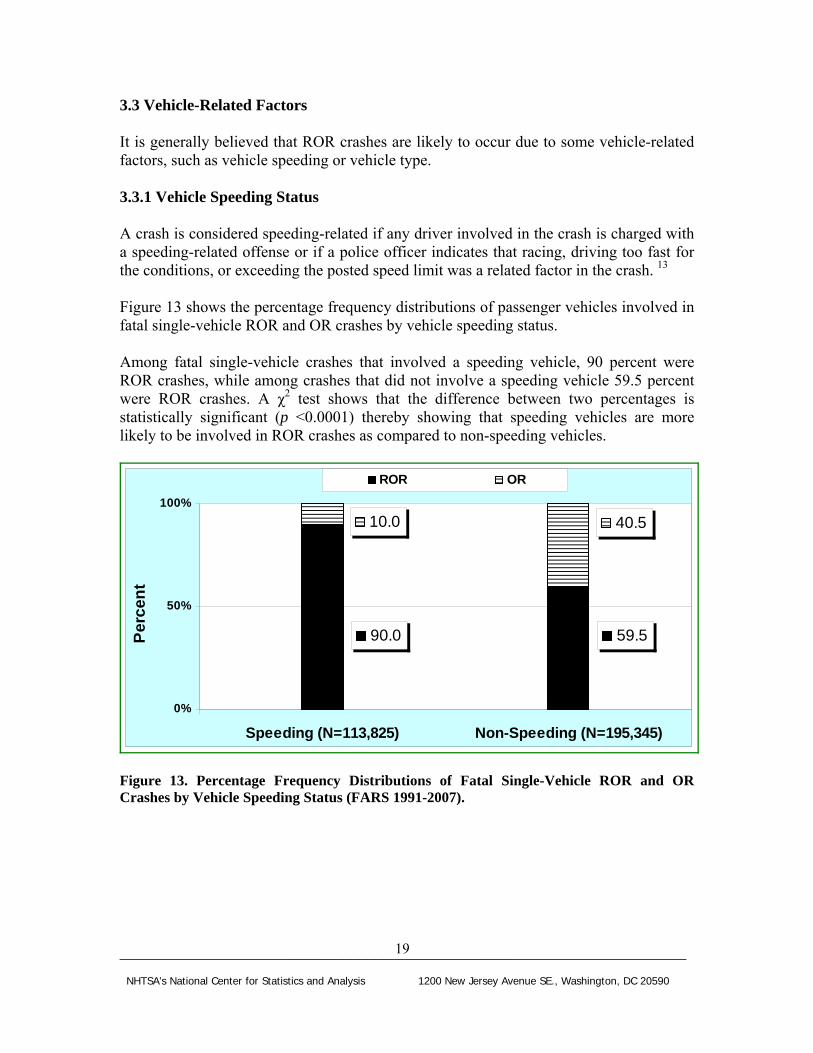
_______________________________________________________________________
33 Vehicle-Related Factors
It is generally believed that ROR crashes are likely to occur due to some vehicle-related factors such as vehicle speeding or vehicle type
331 Vehicle Speeding Status
A crash is considered speeding-related if any driver involved in the crash is charged with a speeding-related offense or if a police officer indicates that racing driving too fast for the conditions or exceeding the posted speed limit was a related factor in the crash 13
Figure 13 shows the percentage frequency distributions of passenger vehicles involved in fatal single-vehicle ROR and OR crashes by vehicle speeding status
Among fatal single-vehicle crashes that involved a speeding vehicle 90 percent were ROR crashes while among crashes that did not involve a speeding vehicle 595 percent were ROR crashes A χ2 test shows that the difference between two percentages is statistically significant (p lt00001) thereby showing that speeding vehicles are more likely to be involved in ROR crashes as compared to non-speeding vehicles
900 595
100 405
0
50
100
Speeding (N=113825) Non-Speeding (N=195345)
Pe
rce
nt
ROR OR
Figure 13 Percentage Frequency Distributions of Fatal Single-Vehicle ROR and OR Crashes by Vehicle Speeding Status (FARS 1991-2007)
19
NHTSArsquos National Center for Statistics and Analysis 1200 New Jersey Avenue SE Washington DC 20590
_______________________________________________________________________
500 520 600 670 730 710
500 480 400 330 270 290
00
200
400
600
800
1000
Passenger Car
(N=178430)
LT Pickup
(N=72065)
LT Utility
(N=38970)
LT MiniVan
(N=11159)
LT Other Van (N=7904)
LT Others (N=642)
Pe
rce
nt
ROR OR
Figure 14 shows the percentage frequency distributions of passenger vehicles involved in fatal single-vehicle ROR and OR crashes by passenger vehicle type passenger car light truck (LT) including pickup utility minivan other van and other light trucks) It shows that passenger cars are more likely to be involved in ROR crashes as compared to other passenger vehicle types Minivans (60) are more likely to be involved in ROR crashes (p lt00001) as compared to other vans (52)
332 Vehicle Type
Figure 14 Percentage Frequency Distributions of Fatal Single-Vehicle ROR and OR Crashes by Vehicle Type (FARS 1991-2007)
20
NHTSArsquos National Center for Statistics and Analysis 1200 New Jersey Avenue SE Washington DC 20590
_______________________________________________________________________
4 Logistic Regression
The analysis in the previous sections shows that factors such as driver sleepiness alcohol use vehicle speeding curved roadway rural roads etc are significant contributors to the occurrence of fatal single-vehicle ROR crashes It remains to assess their relative influence as well as estimate the amount of risk each carries in the occurrence of such crashes Logistic regression was used for this purpose This is a modeling procedure that predicts the probability (p) of occurrence of an event (fatal single-vehicle ROR crash in the present case) as a consequence of certain roadway- driver- environment- and vehicle-related factors such as sleepy alcohol use weather condition lighting condition speeding status road function etc Generally the logistic regression model provides log of odds as a function of the predictors
Log (odds) = a0 + a1timesdriver performance-related factor + a2timesalcohol use + a3timesspeeding status + a4timesweather condition + a5timeslighting conditionhellip + aktimesspeeding statustimesweather condition + ak+1timesspeeding statustimesdriverrsquos age +helliphellip
where a0 is the intercept and a1 a2 a3 helliphellip ak ak+1 helliphellip are the regression coefficients
As in the previous analysis FARS data was used in the modeling procedure Since in FARS driverrsquos alcohol involvement is estimated by Multiple Imputation (MI) 16 17
procedure the SAS MIANALYZE procedure was used in this study to perform the analysis of the MI data generated from the logistic regression18
21
NHTSArsquos National Center for Statistics and Analysis 1200 New Jersey Avenue SE Washington DC 20590
_______________________________________________________________________
41 Logistic Regression Results and Interpretation
Of all the variables considered in the logistic regression only 10 showed up as significant predictors (95 confidence level) As regards the interaction effect of these factors only the interaction of speeding with other variables was considered However only three of these interactions emerged as significant (95 confidence level) The results in Table 1 present estimates of regression coefficients and the corresponding odds ratio only for significant main effects and interactions Since the independent variables (predictors) are dichotomous the influence of the corresponding factors can be compared simply by comparing their regression coefficients
The ordered (decreasing) estimates of regression coefficients in Table 1 show that the most influential factor in the occurrence of fatal single-vehicle ROR crashes is the driver performance-related factor sleepy followed by alcohol use roadway alignment with curve speeding passenger car rural roadway number of lanes high-speed-limit road adverse weather and avoiding With regard to the interaction effect of speeding with other factors speeding with drivers of age groups 15 to 24 and 25 to 44 as well as speeding under adverse weather are significant contributors to the likelihood of ROR crashes
Table 1 Multiple Imputation Parameter Estimates Dagger
Variables Estimate Odds Ratio Driver performance-related factor sleepy vs others 11675 Dagger 321 Driver with alcohol BAC=01+ gdL vs BAC=0 06605 Dagger 194 Road alignment curve vs straight 05535 Dagger 174 Vehicle speeding status speeding vs non-speeding 04966 Dagger 164 Vehicle type passenger car vs other LTs 04780 Dagger 161 Road function rural vs urban 03637 Dagger 144 Roadway of lanes one or two (undivided) vs three amp more (undivided) 03346 Dagger 141 Road speed limit ge 60 mph vs lt60 mph 02659 Dagger 130 Weather adverse vs good 02130 Dagger 124 Driver performance-related factor avoiding vs others 02007 Dagger 122 Weather timesSpeeding status adverse amp speeding vs good amp non-speeding 01056 Dagger 111 Driver Age times Speeding status 25-44 amp speeding vs 65+ amp non-speeding 01003 Dagger 111 Driver Age times Speeding status 15-24 amp speeding vs 65+ amp non-speeding 00578 Dagger 106
Statistically significant variables (α = 005) associated with the high risk (odds ratio gt100) Other variables with low risk (odds ratio lt100) or insignificance (pgt005) after jointly estimating the effect are not shown here Dagger p-value lt00001
One of the most important by-product of logistic regression is the estimate of odds ratio that tells a great deal about the risk a certain factor carries in contributing to the occurrence of ROR crashes Specifically odds ratio measures the magnitude of increase in odds of happening of an event as a result of a unit increase in a predictor (eg sober and alcohol-used driver) An odds ratio value of 1 is indicative of no influence Table 1 also shows odds ratio estimates of significant factors and interactions
22
NHTSArsquos National Center for Statistics and Analysis 1200 New Jersey Avenue SE Washington DC 20590
_______________________________________________________________________
1
250 226
o 200
ita 164
Rd
s 150
d 124
O 100 100
050
Non-Speeding+Good Weather Non-Speeding+Adverse Weather
Speeding+Good Weather Speeding+Adverse Weather
Figure 15 Odds Ratio by Speeding Status and Weather Conditions
The odds ratio 321 for the factor ldquodriver performance-related factorrdquo shows that the odds of being involved in an ROR crash for a sleepy driver are three times as large as that for the driver who is not sleepy
The odds ratio 194 for the factor ldquodriver with alcoholrdquo shows that the odds of being involved in an ROR crash for an alcohol used driver (BAC=01+ gdL) are almost two times as large as that for a sober driver (BAC=0)
The odds ratio 174 for the factor ldquoroad alignmentrdquo shows that the odds of being involved in an ROR crash on curved roadways are 174 times as large as that on straight roadways in fatal single-vehicle crashes
The odds ratio 164 for the factor ldquovehicle speeding statusrdquo shows that the odds of being involved in an ROR crash for speeding vehicles are 164 times as large as that for non-speeding vehicles
The odds ratio 161 for the factor ldquovehicle typerdquo shows that the odds of being involved in an ROR crash for passenger cars are 161 times as large as that for other LTs
The odds ratio 144 for the factor ldquoroad functionrdquo shows that the odds of being involved in an ROR crash on rural roadways are 144 times as large as that on urban roadways
The odds ratio 266 for the factor ldquoweather amp speeding statusrdquo shows that the odds of being involved in an ROR crash under the adverse weather and in speeding vehicle are 266 (=164times124times111) times as large as that under the good weather and in non-speeding vehicle (Figure 15)
23
NHTSArsquos National Center for Statistics and Analysis 1200 New Jersey Avenue SE Washington DC 20590
_______________________________________________________________________
5 Conclusions
Run-off-road crashes account for a significant percentage (around 70) of all fatal single-vehicle crashes FARS data (1991 to 2007) that includes detailed information about ROR crashes provided sufficient statistical evidence to conclude that certain roadway- driver- environment- and vehicle-related factors closely associated with the occurrence of these crashes Appropriate crash countermeasures based on the identified factors can reduce the occurrence of single-vehicle ROR crashes and hence of the fatalities
Curved road segments rural roads high-speed-limit roadways and roadways with fewer lanes (divided or undivided) are found to be more likely to be the scene of fatal single-vehicle ROR crashes as compared to the fatal single-vehicle OR crashes Similarly among environmental factors adverse weather and night time periods are the factors associated with high risk of fatal single-vehicle ROR crashes
Vehicles with high occupancy (two and more occupants) male driver younger driver and alcohol used by driver are more likely to be involved in fatal single-vehicle ROR crashes as compared to the fatal single-vehicle OR crashes Drivers with performance-related factors (sleepy inattentive over-correction avoiding etc) are more likely to be involved in the fatal single-vehicle ROR crashes Speeding vehicles and passenger cars are also associated with high risks of the fatal single-vehicle ROR crashes
In the adverse weather condition and for the younger drivers (15 to 24 and 25 to 44) the speeding vehicle would increase the risk of fatal single-vehicle ROR crashes by an additional factor
The above facts based on statistical evidence suggest several crash countermeasures For example improving roadway design such as flattening curves and installing shoulder rumble strips or rehabilitation strategies such as building wide lanes or adding additional unpaved shoulder width on entire system providing skid-resistant pavement surfaces could reduce the likelihood of ROR crashes
24
NHTSArsquos National Center for Statistics and Analysis 1200 New Jersey Avenue SE Washington DC 20590
_______________________________________________________________________
6 References
1 FHWA (Undated) Reducing Highway Fatalities Washington DC Federal Highway Administration httpsafetyfhwadotgovroadway5Fdept
2 Neuman T RPfefer R Slack K L Council F McGee H Prothe L amp Eccles K (1998) Guidance for Implementation of the AASHTO Strategic Highway Safety Plan Report 500 Volume 6 A Guide for Addressing Run-Off Road Collisions Washington DC Transportation Research Board Available at httponlinepubstrborgonlinepubsnchrpnchrp_rpt_500v6pdf
3 Spainhour L K amp Mishra A (2007) Analysis of Fatal Run-off-the-Road Crashes Involving Overcorrection TRB 87th Annual Meeting Paper No 08-0661 Washington DC Transportation Research Board
4 McGee H W amp Hanscom F R Low-Cost Treatments for Horizontal Curve Safety FHWA-SA-07-002 December 2006
5 Johnston I Corben B TriggsT Candappa N amp Lenneacute M Reducing Serious Injury and Death from Run-off-Road Crashes in Victoria ndash Turning Knowledge into Action (2006 June) RACV Research Report Victoria Australia Royal Automobile Club of Victoria Ltd
6 Dissanayake S (2003 August) Young Drivers and Run-Off-the-Road Crashes Proceedings of the 2003 Mid-Continent Transportation Research Symposium Ames Iowa
7 Knapp K K Giese K L amp Lee W (2003 August) Urban Four-Lane Undivided to Three-Lane Roadway Conversion Guidelines Proceedings of the 2003 Mid-Continent Transportation Research Symposium Ames Iowa
8 Őrnek E amp Drakopoulos A (2007 August) Analysis of Run-Off-Road Crashes in Relation to Roadway Features and Driver Behavior Proceedings of the 2007 Mid-Continent Transportation Research Symposium Ames Iowa
9 Ray M H amp McGinnis R G (1997) Guardrail and Median Barrier Crashworthiness A Synthesis of Highway Practice NCHRP Synthesis 244 Washington DC Transportation Research Board National Research Council
10 Roadside Design Guide (2006) 3rd Edition Washington DC American Association of State Highway and Transportation Officials
25
NHTSArsquos National Center for Statistics and Analysis 1200 New Jersey Avenue SE Washington DC 20590
_______________________________________________________________________
11 Elvik R (1995) The Safety Value of Guardrails and Crash Cushions A Meta-Analysis of Evidence from Evaluation Studies Accident Analysis and Prevention 27 (4)
12 Stutts J C Reinfurth D W Staplin L amp Rodgman EA (2001 May) The Role of Driver Distraction in Traffic Crashes Washington DC AAA Foundation for Traffic Safety
13 Liu C Chen C-L Subramanian R amp Utter D (2005 June) Analysis of Speeding-Related Fatal Motor Vehicle Traffic Crashes NHTSA Technical Report DOT HS 809 839 Washington DC National Highway Traffic Safety Administration
14 Hosmer Jr D W and Lemeshow S (1989) Applied Logistic Regression New York John Wiley amp Sons Inc
15 SAS Institute Inc (1995) Logistic Regression Examples using SAS system Cary NC SAS Institute Inc
16 Rubin D B Schafer J L amp Subramanian R (1998 October) Multiple Imputation of Missing Blood Alcohol Concentration (BAC) Values in FARS NHTSA Technical Report DOT HS 808 816 Washington DC National Highway Traffic Safety Administration
17 Subramanian R (2005 March) Alcohol Involvement in Fatal Motor Vehicle Traffic Crashes NHTSA Technical Report DOT HS 809 822 Washington DC National Highway Traffic Safety Administration
18 SASSTAT Userrsquos Guide Version 8 1999 Cary NC SAS Institute Inc
26
NHTSArsquos National Center for Statistics and Analysis 1200 New Jersey Avenue SE Washington DC 20590
DOT HS 811 232November 2009
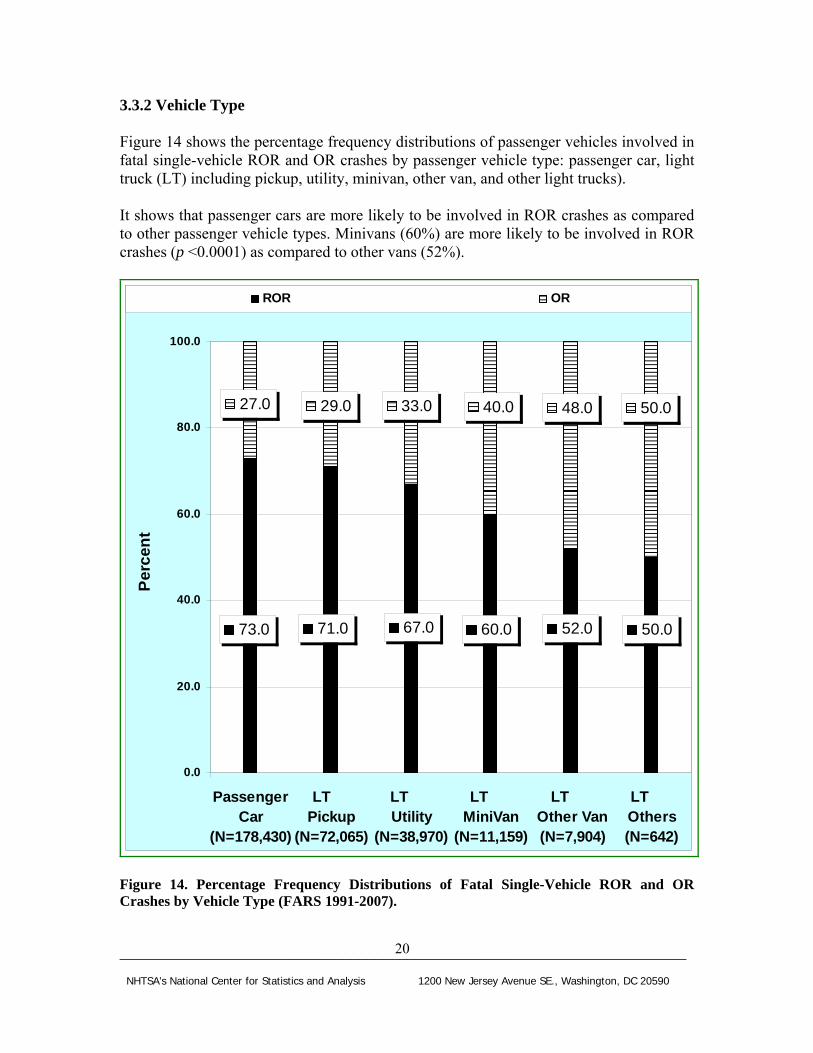
_______________________________________________________________________
500 520 600 670 730 710
500 480 400 330 270 290
00
200
400
600
800
1000
Passenger Car
(N=178430)
LT Pickup
(N=72065)
LT Utility
(N=38970)
LT MiniVan
(N=11159)
LT Other Van (N=7904)
LT Others (N=642)
Pe
rce
nt
ROR OR
Figure 14 shows the percentage frequency distributions of passenger vehicles involved in fatal single-vehicle ROR and OR crashes by passenger vehicle type passenger car light truck (LT) including pickup utility minivan other van and other light trucks) It shows that passenger cars are more likely to be involved in ROR crashes as compared to other passenger vehicle types Minivans (60) are more likely to be involved in ROR crashes (p lt00001) as compared to other vans (52)
332 Vehicle Type
Figure 14 Percentage Frequency Distributions of Fatal Single-Vehicle ROR and OR Crashes by Vehicle Type (FARS 1991-2007)
20
NHTSArsquos National Center for Statistics and Analysis 1200 New Jersey Avenue SE Washington DC 20590
_______________________________________________________________________
4 Logistic Regression
The analysis in the previous sections shows that factors such as driver sleepiness alcohol use vehicle speeding curved roadway rural roads etc are significant contributors to the occurrence of fatal single-vehicle ROR crashes It remains to assess their relative influence as well as estimate the amount of risk each carries in the occurrence of such crashes Logistic regression was used for this purpose This is a modeling procedure that predicts the probability (p) of occurrence of an event (fatal single-vehicle ROR crash in the present case) as a consequence of certain roadway- driver- environment- and vehicle-related factors such as sleepy alcohol use weather condition lighting condition speeding status road function etc Generally the logistic regression model provides log of odds as a function of the predictors
Log (odds) = a0 + a1timesdriver performance-related factor + a2timesalcohol use + a3timesspeeding status + a4timesweather condition + a5timeslighting conditionhellip + aktimesspeeding statustimesweather condition + ak+1timesspeeding statustimesdriverrsquos age +helliphellip
where a0 is the intercept and a1 a2 a3 helliphellip ak ak+1 helliphellip are the regression coefficients
As in the previous analysis FARS data was used in the modeling procedure Since in FARS driverrsquos alcohol involvement is estimated by Multiple Imputation (MI) 16 17
procedure the SAS MIANALYZE procedure was used in this study to perform the analysis of the MI data generated from the logistic regression18
21
NHTSArsquos National Center for Statistics and Analysis 1200 New Jersey Avenue SE Washington DC 20590
_______________________________________________________________________
41 Logistic Regression Results and Interpretation
Of all the variables considered in the logistic regression only 10 showed up as significant predictors (95 confidence level) As regards the interaction effect of these factors only the interaction of speeding with other variables was considered However only three of these interactions emerged as significant (95 confidence level) The results in Table 1 present estimates of regression coefficients and the corresponding odds ratio only for significant main effects and interactions Since the independent variables (predictors) are dichotomous the influence of the corresponding factors can be compared simply by comparing their regression coefficients
The ordered (decreasing) estimates of regression coefficients in Table 1 show that the most influential factor in the occurrence of fatal single-vehicle ROR crashes is the driver performance-related factor sleepy followed by alcohol use roadway alignment with curve speeding passenger car rural roadway number of lanes high-speed-limit road adverse weather and avoiding With regard to the interaction effect of speeding with other factors speeding with drivers of age groups 15 to 24 and 25 to 44 as well as speeding under adverse weather are significant contributors to the likelihood of ROR crashes
Table 1 Multiple Imputation Parameter Estimates Dagger
Variables Estimate Odds Ratio Driver performance-related factor sleepy vs others 11675 Dagger 321 Driver with alcohol BAC=01+ gdL vs BAC=0 06605 Dagger 194 Road alignment curve vs straight 05535 Dagger 174 Vehicle speeding status speeding vs non-speeding 04966 Dagger 164 Vehicle type passenger car vs other LTs 04780 Dagger 161 Road function rural vs urban 03637 Dagger 144 Roadway of lanes one or two (undivided) vs three amp more (undivided) 03346 Dagger 141 Road speed limit ge 60 mph vs lt60 mph 02659 Dagger 130 Weather adverse vs good 02130 Dagger 124 Driver performance-related factor avoiding vs others 02007 Dagger 122 Weather timesSpeeding status adverse amp speeding vs good amp non-speeding 01056 Dagger 111 Driver Age times Speeding status 25-44 amp speeding vs 65+ amp non-speeding 01003 Dagger 111 Driver Age times Speeding status 15-24 amp speeding vs 65+ amp non-speeding 00578 Dagger 106
Statistically significant variables (α = 005) associated with the high risk (odds ratio gt100) Other variables with low risk (odds ratio lt100) or insignificance (pgt005) after jointly estimating the effect are not shown here Dagger p-value lt00001
One of the most important by-product of logistic regression is the estimate of odds ratio that tells a great deal about the risk a certain factor carries in contributing to the occurrence of ROR crashes Specifically odds ratio measures the magnitude of increase in odds of happening of an event as a result of a unit increase in a predictor (eg sober and alcohol-used driver) An odds ratio value of 1 is indicative of no influence Table 1 also shows odds ratio estimates of significant factors and interactions
22
NHTSArsquos National Center for Statistics and Analysis 1200 New Jersey Avenue SE Washington DC 20590
_______________________________________________________________________
1
250 226
o 200
ita 164
Rd
s 150
d 124
O 100 100
050
Non-Speeding+Good Weather Non-Speeding+Adverse Weather
Speeding+Good Weather Speeding+Adverse Weather
Figure 15 Odds Ratio by Speeding Status and Weather Conditions
The odds ratio 321 for the factor ldquodriver performance-related factorrdquo shows that the odds of being involved in an ROR crash for a sleepy driver are three times as large as that for the driver who is not sleepy
The odds ratio 194 for the factor ldquodriver with alcoholrdquo shows that the odds of being involved in an ROR crash for an alcohol used driver (BAC=01+ gdL) are almost two times as large as that for a sober driver (BAC=0)
The odds ratio 174 for the factor ldquoroad alignmentrdquo shows that the odds of being involved in an ROR crash on curved roadways are 174 times as large as that on straight roadways in fatal single-vehicle crashes
The odds ratio 164 for the factor ldquovehicle speeding statusrdquo shows that the odds of being involved in an ROR crash for speeding vehicles are 164 times as large as that for non-speeding vehicles
The odds ratio 161 for the factor ldquovehicle typerdquo shows that the odds of being involved in an ROR crash for passenger cars are 161 times as large as that for other LTs
The odds ratio 144 for the factor ldquoroad functionrdquo shows that the odds of being involved in an ROR crash on rural roadways are 144 times as large as that on urban roadways
The odds ratio 266 for the factor ldquoweather amp speeding statusrdquo shows that the odds of being involved in an ROR crash under the adverse weather and in speeding vehicle are 266 (=164times124times111) times as large as that under the good weather and in non-speeding vehicle (Figure 15)
23
NHTSArsquos National Center for Statistics and Analysis 1200 New Jersey Avenue SE Washington DC 20590
_______________________________________________________________________
5 Conclusions
Run-off-road crashes account for a significant percentage (around 70) of all fatal single-vehicle crashes FARS data (1991 to 2007) that includes detailed information about ROR crashes provided sufficient statistical evidence to conclude that certain roadway- driver- environment- and vehicle-related factors closely associated with the occurrence of these crashes Appropriate crash countermeasures based on the identified factors can reduce the occurrence of single-vehicle ROR crashes and hence of the fatalities
Curved road segments rural roads high-speed-limit roadways and roadways with fewer lanes (divided or undivided) are found to be more likely to be the scene of fatal single-vehicle ROR crashes as compared to the fatal single-vehicle OR crashes Similarly among environmental factors adverse weather and night time periods are the factors associated with high risk of fatal single-vehicle ROR crashes
Vehicles with high occupancy (two and more occupants) male driver younger driver and alcohol used by driver are more likely to be involved in fatal single-vehicle ROR crashes as compared to the fatal single-vehicle OR crashes Drivers with performance-related factors (sleepy inattentive over-correction avoiding etc) are more likely to be involved in the fatal single-vehicle ROR crashes Speeding vehicles and passenger cars are also associated with high risks of the fatal single-vehicle ROR crashes
In the adverse weather condition and for the younger drivers (15 to 24 and 25 to 44) the speeding vehicle would increase the risk of fatal single-vehicle ROR crashes by an additional factor
The above facts based on statistical evidence suggest several crash countermeasures For example improving roadway design such as flattening curves and installing shoulder rumble strips or rehabilitation strategies such as building wide lanes or adding additional unpaved shoulder width on entire system providing skid-resistant pavement surfaces could reduce the likelihood of ROR crashes
24
NHTSArsquos National Center for Statistics and Analysis 1200 New Jersey Avenue SE Washington DC 20590
_______________________________________________________________________
6 References
1 FHWA (Undated) Reducing Highway Fatalities Washington DC Federal Highway Administration httpsafetyfhwadotgovroadway5Fdept
2 Neuman T RPfefer R Slack K L Council F McGee H Prothe L amp Eccles K (1998) Guidance for Implementation of the AASHTO Strategic Highway Safety Plan Report 500 Volume 6 A Guide for Addressing Run-Off Road Collisions Washington DC Transportation Research Board Available at httponlinepubstrborgonlinepubsnchrpnchrp_rpt_500v6pdf
3 Spainhour L K amp Mishra A (2007) Analysis of Fatal Run-off-the-Road Crashes Involving Overcorrection TRB 87th Annual Meeting Paper No 08-0661 Washington DC Transportation Research Board
4 McGee H W amp Hanscom F R Low-Cost Treatments for Horizontal Curve Safety FHWA-SA-07-002 December 2006
5 Johnston I Corben B TriggsT Candappa N amp Lenneacute M Reducing Serious Injury and Death from Run-off-Road Crashes in Victoria ndash Turning Knowledge into Action (2006 June) RACV Research Report Victoria Australia Royal Automobile Club of Victoria Ltd
6 Dissanayake S (2003 August) Young Drivers and Run-Off-the-Road Crashes Proceedings of the 2003 Mid-Continent Transportation Research Symposium Ames Iowa
7 Knapp K K Giese K L amp Lee W (2003 August) Urban Four-Lane Undivided to Three-Lane Roadway Conversion Guidelines Proceedings of the 2003 Mid-Continent Transportation Research Symposium Ames Iowa
8 Őrnek E amp Drakopoulos A (2007 August) Analysis of Run-Off-Road Crashes in Relation to Roadway Features and Driver Behavior Proceedings of the 2007 Mid-Continent Transportation Research Symposium Ames Iowa
9 Ray M H amp McGinnis R G (1997) Guardrail and Median Barrier Crashworthiness A Synthesis of Highway Practice NCHRP Synthesis 244 Washington DC Transportation Research Board National Research Council
10 Roadside Design Guide (2006) 3rd Edition Washington DC American Association of State Highway and Transportation Officials
25
NHTSArsquos National Center for Statistics and Analysis 1200 New Jersey Avenue SE Washington DC 20590
_______________________________________________________________________
11 Elvik R (1995) The Safety Value of Guardrails and Crash Cushions A Meta-Analysis of Evidence from Evaluation Studies Accident Analysis and Prevention 27 (4)
12 Stutts J C Reinfurth D W Staplin L amp Rodgman EA (2001 May) The Role of Driver Distraction in Traffic Crashes Washington DC AAA Foundation for Traffic Safety
13 Liu C Chen C-L Subramanian R amp Utter D (2005 June) Analysis of Speeding-Related Fatal Motor Vehicle Traffic Crashes NHTSA Technical Report DOT HS 809 839 Washington DC National Highway Traffic Safety Administration
14 Hosmer Jr D W and Lemeshow S (1989) Applied Logistic Regression New York John Wiley amp Sons Inc
15 SAS Institute Inc (1995) Logistic Regression Examples using SAS system Cary NC SAS Institute Inc
16 Rubin D B Schafer J L amp Subramanian R (1998 October) Multiple Imputation of Missing Blood Alcohol Concentration (BAC) Values in FARS NHTSA Technical Report DOT HS 808 816 Washington DC National Highway Traffic Safety Administration
17 Subramanian R (2005 March) Alcohol Involvement in Fatal Motor Vehicle Traffic Crashes NHTSA Technical Report DOT HS 809 822 Washington DC National Highway Traffic Safety Administration
18 SASSTAT Userrsquos Guide Version 8 1999 Cary NC SAS Institute Inc
26
NHTSArsquos National Center for Statistics and Analysis 1200 New Jersey Avenue SE Washington DC 20590
DOT HS 811 232November 2009
_______________________________________________________________________
4 Logistic Regression
The analysis in the previous sections shows that factors such as driver sleepiness alcohol use vehicle speeding curved roadway rural roads etc are significant contributors to the occurrence of fatal single-vehicle ROR crashes It remains to assess their relative influence as well as estimate the amount of risk each carries in the occurrence of such crashes Logistic regression was used for this purpose This is a modeling procedure that predicts the probability (p) of occurrence of an event (fatal single-vehicle ROR crash in the present case) as a consequence of certain roadway- driver- environment- and vehicle-related factors such as sleepy alcohol use weather condition lighting condition speeding status road function etc Generally the logistic regression model provides log of odds as a function of the predictors
Log (odds) = a0 + a1timesdriver performance-related factor + a2timesalcohol use + a3timesspeeding status + a4timesweather condition + a5timeslighting conditionhellip + aktimesspeeding statustimesweather condition + ak+1timesspeeding statustimesdriverrsquos age +helliphellip
where a0 is the intercept and a1 a2 a3 helliphellip ak ak+1 helliphellip are the regression coefficients
As in the previous analysis FARS data was used in the modeling procedure Since in FARS driverrsquos alcohol involvement is estimated by Multiple Imputation (MI) 16 17
procedure the SAS MIANALYZE procedure was used in this study to perform the analysis of the MI data generated from the logistic regression18
21
NHTSArsquos National Center for Statistics and Analysis 1200 New Jersey Avenue SE Washington DC 20590
_______________________________________________________________________
41 Logistic Regression Results and Interpretation
Of all the variables considered in the logistic regression only 10 showed up as significant predictors (95 confidence level) As regards the interaction effect of these factors only the interaction of speeding with other variables was considered However only three of these interactions emerged as significant (95 confidence level) The results in Table 1 present estimates of regression coefficients and the corresponding odds ratio only for significant main effects and interactions Since the independent variables (predictors) are dichotomous the influence of the corresponding factors can be compared simply by comparing their regression coefficients
The ordered (decreasing) estimates of regression coefficients in Table 1 show that the most influential factor in the occurrence of fatal single-vehicle ROR crashes is the driver performance-related factor sleepy followed by alcohol use roadway alignment with curve speeding passenger car rural roadway number of lanes high-speed-limit road adverse weather and avoiding With regard to the interaction effect of speeding with other factors speeding with drivers of age groups 15 to 24 and 25 to 44 as well as speeding under adverse weather are significant contributors to the likelihood of ROR crashes
Table 1 Multiple Imputation Parameter Estimates Dagger
Variables Estimate Odds Ratio Driver performance-related factor sleepy vs others 11675 Dagger 321 Driver with alcohol BAC=01+ gdL vs BAC=0 06605 Dagger 194 Road alignment curve vs straight 05535 Dagger 174 Vehicle speeding status speeding vs non-speeding 04966 Dagger 164 Vehicle type passenger car vs other LTs 04780 Dagger 161 Road function rural vs urban 03637 Dagger 144 Roadway of lanes one or two (undivided) vs three amp more (undivided) 03346 Dagger 141 Road speed limit ge 60 mph vs lt60 mph 02659 Dagger 130 Weather adverse vs good 02130 Dagger 124 Driver performance-related factor avoiding vs others 02007 Dagger 122 Weather timesSpeeding status adverse amp speeding vs good amp non-speeding 01056 Dagger 111 Driver Age times Speeding status 25-44 amp speeding vs 65+ amp non-speeding 01003 Dagger 111 Driver Age times Speeding status 15-24 amp speeding vs 65+ amp non-speeding 00578 Dagger 106
Statistically significant variables (α = 005) associated with the high risk (odds ratio gt100) Other variables with low risk (odds ratio lt100) or insignificance (pgt005) after jointly estimating the effect are not shown here Dagger p-value lt00001
One of the most important by-product of logistic regression is the estimate of odds ratio that tells a great deal about the risk a certain factor carries in contributing to the occurrence of ROR crashes Specifically odds ratio measures the magnitude of increase in odds of happening of an event as a result of a unit increase in a predictor (eg sober and alcohol-used driver) An odds ratio value of 1 is indicative of no influence Table 1 also shows odds ratio estimates of significant factors and interactions
22
NHTSArsquos National Center for Statistics and Analysis 1200 New Jersey Avenue SE Washington DC 20590
_______________________________________________________________________
1
250 226
o 200
ita 164
Rd
s 150
d 124
O 100 100
050
Non-Speeding+Good Weather Non-Speeding+Adverse Weather
Speeding+Good Weather Speeding+Adverse Weather
Figure 15 Odds Ratio by Speeding Status and Weather Conditions
The odds ratio 321 for the factor ldquodriver performance-related factorrdquo shows that the odds of being involved in an ROR crash for a sleepy driver are three times as large as that for the driver who is not sleepy
The odds ratio 194 for the factor ldquodriver with alcoholrdquo shows that the odds of being involved in an ROR crash for an alcohol used driver (BAC=01+ gdL) are almost two times as large as that for a sober driver (BAC=0)
The odds ratio 174 for the factor ldquoroad alignmentrdquo shows that the odds of being involved in an ROR crash on curved roadways are 174 times as large as that on straight roadways in fatal single-vehicle crashes
The odds ratio 164 for the factor ldquovehicle speeding statusrdquo shows that the odds of being involved in an ROR crash for speeding vehicles are 164 times as large as that for non-speeding vehicles
The odds ratio 161 for the factor ldquovehicle typerdquo shows that the odds of being involved in an ROR crash for passenger cars are 161 times as large as that for other LTs
The odds ratio 144 for the factor ldquoroad functionrdquo shows that the odds of being involved in an ROR crash on rural roadways are 144 times as large as that on urban roadways
The odds ratio 266 for the factor ldquoweather amp speeding statusrdquo shows that the odds of being involved in an ROR crash under the adverse weather and in speeding vehicle are 266 (=164times124times111) times as large as that under the good weather and in non-speeding vehicle (Figure 15)
23
NHTSArsquos National Center for Statistics and Analysis 1200 New Jersey Avenue SE Washington DC 20590
_______________________________________________________________________
5 Conclusions
Run-off-road crashes account for a significant percentage (around 70) of all fatal single-vehicle crashes FARS data (1991 to 2007) that includes detailed information about ROR crashes provided sufficient statistical evidence to conclude that certain roadway- driver- environment- and vehicle-related factors closely associated with the occurrence of these crashes Appropriate crash countermeasures based on the identified factors can reduce the occurrence of single-vehicle ROR crashes and hence of the fatalities
Curved road segments rural roads high-speed-limit roadways and roadways with fewer lanes (divided or undivided) are found to be more likely to be the scene of fatal single-vehicle ROR crashes as compared to the fatal single-vehicle OR crashes Similarly among environmental factors adverse weather and night time periods are the factors associated with high risk of fatal single-vehicle ROR crashes
Vehicles with high occupancy (two and more occupants) male driver younger driver and alcohol used by driver are more likely to be involved in fatal single-vehicle ROR crashes as compared to the fatal single-vehicle OR crashes Drivers with performance-related factors (sleepy inattentive over-correction avoiding etc) are more likely to be involved in the fatal single-vehicle ROR crashes Speeding vehicles and passenger cars are also associated with high risks of the fatal single-vehicle ROR crashes
In the adverse weather condition and for the younger drivers (15 to 24 and 25 to 44) the speeding vehicle would increase the risk of fatal single-vehicle ROR crashes by an additional factor
The above facts based on statistical evidence suggest several crash countermeasures For example improving roadway design such as flattening curves and installing shoulder rumble strips or rehabilitation strategies such as building wide lanes or adding additional unpaved shoulder width on entire system providing skid-resistant pavement surfaces could reduce the likelihood of ROR crashes
24
NHTSArsquos National Center for Statistics and Analysis 1200 New Jersey Avenue SE Washington DC 20590
_______________________________________________________________________
6 References
1 FHWA (Undated) Reducing Highway Fatalities Washington DC Federal Highway Administration httpsafetyfhwadotgovroadway5Fdept
2 Neuman T RPfefer R Slack K L Council F McGee H Prothe L amp Eccles K (1998) Guidance for Implementation of the AASHTO Strategic Highway Safety Plan Report 500 Volume 6 A Guide for Addressing Run-Off Road Collisions Washington DC Transportation Research Board Available at httponlinepubstrborgonlinepubsnchrpnchrp_rpt_500v6pdf
3 Spainhour L K amp Mishra A (2007) Analysis of Fatal Run-off-the-Road Crashes Involving Overcorrection TRB 87th Annual Meeting Paper No 08-0661 Washington DC Transportation Research Board
4 McGee H W amp Hanscom F R Low-Cost Treatments for Horizontal Curve Safety FHWA-SA-07-002 December 2006
5 Johnston I Corben B TriggsT Candappa N amp Lenneacute M Reducing Serious Injury and Death from Run-off-Road Crashes in Victoria ndash Turning Knowledge into Action (2006 June) RACV Research Report Victoria Australia Royal Automobile Club of Victoria Ltd
6 Dissanayake S (2003 August) Young Drivers and Run-Off-the-Road Crashes Proceedings of the 2003 Mid-Continent Transportation Research Symposium Ames Iowa
7 Knapp K K Giese K L amp Lee W (2003 August) Urban Four-Lane Undivided to Three-Lane Roadway Conversion Guidelines Proceedings of the 2003 Mid-Continent Transportation Research Symposium Ames Iowa
8 Őrnek E amp Drakopoulos A (2007 August) Analysis of Run-Off-Road Crashes in Relation to Roadway Features and Driver Behavior Proceedings of the 2007 Mid-Continent Transportation Research Symposium Ames Iowa
9 Ray M H amp McGinnis R G (1997) Guardrail and Median Barrier Crashworthiness A Synthesis of Highway Practice NCHRP Synthesis 244 Washington DC Transportation Research Board National Research Council
10 Roadside Design Guide (2006) 3rd Edition Washington DC American Association of State Highway and Transportation Officials
25
NHTSArsquos National Center for Statistics and Analysis 1200 New Jersey Avenue SE Washington DC 20590
_______________________________________________________________________
11 Elvik R (1995) The Safety Value of Guardrails and Crash Cushions A Meta-Analysis of Evidence from Evaluation Studies Accident Analysis and Prevention 27 (4)
12 Stutts J C Reinfurth D W Staplin L amp Rodgman EA (2001 May) The Role of Driver Distraction in Traffic Crashes Washington DC AAA Foundation for Traffic Safety
13 Liu C Chen C-L Subramanian R amp Utter D (2005 June) Analysis of Speeding-Related Fatal Motor Vehicle Traffic Crashes NHTSA Technical Report DOT HS 809 839 Washington DC National Highway Traffic Safety Administration
14 Hosmer Jr D W and Lemeshow S (1989) Applied Logistic Regression New York John Wiley amp Sons Inc
15 SAS Institute Inc (1995) Logistic Regression Examples using SAS system Cary NC SAS Institute Inc
16 Rubin D B Schafer J L amp Subramanian R (1998 October) Multiple Imputation of Missing Blood Alcohol Concentration (BAC) Values in FARS NHTSA Technical Report DOT HS 808 816 Washington DC National Highway Traffic Safety Administration
17 Subramanian R (2005 March) Alcohol Involvement in Fatal Motor Vehicle Traffic Crashes NHTSA Technical Report DOT HS 809 822 Washington DC National Highway Traffic Safety Administration
18 SASSTAT Userrsquos Guide Version 8 1999 Cary NC SAS Institute Inc
26
NHTSArsquos National Center for Statistics and Analysis 1200 New Jersey Avenue SE Washington DC 20590
DOT HS 811 232November 2009

_______________________________________________________________________
41 Logistic Regression Results and Interpretation
Of all the variables considered in the logistic regression only 10 showed up as significant predictors (95 confidence level) As regards the interaction effect of these factors only the interaction of speeding with other variables was considered However only three of these interactions emerged as significant (95 confidence level) The results in Table 1 present estimates of regression coefficients and the corresponding odds ratio only for significant main effects and interactions Since the independent variables (predictors) are dichotomous the influence of the corresponding factors can be compared simply by comparing their regression coefficients
The ordered (decreasing) estimates of regression coefficients in Table 1 show that the most influential factor in the occurrence of fatal single-vehicle ROR crashes is the driver performance-related factor sleepy followed by alcohol use roadway alignment with curve speeding passenger car rural roadway number of lanes high-speed-limit road adverse weather and avoiding With regard to the interaction effect of speeding with other factors speeding with drivers of age groups 15 to 24 and 25 to 44 as well as speeding under adverse weather are significant contributors to the likelihood of ROR crashes
Table 1 Multiple Imputation Parameter Estimates Dagger
Variables Estimate Odds Ratio Driver performance-related factor sleepy vs others 11675 Dagger 321 Driver with alcohol BAC=01+ gdL vs BAC=0 06605 Dagger 194 Road alignment curve vs straight 05535 Dagger 174 Vehicle speeding status speeding vs non-speeding 04966 Dagger 164 Vehicle type passenger car vs other LTs 04780 Dagger 161 Road function rural vs urban 03637 Dagger 144 Roadway of lanes one or two (undivided) vs three amp more (undivided) 03346 Dagger 141 Road speed limit ge 60 mph vs lt60 mph 02659 Dagger 130 Weather adverse vs good 02130 Dagger 124 Driver performance-related factor avoiding vs others 02007 Dagger 122 Weather timesSpeeding status adverse amp speeding vs good amp non-speeding 01056 Dagger 111 Driver Age times Speeding status 25-44 amp speeding vs 65+ amp non-speeding 01003 Dagger 111 Driver Age times Speeding status 15-24 amp speeding vs 65+ amp non-speeding 00578 Dagger 106
Statistically significant variables (α = 005) associated with the high risk (odds ratio gt100) Other variables with low risk (odds ratio lt100) or insignificance (pgt005) after jointly estimating the effect are not shown here Dagger p-value lt00001
One of the most important by-product of logistic regression is the estimate of odds ratio that tells a great deal about the risk a certain factor carries in contributing to the occurrence of ROR crashes Specifically odds ratio measures the magnitude of increase in odds of happening of an event as a result of a unit increase in a predictor (eg sober and alcohol-used driver) An odds ratio value of 1 is indicative of no influence Table 1 also shows odds ratio estimates of significant factors and interactions
22
NHTSArsquos National Center for Statistics and Analysis 1200 New Jersey Avenue SE Washington DC 20590
_______________________________________________________________________
1
250 226
o 200
ita 164
Rd
s 150
d 124
O 100 100
050
Non-Speeding+Good Weather Non-Speeding+Adverse Weather
Speeding+Good Weather Speeding+Adverse Weather
Figure 15 Odds Ratio by Speeding Status and Weather Conditions
The odds ratio 321 for the factor ldquodriver performance-related factorrdquo shows that the odds of being involved in an ROR crash for a sleepy driver are three times as large as that for the driver who is not sleepy
The odds ratio 194 for the factor ldquodriver with alcoholrdquo shows that the odds of being involved in an ROR crash for an alcohol used driver (BAC=01+ gdL) are almost two times as large as that for a sober driver (BAC=0)
The odds ratio 174 for the factor ldquoroad alignmentrdquo shows that the odds of being involved in an ROR crash on curved roadways are 174 times as large as that on straight roadways in fatal single-vehicle crashes
The odds ratio 164 for the factor ldquovehicle speeding statusrdquo shows that the odds of being involved in an ROR crash for speeding vehicles are 164 times as large as that for non-speeding vehicles
The odds ratio 161 for the factor ldquovehicle typerdquo shows that the odds of being involved in an ROR crash for passenger cars are 161 times as large as that for other LTs
The odds ratio 144 for the factor ldquoroad functionrdquo shows that the odds of being involved in an ROR crash on rural roadways are 144 times as large as that on urban roadways
The odds ratio 266 for the factor ldquoweather amp speeding statusrdquo shows that the odds of being involved in an ROR crash under the adverse weather and in speeding vehicle are 266 (=164times124times111) times as large as that under the good weather and in non-speeding vehicle (Figure 15)
23
NHTSArsquos National Center for Statistics and Analysis 1200 New Jersey Avenue SE Washington DC 20590
_______________________________________________________________________
5 Conclusions
Run-off-road crashes account for a significant percentage (around 70) of all fatal single-vehicle crashes FARS data (1991 to 2007) that includes detailed information about ROR crashes provided sufficient statistical evidence to conclude that certain roadway- driver- environment- and vehicle-related factors closely associated with the occurrence of these crashes Appropriate crash countermeasures based on the identified factors can reduce the occurrence of single-vehicle ROR crashes and hence of the fatalities
Curved road segments rural roads high-speed-limit roadways and roadways with fewer lanes (divided or undivided) are found to be more likely to be the scene of fatal single-vehicle ROR crashes as compared to the fatal single-vehicle OR crashes Similarly among environmental factors adverse weather and night time periods are the factors associated with high risk of fatal single-vehicle ROR crashes
Vehicles with high occupancy (two and more occupants) male driver younger driver and alcohol used by driver are more likely to be involved in fatal single-vehicle ROR crashes as compared to the fatal single-vehicle OR crashes Drivers with performance-related factors (sleepy inattentive over-correction avoiding etc) are more likely to be involved in the fatal single-vehicle ROR crashes Speeding vehicles and passenger cars are also associated with high risks of the fatal single-vehicle ROR crashes
In the adverse weather condition and for the younger drivers (15 to 24 and 25 to 44) the speeding vehicle would increase the risk of fatal single-vehicle ROR crashes by an additional factor
The above facts based on statistical evidence suggest several crash countermeasures For example improving roadway design such as flattening curves and installing shoulder rumble strips or rehabilitation strategies such as building wide lanes or adding additional unpaved shoulder width on entire system providing skid-resistant pavement surfaces could reduce the likelihood of ROR crashes
24
NHTSArsquos National Center for Statistics and Analysis 1200 New Jersey Avenue SE Washington DC 20590
_______________________________________________________________________
6 References
1 FHWA (Undated) Reducing Highway Fatalities Washington DC Federal Highway Administration httpsafetyfhwadotgovroadway5Fdept
2 Neuman T RPfefer R Slack K L Council F McGee H Prothe L amp Eccles K (1998) Guidance for Implementation of the AASHTO Strategic Highway Safety Plan Report 500 Volume 6 A Guide for Addressing Run-Off Road Collisions Washington DC Transportation Research Board Available at httponlinepubstrborgonlinepubsnchrpnchrp_rpt_500v6pdf
3 Spainhour L K amp Mishra A (2007) Analysis of Fatal Run-off-the-Road Crashes Involving Overcorrection TRB 87th Annual Meeting Paper No 08-0661 Washington DC Transportation Research Board
4 McGee H W amp Hanscom F R Low-Cost Treatments for Horizontal Curve Safety FHWA-SA-07-002 December 2006
5 Johnston I Corben B TriggsT Candappa N amp Lenneacute M Reducing Serious Injury and Death from Run-off-Road Crashes in Victoria ndash Turning Knowledge into Action (2006 June) RACV Research Report Victoria Australia Royal Automobile Club of Victoria Ltd
6 Dissanayake S (2003 August) Young Drivers and Run-Off-the-Road Crashes Proceedings of the 2003 Mid-Continent Transportation Research Symposium Ames Iowa
7 Knapp K K Giese K L amp Lee W (2003 August) Urban Four-Lane Undivided to Three-Lane Roadway Conversion Guidelines Proceedings of the 2003 Mid-Continent Transportation Research Symposium Ames Iowa
8 Őrnek E amp Drakopoulos A (2007 August) Analysis of Run-Off-Road Crashes in Relation to Roadway Features and Driver Behavior Proceedings of the 2007 Mid-Continent Transportation Research Symposium Ames Iowa
9 Ray M H amp McGinnis R G (1997) Guardrail and Median Barrier Crashworthiness A Synthesis of Highway Practice NCHRP Synthesis 244 Washington DC Transportation Research Board National Research Council
10 Roadside Design Guide (2006) 3rd Edition Washington DC American Association of State Highway and Transportation Officials
25
NHTSArsquos National Center for Statistics and Analysis 1200 New Jersey Avenue SE Washington DC 20590
_______________________________________________________________________
11 Elvik R (1995) The Safety Value of Guardrails and Crash Cushions A Meta-Analysis of Evidence from Evaluation Studies Accident Analysis and Prevention 27 (4)
12 Stutts J C Reinfurth D W Staplin L amp Rodgman EA (2001 May) The Role of Driver Distraction in Traffic Crashes Washington DC AAA Foundation for Traffic Safety
13 Liu C Chen C-L Subramanian R amp Utter D (2005 June) Analysis of Speeding-Related Fatal Motor Vehicle Traffic Crashes NHTSA Technical Report DOT HS 809 839 Washington DC National Highway Traffic Safety Administration
14 Hosmer Jr D W and Lemeshow S (1989) Applied Logistic Regression New York John Wiley amp Sons Inc
15 SAS Institute Inc (1995) Logistic Regression Examples using SAS system Cary NC SAS Institute Inc
16 Rubin D B Schafer J L amp Subramanian R (1998 October) Multiple Imputation of Missing Blood Alcohol Concentration (BAC) Values in FARS NHTSA Technical Report DOT HS 808 816 Washington DC National Highway Traffic Safety Administration
17 Subramanian R (2005 March) Alcohol Involvement in Fatal Motor Vehicle Traffic Crashes NHTSA Technical Report DOT HS 809 822 Washington DC National Highway Traffic Safety Administration
18 SASSTAT Userrsquos Guide Version 8 1999 Cary NC SAS Institute Inc
26
NHTSArsquos National Center for Statistics and Analysis 1200 New Jersey Avenue SE Washington DC 20590
DOT HS 811 232November 2009
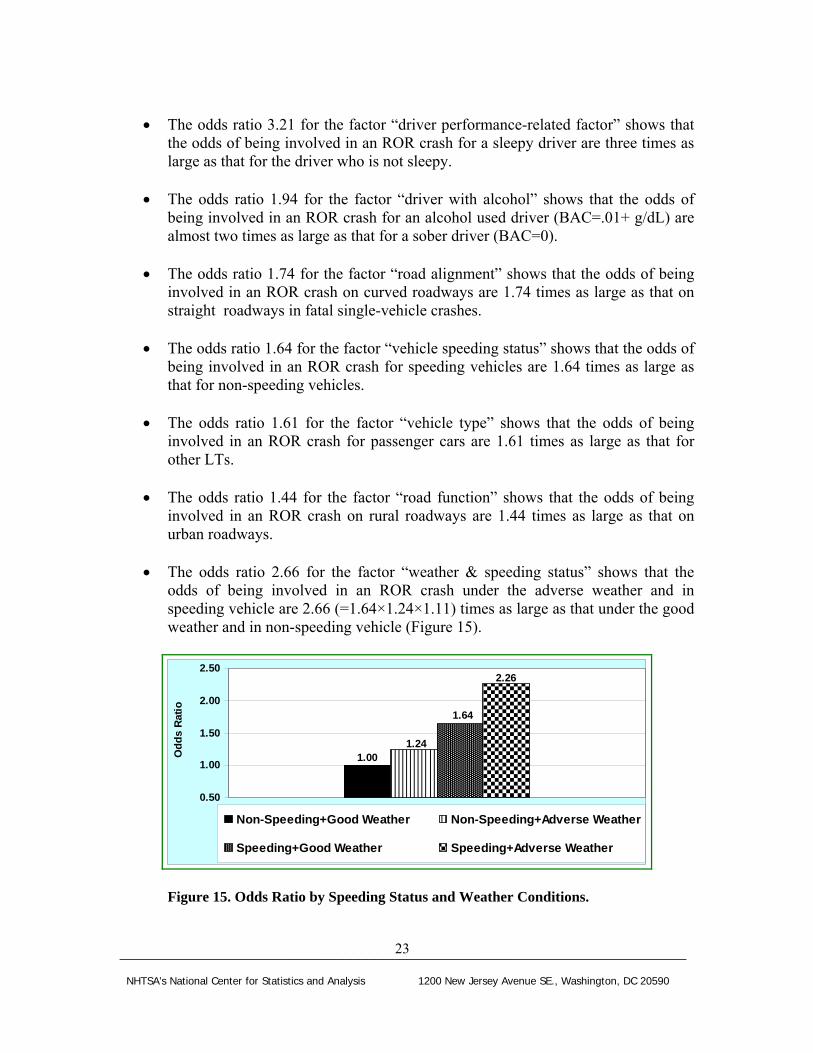
_______________________________________________________________________
1
250 226
o 200
ita 164
Rd
s 150
d 124
O 100 100
050
Non-Speeding+Good Weather Non-Speeding+Adverse Weather
Speeding+Good Weather Speeding+Adverse Weather
Figure 15 Odds Ratio by Speeding Status and Weather Conditions
The odds ratio 321 for the factor ldquodriver performance-related factorrdquo shows that the odds of being involved in an ROR crash for a sleepy driver are three times as large as that for the driver who is not sleepy
The odds ratio 194 for the factor ldquodriver with alcoholrdquo shows that the odds of being involved in an ROR crash for an alcohol used driver (BAC=01+ gdL) are almost two times as large as that for a sober driver (BAC=0)
The odds ratio 174 for the factor ldquoroad alignmentrdquo shows that the odds of being involved in an ROR crash on curved roadways are 174 times as large as that on straight roadways in fatal single-vehicle crashes
The odds ratio 164 for the factor ldquovehicle speeding statusrdquo shows that the odds of being involved in an ROR crash for speeding vehicles are 164 times as large as that for non-speeding vehicles
The odds ratio 161 for the factor ldquovehicle typerdquo shows that the odds of being involved in an ROR crash for passenger cars are 161 times as large as that for other LTs
The odds ratio 144 for the factor ldquoroad functionrdquo shows that the odds of being involved in an ROR crash on rural roadways are 144 times as large as that on urban roadways
The odds ratio 266 for the factor ldquoweather amp speeding statusrdquo shows that the odds of being involved in an ROR crash under the adverse weather and in speeding vehicle are 266 (=164times124times111) times as large as that under the good weather and in non-speeding vehicle (Figure 15)
23
NHTSArsquos National Center for Statistics and Analysis 1200 New Jersey Avenue SE Washington DC 20590
_______________________________________________________________________
5 Conclusions
Run-off-road crashes account for a significant percentage (around 70) of all fatal single-vehicle crashes FARS data (1991 to 2007) that includes detailed information about ROR crashes provided sufficient statistical evidence to conclude that certain roadway- driver- environment- and vehicle-related factors closely associated with the occurrence of these crashes Appropriate crash countermeasures based on the identified factors can reduce the occurrence of single-vehicle ROR crashes and hence of the fatalities
Curved road segments rural roads high-speed-limit roadways and roadways with fewer lanes (divided or undivided) are found to be more likely to be the scene of fatal single-vehicle ROR crashes as compared to the fatal single-vehicle OR crashes Similarly among environmental factors adverse weather and night time periods are the factors associated with high risk of fatal single-vehicle ROR crashes
Vehicles with high occupancy (two and more occupants) male driver younger driver and alcohol used by driver are more likely to be involved in fatal single-vehicle ROR crashes as compared to the fatal single-vehicle OR crashes Drivers with performance-related factors (sleepy inattentive over-correction avoiding etc) are more likely to be involved in the fatal single-vehicle ROR crashes Speeding vehicles and passenger cars are also associated with high risks of the fatal single-vehicle ROR crashes
In the adverse weather condition and for the younger drivers (15 to 24 and 25 to 44) the speeding vehicle would increase the risk of fatal single-vehicle ROR crashes by an additional factor
The above facts based on statistical evidence suggest several crash countermeasures For example improving roadway design such as flattening curves and installing shoulder rumble strips or rehabilitation strategies such as building wide lanes or adding additional unpaved shoulder width on entire system providing skid-resistant pavement surfaces could reduce the likelihood of ROR crashes
24
NHTSArsquos National Center for Statistics and Analysis 1200 New Jersey Avenue SE Washington DC 20590
_______________________________________________________________________
6 References
1 FHWA (Undated) Reducing Highway Fatalities Washington DC Federal Highway Administration httpsafetyfhwadotgovroadway5Fdept
2 Neuman T RPfefer R Slack K L Council F McGee H Prothe L amp Eccles K (1998) Guidance for Implementation of the AASHTO Strategic Highway Safety Plan Report 500 Volume 6 A Guide for Addressing Run-Off Road Collisions Washington DC Transportation Research Board Available at httponlinepubstrborgonlinepubsnchrpnchrp_rpt_500v6pdf
3 Spainhour L K amp Mishra A (2007) Analysis of Fatal Run-off-the-Road Crashes Involving Overcorrection TRB 87th Annual Meeting Paper No 08-0661 Washington DC Transportation Research Board
4 McGee H W amp Hanscom F R Low-Cost Treatments for Horizontal Curve Safety FHWA-SA-07-002 December 2006
5 Johnston I Corben B TriggsT Candappa N amp Lenneacute M Reducing Serious Injury and Death from Run-off-Road Crashes in Victoria ndash Turning Knowledge into Action (2006 June) RACV Research Report Victoria Australia Royal Automobile Club of Victoria Ltd
6 Dissanayake S (2003 August) Young Drivers and Run-Off-the-Road Crashes Proceedings of the 2003 Mid-Continent Transportation Research Symposium Ames Iowa
7 Knapp K K Giese K L amp Lee W (2003 August) Urban Four-Lane Undivided to Three-Lane Roadway Conversion Guidelines Proceedings of the 2003 Mid-Continent Transportation Research Symposium Ames Iowa
8 Őrnek E amp Drakopoulos A (2007 August) Analysis of Run-Off-Road Crashes in Relation to Roadway Features and Driver Behavior Proceedings of the 2007 Mid-Continent Transportation Research Symposium Ames Iowa
9 Ray M H amp McGinnis R G (1997) Guardrail and Median Barrier Crashworthiness A Synthesis of Highway Practice NCHRP Synthesis 244 Washington DC Transportation Research Board National Research Council
10 Roadside Design Guide (2006) 3rd Edition Washington DC American Association of State Highway and Transportation Officials
25
NHTSArsquos National Center for Statistics and Analysis 1200 New Jersey Avenue SE Washington DC 20590
_______________________________________________________________________
11 Elvik R (1995) The Safety Value of Guardrails and Crash Cushions A Meta-Analysis of Evidence from Evaluation Studies Accident Analysis and Prevention 27 (4)
12 Stutts J C Reinfurth D W Staplin L amp Rodgman EA (2001 May) The Role of Driver Distraction in Traffic Crashes Washington DC AAA Foundation for Traffic Safety
13 Liu C Chen C-L Subramanian R amp Utter D (2005 June) Analysis of Speeding-Related Fatal Motor Vehicle Traffic Crashes NHTSA Technical Report DOT HS 809 839 Washington DC National Highway Traffic Safety Administration
14 Hosmer Jr D W and Lemeshow S (1989) Applied Logistic Regression New York John Wiley amp Sons Inc
15 SAS Institute Inc (1995) Logistic Regression Examples using SAS system Cary NC SAS Institute Inc
16 Rubin D B Schafer J L amp Subramanian R (1998 October) Multiple Imputation of Missing Blood Alcohol Concentration (BAC) Values in FARS NHTSA Technical Report DOT HS 808 816 Washington DC National Highway Traffic Safety Administration
17 Subramanian R (2005 March) Alcohol Involvement in Fatal Motor Vehicle Traffic Crashes NHTSA Technical Report DOT HS 809 822 Washington DC National Highway Traffic Safety Administration
18 SASSTAT Userrsquos Guide Version 8 1999 Cary NC SAS Institute Inc
26
NHTSArsquos National Center for Statistics and Analysis 1200 New Jersey Avenue SE Washington DC 20590
DOT HS 811 232November 2009
_______________________________________________________________________
11 Elvik R (1995) The Safety Value of Guardrails and Crash Cushions A Meta-Analysis of Evidence from Evaluation Studies Accident Analysis and Prevention 27 (4)
12 Stutts J C Reinfurth D W Staplin L amp Rodgman EA (2001 May) The Role of Driver Distraction in Traffic Crashes Washington DC AAA Foundation for Traffic Safety
13 Liu C Chen C-L Subramanian R amp Utter D (2005 June) Analysis of Speeding-Related Fatal Motor Vehicle Traffic Crashes NHTSA Technical Report DOT HS 809 839 Washington DC National Highway Traffic Safety Administration
14 Hosmer Jr D W and Lemeshow S (1989) Applied Logistic Regression New York John Wiley amp Sons Inc
15 SAS Institute Inc (1995) Logistic Regression Examples using SAS system Cary NC SAS Institute Inc
16 Rubin D B Schafer J L amp Subramanian R (1998 October) Multiple Imputation of Missing Blood Alcohol Concentration (BAC) Values in FARS NHTSA Technical Report DOT HS 808 816 Washington DC National Highway Traffic Safety Administration
17 Subramanian R (2005 March) Alcohol Involvement in Fatal Motor Vehicle Traffic Crashes NHTSA Technical Report DOT HS 809 822 Washington DC National Highway Traffic Safety Administration
18 SASSTAT Userrsquos Guide Version 8 1999 Cary NC SAS Institute Inc
26
NHTSArsquos National Center for Statistics and Analysis 1200 New Jersey Avenue SE Washington DC 20590
DOT HS 811 232November 2009

DOT HS 811 232November 2009