avoidable burden of risk factors for serious road traffic crashes … · · 2017-02-06avoidable...
TRANSCRIPT

Avoidable burden of risk factors for serious road traffic crashes in Iran: a
modeling study
Fatemeh Khosravi Shadmani1, Kamyar Mansori
2,3, Manoochehr Karami
4, Farid Zayeri
5 , Reza
Khosravi Shadmani6 , Shiva Mansouri Hanis
7 ,Hamid Soori*
8
1. Modeling in Health Research Center, Institute for Futures Studies in Health, Kerman University of Medical
Sciences, Kerman, Iran
2. Social Development & Health Promotion Research Center, Gonabad University of Medical Sciences, Gonabad,
Iran
3. Department of Epidemiology, School of Public Health, Iran University of Medical Science, Tehran, Iran
4. Department of Epidemiology, School of Public Health, Hamadan University of Medical Sciences, Hamadan, Iran
5. Department of Biostatistics, Faculty of Paramedical, Shahid Beheshti University of Medical Sciences, Tehran,
Iran
6. Dezful University of Medical Sciences, Dezful, Iran
7. Social Determinants of Health Research Center, Kurdistan University of Medical Sciences, Sanandaj, Iran.
7. Department of Epidemiology, School of Public Health, Safety Promotion and Injury Prevention Research Center,
Shahid Beheshti University of Medical Sciences, Tehran, Iran
Corresponding Author: Hamid Soori, Email: [email protected]

Abstract:
Objectives: The aim of this study is modeling of avoidable burden of road traffic crashes risk
factors and prioritizing them in Iran.
Methods: The prevalence and effect size of risk factors were extracted from registered data by the traffic police of Iran in 2013. The effect size was achieved according to ordinal regression model. Potential impact fraction index was applied to calculate avoidable burden in order to prioritize the interventions. The Index was calculated in the theoretical, plausible and feasible minimum risk level scenarios. Then the joint effects of the risk factors were estimated in all scenarios.
Results: The highest avoidable burdens in theoretical, plausible and feasible minimum risk level scenarios for the lack of use of child restraint in urban roads were 52.25, 28.63 and 46.67 respectively. Whereas, this index for speeding indicated 76.24, 37, 62.23 respectively in rural roads.
Conclusion: Based on the different scenarios used in the research, it is suggested that focus on future interventions in decreasing the prevalence of speeding, the lack of use of child restraint, the use of cell phone while driving, helmet disuse and the laws related to these items should be consider intensely and seriously.
Key words: Potential impact fraction, avoidable burden, traffic crashes, prioritizing, Iran
Running title: Potential impact fraction index of the preventive interventions for road traffic
Introduction
The studies are shown that annual incidence rate of the traffic crashes is 34.1 per 100000 person in Iran whereas this figure 18 per 100000 globally[1]. Also the traffic crashes are known as the second cause of death and the first cause of years of life lost (YLL) in Iran [2]. Generally, years of life lost due to early death related to this phenomenon in Iran is higher than the Eastern Mediterranean and world[3].
The only serious and effective action for controlling traffic crashes is implementation of preventive interventions. But if they are not designed properly, it may be lead to wasting the available resources. Ordinarily for persuading the health system policy makers for justify implement an intervention; Population Attributable Fraction (PAF) be used. Calculated assumption for PAF is decrease the prevalence of exposure with a specific risk factor to zero [4]. But complete removal of exposure with the risk factor is impossible in the community level. Although this index is used for prioritizing but it is not suitable for planning goals. Therefore policymakers usually intend to know that what changes in the disease burden or morbidity rate will be avoidable with decreasing the prevalence of a risk factor to expected level [5]. So the Potential Impact Fraction (PIF) is calculated that it is defined as decrease in a fraction of the disease as a result change the present distribution of risk factors (avoidable burden) [6]. Determining this index is more important for the public health, the health system policy makers and these people providing finance for preventive intervention.
The world health organization (WHO) is recommended measures for the prevention of road traffic injuries about the number of risk factors, but so far no investigation has conducted about the suitability of these activities and their prioritizing in Iran , so the goal of present study is to prioritize the preventive interventions of traffic crashes and will give necessary awareness to the health system policymakers and decision- makers in order to design nationwide macro planning and this prioritizing is done on the basis of avoidable burden of risk factors.
Materials and Methods
In this research, the data registered by the National Register of accidents by police was used. All kinds of crashes occurred in Iran including death, injury or damage were examined in 2012. Injury, in this study, refers to any kind of physical or mental problem in the deriver or occupants as the result of an accident; while, according to the police department, non-injury crashes are those with damaged vehicle and no injury for the occupants.The risk factors investigated in this study were those ones which WHO has suggested main preventive strategies about them. For calculating PIF the Factual prevalence of exposure with the risk factor, the effect size of the risk factor and also counterfactual prevalence of exposure with the risk factor (The hypothetical prevalence) are required. The Factual prevalence of exposure with the risk factor and the effect size were extracted of registered data. The adjusted effect size was obtained by use of Ordinal Regression Model in the form of adjusted Odds Ratio (OR) for confounding factors. In this model dependent variable was severe traffic crashes (death and injured). The uninjured category was considered as the reference category. Since the data registered by the police

system did not contain the risk factors Cell phone use while driving and lack of use safety seats, their prevalence were extracted from other studies conducted in Iran[7, 8].The effect size of cell phone use while driving and lack of use safety seats achieved by use of other studies in the form of OR and Relative Risk (RR) ; respectively[9, 10]. Chi- square test showed no significant difference between different age groups in the prevalence of exposure with the risk factors. Therefore, the calculations of prevalence were not done according to age groups. They were done the basis of the gender and urban and rural roads separately. Counterfactual prevalence was determined in three levels of Theoretical minimum risk level, plausible minimum risk level and feasible minimum risk level.
Theoretical minimum risk level (Scenario 1): This level for all risk factors (Use of alcohol by driver, Drug abuse by driver, Driver fatigue and sleepy, No wearing the safety belt in driver, No motorcycle helmet, cell phone use while driving, lack of use safety seats, low light of road, Road defects and vehicle defects ) were considered zero.
Plausible minimum risk level (Scenario 2 ): The level of prevalence decrease which can be imagined for risk factors in Iranian society. This level was determined by experts and through Delphi Method. First of all some questions were posed by the researchers regarding the plausible minimum risk level, then the group of experts, consisting of a policy maker, an epidemiologist, a traffic crash specialist, and a physician working in the trauma section, were requested to state their comments and start discussing them. After reaching a conclusion, the plausible minimum risk level for each factor was determined. The mentioned experts included Policymakers, epidemiologists; traffic crashes specialists (NAJA Police), and physicians working in trauma section. Finally, the researchers determined the level of prevalence decrease for the risk factors after considering the views of the all experts.
Feasible minimum risk level (Scenario 3): The level of exposure decrease which other communities have experienced and for the communities have been achieved. For risk factors were identified by searching and comprehensive review of book[11] and the lowest level was chosen. This level was determined by the experts for some other risk factors which no related studies were found. Then the avoidable burden of traffic crashes when a preventive intervention provided, in any of the mentioned levels was calculated by use of formula 1.
Formula 1
RR in this formula represents a general word related to one of measurement indexes of
association (effect) such as Risk Ratio, Rate Ratio, Odds Ratio and Hazard Ratio. P, P and n represent the Factual prevalence of exposure with the risk factor, counterfactual prevalence (Hypothetical) and high level of exposure respectively.
n
i ii
n
i
n
i iiii
RRP
RRPRRPPIF
1
1 1

Joint effect of risk factors Formula 2 was used to estimate change process in avoidable burden as a result of simultaneous prevalence decrease of studied risk factors.
n
1i
iPIF11PIF Formula 2
Sensitivity Analysis: Given the uncertainty of prevalence and random errors and assurance of conducted estimates, in addition to calculating PIF for estimating the point prevalence, 95% confidence interval (CI) for PIF was also measured. For this purpose @Risk version 6 software was used on the basis of uniform distribution with 2000 replication and Monte Carlo simulation method. Then values between 2.5 to 97.5 % lies were reported as the estimation of %95 uncertainty.
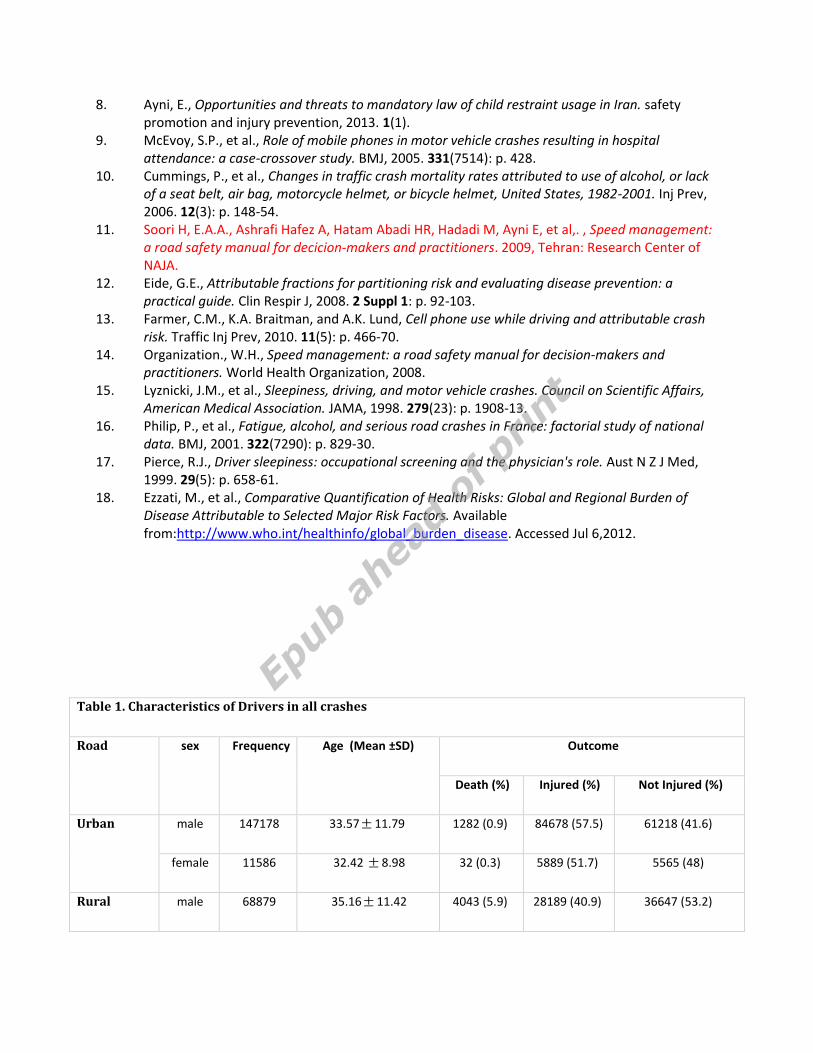
Results Table 1 shows characteristics of the drivers in all crashes. As you can be seen, in urban roads the mean of age males and females were 33.57 11.79 and 32.42 8.98; respectively and for rural roads were 35.16 11.42 and 32.06 8.23. The Table 2 shows the exposure prevalence with different risk factors (real and counterfactual) . The highest factual prevalence, in this table, were non-use of helmet in urban roads with 47.5 (46.96 – 48.05) percent and rural roads with 51.7 (51.14 – 52.25). Also, counterfactual prevalence for this risk factor had the highest prevalence in plausible minimum risk level. Also Table 3 indicates on the effect size and % 95 confidence interval according to urban and rural roads and gender. In this table, the highest measure of effect was related to the risk factor of speeding, with the amounts of 5.75 (4.34 – 7.61) and 5 (4.71-5.25) percent in females and males, respectively. These numbers for rural roads were 14.87(10.91- 18.54) and 12.8 (12.06- 13.59), respectively. The counterfactual prevalence in every scenario and calculated PIF according to urban and rural roads are shown in Table 4. The most amount of PIF for death and injury was attributed to lack of use the safety seats in rural roads which its PIF in theoretical, plausible and feasible levels was 52.25 (47.28 – 57.21), 28.63(89.25 – 107.69) and 46.67(43.14 – 52.20); respectively .The least amounts of PIF in theoretical, plausible and feasible minimum risk levels related to use of alcohol in the males with 0.28 (0.25 – 0.30), 0.14 (0.12 – 0.15) and 0.28 (0.25 - 0.30) ; respectively. These rates for the females were 0.25 (0.22 – 0.27), 0.13 (0.11 – 0.14) and 0.25 (0.22 – 0.27); respectively. The most amount of PIF in rural roads (Table 4) was related to unauthorized speed. If it diminishes to determined level which is noted in the Table, it will be possible to prevent the burden of traffic crashes more than before. The joint effect of exposure to the studied risk factors related to traffic crashes was shown in figure 1 according to gender groups. The joint effect of the risk factors among both sexes was higher in rural roads than it was in urban roads.
Discussion The most of rates PIF in urban areas were found in the following items respectively; lack of use safety seats, cell phone use while driving, unauthorized speed, No motorcycle helmet and No
wearing the safety belt in driver. The most of rates PIF in rural areas were seen respectively in unauthorized speed, lack of use safety seats, cell phone use while driving, No motorcycle helmet and No wearing the safety belt in driver. If it is possible to decrease the prevalence of lack of use safety seats down to zero level or determined levels, we will have the most avoidable burden in urban areas. Although safety seats had the odds ratio less in comparison to other factors, because of the higher prevalence it would be put in higher priority. Because of the prevalence of risk factor is mixed with effect size in calculating PIF. Its means that the removal or decrease of exposure with high severity and average increase of risk level has the same or less effect on nationwide rather than removal of a rare exposure which has highly increasing risk for disease[12].
It was estimated in a study concluded in the U.S, that 22 % of traffic crashes burden can be avoidable by preventing from cell phone use while driving[13]. While this rate was 7 % averagely in the mentioned study, it was estimated 30 % in Iran. The second priority in urban area is unauthorized speed. It is possible to lose control of the vehicle in high speed and diminish the reaction time. So, the chance of traffic sever crashes will be developed. It is shown that 5 % increase in average level of speed leads to 10 to 20 % of injuries and deaths respectively[14]. In rural areas the prevalence and OR of unauthorized speed is more than urban areas so that it has the first priority in rural areas. The second and third priorities in these areas are taken by lack of use safety seats and cell phone use while driving. In recent years, due to intense acts in the driver's safety belt use law and Police success, its prevalence has decreased, however it is one of priority yet. Although the motorcycle helmet use law is obligatory but it is not followed seriously and still its prevalence is high so that its priority is even higher than safety belt use.
The other studied risk factors consisted of use of alcohol and drug abuse. It is estimated 53 % of the death caused by traffic crashes are associated to with use of alcohol in U.S[15]. But this factor is less important with respect to the low prevalence in Iran. This may have two reasons: firstly alcohol test is not taken for all the derivers involving in the accidents, if the police is suspicious of any deriver, than the alcohol test is done. Secondly, the report of driver’s consumption of alcohol and their accidents to the police is really insufficient. However, the prevalence of the alcohol and drug abuse among Iranian drivers is low and doing measures for them is not put in top priorities. Although driver fatigue and sleepy factor while driving is not consider important in urban areas, it is rather important in rural areas. Different studied have found various rates of traffic crashes burden related to this factor. this rates have been reported 13%[15], 33%[16] and 10% [17] in the U.S, Australia and France respectively, that Its more part is associated with the prevalence difference in various countries. In general, the most avoidable burden is due to human factors. The low right of road was more important factor among environmental factors. Its importance can be due to driving at the night which is usually accompanied with fatigue and sleepy, that both together increase the possibility of accident. For some risk factors such a No motorcycle helmet, PIF in theoretical minimum risk level is equal to plausible minimum risk level. This indicates that achieving the prevalence decrease down to zero level is possible as some other communities could achieve it. It also shows that preventive measures have been effective. Therefore, the investigations on prevalence decrease
methods should be done according to the priorities. Moreover some present measures must be developed and followed seriously. The interpretation of prevalence decrease changes of a risk factor for death and injury rate is hard because they may be happen by the other factors which are not related to this kind of risk factor and or several risk factors get involved simultaneously. The joint effect of studied risk factors which is near 100%, showed that they are more important in rural areas. In other words, in the absence of risk factors examined in this study, the risk of crashes is very low. The joint effect risk factors are different from 100% in urban areas, this may be due to involve other risk factors in this areas. Theoretical minimum risk level is similar to PAF and can be as a guide for conducting researches and developing the resources to study the risk factors. The exposure distribution in theoretical minimum risk level may depend on sex and age variables but in general it is independent of the geographical area. Plausible and Feasible minimum risk levels are different in various populations according to present distribution of disease burden, accessible resources and facilities for exposure decrease (the group with the highest exposure led to the lowest exposure)[18]. One of the strengths of this study is the large volume of data and use of them at the national
level. In addition, the effects of studied risk factors were obtained from a nationwide source
which was adjusted for confounders. The prevalence of risk factors according to sex and urban
and rural areas was used on the basis of update data. However, this study faced some
limitations. The Iranian police department employs KAM114 form to register all crashes. They gather
information for all five fields. Some of the values are stated by the occupants and obviously they might
be the subject of under-estimation. The information regarding age, sex, education, occupation, and all
the factors known as confining factors in the five fields have been recorded in the KAM form by the the
police and there is no limitation in this regard. However, there had been some missing factors in the
variables which were estimated through Multiple Imputation. Registered deaths are those ones in
database which are happen in crash scene. They are not consisted of the deaths occurred in
hospitals and 30 day after the accidents. This is because others databases did not register any
data about risk factor and also there was no the possibility of linking. The data of risk factors
including cell phone use while driving and lack of use safety seats were not registered by the
police but the same effect size in calculating PIF&PAF is an assumption. The prevalence is the one that
matters. So, their prevalence and effect size extracted from other studies.
Determined priorities for implementing preventive strategies in urban areas respectively are:
1) Use of safety seats 2) Lack of use cell phone while driving 3) Speed management 4) Use motorcycle helmet 5) wearing the safety belt in driver
6) Lack of road defects 7) light of road
8) preventing of driver fatigue and sleepy 9) Not using drugs 10) Not using alcohol
And the identified priorities in rural areas respectively are: 1) Speed management 2) Use of safety seats 3) Lack of use cell phone while driving 4) Use motorcycle helmet 5) preventing of driver fatigue and sleepy 6) Light of road 7) Lack of road defects 8) Lack of Vehicle defects 9) Not using drugs 10) Not using alcohol
Acknowledgments:
We would like to thank Iran's Traffic Police to provide data and their sincere cooperation to conduct this study– it is much appreciated.
References:
1. WHO, Global status report on road safety: time for action, 2013, World Health Organization. Availablae from: www.who.int/violence_injury_prevention/road_safety_status, Accessed March 6, 2013.
2. Soori, H., et al., Pattern epidemiologic road traffic injuries Tehran-Abali road: a cohort study. Payesh, 2010. 3.
3. Khorasani-Zavareh, D., et al., The requirements and challenges in preventing of road traffic injury in Iran. A qualitative study. BMC Public Health, 2009. 9: p. 486.
4. Rockhill, B., B. Newman, and C. Weinberg, Use and misuse of population attributable fractions. Am J Public Health, 1998. 88(1): p. 15-9.
5. Karami, M., H. Soori, and A.B. Monfared, Estimating the contribution of selected risk factors in attributable burden to stroke in iran. Iran J Public Health, 2012. 41(5): p. 91-6.
6. Murray, C.J. and A.D. Lopez, On the comparable quantification of health risks: lessons from the Global Burden of Disease Study. Epidemiology, 1999. 10(5): p. 594-605.
7. Hajihosseinlo, M., M. Abolhasani, and A. Emadi, Effects of cell phone use during the driving and its role in the occurrence of Road Traffic Accidents, in Eighth Conference of Traffic and Transportation Engineering2008.
8. Ayni, E., Opportunities and threats to mandatory law of child restraint usage in Iran. safety promotion and injury prevention, 2013. 1(1).
9. McEvoy, S.P., et al., Role of mobile phones in motor vehicle crashes resulting in hospital attendance: a case-crossover study. BMJ, 2005. 331(7514): p. 428.
10. Cummings, P., et al., Changes in traffic crash mortality rates attributed to use of alcohol, or lack of a seat belt, air bag, motorcycle helmet, or bicycle helmet, United States, 1982-2001. Inj Prev, 2006. 12(3): p. 148-54.
11. Soori H, E.A.A., Ashrafi Hafez A, Hatam Abadi HR, Hadadi M, Ayni E, et al,. , Speed management: a road safety manual for decicion-makers and practitioners. 2009, Tehran: Research Center of NAJA.
12. Eide, G.E., Attributable fractions for partitioning risk and evaluating disease prevention: a practical guide. Clin Respir J, 2008. 2 Suppl 1: p. 92-103.
13. Farmer, C.M., K.A. Braitman, and A.K. Lund, Cell phone use while driving and attributable crash risk. Traffic Inj Prev, 2010. 11(5): p. 466-70.
14. Organization., W.H., Speed management: a road safety manual for decision-makers and practitioners. World Health Organization, 2008.
15. Lyznicki, J.M., et al., Sleepiness, driving, and motor vehicle crashes. Council on Scientific Affairs, American Medical Association. JAMA, 1998. 279(23): p. 1908-13.
16. Philip, P., et al., Fatigue, alcohol, and serious road crashes in France: factorial study of national data. BMJ, 2001. 322(7290): p. 829-30.
17. Pierce, R.J., Driver sleepiness: occupational screening and the physician's role. Aust N Z J Med, 1999. 29(5): p. 658-61.
18. Ezzati, M., et al., Comparative Quantification of Health Risks: Global and Regional Burden of Disease Attributable to Selected Major Risk Factors. Available from:http://www.who.int/healthinfo/global_burden_disease. Accessed Jul 6,2012.
Table 1. Characteristics of Drivers in all crashes
Road sex
Frequency Age (Mean ±SD)
Outcome
Death (%) Injured (%) Not Injured (%)
Urban male 147178 33.57 11.79 1282 (0.9) 84678 (57.5) 61218 (41.6)
female 11586 32.42 8.98 32 (0.3) 5889 (51.7) 5565 (48)
Rural male 68879 35.16 11.42 4043 (5.9) 28189 (40.9) 36647 (53.2)

female 2177 32.06 8.23 112(5.1) 836 (38.4) 1229 (56.5)
Total 229820 33.97 11.56 5469 (2.4) 119692 (52.1) 104659(45.5)

Table2. prevalence (real and counterfactual) of the risk factors
Risk factors sex Factual prevalence Counterfactual prevalence
Urban Rural Urban Rural
Scenario1 scenario 2 scenario 3 scenario 1 scenario 2 scenario 3
Unauthorized speed male 19.7 27.2 0 10 5 0 14 5
(19.53-19.68)* (27.01 – 27.38)
female 16.2 20.6 0 8 5 0 10 5
(16.04-16.35) (20.43 – 20.76)
Use of alcohol male 1.9
2 0 0.95 0.0004 0 1 0.01
(1.84 -1.95) (1.94 – 2.05)
female 1.2 0.8 0 0.6 0.0004 0 0.4 0.01
(1.15 – 1.24) (0.76 – 0.83)
Drug Abuse male 2.4 3 0 1.2 0.0159 0 1.5 0.0159
(2.33 - 2.46) (2.96 – 3.03)
female 1.4 1.4 0 0.7 .0159 0 0.7 0.0159
(1.35 – 1.44) (1.35 -1.44)
Driver fatigue and
sleepy
male 4.2 13.5 0 1/2 1 0 7.8 1
(4.11 – 4.28) (13.36 – 13.63)
female 3.5 12.9 0 1.75 1 0 6.5 1
(3.42 – 3.57) (12.76 – 13.03)
No wearing the
safety belt in driver
male 30 40.6 0 15 4 0 20.3 4
(29.79 – 30.20) (40.38 – 40.81)
female 27.1 37.4 0 13.5 4 0 18.7 4
(26.90 – 27.29) (37.18 – 37.61)
No motorcycle
helmet
male 47.5 51.7 0 24 0 0 26 0
(46.96 – 48.05) (51.14 – 52.25)
low light of road 29.6 31.5 0 15 7 0 15 7
(29.41- 29.78) (31.31 – 31.68)
Road Defects 10.3 22.3 0 36 13.3 0 36 13.3
(10.17 – 10.42) (22.12 – 22.47)
Vehicle Defects 4.7 6.3 0 14.7 2 0 15.7 2

(4.61 – 4.78) (6.20 – 6.39) C cell phone use
while driving
Other
Studies
30 0 5.1 3
0
11.1 2
(29.81 – 30.18)
Lake of safety
seats-Use
Other
Studies
72 0 2.3 3 0 3.1 3
(68.89 – 75.11)
* 95% confidence interval
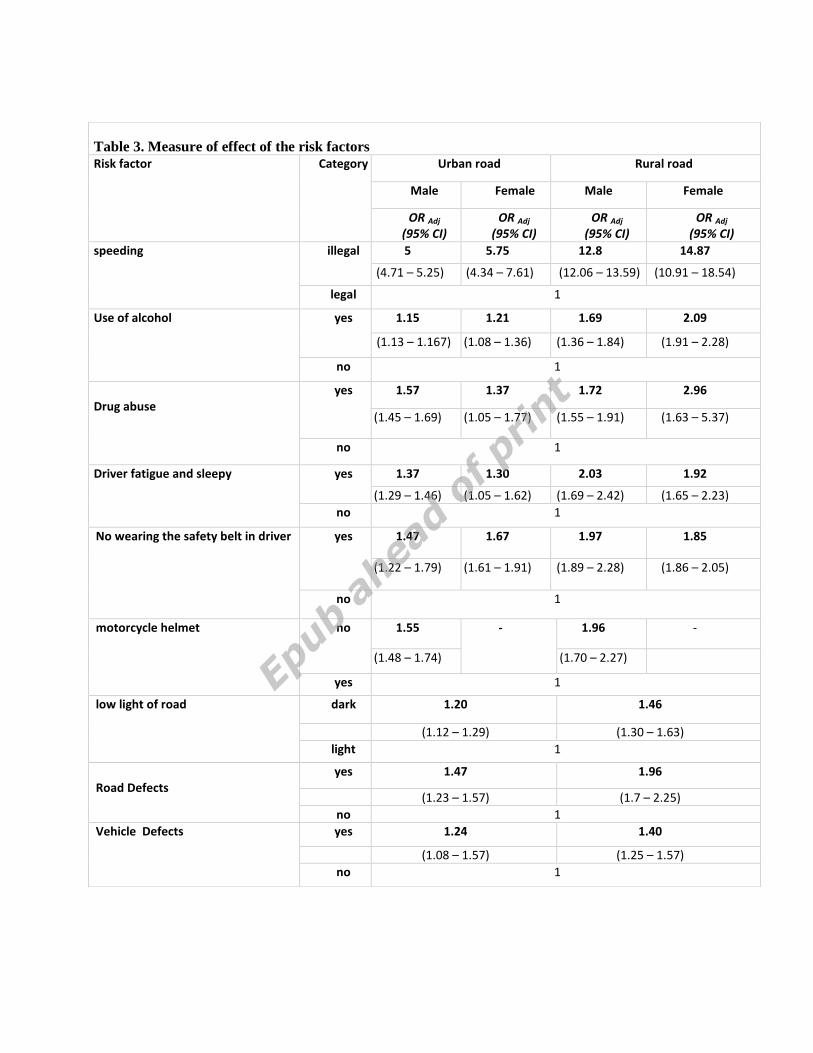
Table 3. Measure of effect of the risk factors
Risk factor Category Urban road Rural road
Male Female Male Female
OR Adj
(95% CI) OR Adj
(95% CI) OR Adj
(95% CI) OR Adj
(95% CI)
speeding illegal 5 5.75 12.8 14.87
(4.71 – 5.25) (4.34 – 7.61) (12.06 – 13.59) (10.91 – 18.54)
legal 1
Use of alcohol yes 1.15 1.21 1.69 2.09
(1.13 – 1.167) (1.08 – 1.36) (1.36 – 1.84) (1.91 – 2.28)
no 1
Drug abuse
yes 1.57 1.37 1.72 2.96
(1.45 – 1.69) (1.05 – 1.77) (1.55 – 1.91) (1.63 – 5.37)
no 1
Driver fatigue and sleepy yes 1.37 1.30 2.03 1.92
(1.29 – 1.46) (1.05 – 1.62) (1.69 – 2.42) (1.65 – 2.23)
no 1
No wearing the safety belt in driver
yes 1.47 1.67 1.97 1.85
(1.22 – 1.79) (1.61 – 1.91) (1.89 – 2.28) (1.86 – 2.05)
no 1
motorcycle helmet no 1.55 - 1.96 -
(1.48 – 1.74) (1.70 – 2.27)
yes 1
low light of road dark 1.20 1.46
(1.12 – 1.29) (1.30 – 1.63)
light 1
Road Defects
yes 1.47 1.96
(1.23 – 1.57) (1.7 – 2.25)
no 1
Vehicle Defects
yes 1.24 1.40
(1.08 – 1.57) (1.25 – 1.57)
no 1
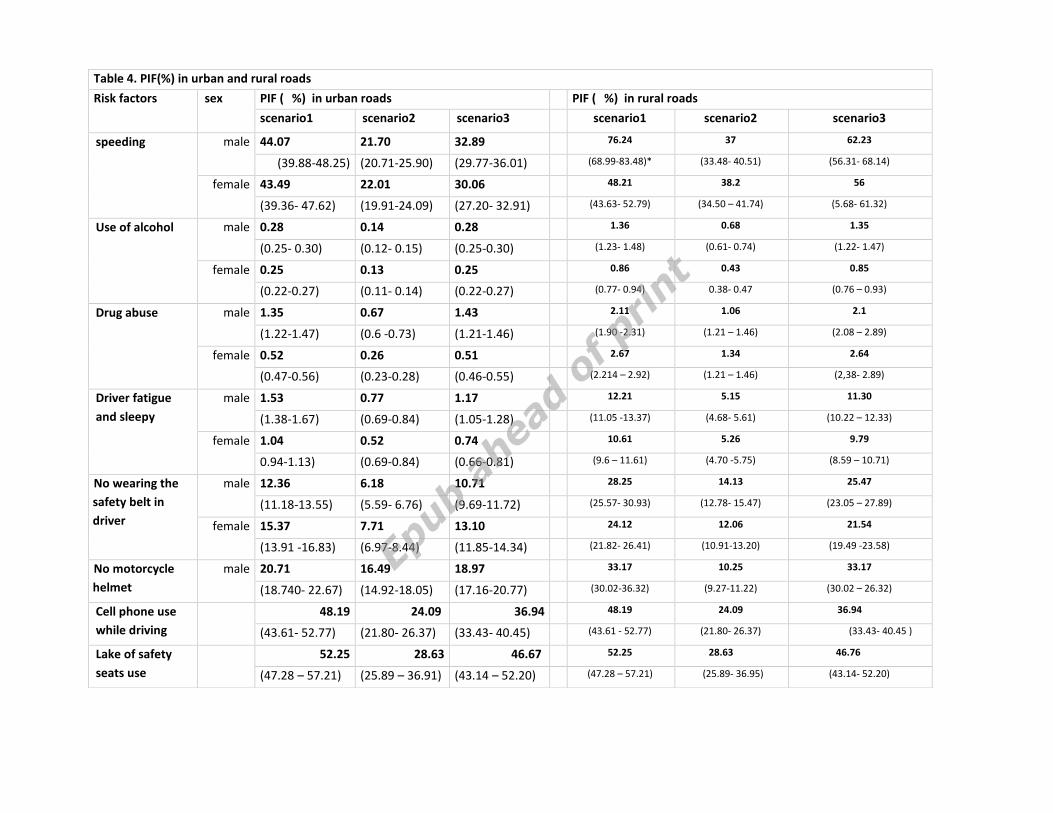
Table 4. PIF(%) in urban and rural roads
Risk factors sex PIF ( %) in urban roads PIF ( %) in rural roads
scenario1 scenario2 scenario3 scenario1 scenario2 scenario3
speeding
male 44.07 21.70 32.89 76.24 37 62.23
(39.88-48.25) (20.71-25.90) (29.77-36.01) (68.99-83.48)* (33.48- 40.51) (56.31- 68.14)
female 43.49 22.01 30.06 48.21 38.2 56
(39.36- 47.62) (19.91-24.09) (27.20- 32.91) (43.63- 52.79) (34.50 – 41.74) (5.68- 61.32)
Use of alcohol male 0.28 0.14 0.28 1.36 0.68 1.35
(0.25- 0.30) (0.12- 0.15) (0.25-0.30) (1.23- 1.48) (0.61- 0.74) (1.22- 1.47)
female 0.25 0.13 0.25 0.86 0.43 0.85
(0.22-0.27) (0.11- 0.14) (0.22-0.27) (0.77- 0.94) 0.38- 0.47 (0.76 – 0.93)
Drug abuse male 1.35 0.67 1.43 2.11 1.06 2.1
(1.22-1.47) (0.6 -0.73) (1.21-1.46) (1.90 -2.31) (1.21 – 1.46) (2.08 – 2.89)
female 0.52 0.26 0.51 2.67 1.34 2.64
(0.47-0.56) (0.23-0.28) (0.46-0.55) (2.214 – 2.92) (1.21 – 1.46) (2,38- 2.89)
Driver fatigue
and sleepy
male 1.53 0.77 1.17 12.21 5.15 11.30
(1.38-1.67) (0.69-0.84) (1.05-1.28) (11.05 -13.37) (4.68- 5.61) (10.22 – 12.33)
female 1.04 0.52 0.74 10.61 5.26 9.79
0.94-1.13) (0.69-0.84) (0.66-0.81) (9.6 – 11.61) (4.70 -5.75) (8.59 – 10.71)
No wearing the
safety belt in
driver
male 12.36 6.18 10.71 28.25 14.13 25.47
(11.18-13.55) (5.59- 6.76) (9.69-11.72) (25.57- 30.93) (12.78- 15.47) (23.05 – 27.89)
female 15.37 7.71 13.10 24.12 12.06 21.54
(13.91 -16.83) (6.97-8.44) (11.85-14.34) (21.82- 26.41) (10.91-13.20) (19.49 -23.58)
No motorcycle
helmet
male 20.71 16.49 18.97 33.17 10.25 33.17
(18.740- 22.67) (14.92-18.05) (17.16-20.77) (30.02-36.32) (9.27-11.22) (30.02 – 26.32)
Cell phone use
while driving
48.19 24.09 36.94 48.19 24.09 36.94
(43.61- 52.77) (21.80- 26.37) (33.43- 40.45) (43.61 - 52.77) (21.80- 26.37) ) (33.43- 40.45
Lake of safety
seats use
52.25 28.63 46.67 52.25 28.63 46.76
(47.28 – 57.21) (25.89 – 36.91) (43.14 – 52.20) (47.28 – 57.21) (25.89- 36.95) (43.14- 52.20)
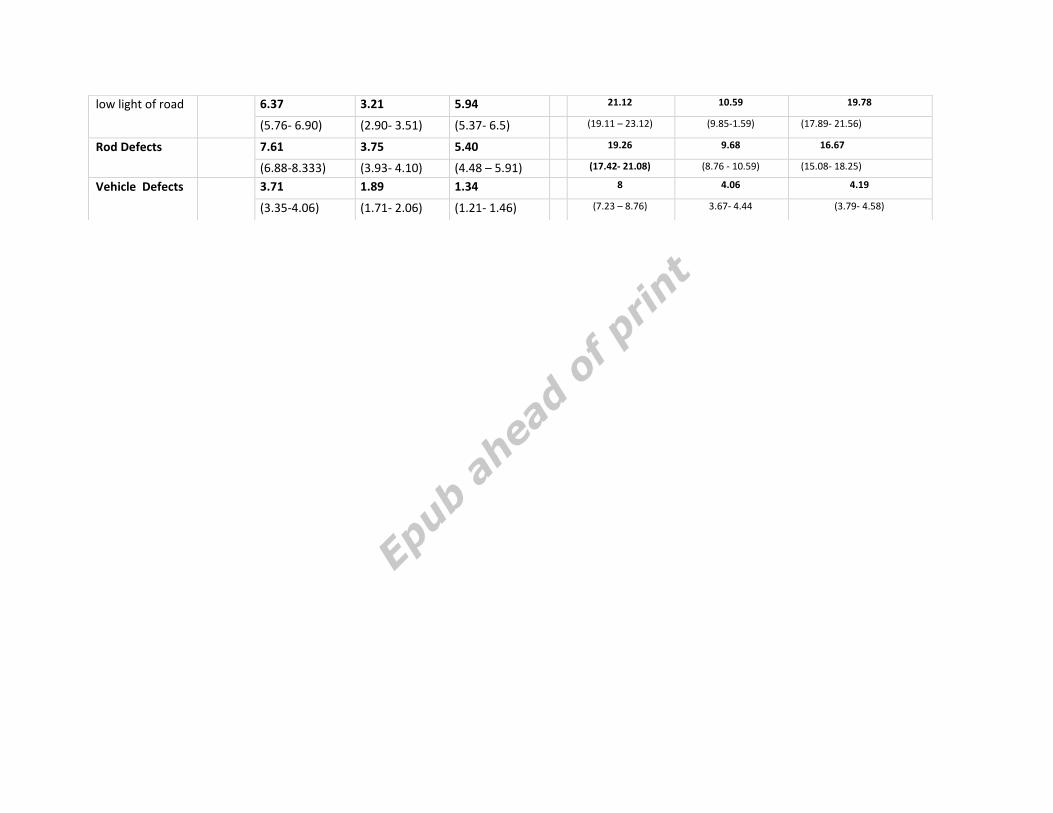
low light of road 6.37 3.21 5.94 21.12 10.59 19.78
(5.76- 6.90) (2.90- 3.51) (5.37- 6.5) (19.11 – 23.12) (9.85-1.59) (17.89- 21.56)
Rod Defects 7.61 3.75 5.40 19.26 9.68 16.67
(6.88-8.333) (3.93- 4.10) (4.48 – 5.91) (17.42- 21.08) (8.76 - 10.59) (15.08- 18.25)
Vehicle Defects 3.71 1.89 1.34 8 4.06 4.19
(3.35-4.06) (1.71- 2.06) (1.21- 1.46) (7.23 – 8.76) 3.67- 4.44 (3.79- 4.58)

Figure1. Joint effect of all risk factors, A: Males, B: females
A
B
