the automotive sector - home | senate democratic … · 365 6 the automotive sector disputes in the...
TRANSCRIPT

365
6The Automotive Sector
Disputes in the automotive sector led to the first postwar trade agreementbetween the United States and Canada—the 1965 Canada–United StatesAutomotive Agreement (commonly known as the 1965 Auto Pact). Clear-ing up residual automotive trade and investment frictions was central tothe 1989 Canada-US Free Trade Agreement (CUSFTA). Likewise, no in-dustrial sector was more critical to the success of NAFTA than the auto-motive sector.
By far, motor vehicles and parts account for a larger share of intrare-gional trade in North America than any product sector. Three-way autotrade in 2003 was $125 billion, representing 20 percent of total tradeamong NAFTA partners. Between 1993 and 2003, the value of NAFTAauto trade almost doubled, accounting for 18 percent of the total growthin NAFTA trade over this period (calculated using data in appendix table6A.1). Trade in vehicles and parts with non-NAFTA countries also in-creased sharply; North American auto-sector imports grew almost twiceas fast as auto exports to the rest of the world. Together, the auto sector in2003 accounted for 12 percent of merchandise trade between non-NAFTAand NAFTA countries.
To a considerable extent, NAFTA, like its predecessors, deepened inte-gration of the North American automotive market. The same “Big Three”automotive producers (General Motors, Ford, and Chrysler) operated inall three NAFTA countries well before negotiations commenced for the1965 Auto Pact, the 1989 CUSFTA, and the 1994 NAFTA. When theNAFTA negotiations began, all three trade ministers understood (with re-lief) that the elimination of trade barriers and investment incentiveswould not prompt huge segments of the automotive industry to shut
06--Ch. 6--365-394 9/16/05 11:45 AM Page 365
down in one North American location and move to another. Instead, theyexpected that plants would continue to accelerate the ongoing process ofspecialization and that intraindustry trade would flourish—exactly ashappened in the wake of the 1965 Auto Pact. Our analysis shows thatthese expectations have been borne out.
Besides being an important sector in its own right, the auto industryprovides a substantial market for other industries, particularly those pro-cessing raw materials (such as textiles, rubber, steel, and aluminum). Ac-cordingly, the performance of the auto industry has a direct and substan-tial impact on the entire economy—and on trade policy.
Policy in the Auto Sector
Policy integration of the North American auto industry followed the pro-duction and distribution initiatives of the Big Three. The policy processbegan with the 1965 Auto Pact, expanded through the Mexican AutomotiveDecree of 1977,1 and culminated in the extension of the North Americanauto regime to Mexico in 1994, when NAFTA entered into force. Big Threeinvestment in the Mexican automotive sector long preceded NAFTA nego-tiations, and a de facto hexagonal trade regime in vehicles and auto partsalready existed between Mexico, the United States, and Canada. NAFTA in-stitutionalized the existing degree of integration and created a more stableand competitive environment for auto production and trade. The more in-tegrated North American market also attracted new investment from Euro-pean and Japanese automakers. Today, Volkswagen produces the new Bee-tle in Mexico for the world market and is investing $100 million to beginproducing the Golf there in 2005; Nissan produces the Sentra in Mexico tosupply the Western Hemisphere. Toyota invested $140 million to open itsfirst Mexican assembly plant in Tijuana in 2004. The plant, located near itspickup bed factory, will produce the Tacoma pickup truck.2
366 NAFTA REVISITED: ACHIEVEMENTS AND CHALLENGES
1. The 1977 Automotive Decree made participation by foreign firms in the domestic Mexi-can market contingent upon exports. Contrary to economic doctrine, the decree’s trade-balancing requirements and ownership limitations accelerated Mexican auto industry ratio-nalization. See Moran (1998) and Samuels (1990).
2. Rather than representing a zero-sum game, integration of the auto sector under NAFTAcould spawn more investment in US auto plants. As an example, when its Tijuana plant ex-panded, Toyota overhauled its Long Beach plant by investing several hundred million dol-lars. This represented the first vehicle production investment in southern California since1992. By 2003, Toyota added about 12,000 workers to its US employment base. Based on ex-tensive written comments provided by Theodore Moran, February 2005. See also “ToyotaPlans to Move Production of Parts of Pickup to Mexico,” Wall Street Journal, January 4, 2002,A8; and John O’Dell, “Toyota to Add Assembly Site in Southland,” Los Angeles Times, June 7,2002.
06--Ch. 6--365-394 9/16/05 11:45 AM Page 366

The 1965 Auto Pact
The 1965 agreement linked the auto industries of Canada and the UnitedStates by ending Canadian policies aimed at self-sufficiency in automo-biles and major components.3 The higher level of integration and better ac-cess to the world’s largest auto market allowed Canada to develop an in-ternationally competitive auto industry. The Auto Pact created a tariff-freeregion for automotive trade; at the same time, it provided a degree of“safe-harbor” protection to ensure that the major firms continued their in-vestment and production in Canada. The Auto Pact allowed the Big Threeto rationalize production between Canada and the United States and forma single integrated production and marketing system. The ensuing ratio-nalization enabled some parts and assembly firms to choose a unique pro-duction location to supply the regional market. As a consequence, eachcountry specialized to a greater degree in particular automotive lines (e.g.,trucks or large cars) and components (e.g., engines or transmissions).
In the margins of the Auto Pact, Canada imposed safeguards to ensurethat Canadian production corresponded to a high percentage of Canadianconsumption of vehicles and parts.4 Under the Auto Pact, Canadian vehi-cles and parts entered the United States duty-free, based both on the placeof origin (Canada) and the extent of regional content (at least 50 percentNorth American, meaning Canadian or US components). However, USand other vehicles and parts entered Canada duty-free from any country,based on the fulfillment by the importing manufacturer of the Auto Pactperformance criteria (volume of Canadian production and Canadianvalue added requirement), not on the place of origin.
The Canada-US Free Trade Agreement
As a result of the Auto Pact, the US and Canadian automotive sectors werealready largely integrated by the 1980s. The primary changes in CUSFTAfor the automotive sector pertained to imports from outside North Amer-ica. Under the Auto Pact, Canadian firms could import automobiles orparts from Europe or Japan and then sell them in the US market without
THE AUTOMOTIVE SECTOR 367
3. According to Paul Wonnacott (1965), the Canadian government ran a narrowly focusedtrade-balancing policy in parts under the pre-1965 auto regime. The idea was to encouragethe manufacture of engines and transmissions in Canada, but allow the importation of otherparts. We thank Paul Wonnacott and others for providing written comments to an earlierdraft of this chapter.
4. The US government acquiesced to Canadian value added requirements because theywere viewed as transitional arrangements. As a continuing source of bilateral trade friction,Canadian value added requirements almost led to the repudiation of the Auto Pact inAugust 1971.
06--Ch. 6--365-394 9/16/05 11:45 AM Page 367
paying duties at any step along the way, provided that the European andJapanese exporters maintained a certain production-to-sales ratio and avalue added threshold through their Canadian manufacturing sub-sidiaries. Japanese auto firms, apart from Honda, never chose to meet theserequirements, but Volvo and European subsidiaries of the Big Three did.
CUSFTA terminated duty-free entry based on a production-to-salesratio test but “grandfathered” firms that already enjoyed duty-free pref-erences in the auto sector (allowing them to continue doing so). Also, be-fore CUSFTA, Canada offered foreign firms reduced tariffs if they met cer-tain value added thresholds for production in Canada. The United Statesregarded these tariff waivers as a disguised subsidy, and CUSFTA phasedthem out.5 Finally, CUSFTA set a stronger origin threshold for “NorthAmerican” production: Fifty percent of the cost of manufacturing mustoccur in Canada or the United States in order for the final product to qual-ify for duty-free treatment. CUSFTA effectively set the standard for futureFTA content requirements, unlike the Canadian value added tests underthe post-1965 agreement.6
Mexico
The Big Three started investing in mexico in the 1930s. In the 1960s, Nis-san and Volkswagen joined them as mexican producers. During the 1960sand 1970s (the era of import substitution), mexico decided that its do-mestic motor industry should supply essentially the entire domestic mar-ket. In 1962 the Mexican government prohibited imports of finished ve?hicles and imposed high local-content requirements on the foreigncompanies producing cars in Mexico (Ford, GM, Chrysler, Nissan, andVolkswagen). The Mexican Automotive Decree of 1977 made continuedparticipation by foreign firms contingent on exports—essentially a trade-balancing requirement. By 1980, the Mexican policy package had createda 500,000-unit motor vehicle industry producing vehicles with 50 percentlocal content, plus substantial exports of parts and components (to meet
368 NAFTA REVISITED: ACHIEVEMENTS AND CHALLENGES
5. Japanese and European automobile producers ultimately won a WTO case, claiming thatthe Canadian practice of giving US auto firms duty-free entry if they meet the Canadian pro-duction and value added tests, while phasing out the tariff waivers for third-country pro-ducers, was discriminatory (Canada—Certain Measures Affecting the Automotive Industry,WT/DS139 [brought by Japan], and WT/DS142 [brought by the European Commission]). Inresponse, Canada abandoned the production and value added tests, effectively “ending” theAuto Pact for good. Canada now imposes a 6.1 percent tariff on all non-NAFTA automobileimports. However, imports from Mexico and the United States, which constituted 82 percentof Canadian automotive imports in 2002, enter duty-free under NAFTA.
6. We thank Paul Wonnacott for emphasizing this point to us.
06--Ch. 6--365-394 9/16/05 11:45 AM Page 368
the trade-balancing requirements). But the industry as a whole was un-competitive when benchmarked against international standards.7
When Mexico joined the General Agreement on Tariffs and Trade (GATT)in 1986, its schedule of tariff liberalization conspicuously excluded autos.However, the Mexican government soon recognized that its protectiveauto regime, while eminently successful in jump-starting domestic pro-duction, had fostered a high-cost and uncompetitive industry. The Mexi-can Automotive Decree of 1989 substantially liberalized Mexican rules onthe auto industry, even though the national value added requirement andnative ownership requirement remained huge impediments to industryrationalization.8
NAFTA
NAFTA had only an indirect impact on Canada-US automotive-sector in-tegration, because each country already enjoyed relatively unfettered ac-cess to the other’s market.9 The difficult negotiating issues for the auto-motive sector all pertained to Mexico.
First, the rule-of-origin threshold was raised in two phases to 56 percentin 1998 and ultimately to 62.5 percent in 2002 for most automotive prod-ucts, a substantial increase from the 50 percent threshold in CUSFTA. Thethreshold was raised to prevent foreign automotive producers (especiallyJapanese producers) from using Mexico as an export platform to sell intothe United States. Canada resisted pushing the rule of origin threshold toohigh because it did not want to disrupt existing production chains, whichrely to some extent on non–North American components.
The second order of business for the five established auto firms was togain better access to the Mexican market. Although Mexico had takensteps to liberalize its automotive sector since joining GATT in 1986, fullliberalization of the Mexican auto industry culminated with NAFTA. Theagreement ultimately dismantled the protectionist auto regime but al-
THE AUTOMOTIVE SECTOR 369
7. See Womack, Jones, and Roos (1991, 264). Even in this period, some Mexican plants (e.g.,Ford in Hermosillo) manufactured good-quality autos at competitive costs for export to theUS market.
8. Moran (1998) contends that unlike the ownership and value added requirements in theMexican policy package, the trade-balancing requirements fostered rationalization andlower costs. Requirements under the Mexican Automotive Decree of 1989, however, re-mained onerous enough that very few vehicles were imported into Mexico. We thank G. Mustafa Mohatarem for extensive written comments on the Mexican auto regime andother issues.
9. Under the surface, however, US-Canadian tensions were mounting over secret dealsbetween Canada and Big Three firms involving production incentives. These issues werequietly resolved in the context of NAFTA talks.
06--Ch. 6--365-394 9/16/05 11:45 AM Page 369
lowed a long phaseout period. National-content requirements were trans-formed into regional-content requirements, and a ten-year phaseout pe-riod (starting in 1995) was scheduled for the Mexican Automotive Decreeof 1989. These measures gave the Mexican auto industry breathing roomto meet import competition; meanwhile NAFTA ensured immediate andunfettered access of Mexican automotive products to the US and Cana-dian markets.
Mexican tariffs on cars and light trucks imported from the United Statesand Canada were lowered from 20 to 10 percent in 1994. Duties werephased out for light trucks in 1998 and for cars in 2003. Duties on partswere fully phased out in 2003 (75 percent of US parts exports have enteredthe Mexican market duty-free since 1998). However, Mexico maintained itsmost favored nation (MFN) tariffs on autos and parts imported from non-NAFTA sources. As Mexico has extended its network of bilateral tradeagreements, however, these tariffs have been reduced or eliminated.10
NAFTA also required the gradual phaseout of nontariff auto trade bar-riers. In 1994, Mexico lowered the trade-balancing requirement from $1.75of exports for every dollar of imports to $0.80 of exports per dollar im-ported. The requirement was phased down to $0.55 in 2003 and then elim-inated in 2004. The national value added requirement dropped from 36percent in 1994 to 29 percent in 2003 and was eliminated at the start of2004. The national-content requirement was lowered from 30 to 20 percentboth for the auto parts industry and “national suppliers” (maquiladorasqualify as national suppliers if they are not owned by the assembler theysupply). Finally, import quotas were eliminated for heavy trucks andbuses in 1998, and the surviving import ban on used cars will be elimi-nated by 2009.
Before the 1990s, the Mexican auto parts industry was relatively mod-est and highly protected from international competition.11 Mexican firmsfeared NAFTA would mean the end of the domestic parts industry, and infact many small companies did suffer from intense competition.
Despite these pressures, however, Mexico’s auto parts industry as awhole is in good health and competitive internationally. NAFTA allowed
370 NAFTA REVISITED: ACHIEVEMENTS AND CHALLENGES
10. For example, the EU-Mexico trade pact contains special provisions for the automotivesector. Mexico agreed to eliminate its Automotive Decree by 2004, and improve access forEU vehicles. Mexican tariffs on vehicles were reduced from 20 to 3.3 percent when the pactentered into force in July 2001 and eliminated in 2003. Favorable access is also accorded toEuropean car parts and components. A transitional relaxation of EU rules of origin willallow Mexican industry to comply with European content standards. See the “Communica-tion from the Commission to the Council and the European Parliament, accompanying thefinal text of the draft decisions by the EC-Mexico Joint Council,” http://europa.eu.int/comm/external_relations/news/2000/01_00/doc_00_2.htm (accessed on April 29, 2005).
11. According to Nunez (1990), by 1984, the Mexican automotive parts industry included310 firms, 40 with sales over $10 million and 50,500 employees.
06--Ch. 6--365-394 9/16/05 11:45 AM Page 370

a long and generous transition period for Mexican parts suppliers—per-mitting Mexican firms to retain some protection from imports, both byphasing out the national-content requirement over 10 years and by main-taining the 49 percent maximum foreign investment share in national-supplier firms for five years (until 1999).
In fact, the Mexican parts industry adapted faster to competition thannegotiators expected. Mexican producers established strategic allianceswith foreign companies. Instead of replacing local suppliers, foreign sup-pliers teamed with Mexican auto parts manufacturers; the former providethe technical and design know-how, and the latter provide the plant andworkforce. Links with foreign companies have given Mexican producersthe technology to sell competitively in North America and have madeMexico a more attractive location for assembly plant investment from Eu-rope and Japan.
Mexican trade diplomats are trying to enlarge the scope of automotiveexport destinations to take advantage of markets outside North America(in 2003, 93 percent of Mexican auto exports were destined for the UnitedStates and Canada; calculated using data in appendix table 6A.1). Theslew of trade agreements that Mexico has negotiated with other partnershas become a central feature of the nation’s trade strategy.
In fact, Mexico has constructed a large network of FTAs with countriesin Europe, East Asia, and Latin America as part of an aggressive strategyto become a global trade and investment hub. As of May 2005, Mexico hasentered into FTAs with the European Union, Israel, Japan, Chile, CostaRica, Colombia, Venezuela, Bolivia, Uruguay, Nicaragua, Guatemala, Hon-duras, El Salvador, and the European Free Trade Association (EFTA) coun-tries, in addition to NAFTA. FTA talks are ongoing with the four SouthAmerican nations of the Southern Cone Common Market (Mercosur). Onthe regional level, Mexico is one of the 34 countries negotiating the FreeTrade Area of the Americas (FTAA). These trade agreements encouragenew investment in Mexico, in the auto industry and elsewhere, to serve theNorth American market and to open opportunities in the Western Hemi-sphere, Europe, and Asia.
As a precursor to free trade with Mercosur, Mexico and Brazil signed abilateral auto pact in July 2002 to export 140,000 automobiles to eachother’s markets at a duty of 1.1 percent. Before the agreement, Brazil andMexico could trade only 50,000 units annually at a duty of 8 percent,while additional exports faced a 35 percent tariff in Brazil and a 23 percenttariff in Mexico.12 The tariffs and the quota of 140,000 autos will be pro-gressively liberalized and eliminated in 2005.
THE AUTOMOTIVE SECTOR 371
12. Nevertheless, in 2003, over 95 percent of Mexican auto and parts exports were still des-tined for the United States and Canada.
06--Ch. 6--365-394 9/16/05 11:45 AM Page 371

North American Auto Trends
What has happened to the auto industry since NAFTA went into effect,and what, if anything, has NAFTA done to change the North Americanauto industry? In this section, we look at data on production, sales, em-ployment, wages, investment, and trade to discover the answers. Overall,the effect of NAFTA appears to be very positive, particularly for the BigThree and for Mexico.
Production and Sales
Table 6.1 shows production and sales figures for the auto industry inCanada, Mexico, and the United States between 1993 and 2003. Auto pro-duction in the United States has remained rather flat since NAFTA wentinto effect, averaging 12.1 million units per year over this period, with apeak level of 13.1 million units in 1999. Canada’s auto production alsopeaked in 1999 at 3.1 million units, which was 35 percent above the 1993level. While auto production in the United States and Canada trailed offduring the recession of 2001, Mexico’s auto production was slower to de-cline but had fallen to 1.6 million units in 2003. Within Mexico, roughly 60percent of the units were produced by the Big Three in 2003; Nissan andVolkswagen accounted for about 15 percent each (Ward’s Communica-tions 2004).13
Although the United States exports automobiles to most parts of theworld, the US appetite for imported cars is particularly strong, and auto-mobile sales in the United States run well ahead of production (table 6.1).In 2003, the number of automobile units sold in the United States was 17million, down from the 2000 peak of 17.8 million but well above the 1993figure of 14.2 million. Domestic auto sales exceeded US production by 45 percent. By contrast, domestic production exceeded sales by 1 millionunits in Canada and 600,000 units in Mexico. Nonetheless, domestic pur-chases of autos have grown sharply in all three countries under NAFTA.Sales in Mexico plummeted during the peso crisis but reached 1 millionunits in 2002 and 2003 (some 5 percent of NAFTA sales compared with 3.8percent in 1995).
372 NAFTA REVISITED: ACHIEVEMENTS AND CHALLENGES
13. Two new foreign-owned assembly plants are scheduled to open in Mexico in 2005 (Toy-ota and Volkswagen), compared with only one new assembly plant built in Canada since1990. As a result of weak demand, operations like Ford’s Oakville assembly plant sharply re-duced the number of shifts. See “Ford to Build a New Plant in Oakville,” CBC News, Octo-ber 29, 2004; and Steve Arnold, “Weak Sales Are Idling Auto Plants,” The Hamilton Spectator,November 16, 2004. In an effort to maintain its footing in the auto industry, in March 2005,the Canadian government provided $435 million to attract a $2.5 billion GM upgrade in On-tario. See “GM to Boost Production Plant in Canada,” Wall Street Journal, March 3, 2005.
06--Ch. 6--365-394 9/16/05 11:45 AM Page 372

Viewed from the US perspective, mercantilist thinkers would bealarmed. But since NAFTA entered into force, we have not heard the samehue and cry from the Big Three or the United Auto Workers (UAW) aboutimports that was common in the 1980s and early 1990s—a time when au-tomobile imports from Japan were characterized as a scourge.14 The Big
THE AUTOMOTIVE SECTOR 373
14. There is concern, however, that NAFTA facilitated increasing production by foreign-owned companies (transplants) in the United States. (Nissan, Volkswagen, and other foreigncompanies are major investors in Mexico and the southern United States.) While Big Threeproduction declined significantly under NAFTA, total US production, including transplants,experienced a much smaller overall decline. Transplants, rather than imports, now accountfor a larger portion of market share lost by the Big Three. Based on extensive written com-ments provided by G. Mustafa Mohatarem in March 2005. A more likely cause for the rise in transplants (a trend that began in the 1980s) is voluntary export restraints imposed byJapan to calm trade frictions with the United States, which inter alia encouraged Japanesefirms to produce in the United States (Cooney and Yacobucci 2005, 56). Nonetheless job loss
Table 6.1 Auto production and sales in North America, 1993–2003 United States Canada Mexico NAFTA
Millions Percent Millions Percent Millions Percent MillionsYear of units of NAFTA of units of NAFTA of units of NAFTA of units
Production1993 10.9 76.5 2.3 15.9 1.1 7.6 14.21994 12.3 78.1 2.3 14.8 1.1 7.2 15.71995 12.0 78.2 2.4 15.7 0.9 6.1 15.41996 11.9 76.6 2.4 15.5 1.2 7.9 15.51997 12.2 75.6 2.6 16.0 1.4 8.4 16.11998 12.0 74.9 2.6 16.0 1.5 9.1 16.11999 13.1 74.0 3.1 17.3 1.5 8.7 17.62000 12.8 72.4 3.0 16.7 1.9 10.9 17.72001 11.5 72.3 2.5 16.0 1.9 11.7 15.82002 12.3 73.5 2.6 15.7 1.8 10.8 16.72003 12.1 74.6 2.6 15.7 1.6 9.7 16.2
Sales1993 14.2 88.8 1.2 7.5 0.6 3.8 16.01994 15.4 89.1 1.3 7.3 0.6 3.6 17.31995 15.1 91.8 1.2 7.1 0.2 1.1 16.51996 15.5 90.9 1.2 7.1 0.3 2.0 17.01997 15.5 88.9 1.4 8.2 0.5 2.9 17.41998 16.0 88.4 1.4 7.9 0.7 3.7 18.11999 17.4 88.6 1.5 7.8 0.7 3.6 19.72000 17.8 87.7 1.6 7.8 0.9 4.5 20.32001 17.4 87.3 1.6 8.0 0.9 4.7 20.02002 17.1 86.2 1.7 8.7 1.0 5.1 19.92003 17.0 86.6 1.6 8.3 1.0 5.1 19.6
Source: Ward’s Communications (2004).
06--Ch. 6--365-394 9/16/05 11:45 AM Page 373

Three have substantial production capacity in Canada and Mexico. Con-sequently, Canadian and Mexican “export platforms” for sales to the USmarket do not harm the Big Three; indeed, they actually improve operat-ing margins by reducing production costs. That of course does not put anend to labor concerns, but it is a side benefit of NAFTA.15
To examine the extent to which the North American region supplies itsown market, we constructed a NAFTA self-sufficiency index (table 6.2).This index is the ratio of North American production to consumption,where consumption is calculated as the total value produced withinNAFTA plus imports from third countries and minus exports to thirdcountries. In 1997, the self-sufficiency index in the auto industry was 93percent (meaning that the North American auto industry supplied 93 per-cent of North American auto consumption).16 By 2002 the index had fallento 88 percent. Throughout this period, North America has been less self-sufficient in autos than in manufacturing as a whole. Depending on one’s
374 NAFTA REVISITED: ACHIEVEMENTS AND CHALLENGES
concerns persist. Representative Marcy Kaptur’s (D-OH) claims that the Big Three auto-producing states (Ohio, Michigan, and Indiana) lost over 115,621 jobs under NAFTA. See“An Open Letter to President George W. Bush and Mexican President Vicente Fox,” Sep-tember 6, 2001, www.uaw.org/atissue/01/090601kaptur.html (accessed March 2005).
15. As an example, in 2002, Canadian Auto Workers (CAW) plant workers won pay in-creases of 9 percent over three years and an average hourly wage of C$22.40. But there isgrowing concern that big companies are unable to meet pension obligations for assemblyworkers. See Greg Keenan, “CAW Renews Drive to Unionize Toyota,” Globe and Mail, July13, 2004.
16. The detailed NAICS data, which underlie this index, go back only to 1997.
Table 6.2 Self-sufficiency index, North America, 1997–2003 (billions of dollars)Domestic Self-sufficiencyshipments Imports Exports index (percent)
All All All Allmanu- manu- manu- manu-
Year Autos facturing Autos facturing Autos facturing Autos facturing
1997 504.3 4,269.3 159.6 975.6 121.1 798.2 92.9 96.0
1998 525.1 4,328.4 169.4 1,055.2 122.5 818.1 91.8 94.8
1999 601.1 4,505.2 201.0 1,175.0 137.9 868.6 90.5 93.6
2000 581.8 4,734.7 224.4 1,362.9 145.9 983.9 88.1 92.6
2001 527.0 4,464.9 215.7 1,281.5 137.3 917.5 87.1 92.5
2002 682.1 4,396.9 231.6 1,288.9 142.3 883.6 88.4 91.6
2003 237.7 1,356.7 144.9 907.7
Notes: Imports and exports include intra-NAFTA trade, which is cancelled out in the self-sufficiency indexcalculation. Auto trade is defined as SITC 78 (road vehicles). Manufacturing trade is defined as SITC 5-8.Shipments data are an aggregation of national statistics. Auto shipments data are defined as NAICS 3361,3362, and 3363 for Canada and the United States and as Mexican Class 3841 for Mexico. NAICS datafor the United States are available starting in 1997.
Sources: UN Comtrade Database, 2004; US Census Bureau (2003, 2005); INEGI (2005); and StatisticsCanada (2005).
06--Ch. 6--365-394 9/16/05 11:45 AM Page 374

point of view, the trend indicates that North America’s ability to meet itsown automotive needs is regrettably decreasing or that its level of inte-gration with the rest of the world is happily increasing.
Employment and Wages
Although Big Three managers may not be concerned when productionshifts from the United States to Mexico, autoworkers in the United Statesare far from indifferent. Contrary to the contemporary fear when NAFTAwas ratified, however, NAFTA has not harmed US autoworkers to the ex-tent imagined. Their fortunes are primarily tied to the business cycle andto a lesser extent to the dollar exchange rate versus the yen and the euro.Meanwhile, working conditions have improved for autoworkers in Can-ada since the 1965 Auto Pact and for their counterparts in Mexico sinceNAFTA went into effect in 1994.
Table 6.3 shows total employment in the auto assembly and auto partssectors, as well as manufacturing as a whole, between 1994 and 2004 forCanada, Mexico, and the United States. Not surprisingly, fluctuations inemployment correspond to changes in production. In all three countries,total auto employment trends followed the business cycle, rising throughthe 1990s, and receding in the economic slowdown of 2001–02. In the autoindustry, as well as the entire manufacturing sector, employment in theUnited States and Mexico is substantially below levels in the late 1990s.Canada experienced a decline in autoworkers as well, although less severe.In fact, Canada is the only NAFTA country where auto and manufacturingemployment are greater today than when NAFTA entered into effect.
Since table 6.3 does not reveal a pronounced migration of US auto jobsto Mexico, we investigate the question further. Using quarterly data fromthe first quarter of 1994 to the third quarter of 2003, we estimated a re-gression model to explain the level of US auto employment. The three in-dependent variables are US real GDP (to capture the business cycle andreal income growth), time (as a proxy for productivity gains), and Mexi-can auto employment. We expect US auto employment to be positivelycorrelated with real GDP and negatively correlated with time. To the ex-tent that Mexican auto production substitutes for US production, we alsoexpect US auto employment to be negatively correlated with Mexicanauto employment.
The model gives a reasonably good fit, with an R-squared coefficient of0.56.17 The model coefficients, taken together, predict a loss of 74,000 USauto jobs between 1994 and 2003, while the actual loss was 43,000. How-ever, the model is most interesting when we consider each independent
THE AUTOMOTIVE SECTOR 375
17. The R-squared statistic, which ranges from 0 to 1, indicates the regression model’s good-ness of fit.
06--Ch. 6--365-394 9/16/05 11:45 AM Page 375

376
Table 6.3 Employment in the auto sector and manufacturingindustry, 1994–2004
Year Assemblya Bodiesb Partsc Total auto Manufacturing
Canada1994 56,200 — 72,542 128,742 1,716,2451995 56,050 — 77,130 133,180 1,748,4431996 57,508 — 80,210 137,718 1,788,9521997 54,524 — 81,127 135,651 1,855,3911998 57,687 — 87,281 144,968 1,916,1701999 56,913 — 93,175 150,088 1,955,9142000 55,712 — 98,154 153,866 2,253,9002001 51,435 — 95,060 146,495 2,229,5002002 50,985 — 98,114 149,099 2,291,0002003 48,735 — 103,413 152,148 2,283,4002004 47,897 — 101,254 149,151 2,297,000
Mexico1994 46,838 — 75,225 122,063 1,409,2381995 38,926 — 64,616 103,542 1,298,6651996 40,777 — 69,782 110,559 1,332,9311997 43,987 — 79,752 123,739 1,409,8491998 49,047 — 89,664 138,711 1,459,3071999 52,168 — 90,008 142,176 1,475,2232000 53,950 — 94,539 148,489 1,495,8222001 51,628 — 86,285 137,913 1,432,8402002d 47,262 — 80,497 127,759 1,360,8662003d 41,101 — 74,345 115,446 1,290,5262004d 38,569 — 74,316 112,885 1,260,103
United States1994 281,500 151,400 735,600 1,168,500 17,021,0001995 294,700 159,900 786,900 1,241,500 17,241,0001996 285,300 155,100 799,900 1,240,300 17,237,0001997 286,800 158,200 808,900 1,253,900 17,419,0001998 283,600 169,700 818,200 1,271,500 17,560,0001999 291,300 184,200 837,100 1,312,600 17,322,0002000 291,400 182,700 839,500 1,313,600 17,263,0002001 278,700 159,400 774,700 1,212,800 16,441,0002002 265,400 152,200 733,600 1,151,200 15,259,0002003 264,600 153,000 707,800 1,125,400 14,510,0002004 256,100 164,500 688,500 1,109,100 14,329,000
a. For United States and Canada: NAICS 3361. For Mexico: 205 Clases de ActividadEconómica 384110.
b. For United States: NAICS 3363. Canada and Mexico do not provide separate employ-ment statistics for bodies; instead, employment in auto bodies is included in other auto-motive categories.
c. For United States and Canada: NAICS 3362. For Mexico: 205 Clases de ActividadEconómica 384121, 384122, 384123, 384124, 384125, and 384126.
d. Preliminary estimates.
Sources: Statistics Canada, 2005, www.statcan.ca; INEGI (2005); BLS (2005).
06--Ch. 6--365-394 9/16/05 11:45 AM Page 376

variable separately. While the coefficients for GDP and time are highly sig-nificant and show the expected signs, the coefficient for Mexican employ-ment is not significant, though it does show the expected sign. The mag-nitudes of the two significant coefficients (GDP and time) are surprisinglylarge. The time coefficient suggests that technology is removing jobs fromthe US auto industry at a rate of 117,000 per year. Taking this coefficient byitself (and with a tablespoon of salt), the process of innovation appears tohave removed 1.1 million jobs from the industry between 1994 and 2003!Fortunately demand has grown, and the model calculates that 371 autojobs are created for every billion dollars of additional real GDP (measuredin 2000 US dollars). With GDP growth of $2.8 trillion over the period, thecoefficient suggests that demand growth created more than 1 million jobs.
The estimated effect of Mexican employment, which is not statisticallysignificant, is to remove 896 auto jobs from the United States for every 1,000Mexican auto jobs created. Since Mexican auto employment fell by 9,600jobs over the period, the supposed impact was to create about 8,600 US autojobs. This effect is negligible. The much larger technology and demand ef-fects easily overwhelm any influence of Mexican employment, positive ornegative. This analysis suggests that so far as auto jobs are concerned, thefear of southward migration is vastly overstated in popular discussion.
Hourly compensation figures (inclusive of fringe benefits) in table 6.4tell a less cheerful story from the standpoint of US autoworkers. The earn-ings figures are expressed in current US dollars and are compiled by theBureau of Labor Statistics for the purpose of comparison across nationalboundaries. Although autoworkers in the United States took home moredollars in 2002 (the latest year available) than in 1993, the earnings gain of
THE AUTOMOTIVE SECTOR 377
Table 6.4 Compensation cost per hour for autoworkers,1993–2002 (US dollars per hour)
Year United States Canadaa Mexico
1993 25.52 20.83 3.981994 26.64 20.65 4.091995 26.55 20.81 2.561996 27.23 21.02 2.511997 28.00 20.86 2.931998 26.44 20.50 3.021999 26.73 19.97 3.452000 27.99 21.14 4.182001 29.84 20.83 5.042002b 31.67 21.12 5.12
a. Canadian data for 2000–02 are estimated using the Canadian compensationcost for all manufacturers.b. Revised BLS methodology contributed to the increase in US compensationrate in 2002.
Note: Industry defined as SIC 371 in all three countries.
Source: BLS (2004).
06--Ch. 6--365-394 9/16/05 11:45 AM Page 377

24 percent only matched cumulative inflation of 24 percent over the sameperiod. In other words, the real purchasing power of auto wages remainedthe same. For most US workers, by contrast, the 1990s was a decade whenreal wages increased. Autoworkers did not do as well, but the auto pre-mium is still large: In 2002 the average autoworker’s hourly compensationwas $10.34 per hour above the average blue-collar manufacturing worker.
In nominal dollar terms, wages in the Mexican auto industry regainedtheir 1993 level only in 2000, after falling precipitously in 1995. A hasty in-terpretation would say that nothing improved in the first years of NAFTA.But wages throughout Mexico were unsustainably high in 1993 given theovervalued peso and perilous condition of the Mexican financial systemjust before the financial crisis of 1994–95. Between January 1990 and Janu-ary 1994, the peso increased in real value by 35 percent (taking into ac-count both inflation and exchange rates), causing Mexican workers to bepaid that much more in dollar terms. The fundamentals of the Mexicaneconomy simply did not support this real appreciation of the peso. Thepostcrisis path of earnings in the Mexican auto industry is consistent withthe general increase in earnings in the Mexican manufacturing sector as awhole. Once the peso crisis settled down, real wages in the automotivesector and the manufacturing sector as a whole managed to increase (seechapter 2).
Mexicans who work in auto assembly earned roughly 30 percent morethan the average manufacturing worker in 2002.18 This differential wasthe same in 1994 when NAFTA went into effect. The earnings premium inMexico reflects the fact that auto firms need to attract workers withhigher-than-average skills and good work habits. The union influence isdecidedly less in Mexico, compared with the United States or Canada.
It is clear from table 6.4 that Mexican autoworkers earn only a fractionof US pay levels. After the peso crisis, the compensation cost for a Mexi-can autoworker was less than 10 percent that of a US autoworker. Sincethen, Mexican compensation has steadily risen, to 16 percent of US com-pensation in 2002.
Although US union leaders argue that Mexico is putting downwardpressure on the earnings of US autoworkers (and this may be partly true),another explanation is that the wage premium paid to unionized au-toworkers—the amount they earn in excess of the average for manufac-turing workers—was compressed in the early 1990s largely as a result ofUS nonunion auto plants.19
378 NAFTA REVISITED: ACHIEVEMENTS AND CHALLENGES
18. This percentage is calculated using total remuneration and employment data fromINEGI (2005).
19. In recent years, the number of auto plants has significantly grown in southern US states,an area traditionally less receptive to unions than the industrial midwest. The UAW hasstruggled to organize these plants, without significant success (“Rural Alabama auto plantturns UAW battleground,” Detroit News, October 27, 2003).
06--Ch. 6--365-394 9/16/05 11:45 AM Page 378

To test the hypothesis that international trade with low-wage countriesputs downward pressure on US wage premiums, we attempted to find acorrelation between the changes in trade balance for an industry and thechanges in compensation premiums between 1992 and 2001. If the hy-pothesis is correct, compensation premiums in an industry should rise(fall) relative to other industries when the industry trade balance im-proves (worsens).
To start, we examine trends in the trade balance and compensation pre-miums in the manufacturing sector. First, we consider US industry-leveltrade balances with Mexico and with all low-wage countries.20 Industrytrade balances are expressed as a percentage of total domestic shipments(the value is negative in the case of a trade deficit). To control for year-on-year variation, we use three-year averages to gauge the shift in trade bal-ances from 1992–94 to 1999–2001. A positive change represents a shift to-ward exports, while a negative change shows a shift toward imports.21
Table 6.5a presents trade balance data for ten industries at the SITC two-digit level. Scaled by industry size, the auto industry is a heavy importer,both from Mexico and from all low-wage countries (the majority of the in-dustry’s trade deficit with low-wage countries is attributable to Mexico).Over the past ten years, the US auto industry has turned from a net ex-porter to a net importer with respect to low-wage countries.
Turning to compensation, we calculate the compensation premium of anindustry in two ways: (1) as the dollar difference between the hourly com-pensation of an industry’s production workers and the hourly compensa-tion of all civilian employees and (2) relative to all blue-collar workers inmanufacturing industries. (If the average industry worker is compensatedbelow the reference rate, then the compensation premium is negative.)Table 6.5b presents data on compensation premiums for ten representativeindustries and compares the three-year average for 1992–94 with the three-year average for 1999–2001. A quick glance shows a wide variation in com-pensation premiums. Autoworkers do well, with a premium second onlyto iron- and steelworkers, another industry with a strong union structure.When examining the trend in premiums, however, things are less brightfor the auto industry. Among the ten selected industries, autoworkers ex-perienced the largest fall in premiums compared with all civilian employ-ees.22 Among the ten industries, autoworkers also had the smallest gainrelative to all blue-collar manufacturing workers.
THE AUTOMOTIVE SECTOR 379
20. “Low-wage countries” are defined as those nations not in the Organization for Eco-nomic Cooperation and Development (OECD) before 1992. Six countries—the Czech Re-public, Hungary, South Korea, Mexico, Poland, and Slovakia—have acceded to the OECDsince 1992 but are still commonly considered low-wage countries.
21. Wage data are from BLS (2004), trade data from USITC’s Interactive Tariff and TradeDataweb 2004, and US shipments data from BEA (2002).
22. When weighted by the number of employees, the pay premiums of all industries (ourrepresentative ten industries plus all others) should sum to zero.
06--Ch. 6--365-394 9/16/05 11:45 AM Page 379

380
Tab
le 6
.5a
Un
ited
Sta
tes
trad
e b
alan
ces
wit
h M
exic
o a
nd
all
low
-wag
e co
un
trie
sTr
ade
bal
ance
Ch
ang
e in
tra
de
2001
tra
de
as p
erce
nt
bal
ance
as
per
cen
t o
fb
alan
ceD
om
esti
co
f d
om
esti
cd
om
esti
c sh
ipm
ents
,(m
illio
ns o
f do
llars
)sh
ipm
ents
,200
1sh
ipm
ents
,200
119
92–9
4 to
199
9–20
01
Lo
w-w
age
(mill
ions
of
Lo
w-w
age
Lo
w-w
age
SIT
C c
od
e/in
du
stry
Mex
ico
cou
ntr
ies
dolla
rs)
Mex
ico
cou
ntr
ies
Mex
ico
cou
ntr
ies
57 P
last
ics
in p
rimar
y fo
rms
2,03
95,
957
127,
823
1.60
4.66
0.83
0.87
63 C
ork
and
woo
d m
anuf
actu
res
10–2
,046
85,0
830.
01–2
.40
–0.1
4–0
.86
64 P
aper
and
pap
er p
rodu
cts
1,62
92,
668
219,
016
0.74
1.22
0.18
–0.1
765
Tex
tiles
1,81
9–2
,886
152,
704
1.19
–1.8
90.
90–0
.54
67 I
ron
and
stee
l38
0–3
,600
83,8
420.
45–4
.29
–0.3
4–3
.54
74 I
ndus
tria
l mac
hine
ry a
nd e
quip
men
t55
03,
839
348,
502
0.16
1.10
–0.1
8–1
.11
77 E
lect
rical
mac
hine
ry a
nd e
quip
men
t–1
0,87
46,
075
489,
361
–2.2
21.
24–1
.77
1.88
78 R
oad
vehi
cles
–15,
258
–21,
251
495,
591
–3.0
8–4
.29
–2.2
8–4
.65
82 F
urni
ture
–2,2
44–1
0,04
716
9,18
7–1
.33
–5.9
4–1
.06
–3.3
484
Clo
thin
g–6
,079
–52,
466
173,
544
–3.5
0–3
0.23
–2.9
7–8
.34
Sou
rces
:U
SIT
C I
nter
activ
e Ta
riff
and
Trad
e D
ataw
eb 2
005;
BE
A (
2002
).
Tab
le 6
.5b
Co
mp
ensa
tio
n p
rem
ium
s,U
nit
ed S
tate
s (d
olla
rs p
er h
our)
Ch
ang
e in
pre
miu
m,
Co
mp
ensa
tio
n p
rem
ium
,200
119
92–9
4 to
199
9–20
01
Co
mp
ensa
tio
nR
elat
ive
toR
elat
ive
toco
st p
er h
ou
r,R
elat
ive
tob
lue-
colla
rR
elat
ive
tob
lue-
colla
rS
ITC
co
de/
SIC
co
de/
ind
ust
ry20
01al
l civ
ilian
sm
anu
fact
uri
ng
all c
ivili
ans
man
ufa
ctu
rin
g
57/2
8P
last
ics
in p
rimar
y fo
rms
26.6
94.
546.
461.
152.
4063
/24
Cor
k an
d w
ood
man
ufac
ture
s 16
.13
–6.0
2–4
.10
–0.5
80.
6764
/26
Pap
er a
nd p
aper
pro
duct
s24
.38
2.23
4.15
0.68
1.93
65/2
2Te
xtile
s15
.20
–6.9
5–5
.03
–0.2
80.
9667
/331
-2Ir
on a
nd s
teel
31.1
38.
9810
.90
0.46
1.70
74/3
5In
dust
rial m
achi
nery
and
equ
ipm
ent
22.1
3–0
.02
1.90
0.36
1.60
77/3
6E
lect
rical
mac
hine
ry a
nd e
quip
men
t20
.36
–1.7
90.
130.
151.
3978
/371
Roa
d ve
hicl
es29
.84
7.69
9.61
–0.8
20.
4382
/25
Fur
nitu
re16
.50
–5.6
5–3
.73
–0.1
11.
1384
/23
Clo
thin
g12
.39
–9.7
6–7
.84
–0.6
60.
58
Not
e:C
ompe
nsat
ion
data
com
pile
d by
SIC
cod
e w
ere
linke
d to
SIT
C c
ateg
orie
s fo
r co
mpa
rison
with
tra
de d
ata.
A m
ajor
ity o
f do
mes
tic s
hipm
ents
for
any
give
nS
ITC
indu
stry
are
with
in t
he a
ssoc
iate
d S
IC c
ateg
ory.
Sou
rces
:B
LS (
2004
, 20
05).
06--Ch. 6--365-394 9/16/05 11:45 AM Page 380

THE AUTOMOTIVE SECTOR 381
Table 6.5c Regression models linking compensation premiums to trade balances, 1993–2001a
I II III IV V VI
Low-wage balance 0.148* 0.132(0.069) (0.070)
Low-wage balance, 1-year lag –0.097 –0.078(0.075) (0.074)
Mexico balance –0.206 –0.214(0.205) (0.200)
Mexico balance, 1-year lag –0.444* –0.447*(0.195) (0.195)
SITC 57/SIC 28 Plastics in primary forms 0.094 0.416 0.210 0.382 0.496* 0.595*
(0.219) (0.226) (0.245) (0.224) (0.219) (0.237)
63/24 Cork and wood manufactures –0.130 0.135 –0.030 0.092 0.178 0.250
(0.212) (0.220) (0.232) (0.215) (0.210) (0.220)
64/26 Paper and paper products 0.104 0.397 0.214 0.352 0.451* 0.533*
(0.215) (0.224) (0.238) (0.218) (0.213) (0.226)
65/22 Textiles –0.121 0.158 –0.019 0.137 0.264 0.362(0.214) (0.221) (0.235) (0.224) (0.221) (0.239)
67/331-2 Iron and steel 0.305 0.469* 0.355 0.477* 0.537* 0.602*(0.206) (0.207) (0.211) (0.212) (0.206) (0.214)
74/35 Industrial machinery and equipment 0.020 0.288 0.121 0.242 0.326 0.396
(0.212) (0.220) (0.233) (0.214) (0.209) (0.219)
77/36 Electrical machinery and equipment –0.033 0.313 0.096 0.191 0.242 0.267
(0.220) (0.231) (0.252) (0.205) (0.201) (0.202)
78/371 Road vehicles 0.124 0.279 0.193 0.207 0.259 0.267(0.202) (0.212) (0.213) (0.204) (0.200) (0.200)
82/25 Furniture 0.060 0.193 0.078 0.156 0.217 0.263(0.205) (0.212) (0.217) (0.209) (0.204) (0.208)
84/23 Clothing(reference case)
Constant 0.003 –0.292 –0.106 –0.242 –0.330* –0.405*(0.163) (0.172) (0.193) (0.161) (0.157) (0.172)
R-squared 0.136 0.105 0.148 0.098 0.142 0.154
* = significant at 5 percent level
a. The dependent variable is the change from previous year of the industry premium (in dol-lars) over mean hourly compensation for all civilian employees. The independent variablesare the change from the previous year of the industry trade balance normalized by domes-tic shipments, and industry-specific dummies.
Note: Standard errors are in parentheses.
Source: Authors’ calculations using data from BEA (2002), BLS (2004, 2005), and USITCInteractive Tariff and Trade Dataweb 2005.
06--Ch. 6--365-394 9/16/05 11:45 AM Page 381
With that overview in mind, we used a simple fixed-effects regressionmodel to detect whether a positive correlation exists between a largertrade deficit (or larger trade surplus) and a falling (or rising) compensa-tion premium for our ten representative industries.23 The analysis wasperformed using two measures of the compensation premium (civilianemployees and blue-collar workers) and with and without lags in thetrade balance. Data for this exercise, drawn from the experience of the tenSITC two-digit manufacturing industries mentioned above, consisted of90 observations of year-on-year changes in compensation premiums andyear-on-year changes in the US industry’s trade balance, with both Mex-ico and all low-wage countries. In only one trial did we find a regressionparameter that confirms the hypothesis of a positive link between tradebalances and compensation premiums.24 In table 6.5c, we present the re-sults of the “successful” trial in the first column, along with several un-successful trials.25
The results from the one “successful” trial suggest that a 1 percent shifttoward imports supplied by low-wage countries (normalized by the valueof domestic shipments) results in a 14.8-cent decline in the industry’shourly compensation premium. Between 1992 and 2001, the auto indus-try experienced a 5.98 percent shift toward imports. Hence the 14.8-centparameter suggests that auto trade with low-wage countries might ex-plain an 89-cent decline in the hourly compensation premium for au-toworkers. (The actual change in premium was an increase of 26 cents.)However, the R-squared statistic for this trial is very low, only 0.14.Roughly speaking, this indicates that the model accounts for only 14 per-cent of the variance in the data. Even in the “successful” trial, other influ-ences on compensation premiums appear to swamp the effect of tradebalances with low-wage countries as a group. Moreover, we were unableto detect support for the hypothesis when the independent variable wasconfined to the US trade balance with Mexico alone.
Foreign Direct Investment
Since the NAFTA ratification debate, no one has heard a “giant suckingsound”—in the form of capital (and associated jobs) moving from theUnited States to Mexico. Nevertheless, both Mexico and Canada have at-tracted substantial amounts of US foreign direct investment (FDI) in the
382 NAFTA REVISITED: ACHIEVEMENTS AND CHALLENGES
23. In a fixed-effects model, a distinct dummy variable for each industry is intended to cap-ture all the forces that affect the compensation premium in that industry, except the impactof separately identified independent variables—here a changing trade balance.
24. In order to confirm the hypothesis, the coefficient on the trade balance should be posi-tive and statistically significant.
25. Other unsuccessful trials, measuring the industry compensation premium relative tototal blue-collar manufacturing employees, are not reported.
06--Ch. 6--365-394 9/16/05 11:45 AM Page 382

road vehicle sector. Since the 2001–02 economic downturn, however, FDIoutflows have remained cool.
For a poor country like Mexico, whose principal development con-straint was lack of capital, foreign firms may add to Mexican capital stock,contribute to “capital deepening,” and thus raise the level of output. Thisconceptual approach, dating from the 1960s, views foreign firms primar-ily as providers of capital. More recent research, starting in the 1980s,considers the provider-of-capital model an overly narrow interpretationof the contribution of FDI to host-country development. In addition, FDIplays an important role in opening the host economy to global opportu-nities for best practice, production processes, quality control procedures,research and development, advanced marketing techniques, and im-proved access to international markets.26
Table 6.6 presents data on US domestic capital expenditure and FDI from1994 to 2003. After NAFTA entered into force, US FDI flows to both the
THE AUTOMOTIVE SECTOR 383
26. This conception of FDI arises within the concept of newer growth models, associatedwith endogenous growth theory and dynamic comparative advantage. See Grossman andHelpman (1991) and Aghion and Howitt (1998). We thank Theodore Moran for extensivewritten comments on FDI and other issues, in the context of an earlier draft.
Table 6.6 US transportation FDI outflows versus domestic plantand equipment expenditures in the motor vehiclesindustry, 1994–2003 (billions of dollars)
Rest DomesticNAFTA of the plant and
Year World Canada Mexico total world equipment
1994 5.2 2.1 1.0 3.1 2.1 18.0
1995 5.9 2.6 0.7 3.3 2.6 16.0
1996 0.7 –0.6 –0.2 –0.8 1.5 17.9
1997 4.7 2.0 0.1 2.2 2.5 18.3
1998 –1.4 –2.2 1.3 –0.9 –0.5 27.5
1999 4.5 0.2 1.4 1.6 2.9 24.9
2000 7.8 4.5 1.1 5.5 2.3 29.8
2001 1.9 2.1 –1.0 1.1 0.7 24.2
2002 2.5 2.1 0.6 2.7 –0.3 23.6
2003 1.5 0.6 — 0.6 0.9 24.2a
Total 33.3 13.4 5.0 18.4 14.9 224.4
— = Information suppressed to avoid disclosure of data of individual companies.FDI = foreign direct investment
a. Estimated from total nonresidential domestic investment.
Note: FDI data are for all manufactured transportation equipment. Domestic data are totalcapital expenditure on structures and equipment for motor vehicles industry, defined as SIC371 from 1994 to 1998 and NAICS 3361, 3362, 3363 from 1999 to 2001.
Sources: BEA (2005a), US Census Bureau (2004).
06--Ch. 6--365-394 9/16/05 11:45 AM Page 383

Canadian and the Mexican transportation industries accelerated rapidly, iferratically. In the wake of NAFTA, more than half of all US foreign invest-ment in the transportation sector has been directed to NAFTA partners. In2003, the stock of US FDI in the Canadian transportation industry, mea-sured on a historical cost basis, reached $17.9 billion. The stock of US FDIin the Mexican transportation industry reached $4 billion in 2002.27
While FDI is significant, the scale of US auto investment in Canada andMexico pales in comparison with domestic spending. Between 1994 and2003, the US transportation industry invested $224 billion domestically,compared with $18 billion in other NAFTA countries. In 2003, domesticfixed assets in the motor vehicles, bodies, trailers, and parts manufactur-ing industry on a historical-cost basis were estimated at $88 billion. This isalmost twice the $45 billion stock of all US transport-sector FDI in the restof the world (including NAFTA) in the same year.28 Moreover, domesticassets are roughly four times the US transport manufacturing sector FDIstock in Mexico and Canada combined (around $22 billion in 2002–03).
Table 6.7 presents recent FDI inflows to the United States and Mexicodisaggregated by source country. The European Union and Japan con-tribute almost all inward FDI in the United States. Recent flows make upa significant portion of the total inward FDI position of $64 billion on ahistorical-cost basis. While Mexico does not report the inward stock ofFDI in its auto sector, the United States does report the historical cost ofits outward transport manufacturing FDI stock in Mexico as $4 billion (in2002). In Mexico, over half of the incoming auto FDI comes from NAFTAsources. Not surprisingly, the bulk of non-NAFTA FDI flows come fromthe European Union and Japan. FDI flows from these sources are likely to
384 NAFTA REVISITED: ACHIEVEMENTS AND CHALLENGES
27. Data are from BEA (2005a). The Mexican position at year-end 2003 was suppressed toavoid disclosures of individual companies.
28. Figures are from BEA (2005c, Table 3.3ES) and BEA (2005a). Note that the FDI figureincludes transport-sector manufacturing beyond motor vehicles.
Table 6.7 Inward FDI in the automotive sector,1999–2003 (billions of dollars)
Country/region Mexico United Statesa
From:United States 3.69 —
Canada 0.79 0.66
European Union 1.24 14.10
Japan 1.66 12.16
All others –0.01 –0.34
Total 7.37 26.59
a. US inward FDI flows for all transportation equipment.
Sources: BEA (2005b), Secretaría de Economía (2005).
06--Ch. 6--365-394 9/16/05 11:45 AM Page 384

increase, as Toyota and Volkswagen are planning to open new assemblylines in Mexico by the end of 2005. Currently, assembly plants account for36 percent of Mexico’s inward FDI in the automobile industry.
Trade
Trade is the most common indicator of economic integration. Among NorthAmerican countries, trade has increased substantially since NAFTA, bothfor the motor vehicles and parts industry and for merchandise as a whole.But aggregate trade figures can obscure more complex trade relationships.In this section, we look at both the overall value of auto trade and intrain-dustry auto trade.
Overall Value
Appendix table 6A.1 summarizes the value of trade in the vehicles andparts industry and merchandise as a whole in 1993 and 2002 for Canada,Mexico, and the United States. In 1993, vehicles and parts made up 22 per-cent of Canadian total merchandise trade. In 2002, when the figure was 20percent of total trade and the value had reached nearly $100 billion,Canada’s trade surplus in the auto sector was $12 billion. Canadian autotrade is heavily concentrated in North America (91 percent of the sectortotal), almost all of which is with the United States. Between 1993 and2002, Canadian vehicles and parts trade with NAFTA countries increased60 percent, with slightly faster growth for imports (64 percent) than ex-ports (58 percent).
The pattern of US auto trade was similar in the post-NAFTA period.Half of US auto trade was with Canada and Mexico in 1993, when autotrade with NAFTA partners totaled $65 billion. The United States then hada $14 billion auto trade deficit with its NAFTA partners. By 2002, all ofthese numbers had expanded: Auto trade with NAFTA partners nearlydoubled to $123 billion, while the US trade deficit in vehicles and partswith NAFTA partners more than doubled to $34 billion. Mexico accountedfor the fastest growth (total auto trade with Mexico grew 243 percent), butUS auto trade with Canada also increased sharply, up 58 percent. By 2002,Canada accounted for $86 billion of two-way US auto trade, while Mexicoaccounted for $37 billion. The US trade deficit in the auto sector reflectsnot only the comparative advantage of other producers but also the strongUS dollar that prevailed through 2002. Only since February 2002 has thedollar declined against other “major currencies” on a trade-weighted basis;as of March 2005, it was 28 percent below its peak (Federal Reserve Bankof St. Louis 2005).
The United States accounts for 80 percent of Mexico’s total trade in au-tomobiles. Between 1993 and 2003, Mexican auto trade with the UnitedStates increased fivefold (from a low base). The auto sector now accounts
THE AUTOMOTIVE SECTOR 385
06--Ch. 6--365-394 9/16/05 11:45 AM Page 385

for 13 percent of Mexico’s total trade and 16 percent of its exports. Still,Mexican automotive exports to the United States are only half as large asshipments from Canada. Mexico’s two-way trade with NAFTA partnersin the vehicles and parts sector is only 40 percent that of Canadian trade.
At the same time, the US auto trade deficit also expanded; the deficitwith NAFTA countries grew 135 percent (in nominal dollar terms) be-tween 1993 and 2003, while the US deficit with the world as a whole grew155 percent. Although much of the deficit increase is due to the highervolume of trade, the balance of US auto and parts trade has also shiftedtoward imports. In 1993, the value of US exports in autos and parts to theworld was equivalent to 48 percent of its world auto and parts imports.By 2003, the ratio had declined to 36 percent. The gap with NAFTA coun-tries is narrower, and its growth has been less steep. NAFTA auto exportvalue amounted to 65 percent of auto import value in 1993, declining to58 percent in 2003.
Intraindustry Trade
Is the auto industry atypical in the sense that there is far more two-waytrade within the auto sector compared with other industries? To deter-mine the answer to this question, we calculated a familiar intraindustrytrade index (ITI), defined as follows:
In this formula, X and M stand for exports and imports, respectively, thesubscript i indexes the country or region with which the United States istrading, and the subscript j indexes the product that is being traded. If theUnited States were to export $3 billion of product j to country i and notimport any product j from country i—a situation that illustrates extremespecialization—then the index would equal zero. The same would be trueif the United States only imported product j from country i and did notexport any of product j to country i. By contrast, when US trade in a prod-uct with a country is balanced—i.e., if exports equal imports—then the ITIwould equal 1.
Table 6.8 shows ITIs for road vehicles trade between the United Statesand several partners: Brazil, Germany, Japan, the United Kingdom,Canada, and Mexico. Between 1992 and 2004, the ITI declined for allcountries except Canada. Canada’s ITI remains over .75, showing thattrade is largely two-way. Mexico’s ITI has declined sharply from .87 to .58but remains higher than all other partners besides Brazil, whose totaltrade volume is extremely small.
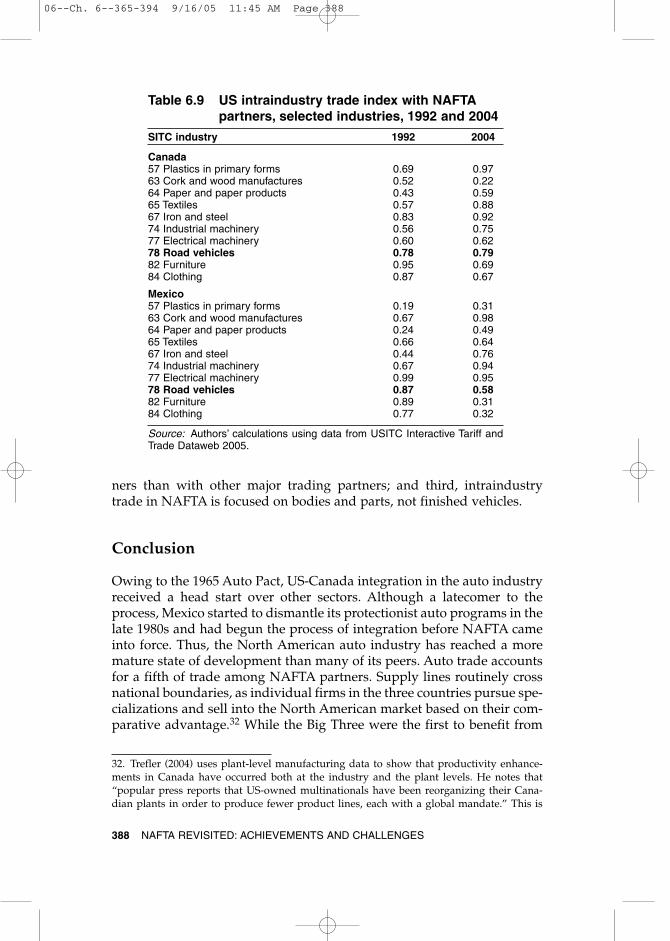
How does NAFTA intraindustry trade in autos compare with otherbroad industries? Table 6.9 presents the ITIs for the same ten manufactur-
ITIij
ij ij
ij ij
X M
X M= −
−
+
⎡
⎣⎢⎢
⎤
⎦⎥⎥
1| |
386 NAFTA REVISITED: ACHIEVEMENTS AND CHALLENGES
06--Ch. 6--365-394 9/16/05 11:45 AM Page 386
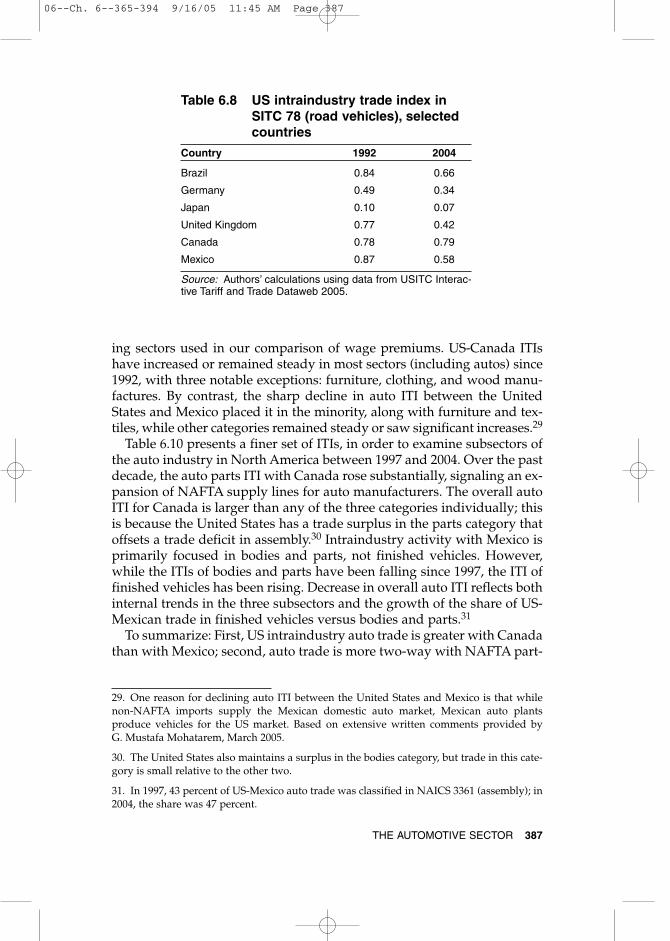
ing sectors used in our comparison of wage premiums. US-Canada ITIshave increased or remained steady in most sectors (including autos) since1992, with three notable exceptions: furniture, clothing, and wood manu-factures. By contrast, the sharp decline in auto ITI between the UnitedStates and Mexico placed it in the minority, along with furniture and tex-tiles, while other categories remained steady or saw significant increases.29
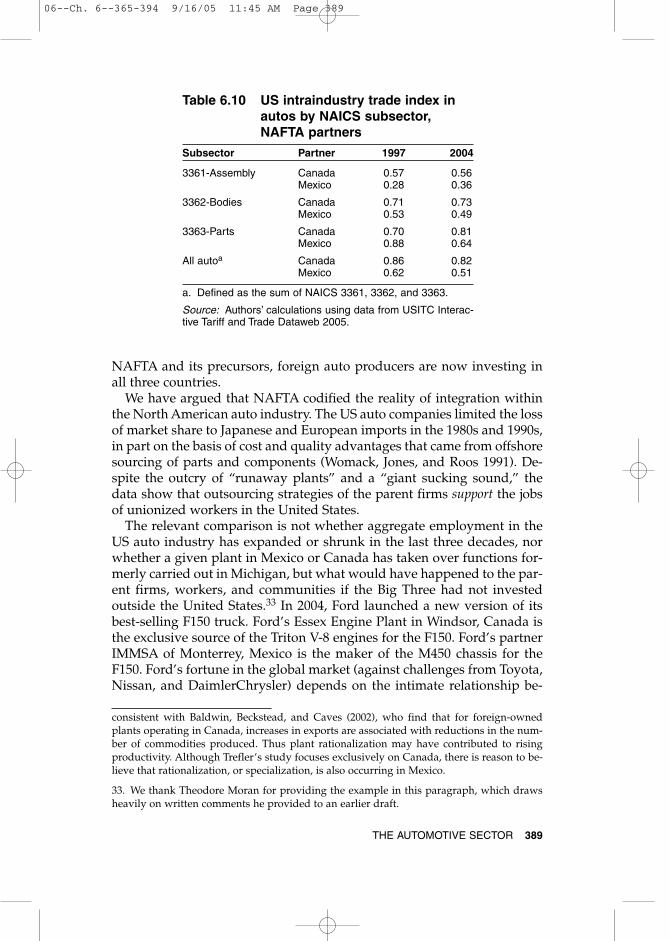
Table 6.10 presents a finer set of ITIs, in order to examine subsectors ofthe auto industry in North America between 1997 and 2004. Over the pastdecade, the auto parts ITI with Canada rose substantially, signaling an ex-pansion of NAFTA supply lines for auto manufacturers. The overall autoITI for Canada is larger than any of the three categories individually; thisis because the United States has a trade surplus in the parts category thatoffsets a trade deficit in assembly.30 Intraindustry activity with Mexico isprimarily focused in bodies and parts, not finished vehicles. However,while the ITIs of bodies and parts have been falling since 1997, the ITI offinished vehicles has been rising. Decrease in overall auto ITI reflects bothinternal trends in the three subsectors and the growth of the share of US-Mexican trade in finished vehicles versus bodies and parts.31
To summarize: First, US intraindustry auto trade is greater with Canadathan with Mexico; second, auto trade is more two-way with NAFTA part-
THE AUTOMOTIVE SECTOR 387
Table 6.8 US intraindustry trade index inSITC 78 (road vehicles), selectedcountries
Country 1992 2004
Brazil 0.84 0.66
Germany 0.49 0.34
Japan 0.10 0.07
United Kingdom 0.77 0.42
Canada 0.78 0.79
Mexico 0.87 0.58
Source: Authors’ calculations using data from USITC Interac-tive Tariff and Trade Dataweb 2005.
29. One reason for declining auto ITI between the United States and Mexico is that whilenon-NAFTA imports supply the Mexican domestic auto market, Mexican auto plantsproduce vehicles for the US market. Based on extensive written comments provided by G. Mustafa Mohatarem, March 2005.
30. The United States also maintains a surplus in the bodies category, but trade in this cate-gory is small relative to the other two.
31. In 1997, 43 percent of US-Mexico auto trade was classified in NAICS 3361 (assembly); in2004, the share was 47 percent.
06--Ch. 6--365-394 9/16/05 11:45 AM Page 387
ners than with other major trading partners; and third, intraindustrytrade in NAFTA is focused on bodies and parts, not finished vehicles.
Conclusion
Owing to the 1965 Auto Pact, US-Canada integration in the auto industryreceived a head start over other sectors. Although a latecomer to theprocess, Mexico started to dismantle its protectionist auto programs in thelate 1980s and had begun the process of integration before NAFTA cameinto force. Thus, the North American auto industry has reached a moremature state of development than many of its peers. Auto trade accountsfor a fifth of trade among NAFTA partners. Supply lines routinely crossnational boundaries, as individual firms in the three countries pursue spe-cializations and sell into the North American market based on their com-parative advantage.32 While the Big Three were the first to benefit from
388 NAFTA REVISITED: ACHIEVEMENTS AND CHALLENGES
32. Trefler (2004) uses plant-level manufacturing data to show that productivity enhance-ments in Canada have occurred both at the industry and the plant levels. He notes that“popular press reports that US-owned multinationals have been reorganizing their Cana-dian plants in order to produce fewer product lines, each with a global mandate.” This is
Table 6.9 US intraindustry trade index with NAFTApartners, selected industries, 1992 and 2004
SITC industry 1992 2004
Canada57 Plastics in primary forms 0.69 0.9763 Cork and wood manufactures 0.52 0.2264 Paper and paper products 0.43 0.5965 Textiles 0.57 0.8867 Iron and steel 0.83 0.9274 Industrial machinery 0.56 0.7577 Electrical machinery 0.60 0.6278 Road vehicles 0.78 0.7982 Furniture 0.95 0.6984 Clothing 0.87 0.67
Mexico57 Plastics in primary forms 0.19 0.3163 Cork and wood manufactures 0.67 0.9864 Paper and paper products 0.24 0.4965 Textiles 0.66 0.6467 Iron and steel 0.44 0.7674 Industrial machinery 0.67 0.9477 Electrical machinery 0.99 0.9578 Road vehicles 0.87 0.5882 Furniture 0.89 0.3184 Clothing 0.77 0.32
Source: Authors’ calculations using data from USITC Interactive Tariff andTrade Dataweb 2005.
06--Ch. 6--365-394 9/16/05 11:45 AM Page 388
NAFTA and its precursors, foreign auto producers are now investing inall three countries.
We have argued that NAFTA codified the reality of integration withinthe North American auto industry. The US auto companies limited the lossof market share to Japanese and European imports in the 1980s and 1990s,in part on the basis of cost and quality advantages that came from offshoresourcing of parts and components (Womack, Jones, and Roos 1991). De-spite the outcry of “runaway plants” and a “giant sucking sound,” thedata show that outsourcing strategies of the parent firms support the jobsof unionized workers in the United States.
The relevant comparison is not whether aggregate employment in theUS auto industry has expanded or shrunk in the last three decades, norwhether a given plant in Mexico or Canada has taken over functions for-merly carried out in Michigan, but what would have happened to the par-ent firms, workers, and communities if the Big Three had not investedoutside the United States.33 In 2004, Ford launched a new version of itsbest-selling F150 truck. Ford’s Essex Engine Plant in Windsor, Canada isthe exclusive source of the Triton V-8 engines for the F150. Ford’s partnerIMMSA of Monterrey, Mexico is the maker of the M450 chassis for theF150. Ford’s fortune in the global market (against challenges from Toyota,Nissan, and DaimlerChrysler) depends on the intimate relationship be-
THE AUTOMOTIVE SECTOR 389
consistent with Baldwin, Beckstead, and Caves (2002), who find that for foreign-ownedplants operating in Canada, increases in exports are associated with reductions in the num-ber of commodities produced. Thus plant rationalization may have contributed to risingproductivity. Although Trefler’s study focuses exclusively on Canada, there is reason to be-lieve that rationalization, or specialization, is also occurring in Mexico.
33. We thank Theodore Moran for providing the example in this paragraph, which drawsheavily on written comments he provided to an earlier draft.
Table 6.10 US intraindustry trade index inautos by NAICS subsector,NAFTA partners
Subsector Partner 1997 2004
3361-Assembly Canada 0.57 0.56Mexico 0.28 0.36
3362-Bodies Canada 0.71 0.73Mexico 0.53 0.49
3363-Parts Canada 0.70 0.81Mexico 0.88 0.64
All autoa Canada 0.86 0.82Mexico 0.62 0.51
a. Defined as the sum of NAICS 3361, 3362, and 3363.
Source: Authors’ calculations using data from USITC Interac-tive Tariff and Trade Dataweb 2005.
06--Ch. 6--365-394 9/16/05 11:45 AM Page 389
tween the Ford assembly workers in Michigan, IMMSA in Mexico, andFord’s Essex plant in Canada. Despite the UAW’s opposition to NAFTA,the fate of Ford workers depends on trade-and-investment relationshipsthat are enhanced by the agreement.
Ten years after NAFTA, the development that attracts most attention issecurity. The growth of cross-border supply lines in the industry has pro-moted efficiency; however, new security concerns have put these lines atrisk. The costs of the “security tax” cannot be measured simply by borderdelays and increased paperwork. They also include the risk of a pro-longed shutdown of border trade in the aftermath of an actual terrorist at-tack or a highly specific threat. This risk, if perceived to be high, will cer-tainly chill investment in Mexico and Canada. Thus far, increased bordersecurity has not adversely affected the auto industry. The industry has astrong interest in the implementation of border security measures that arepredictable, efficient, and most important, effective. Moreover, big firmsare able to build security into their operations. But who can accuratelyforetell the public reaction to a terror event within the United Stateswhose perpetrators were found to use the Canadian or Mexican border asa point of entry? Assuming the NAFTA partners can keep themselves freeof terrorism, the auto industry provides a look ahead for other NorthAmerican industries. Dire forecasts as to the consequences of free tradefor US workers have not been borne out in the auto industry. In termsboth of compensation and overall employment, the Mexican bogeymanappears more phantasm than reality. Worker fortunes are tied morestrongly to productivity developments and growth in North Americandemand than to the pace of industrial integration. “Capital flight” withinthe auto industry has scarcely slowed domestic investment within theUnited States. Instead, trade has allowed firms in each country to special-ize in the areas of the auto industry where they are most efficient—to thebenefit of all three countries. While North America is somewhat less self-sufficient in the auto sector today than a decade ago, it seems likely thatin the absence of NAFTA far more auto jobs would have been lost to Asianand European competitors.
References
Aghion, Philippe, and Peter Howitt. 1998. Endogenous Growth Theory. Cambridge, MA: MITPress.
Baldwin, John R., Desmond Beckstead, and Richard Caves. 2002. Changes in the Diversifica-tion of Canadian Manufacturing Firms (1973-1997): A Move to Specialization. StatisticsCanada Analytical Studies Branch Research Paper Series 179 (February). Ottawa: Sta-tistics Canada.
BEA (Bureau of Economic Analysis). 2002. Shipments of Manufacturing Industries,1977–2001. Washington: US Department of Commerce. www.bea.gov/bea/dn2/gpo.htm (accessed on January 27, 2004).
390 NAFTA REVISITED: ACHIEVEMENTS AND CHALLENGES
06--Ch. 6--365-394 9/16/05 11:45 AM Page 390
BEA (Bureau of Economic Analysis). 2005a. U.S. Direct Investment Abroad: Balance of Pay-ments and Direct Investment Position Data. Washington: US Department of Commerce.www.bea.gov/bea/di/di1usdbal.htm (accessed on April 29, 2005).
BEA (Bureau of Economic Analysis). 2005b. Foreign Direct Investment in the United States:Balance of Payments and Direct Investment Position Data. Washington: US Departmentof Commerce. www.bea.gov/bea/di/di1fdibal.htm (accessed on May 2, 2005).
BEA (Bureau of Economic Analysis). 2005c. Fixed Asset Tables. Washington: US Departmentof Commerce. www.bea.gov/bea/dn/FA2004/SelectTable.asp (accessed on April 29,2005).
BLS (Bureau of Labor Statistics). 2004. Hourly Compensation Costs for Production Workersin Manufacturing, 30 Countries or Areas, 40 Manufacturing Industries, Selected Years1975–2002. Washington: US Department of Labor. www.bls.gov/fls/flshcind.htm (ac-cessed on March 15, 2005).
BLS (Bureau of Labor Statistics). 2005. Current Employment Survey. Washington: US De-partment of Labor. www.bls.gov/ces/home.htm (accessed on March 15, 2005).
Cooney, Stephen, and Brent D. Yacobucci. 2005. US Automotive Industry: Policy Overview andRecent History. Washington: Congressional Research Service (April 25).
Federal Reserve Bank of St. Louis. 2005. FRED II—Trade Weighted Exchange Index: MajorCurrencies. St. Louis, MO. http://research.stlouisfed.org/fred2/series/twexmmth/13(accessed on January 15, 2004).
Grossman, Gene M., and Elhanan Helpman. 1991. Innovation and Growth in the Global Econ-omy. Cambridge, MA: MIT Press.
INEGI (Instituto Nacional de Estadística Geografía e Informática). 2005. Banco de Infor-mación Económica. http://dgcnesyp.inegi.gob.mx/bdine/bancos.htm (accessed onMarch 23, 2005).
Moran, Theodore H. 1998. Foreign Direct Investment and Development: The New Policy Agendafor Developing Countries and Economies in Transition. Washington: Institute for Interna-tional Economics (November).
Nunez, Perez. 1990. The Automotive Industry. In Foreign Direct Investment and Industrial De-velopment in Mexico. Paris: Organization for Economic Cooperation and Development.
Samuels, Barbara. 1990. Managing Risk in Developing Countries. Princeton, NJ: Princeton Uni-versity Press.
Secretaría de Economía. 2005. Comportamiento de la Inversión Extranjera Directa en Mex-ico. www.economia.gob.mx/?P=1164 (accessed on March 23, 2005).
Trefler, Daniel. 2004. The Long and Short of the Canada-US Free Trade Agreement. AmericanEconomic Review 94, no. 4 (September): 870–95.
US Census Bureau. 2003. Statistics for Industry Groups and Industries. 2001 Annual Surveyof Manufacturers. Washington. www.census.gov/prod/2003pubs/m01as-1.pdf (ac-cessed on January 27, 2004).
US Census Bureau. 2004. Annual Capital Expenditure Surveys. Washington. www.census.gov/csd/ace/ace-pdf.html (accessed on January 30, 2004).
US Census Bureau. 2005. 2002 Economic Census. Washington. www.census.gov/econ/census02/data/us/US000.HTM (accessed on April 29, 2005).
Ward’s Communications. 2004. Ward’s Motor Vehicle Data 2004. Southfield, MI: Ward’s Com-munications.
Womack, James P., Daniel T. Jones, and Daniel Roos. 1991. The Machine That Changed theWorld: The Story of Lean Production. New York: HarperPerennial.
Wonnacott, Paul. 1965. Canadian Automotive Protection: Content Provisions, the BladenPlan, and Recent Tariff Changes. The Canadian Journal of Economics and Political Science31, no. 1 (February): 98–116.
THE AUTOMOTIVE SECTOR 391
06--Ch. 6--365-394 9/16/05 11:45 AM Page 391

392 NAFTA REVISITED: ACHIEVEMENTS AND CHALLENGES
Table 6A.1 Trade in road vehicles and parts, 1993 and 2003 (billions of dollars)Trade
Imports Exports Total trade balance
Percent Percent PercentPartner/sector 1993 2003 growth 1993 2003 growth 1993 2003 growth 1993 2003
CanadaWith world
All merchandise 131 240 83 145 272 88 276 512 85 13 32Vehicles and parts 25 45 80 35 55 56 60 100 66 10 9
Auto share (percent) 19 19 24 20 22 19
With MexicoAll merchandise 3 9 213 1 2 150 3 10 201 –2 –7Vehicles and parts 1 2 110 0 0 135 1 3 112 –1 –2
Auto share (percent) 41 28 15 14 36 26
With United StatesAll merchandise 88 145 65 117 233 100 205 379 85 29 88Vehicles and parts 20 34 71 34 53 57 54 87 63 14 18
Auto share (percent) 23 24 29 23 26 23
With NAFTAAll merchandise 91 154 70 117 235 100 208 389 87 27 81Vehicles and parts 21 37 74 34 53 57 55 90 64 12 16
Auto share (percent) 23 24 29 23 26 23
With non-NAFTAAll merchandise 41 86 111 27 37 36 68 123 81 –13 –49Vehicles and parts 4 8 114 1 1 24 5 10 93 –3 –7
Auto share (percent) 9 10 4 4 7 8
NAFTA’s share of total trade(percent) 69 64 81 86 75 76
NAFTA’s share of autotrade (percent) 85 82 97 97 92 90
MexicoWith world
All merchandise 65 171 162 52 165 219 117 337 187 –13 –6Vehicles and parts 2 17 816 7 27 285 9 44 396 5 10
Auto share (percent) 3 10 14 16 8 13
With United StatesAll merchandise 48 106 120 43 147 242 91 253 177 –5 41Vehicles and parts 1 10 665 6 25 330 7 35 393 4 15
Auto share (percent) 3 10 13 17 8 14
With CanadaAll merchandise 1 4 317 2 3 81 3 7 173 1 –1Vehicles and parts 0 1 8,850 1 1 57 1 2 182 1 0
Auto share (percent) 1 26 53 46 33 34
With NAFTAAll merchandise 49 110 123 44 150 237 94 260 177 –5 40Vehicles and parts 1 11 738 7 26 296 8 37 371 5 15
Auto share (percent) 3 10 15 17 8 14
With non-NAFTAAll merchandise 16 61 283 7 16 110 23 77 228 –9 –46Vehicles and parts 1 6 1,015 0 1 138 1 7 597 0 –5
Auto share (percent) 3 10 7 7 4 9
NAFTA’s share of total trade(percent) 76 64 86 91 80 77
NAFTA’s share of autotrade (percent) 72 66 93 96 89 84
(table continues next page)
Appendix 6A
06--Ch. 6--365-394 9/16/05 11:45 AM Page 392

THE AUTOMOTIVE SECTOR 393
United StatesWith world
All merchandise 603 1,305 116 465 724 56 1,068 2,029 90 –138 –581Vehicles and parts 85 175 106 41 63 53 127 239 89 –44 –112
Auto share (percent) 14 13 9 9 12 12
With CanadaAll merchandise 114 228 100 100 169 69 214 397 86 –13 –58Vehicles and parts 33 53 57 21 35 71 54 88 62 –13 –17
Auto share (percent) 29 23 21 21 25 22
With MexicoAll merchandise 41 140 243 42 97 134 82 237 188 1 –42Vehicles and parts 6 26 310 5 10 108 11 35 224 –2 –16
Auto share (percent) 15 18 11 10 13 15
With NAFTAAll merchandise 154 367 138 142 267 88 296 634 114 –13 –100Vehicles and parts 40 78 97 25 45 77 65 123 89 –14 –33
Auto share (percent) 26 21 18 17 22 19
With non-NAFTAAll merchandise 449 938 109 323 457 41 772 1,394 81 –126 –481Vehicles and parts 46 97 113 16 18 15 61 115 88 –30 –79
Auto share (percent) 10 10 5 4 8 8
NAFTA’s share of total trade(percent) 26 28 31 37 28 31
NAFTA’s share of autotrade (percent) 47 45 62 71 51 52
North AmericaWith world
All merchandise 800 1,716 115 661 1,161 76 1,461 2,877 97 –138 –555Vehicles and parts 112 238 112 83 145 74 195 383 96 –29 –93
Auto share (percent) 14 14 13 12 13 13
With NAFTAAll merchandise 147 316 115 152 326 115 299 642 115Vehicles and parts 31 63 103 33 62 89 64 125 96
Auto share (percent) 21 20 22 19 21 20
With non-NAFTAAll merchandise 653 1,400 115 509 835 64 1,162 2,235 92 –143 –565Vehicles and parts 81 174 115 50 83 65 131 257 96 –31 –92
Auto share (percent) 12 12 10 10 11 12
NAFTA’s share of total trade(percent) 18 18 23 28 20 22
NAFTA’s share of autotrade (percent) 28 27 40 43 33 33
Notes: Trade in SITC 78 (Road Vehicles) includes vehicles and parts. For world and intra-NAFTA trade, a good tradedbetween NAFTA countries is counted twice, once as an import and once as an export. Sums may not add up due torounding.
Source: Compiled by authors from country data from UN Comtrade database, 2005, http://unstats.un.org/unsd/comtrade(accessed on May 2, 2005).
Table 6A.1 (continued)Trade
Imports Exports Total trade balance
Percent Percent PercentPartner/sector 1993 2003 growth 1993 2003 growth 1993 2003 growth 1993 2003
06--Ch. 6--365-394 9/16/05 11:45 AM Page 393

06--Ch. 6--365-394 9/16/05 11:45 AM Page 394