the atlantic hurricane season of 1969
TRANSCRIPT

April 1970 293 UDC 551.515.23:651.606.1(261) (76)“1969”
THE ATLANTIC HURRICANE SEASON OF 1969
R. H. SIMPSON, ARNOLD L. SUGG, and STAFF
National Hurricane Center, Weather Bureau, ESSA, Miami, Fla.
ABSTRACT
The 1969 hurricane season in the North Atlantic area, considered in its entirety, and synoptic and statistical aspects of individual storms are discussed.
1. GENERAL SUMMARY
For the first time since Atlantic hurricanes f i s t were given girls’ names, the tropical cyclone activity in 1969 used names through the letter M-Martha. Of the 13 tropical storms that received names (fig. l), 10 reached full hurricane intensity, and one-Camille-became the most destructive, if not the most intense, in the history of Atlantic hurricanes.
The 1969 season will long remain unique, not only because of the disaster which it brought to the Mississippi, Louisiana, and the Middle Atlantic States, but also be- cause of peculiar records set by a number of other storms. For example, Martha, the last sLorm of the season, is the first of record ever to move inland on the north coast of the Republic of Panama. Inga, the ninth storm of the season, was the longest lived Atlantic hurricane of record, and Laurie was the first hurricane to enter the Gulf of Mexico and die without bringing at least gale-force winds to any coastline. While Francelia crossed Swan Island, an eye sounding was obtained, the fifth of its kind of record. Rarely has a season produced as many looping hurricane paths, and Kara is the first to have crossed its own path three times. During 1969, the largest number of hurricane advisories ever prepared in one season were issued by the ESSA Weather Bureau, and more hours of aircraft re- connaissance flight were consumed in tracking hurricanes than ever before. Last, but not least, 1969 was a landmark year for hurricanes because of the successful seeding of hurricane Debbie on August 18 and 20, in which the de- structive forces of the storm were reduced by more than 50 percent on the first day and more than 30 percent on the second day.
The large number of tropical storms and hurricanes in 1969 developed from approximately the same number of disturbances as were observed in 1968, which produced only three tropical storms and four hurricanes. (See Simpson et al. 1969 and Frank 1970 for the summaries of the last two seasons.) I n 1968, many of the disturbances that emanated from Africa and the eastern Atlantic crossed Central America, after failing to develop into Atlantic tropical cyclones, and contributed to the large number of hurricanes-19 in dl-in the eastern Pacific that year. In 1969, only 10 tropical storms and hurricanes formed in the
(3. B. Clark, N. L. Frank, J. R. Hope, P. J. Hebert, R. H. Kraft, and J. M. PelissieI
eastern Pacific, while conditions apparently remained more favorable for tropical cyclogenesis in the Atlantic. Re- garding the interaction between the temperate or mid- latitude and tropical circulations, the hurricane season of 1969 found the flow patterns of midlatitudes more zonal, and subtropical ridges more persistent and nearer normal in pressure than in 1968. Also, easterlies were persistently deeper than in the hurricane season of 1968.
Monthly 700-mb height anomaly patterns during the 1969 season related well to both seasonal activity and geographical vulnerability of affected areas as suggested by Ballenzweig’s work (1957, 1958). The strong deterrent to tropical storm formation of westerlies that were farther south than normal in the mid-Atlantic during 1968 was replaced in 1969 by a slightly stronger than normal ridge in that area at midtropospheric levels. While these com- posite anomaly charts are useful in postanalysis of overall seasonal activity, they tend to smooth out short-wave features important in individual storm development. Hebert (1969) in an operational experiment during the 1969 season found that 700-mb 5-day prognostic mean charts (and height anomaly patterns derived therefrom) had real forecast value in assessing the potential for tropi- cal storm formation f r o m a preexisting disturbance. Even here, however, the smoothing and exact 5-day period used appeared rather critical in the phase relationship of short- wave troughs in the westerlies and westward-moving disturbances in the Tropics or subtropics. The high-level mid-Atlantic trough appears to control the intensity of tropical cyclones, rather than have an effect upon their formation.
The upper troposphere Atlantic shearline, which extends southwestward into the Caribbean Sea, remained well developed and persistent throughout most of the hurricane season. Experience has shown that this .semipermanent feature during the summer serves as a double-edged sword influencing the development potential of disturbances and tropical cyclones. As a system approaches the wind-speed maximum in the upper troposphere south of the shearline, the vorticity advection enhances the mass outflow from the disturbance. Beyond this wind maximum and across the shearline to the wind-speed maximum on the opposite side of the line, the vorticity advection in the upper tropo- sphere inhibits the divergent outflow of the disturbance or cyclone. This well-developed circulation feature may
Unauthenticated | Downloaded 10/21/21 11:27 AM UTC

294 MONTHLY WEATHER REVIEW vel. 98, No. 4
Unauthenticated | Downloaded 10/21/21 11:27 AM UTC

April 1970 R. H. Simpson, Arnold L. Sugg, and Staff 295
FIGURE 2.-Comparative eye soundings.
have influenced the development of a number of disturb- ances, while accounting also for the dissipation or sharp loss of intensity of some hurricanes over warm tropical waters, such as Holly which died as it passed across the Lesser Antilles into the eastern Caribbean Sea. Schematic diagrams depicting the effects of the shearline have been presented by Simpson (1969).
I t is a rare occasion when a rawinsonde station has the opportunity to release a sounding balloon in the eye of a hurricane. This was accomplished at Swan Island as Francelia, then a young hurricane with a 992-mb ‘central pressure, reached that island. Francelia was in the process of deepening to an intense hurricane. Figure 2 compares the eye sounding for this storm with the eye sounding for Arlene of August 1963, whose central pressure at Bermuda where the eye sounding was obtained was 974.5 mb, with the Tampa eye sounding of October 1944, where the cen- tral pressure was 966.8 mb, and with the dropsonde sounding in the eye of typhoon Marge near Guam in 1951. (See Simpson 1952.) The latter is an example of a very deep tropical cyclone with a central pressure at 895 mb. At Swan Island, there was little evidence of subsidence in the eye with moisture near saturation to 500 mb. Wind speeds indicate that above this level the balloon was entrained into the edge of the eye wall.
Hurricane Camille is of broader interest than will be
implied from the simple recital of its meteorological history. It not only ranks as the most destructive of all hurricanes, exceeding the $1.4 billion damage attributed to hurricane Betsy in 1965, but also has been termed the most important Atlantic hurricane of record from a meteorological point of view. As Camille crossed the coastline of the Gulf of Mexico, it created the highest storm tides of record, 24.6 f t , with some evidences that water levels may have been a few feet higher in locations where.reliable water marks no longer were available when survey teams arrived in the area. The storm surge and the pressure profiles (Boothville and Pilottown pressure plots adjusted relative to distance from the storm center) of Camille are drawn in figure 3. The lateral extent of devas- tating high water of this great hurricane was less than the mean described by Sugg (1969) because the diameter of destructive winds in Camille was relatively small. No measurement could be obtained of the maximum winds at the coastline as the storm passed inland because no record- ing anemometer equipment survived. In the judgment of some structural engineers who have investigated in detail the character of damage from the great hurricanes of the past two decades, structural damage due to wind exceeded that of any other storm investigated.
The ESSA Coast and Geodetic Survey recently com- pleted extensive aerial mapping of the Alabama and Mississippi coasts. Some of their conclusions were 1) Pelican Island, a mile-long uninhabited island off Mobile Bay was destroyed and has not reappeared, 2) the east end of Petit Bois Island, off the Mississippi cohst, was destroyed but portions have reemerged, 3) Honi Island, south of Pascagoula, was heavily damaged but has been building up again, and 4) 7-mi-long Ship Island, south of Biloxi Bay, has become three separate islands.
The minimum pressure in Camille was 905 mb,3 the lowest of record measured by a hurricane reconnaissance aircraft in the Atlantic and the lowest for an Atlantic hurricane except for the Florida Keys storm of Labor Day, 1935. (See table 1.) One of three central pressures report- ed in the Keys storm was 26.35 in. (892 mb) ; however, the Labor Day storm of 1935 was of exceedingly small diameter-hurricane-force winds were experienced over a diameter of less than 35 mi.
Camille, as though not satisfied with the destruction it had wrought on the Gulf Coast, dropped torrential rains of 12 to 20 in., with at least one unofficial report of 31 in., most of it in 3 to 5 hr in the Virginias, creating a record flood with further devastation and loss of life. Notwith-
2 At the request of the Director, NHC, Mr. Herbert S. Saffir, Consulting Engineer, Coral Gables, Fla., in his written report prepared after his surveys, states: “1) I can State categorically that hurricane Camille caused more extensive structural and building dam- age than any hurricane I have observed or studied (based upon data since 1x7). 2) It is obvious that both wind and tidal storm surge caused structural and building damage. 3) Details of construction for buildings in the area were not always adequate. The U-block type concrete tie beam used on some construction in the area is inadequate for lateral loads or stress reversal. 4) Roofing damage caused by high velocity winds was extensive, even some distance from the Gulf areas and the areas of storm tidal surge.”
3 Preliminary reports and other publications indicated a lowest pressure of 901 mb. Recently, a check of the raw data indicates this should be corrected to the 905-mb value given here.
Unauthenticated | Downloaded 10/21/21 11:27 AM UTC

296 MONTHLY WEATHER REVIEW Vol. 98, No. 4
FIGUBE 3.-Storm surge and pressure profiles of Camille, (courtesy of U.S. Corps of Engineers).
TABLE 1 .-Selected Eow-pressure readings in tropical cyclones
Loeation Date Pressure (in.) (mb)
1. Eye of typhoon Ida 18.9O N. , 135.3' E. Sept. 24, 1958 2.5.91 877 2. 58 saporoea 460 mi. E. of Luzon Aug. 18,1927 28.18 ' 887 3. Matecumbe Key Florida Keys Sept. 2,1935 26.36 892 4. Eye of typhoon Marge 700 mi. NW. of Quam Aug. 16,1961 26.43 895 5. Eye of hurricane Quff of Mexico Aug. 16, I969 26.73 906
6. Basilan Frank Helm Bay, Sept. 25,1905 26. 85 908
7. Cossack Australia June 7,1881 27. W 914 8. Chatumal (Janet) Mexico Sept. 27-28,1955 27. M) 914 9. 9s PhnnhLS Western Caribbean Nov. 6,1932 27.01 916
10. 89 Laimng 26.7' N., 123' E. Aug.2,leOl 27.03 916
Camille
Philippines
TABLE 2.-Damages and deaths of selected memorable huwicanes of the United States
D8lUsgW
of dollars) Year (Millions Year Deaths
Camille Betsy Diane Carol Donna Carla New Eng Hazel Dora Beulah Audrey ClW Miami
1969 1965 1965 1954 1960 1961
:land 1938 1951 I964 1967 1957 1964 1826
1,420.7 1,420. 6
831. 7 461.0 426.0 408.2 308.0 261.6 250.0 200.0 160.0 128.5 112.0
Qalveston Louisiana South Carolina Okeechobee Keys & Texas Qa. & S.C. New England Keys Audrey Atlantic Coast Miss. & La. Qalveston Miss. & La. Camille
ls00 1893 1893 1928 1919 1881 1938 1936 1967 1944 1909
dug. 1916 Lpt . 1916
1969
4 ow) 2, OOo 1,000-2, ow) 1,836
801)-900* 700 600 408 390 390t 360
276 266
2-75
standing this double-barreled assault upon the US. main- land, Camille resulted in less loss of life per million dollars of damage than any of the other great Atlantic hurricanes of this century, as shown in table 2, which has been up- dated from Sugg and Carrodus (1969).
More than 75,000 people were evacuated from the Mississippi coastal area which was most heavily beset by Camille. If the 12 to 15 hr of explicit warning of a record storm had been later in coming, or if evacuation authori- ties had been less efficient in conducting the evacuation, it has been estimated that thousands of additional lives would have been lost.
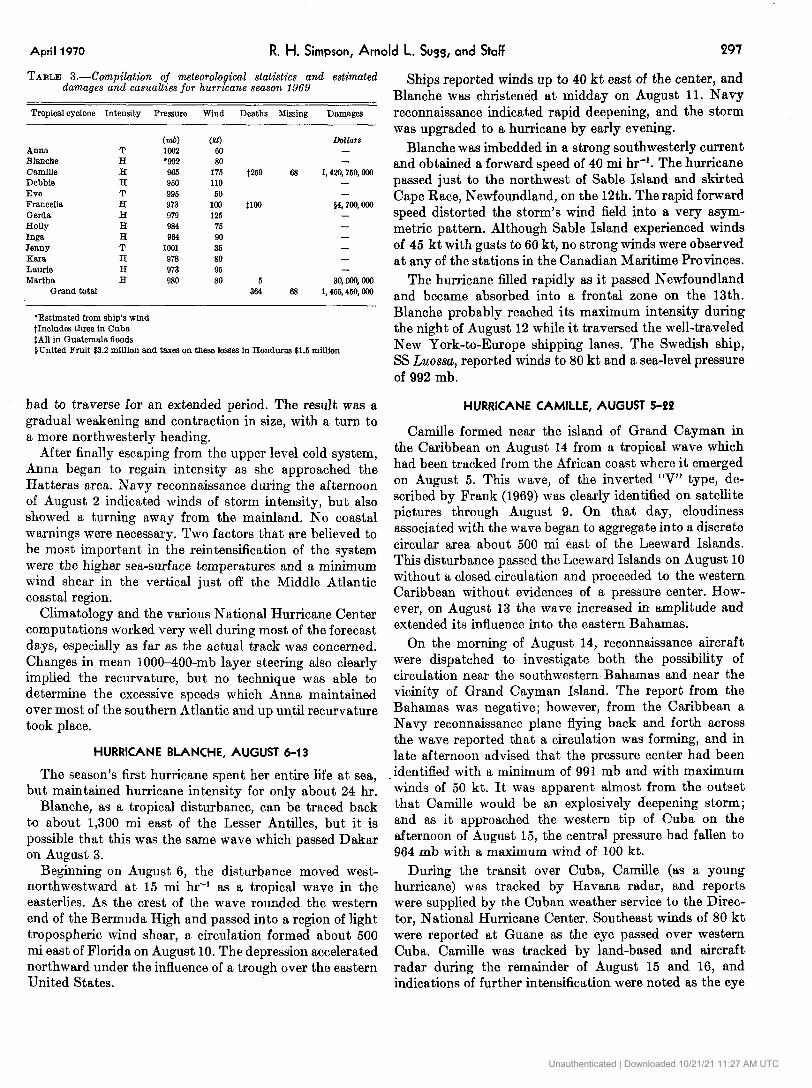
Table 3 gives the meteorological statistics and the esti- mated damages and casualties for the 1969 hurricane season.
9. INDlVlDUAL CASES
TROPICAL STORM ANNA, JULY 23-AUGUST 5
The path of Anna was a rather classical one, beginning near the African coast, resembling the contours of the Bermuda High, passing within 150 mi of Cape Hatteras, and finally moving into the North Atlantic and joining
~~ ~
* Over 600 of these persons were lost at ma. t Some 344 of these people were lost at sea.
a vigorous extratropical low-pressure system north ole the Azores.
Anna probably reached storm intensity on the 27th, and may have obtained her maximum intensity during the next 24 hr. The Plymouth Victory reported winds of 40 k t and a surface pressure of 1006 mb late on the 27th while apparently some distance Prom the center. Satellite photographs also looked most impressive on the 27th and 28th.
An Air Force reconnaissance plane was able to reach the storm during the afternoon of the 29th and found a minimum pressure of 1003 mb and surface winds of 60 kt. Five days later, the pressure was 1002 mb, and a ship reported winds of 60 kt as Anna was moving out to sea about 250 mi east of Nantucket.
When Anna first reached tropical storm intensity, con- ditions appeared favorable for deepening to hurricane intensity. Instead, the development of a large middle-Bevel and upper level cyclone between Puerto Rico andBermuda produced an extremely hostile environment which Anna
Unauthenticated | Downloaded 10/21/21 11:27 AM UTC
April 1970 R. H. Simpson, Arnold L. Sugg, and Staff 297
TABLE 3.--Cmpilation of meteorological statistics and estimated damages and casualties for hurricane season 1969
Tropical cyclone Intensity Pressure Wind Deaths Missing Damages
Anna T Blmche H Camille H Debbie E Eve T FranceIia H Qerda H Holly H Inga H Jenny T Kara H Laurie H Martha H
Qrand total
(mb) (W 1002 60 ‘992 80 905 1 75 950 110 996 50 973 100 979 125 984 75 964 90 1001 35 978 80 973 95 980 80
- - -
5 30, OLW, OOO 364 68 1,455,450,oOO
‘Estimated from ship’s wind tIncludes three in Cuba $All in Quatemala floods $United Fruit $3.2 million and taxes on these losses in Honduras $1.5 million
had to traverse for an extended period. The result was a gradual weakening and contraction in size, with a turn to a more northwesterly heading.
After finally escaping from the upper level cold system, Anna began to regain intensity as she approached the Hatteras area. Navy reconnaissance during the afternoon of August 2 indicated winds of storm intensity, but also showed a turning away from the mainland. No coastal warnings were necessary. Two factors that are believed to be most important in the reintensification of the system were the higher sea-surface temperatures and a minimum wind shear in the vertical just off the Middle Atlantic coastal region.
Climatology and the various National Hurricane Center computations worked very well during most of the forecast days, especially as far as the actual track was concerned. Changes in mean 1000-400-mb layer steering also clearly implied the recurvature, but no technique was able to determine the excessive speeds which Anna maintained over most of the southern Atlantic and up until recurvature took place,
HURRICANE BLANCHE, AUGUST 6-1 3
The season’s first hurricane spent her entire life at sea, but maintained hurricane intensity for only about 24 hr.
Blanche, as a tropical disturbance, can be traced back to about 1,300 mi east of the Lesser Antilles, but it is possible that this was the same wave which passed Dakar on August 3.
Beginning on August 6, the disturbance moved west- northwestward at 15 mi hr-’ as a tropical wave in the easterlies. As the crest of the wave rounded the western end of the Bermuda High and passed into a region of light tropospheric wind shear, a circulation formed about 500 mi east of Florida on August 10. The depression accelerated northward under the influence of a trough over the eastern United States.
Ships reported winds up to 40 k t east of the center, and Blanche was christened at midday on August 11. Navy reconnaissance indicated rapid deepening, and the storm was upgraded to a hurricane by early evening.
Blanche was imbedded in a strong southwesterly current and obtained a forward speed of 40 mi hr-l. The hurricane passed just to the northwest of Sable Island and skirted Cape Race, Newfoundland, on the 12th. The rapid forward speed distorted the storm’s wind field into a very asym- metric pattern. Although Sable Island experienced winds of 45 kt with gusts to 60 kt, no strong winds were observed a t any of the stations in the Canadian Maritime Provinces.
The hurricane filled rapidly as it passed Newfoundland and became absorbed into a frontal zone on the 13th. Blanche probably reached its maximum intensity during the night of August 12 while it traversed the well-traveled New York-to-Europe shipping lanes. The Swedish ship, SS Luossa, reported winds to 80 k t and a sea-level pressure of 992 mb.
HURRICANE CAMILLE, AUGUST 5-49
Camille formed near the island of Grand Cayman in the Caribbean on August 14 from a tropical wave which had been tracked from the African coast where it emerged on August 5. This wave, of the inverted “V” type, de- scribed by Frank (1969) was clearly identified on satellite pictures through August 9. On that day, cloudiness associated with the wave began to aggregate into a discrete circular area about 500 mi east of the Leeward Islands. This disturbance passed the Leeward Islands on August 10 without a closed circulation and proceeded to the western Caribbean without evidences of a pressure center. How- ever, on August 13 the wave increased in amplitude and extended its influence into the eastern Bahamas.
On the morning of August 14, reconnaissance aircraft were dispatched to investigate both the possibility of circulation near the southwestern Bahamas and near the vicinity of Grand Cayman Island. The report from the Bahamas was negative; however, from the Caribbean a Navy reconnaissance plane flying back and forth across the wave reported that a circulation was forming, and in late afternoon advised that the pressure center had been identified with a minimum of 991 mb and with maximum winds of 50 kt. It was apparent almost from the outset that Camille would be an explosively deepening storm; and as it approached the western tip of Cuba on the afternoon of August 15, the central pressure had fallen to 964 mb with a maximum wind of 100 kt.
During the transit over Cuba, Camille (as a young hurricane) was tracked by Havana radar, and reports were supplied by the Cuban weather service to the Direc- tor, National Hurricane Center. Southeast winds of 80 k t were reported at Guane as the eye passed over western Cuba. Camille was tracked by land-based and aircraft radar during the remainder of August 15 and 16, and indications of further intensification were noted as the eye
Unauthenticated | Downloaded 10/21/21 11:27 AM UTC

MONTHLY WEATHER REVIEW Vol. 98, No. 4
FIQURE 4.-Actual tract of hurricane Camille at critical forecast times and the 24-, 48-, and 72-hr objective forecast positions.
shrank to less than 8 mi in diameter and strong feeder bands were reported in all quadrants. Because of the small eye of Camille, the Navy reconnaissance aircraft, which reached the storm area just after midnight on the 16th, was unable to penetrate the eye of Camille, and not until the afternoon of the 16th was it possible to obtain a reliable check on the extent of intensification. During the afternoon, an Air Force C-130 reconnaissance aircraft penetrated and reported a surface pressure of 908 mb (26.81 in.)-a record low pressure for reconnaissance air- craft in Atlantic hurricanes. On this occasion, the aircraft reported an 11°C temperature rise in the eye at 700 mb. Maximum winds a t this flight level could not be obtained during the transit of the heavy rain area in the eye wall. However, because of the extreme pressure gradient near the eye, forecasters anticipated that Camille would shatter a number of records for Atlantic hurricanes.
Early on Saturday evening (August IS), the same Air Force plane and crew made a second flight into Camille and reported an even lower central pressure-905 mb (26.73 in.). Night-level winds at 700 mb measured by Doppler radar had increased to 140 k t at a point 20 n.mi. from the center. The maximum was not recorded due to attenuation of the radar beam by heavy precipitation.
During this period, Camille had continued along a
FIQURE 5.-Camille destruction.
north-northwestward course at about 12 kt, despite hhe fact that most objective predictions of its movement con- sistently carried the storm to the right of the observed storm track. These successive trends are shown in figure 4. These trends resulted in the issuance of warnings farther east along the Gulf Coast a t the outset than were sub- sequently needed.
During the night and morning of August 16 and 17, no further penetrations of the hunicane were obtained, al- though a Navy reconnaissance plane circumnavigated the storm at low levels and reported winds substantially in excess of 100 k t at a radius of 30 to 40 mi from the center. Early in the afternoon of Sunday, August 17, an Air Force WC-130 reconnaissance plane once again pene- trated the storm. The hurricane at that time was less than 100 mi from the mouth of the Mississippi River. The crew estimated the highest surface winds to be 180 kt. During this penetration, the aircraft was forced to feather an engine and had to leave the storm area, so that no further reconnaissance data were obtained until the storm crossed the coastline. Nevertheless, this flight had performed an outstanding service in establishing the fact that Camille unquestionably was a storm of record-breaking propor- tions. This permitted the ESSA Weather Bureau to advise all interests that Camille would bring wind violence and high tides greater than had been experienced by an3 p r e vious storm. The approach of Camille to the coast was monitored continuously by radars in New Orleans and Pensacola. The center of the hurricane passed over the Mississippi coast near the towns of Clermont Harbor, Waveland, and Bay St. Louis about l l :30 p.m. (CDT) 011 Sunday, August 17. Maximum winds near the coastline could not be measured, but from an appraisal of the character of splintering of structures within a few hundred yards of the coast, velocities probably approached 175 kt. The highest recorded storm tide observed, which ap- parently occurred near Pass Christian, was measured a t 24.6 ft, higher than any previous storm tide of record. The
Unauthenticated | Downloaded 10/21/21 11:27 AM UTC

April 1970 R. H. Simpson, Arnold L. Sugg, and Staff 299
FIGURE 6.-Camille destruction.
old ante bellum residences, which had stood in grandeur along the Mississippi coastline from Pass Christian to Biloxi and had withstood the ravages of many hurricanes for more than a hundred years, had been totally or sub- stantially destroyed, with few exceptions. In the Pass Christian-Long Beach area, little trace of intact structures such as roofs or wall sections was observed within 100 yd of the coastline. Here, houses had been swept completely off their foundations and splintered into unrecognizable small pieces, characteristic of the wind damage ordinarily associated with major tornadoe~.~ Examples of partial and total destruction are shown in figures 5 and 6.
As Camille continued inward on a northerly course at a speed of about 16 kt, it left in its wake maximum rains of 6 to 12 in., even higher in a few places. Surface winds weakened as it passed inland, and wind damage north of Jackson, Miss., was not extensive. In northern Mississippi and western Tennessee, rains from Camille broke a severe drought, and the storm’s visit was largely beneficial.
As the remnants of Camille turned eastward across Kentucky, West Virginia, and Virginia, it was a different story. Torrential local rains developed in mountainous areas along the eastern slopes of the Alleghenies, and a series of disastrous flash floods engulfed many areas. As reflected in table 4, the loss of life and property damage from floods, which bore evidence that a vigorous mass circulation continued in the storm system, competed with the losses on the Gulf Coast. While there were no real-time reporting stations indicating rain amounts in excess of 6 in. in an 18-hr period, it was determined later that more than 25 in. had fallen a t a number of locations where the worst flash floods occurred. The unavailability of reports of excessive rainfall hampered the forecasting of floods and the evacuation and protective measures which were urgently needed.
4 Weather Bureau meteorologists J. IC. Rhyne and K. B. Seal at the NASA Mississippi Testing Facility reported that the sound level was estimated at 100 dB (decibels) and was continuous for 2 hr or more. This sound level is thought to be the equivalent of that pro- d u d by several low-flying jet aircraft or by rocket engines.
Camille passed into the open Atlantic on August 21, where it quickly regained tropical storm intensity. However, shortly thereafter it encountered a cold front and was modified rapidly into an extratropical system.
Camille formed in an area of light vertical shear and was associated with a very warm tropospheric environ- ment from the outset. One of the striking characteristics of Camille was the great rapidity with which it deepened and maintained the low central pressures which i t ac- quired after the first 48 hr of its existence. Two factors contributed to this rapid intensification and maintenance of a strong mass circulation. To begin with, the inflow into the storm system in the lower troposphere emanated from very low latitudes near Panama, a long trajectory which continually stretched the columns of air entering the storm and maintained saturation in a broad swath which encompassed the major feeder band from the south (see fig. 7). Second, the mass circulation was assisted by a high-speed current to the north of the outflow layer as indicated in figure 8. This was associated with a deep cold Low centered over the lower Mississippi Valley, with a narrow ridge of high pressure extending along the line from Cape Hatteras to Grand Cayman. This generated a strong southerly jet across the eastern Gulf of Mexico and southeastern United States, which rapidly conducted the warm air emerging from the hurricane in the outflow layer to a colder environment.
I t is interesting to compare the synoptic setting for hurricane Camille with that of hurricane Gladys of 1968. The latter came up out of the Caribbean across western Cuba, very similar to the manner in which Camille emerged into the Gulf of Mexico. However, the inflow into Gladys was primarily from the east, with little cross- ing of the latitude circles; and the mechanism for conduct- ing the warm air of the outflow to a colder environment was less efficient. This is illustrated in figure 9. Figures 8 and 9 show the low-level circulation of each hurricane with the 300-mb map superimposed. Because of the ex- treme intensity of Camille and its extensive interaction with its environment, predictions were difficult. None of the objective techniques commonly used in hurricane pre- diction were successful in anticipating the continued north- west movement of the center as it approached its landfall on the Gulf Coast. The best tool available to forecasters during the critical period in which warnings had to be shifted from the eastern to the central Gulf of Mexico was the tropospheric mean circulation chart, used as a diagnostic tool at the National Hurricane Center, and the NHC HURRANK method developed by Hope and Neumann (1969).
Table 4 is a tabulation of property damage attributed to Camille, and table 5 is the meteorological data.
6 An acronym used by the authors to describe a diagnostic technique for predicting hurricane displacement by use of analogs
Unauthenticated | Downloaded 10/21/21 11:27 AM UTC

300 MONTHLY WEATHER REVIEW Vol. 98, No. 4
TABLE 4.-Impact of hurricane Camille on people and property ( O f i e of Emergency Preparedness and the Ameriean Red Cross)
Mississippi Louisiana Alabama Virginia West Virginia Total
Total lamilies sder ing loss Dwellings destroyed Dwellin@, major damage Dwellings, minor damage Trailers destroyed Trailers, major damage Farm buildings des$royed Farm buildings, major damage Small businesses, destroyed or major damage ' Public damage Private damage
Total damage
63,666 3,881
1% 112 29,736
406 32.5 646
2,002 669
$zoo, m, OoO $760, 000, OOO
$960, ooo, m
9,442 1,771 1,753 h 697
884 290 114 07
110 $10, OOO, m $312, OOO, m
$an, 000, OOO
760 10 60
wo 12 6 6 5
14 m m
3,765 313 416
1,870 n I 4ao 5m 91
$ 1o,m,ooo $130, m, OOO
$140, m, 001)
Wa 36 84
218 12 6
a00 16 6
$rn, m swo, OoO
$760,000
77, gsB e, 011
14,414 w cQ1 1,166
692 1, rdea 2. a79
789 $no, 750, m
$1, m, OOO, m
$1,420,760, OOO
TABLE 5.-Hurricane Camille, meteorological data for Aug. 17-18, 1969 (ESSA Enivronmental Data Services)
Pressure (in.) Wind (mi hrl) Highest storm Station Date tide Timet rainfall Remarks
Low Time+ Fastest Time+ Gusts Time+ (ft)t (in.) mile
Mississippi: Bay St. Louis (west end of bridge)
(St. Stanislaus School) Brandon (Civil Defense) Columbia (James Thornhill)
Columbus AFB Greenwood Airpart (FAA) Jackson Eeesler AFB McComb (FAA) Ocean Springs (Gulf Coast Res. Lab.) Pascagoule. (Ingslls Shipbuilding Gorp.) Picayune (Miss. Test Facility) Poplerville (Civil Defense) Saucier (U.8. Forest Servica) Wiggins (4 mi BE.) (Harson Growers
IllC.) LOUhb8:
Baton Rouge (WBO) Bogalusa
Boothville (WBO)
Callaudar Field (NAS) Garden Island Grand Isle (USCG) Huey Long Bridge Lakefront Airport Moisant (WBO) New Orleans (WBFO)
Port Bulphur Elidell
Alabama: Mobile
Florida: Penssoola NAS (Sherman Field)
Pilottom (as m 4 t O b d )
17
17 18 18
18 18 18 17 18 18 17 17 18 18 18
18 18
17
17 17 17 17
17 17 17 17 17
17
17
28.85
E. 90
2829
29.58 29.13 28 93 28.94 28.68
29.26 28.06
29.44 2863
2834
29.16 27.80 29.21
29.23 29.14 28.04 23.98 28.56
29.44
29.58
'2260
Om
1155 1165 0656 2315 0100
2246 2315
o066 Oo30
1840
2058-2158 1655 1830
2202 2116 1800 ls00 2240
2l66
1765
E 70 NE im
1 8 0 ~ ~ NE 2.5
llO"/al 34o"iZs
Nw23
NW W
46 68 NW 87 NNW 4.2 N 62
60
SE 44
oeoo 02M1
1744 0657
2266 m
E80 NE1136
170OW E 47 NNE 67 1oOop29 W"l61
ESE 81
2.5 NNW 100
107
NW 61
65 73 NW 109 69 N86
N w g o
SE 74
SE 71
OB00 ozoa
1429 122.5
2166 0100
2246
Lowest measured pressure at surisce
2 3 4.85 Wind instrument dhbled 83
speed reached 120 and gusts to 136 mi hr*; gusts eatlmatd to 140 mi h r l
2.40 1.98 2.23
1.28 15 0100 12 18/0015 6.60
10.06 5.26 7.01 &a4
16.0
9.0
0.14 4.10 Anemometer hiled at 100 mi
hrl . Power failure m8d0 wind equip-
ment inoperative after gusts reached 107 ml hr-4
2.60
2 80
1.00 1.69
'A6 5.2 5.03
7.4 6.05
a. SK
- *Estimated
$Above mean sea level tCST
Unauthenticated | Downloaded 10/21/21 11:27 AM UTC

401 April 1970
FIGURE 7.--Hurricane Calr,i:le &a seen by Nhmbns III sateElite 03 Aug. 16, 1969, st 1910 GMT.
Unauthenticated | Downloaded 10/21/21 11:27 AM UTC

I02 MONTHLY WEATHER REVIEW Vol. 98, No. 4
FIGURE S.-WMO Regional Center, ESSA, Weather Bureau, Miami analysis of the top of the Ekman layer (dashed lines) with the 300-mb analysis (solid lines) superimposed, 1200 GMT on Aug. 15, 1969. Note 70-kt wind in the eastern Gulf of Mexico. The hurricane symbol and box (970) represent the position of Camille and the central pressure at map time. The box (905) represents the position and central pressure 36 hr later.
FIQURE 9.-Same as figure 8, except these are analyses of Gladys at 1200 GMT on Oct. 15, 1968. Note wind velocities compared with those’ of figure 8.
HURRICANE DEBBIE, AUGUST 13-95
Debbie was of hurricane force for 9 days while traveling over 3,000 mi from the south-central Atlantic.
There was a large convective mass of clouds off the African coast on August 13 which moved toward the west- northwest and developed into a depression on the 14th, a storm on the 15th, and 8 hurricane the following day. Debbie reached her greatest strength on the 20th, then turned toward the north-northeast on the 21st, and after passing Newfoundland lost force rapidly over the ex- tremely cold waters and died east of Greenland.
The seeding of Debbie is the third in a series of seeding experiments on hurricanes; the first occurred in hurricane Esther in 1961, and the second in hurricane Beulah in 1963. The seeding of the eye wall by silver-iodide pyro- technics dropped from high-flying planes is based upon an hypothesis by Simpson et al. (1962) and Simpson (1963), and elaborated upon by R. and J. Simpson (1966). Simpson (1970) makes the following appraisal of the seeding experiment in Debbie: “While the analysis (of the Debbie seeding data) is not yet complete and the marked wind changes cannot yet beyond doubt be (ex- plicitly) attributed to the seeding, the positive indicatbns are indeed strong. If further repetition of this experiment confirms present indications, a major break-through in weather modification will have been achieved.
“The physical idea is that by massive seeding in the eye wall chimney area, the fusion heat release can cause a reduction of 15% to 20% in the strongest radial pressure gradient of the storm, and that this would lead to a reduc- tion in maximum wind strength, and hence the destruc- tiveness which occurs mainly in the ring of maximum winds. The results from the previous seeding experiments were in the direction predicted by the hypothesis in all of numerous parameters measured. However, the first two experiments included only a single seeding, and the mag- nitude of results were too small to have been clearly separate from what might have been expected from normal variations in the hurricane. The Debbie seeding was designed to repeat the massive seeding 5 times at 90 minute intervals to determine whether the same response would occur successively by these seedings. The prelim- inary results presented by Gentry (1969) showed a marked reduction in maximum wind speed on both seeding occa- sions in Debbie. The decrease was from 98 to 68 knots or 31% on August 18th and from 99 to 84 knots or 15y0 on August 20th. On the second day of seeding the eye wall had a double structure, and, unfortunately, all but the last of the 5 seedings were executed relative to the inner eye wall which was inward of the optimum radius sug- gested by the hypothesis.
“In support of the seeding program in Debbie, Rosenthal and Koss (1968) evolved a ’/-level parameter equation numerical hurricane model which lends itself to assimila- tion of seeding operations followed in Debbie. The model has a horizontal resolution of 10 kilometers. The rate of fusion heating from seeding was considered to be 2OC per half hour in the layer 500 to 300 mb. The model storm responded as predicted by the Simpson hypothesis by
Unauthenticated | Downloaded 10/21/21 11:27 AM UTC

April 1970 R. H. Simpson, Arnold L. Sugg, and Staff 303
the 8th hour after seeding starts; in the dynamical model the original maximum wind is eroded away and a second maximum appears at a larger radius. After the seeding stops the original maximum reappears more weakly, and the second maximum tends to disappear. This leaves a 12 knot wind reduction from an original maximum of 86 h o t s . ”
Hurricane Camille’s circulation was still strong at upper levels as i t moved off the mid-Atlantic coast on the 20th and passed north of Debbie on the 21st and 22d. Without Camille’s presence, Debbie most likely would have passed close to Bermuda and probably would have made landfall in Newfoundland.
TROPICAL STORM EVE, AUGUST 94-27
I t is not uncommon during the hurricane season for pools of polar air to cut off over the Tropics south of the main westerly currents. Occasionally, surface Lows will form within these baroclinic zones and trigger convective processes resulting in systems that feed upon both baro- clinic and latent heat energy sources. Sometimes, the convective processes become sufficiently well organized and concentrated that local warming dominates and stifles the baroclinic contributions. When this occurs, the nature of the vortex changes from cold to warm core and may result in the formation of a tropical storm. It has been estimated that nearly 15 percent of all Atlantic storms are initiated in this way, and Eve is an excellent example of this type of formation.
Several days prior to the appearance of Eve, cold air swept over the eastern United States in the wake of Camille and eventually covered the entire Southern States, leaving a quasi-stationary front across north Florida. A center of positive vorticity drifted slowly southeastward from the Great Lakes, reaching northern Florida on the 24th. The influx of vorticity aloft activated the weak baroclinic field associated with the old frontal trough and produced a low-level circulation east of Daytona Beach, Fla.
The next day, satellite pictures indicated widespread convective activity, suggesting that tropical processes were becoming more important. Winds up to 50 k t and a minimum sea-level pressure of 999 mb were reported by aircraft reconnaissance that afternoon.
Eve drifted toward the northeast, struggling against her environment, with no significant changes for the next 24 hr. In the meantime, developments were occurring over the eastern United States that ultimately determined the final destiny of Eve. Pressure rises associated with a new surge of cold air spread over New England and prohibited the storm from accelerating eastward. The slow forward motion allowed cold air to penetrate the core, thwarting the tropical processes, and brought a quick death blow on the afternoon of the 27th.
HURRICANE FRANCELIA, AUGUST 19-SEPTEMBER 4
Francelia developed from a complex system that moved off Africa during August 19 and 20. The wave, which may have contained a depression, moved westward. A signifi-
cant enhancement of convection occurred on August 26 when the wave was located about 800 mi east of Barbados; but Navy reconnaissance east of the Windward Islands on the 28th found no evidence of a closed circulation. After the disturbance passed through the island chain, ship and land reports indicated that a depression with maximum winds of 30 kt had formed in the extreme eastern Caribbean. Air Force reconnaissance on the 29th showed that the depression was speeding toward the west- northwest a t almost 20 k t with no intensification.
As the disturbance approached the Windward Islands, environmental conditions were becoming increasingly favorable for intensification. This trend continued in the large-scale flow patterns, but the historically unfavorable location seemed to allow no increase in intensity until the more favorable western Caribbean was reached. Reconnaissance reports on the morning of the 30th indicated winds up to 40 kt and a sea-level pressure of 1001 mb. A maturing Francelia was named about 250 mi south of Haiti.
The trend toward intensification, so far as central pressure was concerned, did not continue. As late as the morning of September 1, the central pressure had risen to 1006 mb. In spite of this rather minor trend in pressure, winds were increasing and were reported as high as 65 kt, mainly in squalls, during the 2 days. A careful exam- ination of satellite photographs and reconnaissance data gave one possible explanation of this rather unusual occurrence. The surface wind and pressure center had outraced the supporting convective cloud system and associated sustaining physical and dynamical processes.
By early afternoon of September 1, the ESSA Research Flight Facility aircraft found winds of 70 k t and a sea- level pressure of 995 mb; further intensification proceeded as had been expected earlier. When it looked as if Fran- celia would pass just to the north of Swan Island, there was a gradual building of pressures north of the hurricane, which resulted in a turn toward the west, and the center passed over the island during the early evening.
Francelia turned to the west-southwest; and by early afternoon on the 2d, Air Force reconnaissance found winds to 100 k t and a sea-level pressure of 973 mb. This was just as the center passed to the north of the Bahia Islands located some 30 mi north of the coast of Honduras.
The hurricane was now moving at less than 8 kt. Re- ports from two ships, the Aragon and the Elets, indicated Francelia was maintaining intensity. Another ship, the Rio Cobre, and a commercial aircraft located the center some 30 mi east of the southern British Honduras coast, moving toward the west-southwest at a very slow speed of 3 kt. These reports were very important since the hurricane’s center was so close to land and the adjoining coastal ranges that it was impossible to carry on con- ventional aerial reconnaissance during the final hours prior to landfall.
Gale-force winds occurred over British Honduras from Belize southward, and hurricane-force winds were con- fined to a small area along the coast just north of the land- fall. High tides probably occurred over a small area to the
Unauthenticated | Downloaded 10/21/21 11:27 AM UTC

304 MONTHLY WEATHER REVIEW Vol. 98, No. 4
north of the center. Torrential rains in the mountains of Guatemala, Honduras, and British Honduras produced flooding of many rivers, with the Belize River rising to over 36 f t above normal.
It took the remnants of Francelia 3 days to cross Central America and the southern states of Mexico, pro- longing torrential rains which had been falling in those sections for weeks. After emerging into the Pacific Ocean, the disturbance regained a circulation, and was eventually named tropical storm Glenda on September 7.
HURRICANE GERDA, AUGUST P1-SEPTEMBER 10
Hurricane Gerda had a comparatively short life for an early September hurricane. However, prior to develop- ment into a depression, the disturbance that probably generated the tropical cyclone can be traced across the Atlantic from the interior of northwestern Africa. The track from Africa was developed by following cloud masses on daily satellite pictures. Some of the cloud masses were organized, others disorganized.
On September 3, the disturbance merged with a de- generating midtropospheric cyclone to the north of Hispaniola and Puerto Rico. A larger cloud mass developed and con- tinued toward the west-northwest at 10 mi hr-' until there were indications of a surface circulation forming in the western Bahamas on the 5th.
The weak tropical depression moved into southeastern Florida on the 6th, then drifted very slowly northward before emerging into the Atlantic near Cape Kennedy on the afternoon of the 7th. Thereafter, a northeasterly course with a steady fall in pressure began, and on. the next morning a Navy reconnaissance aircraft found winds up to 50 k t and a sea-level pressure of 1000 mb.
The approach of a major trough in the westerlies produced rapid acceleration, and Gerda reached hurricane intensity on the afternoon of the 8th. The hurricane proceeded on a northeast to north-northeast course within 100 mi of the US. east coast, and eventually obtained a forward speed of 40 mi hr-' as the center passed 50 mi off Cape Cod and moved inland over the extreme eastern tip of Maine by late afternoon and evening of September 9. The Nantucket lightship, about 75 mi southeast of Cape Cod, measured winds of 125 mi hr-' and gusts to 140 mi hr-', as the center passed directly over the ship. Only gales were reported at Nantucket. The extremely high wind velocities, normally not produced by a hurricane with a central pressure of 979 mb, can be attributed, in part, to the rapid movement of the system and to the interaction with a strong trough in the westerlies.
Damage was minimal and confined mainly to marinas, downed trees, high powerlines, and to highways from the Cape Cod area to eastern Maine.
HURRICANE HOLLY, SEPTEMBER 9-21
The disturbance that became hurricane Holly could be identified as early as September 8, after it had moved off the African coast. Subsequently, it moved westward near
10' N. latitude until it reached 40' longitude, where it began a west-northwestward track.
By September 12, the disturbance had begun to show better organization on satellite pictures; it was a depres- sion on the 13th, and Navy reconnaissance aircraft found a central pressure of 1000 mb on the following day. Steady but not rapid deepening occurred for the next 2 days. Hurricane intensity was obtained on the 15th, winds reached 75 kt, and the central pressure dropped to 984 mb (not shown in fig. 1) on the following day. Thereafter, the hurricane began to weaken steadily. On September 17, it was downgraded to a tropical storm, and to a depression on the 18th.
When Molly was downgraded 'to a depression, it was still 300 mi east of the Leeward Islands. It then moved west-southwestward and continued to weaken as it moved into the eastern Caribbean when it was barely perceptible from surface data. The last satellite pictures of an identifi- able circulation showed weak but clear low-level banding with the cirrus canopy completely gone. By midday of the 21st, all traces of Holly had vanished.
When Holly was named, the environment seemed mildly favorable for development. The flow in the upper troposphere was anticyclonic, and there was little vertical shear. But from the beginning, analyses a t high levels revealed no substantial outflow. As the system moved through the Lesser Antilles, an upper trough drifting eastward was becoming progressively better defined near 60' longitude. Holly moved under the cyclonic flow associated with the upper tropospheric trough and steadily deteriorated. It was then that the upper and lower level features drifted westward in tandem, inhibiting redevelopment of the storm.
HURRICANE INGA, SEPTEMBER PO-OCTQBER 14
Inga (longest lived Atlantic tropical cyclone of record) spent 25 days inside a relatively small circle (radius less than 700 mi) over the open Atlantic. It was born under adverse conditions, made a rather tight loop southeast of Bermuda, and then passed within 200 mi of Bermuda. It was along this northeastward track that the hurricane reached her greatest strength; winds were estimated to be 90 kt, and the sea-level pressure was reported to be 964 mb.
A cold Low to the east turned the hurricane toward the south; later, under the influence of a cold High to the north, inga drifted westward and dissipated some 250 mi from where she first reached hurricane force.
TROPICAL STORM JENNY, OCTOBER id
Jenny culminated a prolonged period of disturbed wea- ther in the Gulf of Mexico that persisted for nearly a week. A cut-off Low in the upper troposphere triggered wide- spread showers and spawned two depressions prior to the formation of Jenny. The second depression moved into the Florida Panhandle on the same day that Jenny, de-
Unauthenticated | Downloaded 10/21/21 11:27 AM UTC

April 1970 R. H. Simpsoa, Arnold L. Sugg,-ond Staff 305
veloped in the northwest Caribbean Sea. Under the influence of a deep southerly current associ-
ated with the Gulf Low, the depression moved northward across western Cuba into the Florida Straits. The Air Force found a minimal tropical storm northwest of Key West on October 2; winds were up to 35 kt, and the sea- level pressure was 1001 mb. During the afternoon, several unsuccessful attempts to sustain an eye were observed on the Key West and Miami radars. Landfall occurred on the southwest Florida coast between Fort Myers and Naples; gales occurred in passing squalls.
Jenny moved up the Florida Peninsula and appeared headed for the open 'Atlantic before responding to strong ridging over the eastern United States, which resulted in a reversal of the track and a turning toward the west. Navy reconnaissance and the Daytona Beach radar in- dicated that the center briefly emerged from the peninsula north of Cape Kennedy during the afternoon of the 3d. The remnant of Jenny slipped back into the Gulf of Mexico on the 5th and eventually interacted with a cold front producing heavy rains over southern Louisiana on the 7th.
The major consequence of the storm in Florida was the heavy rains over the central portion of the peninsula where amounts ranged from 5 to 8 in. along the Kissimmee River Basin north of Lake Okeechobee.
HURRICANE KARA, OCTOBER 7-19
During the early days of development, Kara was imbedded in a cold trough extending from the southwest Caribbean north-northeastward through Cuba into the southwest Atlantic. Aircraft reconnaissance measured only a 1' or 2 O temperature rise in the center. Even after Kara reached tropical storm intensity, there was no well-defined eye, and feeder bands were absent.
The most singular aspect of Kara was its relationship to an upper cold Low which seemed to govern its move- ment and resulted in a most unusual track. The first threat was to the eastern seaboard from the Carolinas to New England, then Florida, and finally to the shipping lanes as it accelerated northeastward over the North Atlantic.
Kara reached tropical storm intensity on October 9 while moving toward the northeast in the southwesterly flow associated with the upper trough. The next day, Kara was located 500 mi east of Daytona Beach, and a cold upper trough was moving eastward off the North Carolina coast. Later, a closed upper Low formed off Cape Hatteras only 300 mi northwest of the tropical storm. Kara's reaction to this was to appear to accelerate north-north- westward; and by the following day, the two systems had merged.
I t was apparent that the surface center reformed under the upper Low. At this juncture, there was not much about the system that was tropical. But as pressures and heights northwest of the storm began to rise, the storm moved southward and warmed, gradually assuming a more tropi- cal character each day. The movement toward the south.
and southwest ended when the upper westerlies dipped to the south and eroded the ridge northwest of Kara.
Kara first developed an eye when it was located about 300 mi south of Cape Hatteras on the morning of October 14. It was only after the storm had begun its northeast- ward acceleration away from land that it reached hurri- cane strength. I t lost intensity rapidly as it encountered a cold trough over the northeast Atlantic.
HURRICANE LAURIE, OCTOBER 16-97
A well-defined 500-mb Low developed near Swan Island late on October 15. The next day, pressures were rising all around a large area of disturbed weather which had developed in the northwest Caribbean, and it was here that a depression formed about 75 mi west of Swan Island.
All criteria seemed to be present for rapid intensifica- tion, but this did not occur until the 19th when the de- pression moved off the Yucatan Peninsula into the southern Gulf of Mexico. One possible reason for this delay might have been the apparent southeastward slope of the system from the surface to 500 mb, as indi- cated by conventional data and later confirmed by recon- naissance aircraft.
Because of the intensity of Laurie, a hurricane watch was advised for a large portion of the Gulf Coast; but the slow movement of the hurricane allowed restraint on the issuance of warnings. Only gale warnings were issued for the mouth of the Mississippi River and along the southwest Florida coast from Fort Myers Beach south- ward to the Keys.
The hurricane reached maximum strength about 250 mi south of New Orleans on the 21st. Drier air gradually weakened Laurie as she recurved toward the east, then south, then west and southwest, and finally entered Mexico.
HURRICANE MARTHA, NOVEMBER 91-95
Martha moved southward into Panama on November 24. Undoubtedly, there have been other tropical cyclones that moved into Panama, but this was the first one that was definitely tracked.
Winds aloft from San Andrbs and the Panama Canal Zone showed a moderate cyclonic circulation on November 20; and early on the 22d, reports from an Air Force plane indicated that a small hurricane had formed. Martha drifted toward the south, gradually weakened, and reached the north coast of Panama with only storm intensity. The deaths were in Costa Rica and attributed to flooding, and landslides and considerable damage occurred in that country when most of the capital city of San Jose was flooded.
ACKNOWLEDGMENTS The authors acknowledge the contributions made by staff
members of the Hurricane Warning Offices, especially Clyde Connor, New Orleans, the State Climatologists, the ESSA Environ- mental Data Services, the Red Cross, the Office of Emergency
Unauthenticated | Downloaded 10/21/21 11:27 AM UTC

MONTHLY WEATHER REVIEW vol. 98, No. 4
Preparedness, the Civil Defense, and Ruth Goodin, Lilias Wilson, and Sylvia Fink for clerical work. and R.. Carrodus, C. True, and D. Martin for graphics.
REFERENCES
Ballenzweig, Emanuel M., “Seasonal Variation in the Frequency of North Atlantic Tropical Cyclones Related to the General Circulation,” National Hurricane Research Project Report No. 9, U.S. Weather Bureau, Washington, D.C., July 1957, 33 pp.
Ballenzweig, Emanuel M., “Formulation of Tropical Storms Related t o Anomalies of the Long Period Mean Circulation,” National Hurricane Research Project Report No. 21, U.S. Weather Bureau, Washington, D.C., Sept. 1958, 16 pp.
Frank, Neil L., “The ‘Inverted V’ Cloud Pattern-An Easterly Wave?,” Monthly Weather Review, Vol. 97, No. 2, Feb. 1969, pp 130-140.
Frank, Neil L., “Atlantic Tropical Systems 1969,” Monthly Weather Review, Vol. 98, No. 4, Apr. 1970, pp. 307-314.
Gentry, Robert C., “Project Stormfury, 1969,” paper presented a t the 6th Technical Conference on Hurricanes, Miami, Fla., Dec. 2-4, 1969.
Hebert, Paul J., and Miller, Banner I., “An Experiment in the Utilization of Hemispheric Circulation and Anomaly Patterns in Operational Tropical Weather Outlooks,” paper presented a t the 6th Technical Conference on Hurricanes, Miami, Fla., Dec. 2-4, 1969.
Hope, J. R., and Neumann, C. J., “An Operational Technique for Relating Existing Tropical Cyclones to Climatological Tracks,” paper presented at the 6th Technical Conference on Hurricanes, Miami, Fla., Dec. 2-4, 1969.
Rosenthal, Stanley L., and ROSS, Walter J., “Linear Analysis of a Tropical Cyclone Model With Increased Vertical Resolution,” Monthly Weather Review, Vol. 96, No. 12, Dec. 1968, pp. 858-866.
Simpson, Joanne S., “Cumulus Cloud Modification: P. ogress and Prospects,” paper presented at the Joint Symposium Commemo- rating the Golden Anniversary of the American Meteorological Society and the Centennial of the U.S. Weather Services, Washington, D.C., Feb. 12-14, 1970.
Simpson, Robert H., “Exploring the Eye of ,Typhoon ‘Marge’ 1951,” Bulletin of the American Meteorological Society, Vol. 33, No. 7, Sept. 1952. pp. 286-298.
Simpson, Robert H., “Liquid Water in Squall Lines and Hurricanes a t Air Temperatures Lower Than -4OoC.,” Monthly Weather Review, Vol. 91, No. 10-12, 0ct.-Dec. 1963, pp. 687-693.
Simpson, Robert H., “A Reassessment of the Hurricane Prediction Problem,” paper presented a t the 6th Technical Conference on Hurricanes, Miami, Fla., Dec. 2-4, 1969.
Simpson, Robert H., Ahrens, N. R., and Decker, R. D., “A Cloud Seeding Experiment in Hurricane Esther, 1961,” National Hurricane Research Project Report No. 60, US. Weather Bureau, Washington, D.C., Nov. 1962, 30 pp.
Simpson, Robert H., Frank, Neil L., Shideler, D., and Johnson, H. M., “Atlantic Tropical Disturbances of 1968,” Monthly Weather Review, Vol. 97, No. 3, Mar. 1969, pp. 240-255.
Simpson, Robert H., and Simpson, Joanne S., “Why Experiment on Tropical Hurricanes?,” Transactions of the New York Academy of Sciences, Vol. 28, No. 8, June 1966, pp. 1045-1062.
Sugg, Arnold L., “A Mean Storm Surge Profile,” ESSA- Wealher Bureau Technical Memorandum WBTM-SR-49, U.S. Depart- ment of Commerce, Weather Bureau Southern Region, Ft. Worth, Tex., Dec. 1969, 6 pp.
Sugg, Arnold L., and carrodus, R. L., “Memorable Hurricanes of the United States Since 1873,” ESSA- Weather Bureau Technical Memorandum WBTM-SR-42, U.S. Department of Commerce, Weather Bureau Southern Region, Ft. Worth, Tex., Jan. 1969, 50 PP-
[Received January 16, 19701
Unauthenticated | Downloaded 10/21/21 11:27 AM UTC