noaa 2015 atlantic hurricane season outlook
TRANSCRIPT

NOAA 2015 Atlantic Hurricane Season Outlook
Dr. Gerry Bell
Lead Seasonal Forecaster
Climate Prediction Center NOAA/ NWS/ NCEP
Collaboration With
National Hurricane Center/ NOAA/ NWS/ NCEP
Hurricane Research Division/ NOAA/ OAR/ AOML/ HRD
www.cpc.ncep.noaa.gov/products/hurricane

Outline
1. Features of the Outlook
2. The 2015 Atlantic outlook
3. Climate factors behind the Seasonal outlooks
4. Summary

Features of NOAA’s Seasonal Hurricane Outlooks

NOAA’s Hurricane Outlook Regions
Atlan&c Basin Storm Tracks 1980-‐2005
Central and Eastern North Pacific Storm Tracks 1980-‐2005
Central Pacific Eastern Pacific
NOAA issues seasonal hurricane outlooks for the Atlantic basin, the central North Pacific, and the eastern North Pacific.
Figure Courtesy of Wikipedia
140oW Main Development Region (MDR)

The 2015 Seasonal Hurricane Outlook

NOAA’s 2015 Hurricane Season Outlooks
Atlantic Below- Normal
6-11 Named Storms 3-6 Hurricanes
0-2 Major Hurricanes
Eastern Pacific Above- Normal
15-22 Named Storms 7-12 Hurricanes
5-8 Major Hurricanes
Central Pacific Above- Normal
5-8 Tropical Cyclones
• This year, the probability of the predicted season strength for all three regions is 70%.
• All ranges are given with a 70% probability of occurrence.
• Outlooks indicate expected overall activity. They are not seasonal landfall forecasts, and do not imply activity for any particular location.
El Niño is the main climate factors influencing all three hurricane basins this year. Multi-decadal signals are not expected to offset El Niño. Also expect near-average SSTs across tropical Atlantic.

NOAA 2015 Atlantic Hurricane Season Outlook
www.cpc.ncep.noaa.gov/products/hurricane
This outlook was issued on May 27th , and will be updated in early August.
The predicted ranges are centered below the seasonal averages.

Expected Conditions During the Peak Months (August-October) of the 2015 Atlantic Hurricane Season
The expected atmospheric and oceanic conditions across the MDR during August-October 2015 suggest a below-normal Atlantic hurricane season. Green box denotes the Atlantic hurricane Main Development Region (MDR).
Main Development Region (MDR)
Near-Average SSTs in MDR
Anomalous Sinking Motion, Increased stability in Atmosphere (Blue)
Possible Weaker Vertical Wind Shear
Stronger Vertical Wind Shear and upper-level winds (Green arrows)

• NOAA’s seasonal outlooks based largely on predictions of three main climate factors that strongly control Atlantic hurricane season
1. Atlantic Multi-Decadal Oscillation (25-40 year) signal : Reflects fluctuations in Atlantic sea surface temperatures, West African monsoon.
2. El Niño and La Niña; Reflect large year-to-year changes in tropical Pacific Ocean temperatures.- El Niño is the main factor behind the outlooks this season.
3. Year-to-year fluctuations in Atlantic sea-surface temperatures
Science behind NOAA’s Atlantic Hurricane Outlooks
Three types of models used: Statistical Dynamical Hybrid Dynamical/ statistical

The 2015 Atlantic Outlook in a Historical Perspective
Caption: Seasonal Accumulated Cyclone Energy (ACE) index during 1950-2014 (Blue bars) and NOAA’s 2015 outlook range with a 70% probability of occurrence (Red bar). Shading indicates NOAA’s ACE thresholds for classifying hurricane season strength.
NOAA’s 2015 Atlantic hurricane season outlook indicates a 70% probability of an ACE range of 40%-85% of the median.
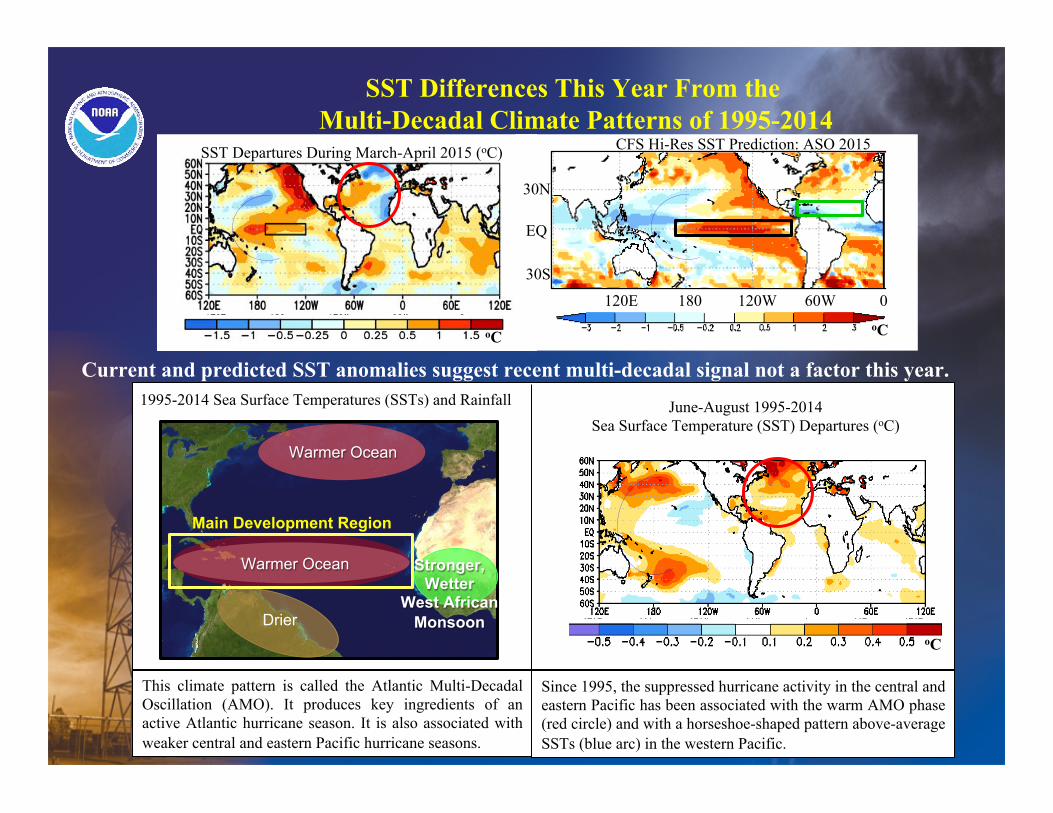
SST Differences This Year From the Multi-Decadal Climate Patterns of 1995-2014
Since 1995, the suppressed hurricane activity in the central and eastern Pacific has been associated with the warm AMO phase (red circle) and with a horseshoe-shaped pattern above-average SSTs (blue arc) in the western Pacific.
This climate pattern is called the Atlantic Multi-Decadal Oscillation (AMO). It produces key ingredients of an active Atlantic hurricane season. It is also associated with weaker central and eastern Pacific hurricane seasons.
1995-2014 Sea Surface Temperatures (SSTs) and Rainfall June-August 1995-2014 Sea Surface Temperature (SST) Departures (oC)
Stronger, Wetter
West African Monsoon Drier
Main Development Region
Warmer Ocean
Warmer Ocean
Current and predicted SST anomalies suggest recent multi-decadal signal not a factor this year.
SST Departures During March-April 2015 (oC)
EQ
30S
30N
120E 180 120W 60W 0
CFS Hi-Res SST Prediction: ASO 2015
oC oC
oC

El Niño Impacts on Hurricane Activity
• El Niño has opposite impacts between the Pacific and Atlantic hurricane basins.
• In the Atlantic basin, El Niño suppresses the hurricane season by strengthening the vertical wind shear, producing more descending motion, and increasing the atmospheric stability.
• In the central and eastern Pacific hurricane basins, El Niño strengthens the hurricane season by weakening the vertical wind shear.
Warm, Wet
More Hurricanes due to less ver&cal wind shear.
Fewer hurricanes due to increased ver&cal wind shear, descending
mo&on, and atmospheric stability.
Summary
1. Below-normal (70% chance) Atlantic hurricane season. [Above-normal seasons (70% chance) are expected for the eastern and central Pacific regions.]
2. Factors behind the outlooks:
• El Niño: Suppresses Atlantic, strengthens central and eastern Pacific seasons.
• Multi-decadal signal: Not a factor this year in any region, won’t offset El Niño
• Near-average SSTs across MDR, cooler than remainder of global tropics. Atlantic SST anomalies not a big player this year.

Supporting Analysis

Climate-based regression and analogues
Quantifies observed activity during past seasons with strengths of ENSO, AMO, Atlantic SSTA similar to present.
Statistical Guidance
Hybrid Statistical/ Dynamical Guidance
Regression relates historical CFS-V2 (T-126) forecasts of SST and vertical wind shear to observed hurricane activity.
Quantifies observed activity during past seasons having model predictions similar to present.
Forecast tool consensus guidance provides 70% probability ranges of activity
Forecast team members each predict 70% probability ranges of activity.
Final outlook is consensus of individual forecaster predicted ranges.
NOAA’s Atlantic Hurricane Season Outlook Process
CFS -382 Ensemble
SST, vertical wind shear, ENSO
GFDL, ECMWF, UKMET, EUROSIP
Dynamical Guidance and ENSO
M o d e l forecasts of seasonal activity
CPC/ IRI suite ENSO forecasts
Predict ENSO

Nature of NOAA’s Seasonal Hurricane Outlooks
• Active/ inactive seasons often result from coherent set of atmospheric conditions controlled by tropical climate patterns. Not Random.
• Predicting tropical climate patterns is the basis for making a seasonal hurricane outlook.
• Outlooks indicate the expected overall seasonal activity.
• Outlooks are NOT a seasonal hurricane landfall prediction and do not predict levels of activity for any particular region.
• Outlooks are probabilistic, meaning the stated ranges have a certain likelihood of occurring.

Sources of uncertainty in seasonal hurricane outlook
1. Predicting ENSO and its impacts is an ongoing challenge. Such forecasts
made in spring generally have limited skill.
2. Many combinations of named storms and hurricanes can occur for the same general set of climate conditions.
3. Persistent weather patterns can sometimes set up and last for weeks or months (e.g. 2014), and have the potential to greatly impact the hurricane season.

The Multi-Decadal Signal Associated with the High-Activity Era for Atlantic Hurricanes That Began In 1995
Figure shows the warm phase of the Atlantic Multi-Decadal Oscillation (AMO), which is associated with a combination of warmer Atlantic waters, an enhanced West African monsoon system, and suppressed convection over the Amazon Basin. These conditions produced the high-activity era for Atlantic hurricanes that began in 1995. Similar conditions were also present during the active Atlantic hurricane period 1950-1969. Opposite conditions in association with the cold phase of the AMO produced the below-normal hurricane era 1971-1994.
Stronger, Wetter West African
Monsoon
Drier
Main Development Region (MDR)
Warmer Ocean
Warmer Ocean

This set of conditions has strong links to tropical climate factors. There is an extensive monitoring program to assess and predict these conditions and the climate factors.
Conditions Associated with the Warm Phase of the AMO

March-April 2015: Atlantic SST Anomalies
Caption: (Left) March-April 2015 SST anomalies (˚C) with green box denoting the MDR. (Right) March-April area-averaged SST anomalies since 1950: (Top) in the MDR, and (Bottom) difference between MDR and the global tropics (20˚N-20˚S). Anomalies are departures from the 1981-2010 ERSST.V3b monthly means.
Tropical Atlantic SSTs were near-average during March-April 2015. Area-averaged SST anomalies in the MDR were 0.0˚C during this period, which is -0.31˚C cooler than the remainder of the global tropics.
SST Anomalies (˚C) March-April SST anomalies in the MDR.
March-April SST anomaly difference: (MDR minus global tropics)
0.0oC
-0.31oC SS
T A
nom
aly
(˚C
)

Recent El Niño Signal
SST Departures (oC) Equatorial Pacific Sub- Surface Temperature Departures (oC)
Sub-surface temperatures are above average across the eastern half of equatorial Pacific.
Outgoing Long-Wave Radiation (OLR) Anomalies
Enhanced convection across the eastern half of the equatorial Pacific is associated with weaker trade winds and reflects the current El Niño.
Figure Caption: (Top Left) Last 30-day SST anomalies (˚C) with the Niño 3.4 region indicated by the black box. (Top Right) Latest weekly equatorial Pacific depth-longitude section of ocean temperature anomalies averaged between 5˚N-5˚S. (Bottom Left) Anomalous Outgoing Long-wave Radiation (OLR, W m-2) during mid-April through mid-May 2015. In the tropics, positive (Red) values indicate weaker convection and negative (Blue) values indicate stronger convection. Anomalies are departures from the 1981-2010 means.
SSTs are above average across the equatorial Pacific Ocean.
Dep
th (m
)
oC oC
Enhanced Convection
W m-2
El Niño
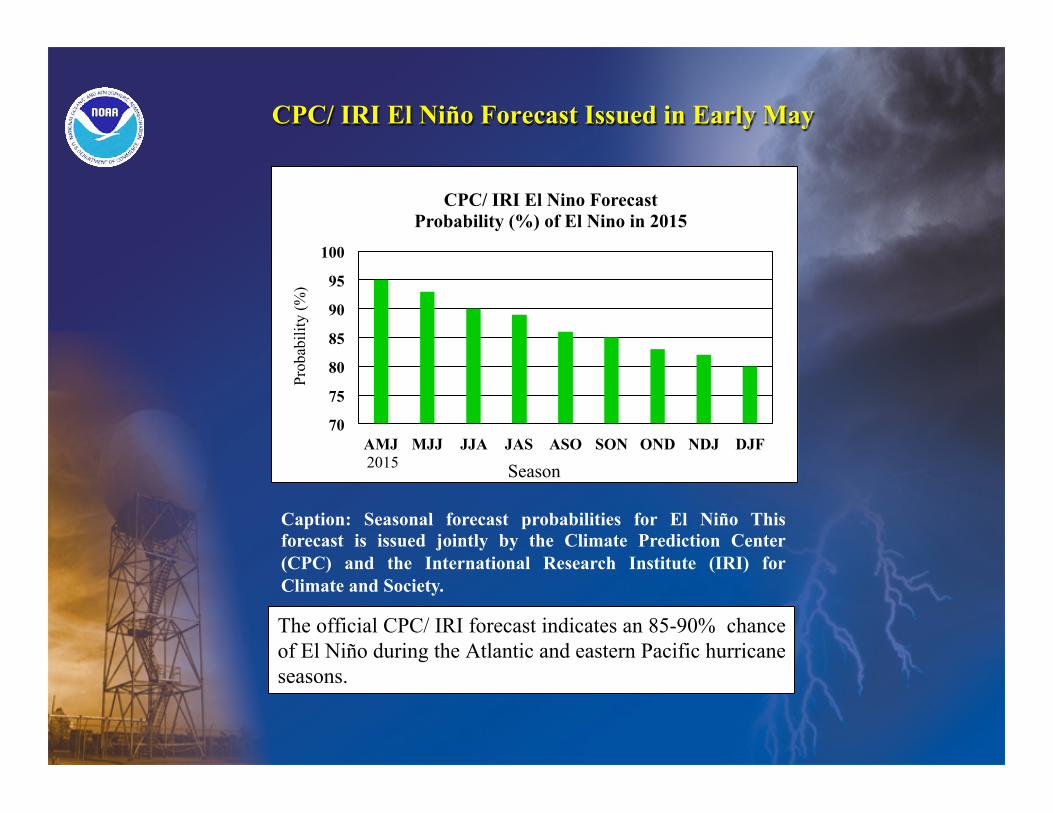
CPC/ IRI El Niño Forecast Issued in Early May
The official CPC/ IRI forecast indicates an 85-90% chance of El Niño during the Atlantic and eastern Pacific hurricane seasons.
Prob
abili
ty (%
)
Season
70
75
80
85
90
95
100
AMJ MJJ JJA JAS ASO SON OND NDJ DJF
CPC/ IRI El Nino Forecast Probability (%) of El Nino in 2015
2015
Caption: Seasonal forecast probabilities for El Niño This forecast is issued jointly by the Climate Prediction Center (CPC) and the International Research Institute (IRI) for Climate and Society.

Model SST Anomaly Forecasts for Niño-3.4 Region
Season
Most models predict El Niño to persist throughout the hurricane season, with the dynamical model average (thick orange line) predicting a strong event (≥1.5oC) and the statistical model average (thick green line) predicting a borderline moderate strength event (1oC).
Caption: Model predicted seasonal SST anomalies (oC) for the equatorial Pacific Ocean Niño-3.4 region (see inset, between 170oW-120oW, 5oN-5oS). Colored lines correspond to the models indicated at right. NOAA’s thresholds for El Niño, Neutral, and La Niña, are shown in pink, yellow, and blue, shading, respectively.
Season
Neutral
El Niño
La Niña Niñ
o 3.
4 SS
T A
nom
aly
(o C)
Niño 3.4 Region
Dynamical (DYN) Model
Statistical (STAT) Model
Dynamical Model Average
Statistical Model Average