annual summary atlantic hurricane season of 2004
TRANSCRIPT

ANNUAL SUMMARY
Atlantic Hurricane Season of 2004
JAMES L. FRANKLIN, RICHARD J. PASCH, LIXION A. AVILA, JOHN L. BEVEN II, MILES B. LAWRENCE,STACY R. STEWART, AND ERIC S. BLAKE
Tropical Prediction Center, National Hurricane Center, NOAA/NWS, Miami, Florida
(Manuscript received 16 March 2005, in final form 1 August 2005)
ABSTRACT
The 2004 Atlantic hurricane season is summarized, and the year’s tropical and subtropical cyclones aredescribed. Fifteen named storms, including six “major” hurricanes, developed in 2004. Overall activity wasnearly two and a half times the long-term mean. The season was one of the most devastating on record,resulting in over 3100 deaths basinwide and record property damage in the United States.
1. Introduction
The 2004 Atlantic hurricane season was among themost devastating on record. The year’s storms claimedover 3100 lives, the second largest toll in three decades;60 of these occurred in the United States. The UnitedStates suffered a record $45 billion in property damage,enduring landfalls from five hurricanes (Charley,Frances, Gaston, Ivan, and Jeanne) and the eyewallpassage of a sixth (Alex) that avoided landfall on theNorth Carolina Outer Banks by less than 10 miles. Inaddition, Bonnie, Hermine, and Matthew made landfallin the United States as tropical storms. Florida, the“Sunshine State,” became known as the Plywood Stateafter being battered by Charley, Frances, Ivan, andJeanne. The islands of the Caribbean were also hardhit. Charley struck Cuba as a major hurricane [maxi-mum 1-min winds of greater than 96 kt (1 kt � 0.5144m s�1), corresponding to category 3 or higher on theSaffir–Simpson hurricane scale (Saffir 1973; Simpson1974)]. Ivan was also a major hurricane in the Carib-bean, causing extensive destruction on Grenada, Ja-maica, and Grand Cayman, and Jeanne produced cata-strophic flash floods in Haiti that killed thousands andleft hundreds of thousands homeless.
Fifteen named storms developed in 2004, includingNicole, a subtropical storm (Table 1; Fig. 1). Nine of the
named systems became hurricanes, and of these, sixbecame major hurricanes. One additional tropical de-pression did not reach storm strength. These totals areconsiderably above the long-term (1944–2003) meansof 10.2 named storms, 6.0 hurricanes, and 2.6 majorhurricanes. August alone saw the formation of eighttropical storms, a new record for that month. The sea-son also featured intense and long-lived hurricanes.Ivan, a category 5 storm, twice reached a minimumpressure of 910 mb, a value surpassed by only five otherprevious tropical cyclones in the Atlantic basin histori-cal record. In addition, Ivan was a major hurricane fora total of 10 days, a new record for a single storm sincereliable records began in 1944. In terms of “accumu-lated cyclone energy” (ACE; the sum of the squares ofthe maximum wind speed at 6-h intervals for tropicalstorms and hurricanes), overall activity this year was234% of the long-term (1944–2003) mean. Only twoseasons since 1944 (1950 and 1995) have had higherACE values. The 2-month period of August–September 2004 registered the highest 2-month ACEaccumulation on record.
The above-normal levels of activity in 2004 continueda tendency that began in 1995 for greater numbers ofstorms. This appears to be due, in part, to sea surfacetemperatures (SSTs) over the North Atlantic Oceanthat have been considerably warmer during the past 10yr than during the preceding decade. In fact, 2004 wasthe second warmest year since 1948, as measured bySSTs between 10° and 20°N in the tropical AtlanticOcean and Caribbean Sea during the peak months ofthe hurricane season. SST anomalies for August and
Corresponding author address: James L. Franklin, Tropical Pre-diction Center, National Hurricane Center, NOAA/NWS, 11691SW 17th Street, Miami, FL 33165-2149.E-mail: [email protected]
MARCH 2006 A N N U A L S U M M A R Y 981

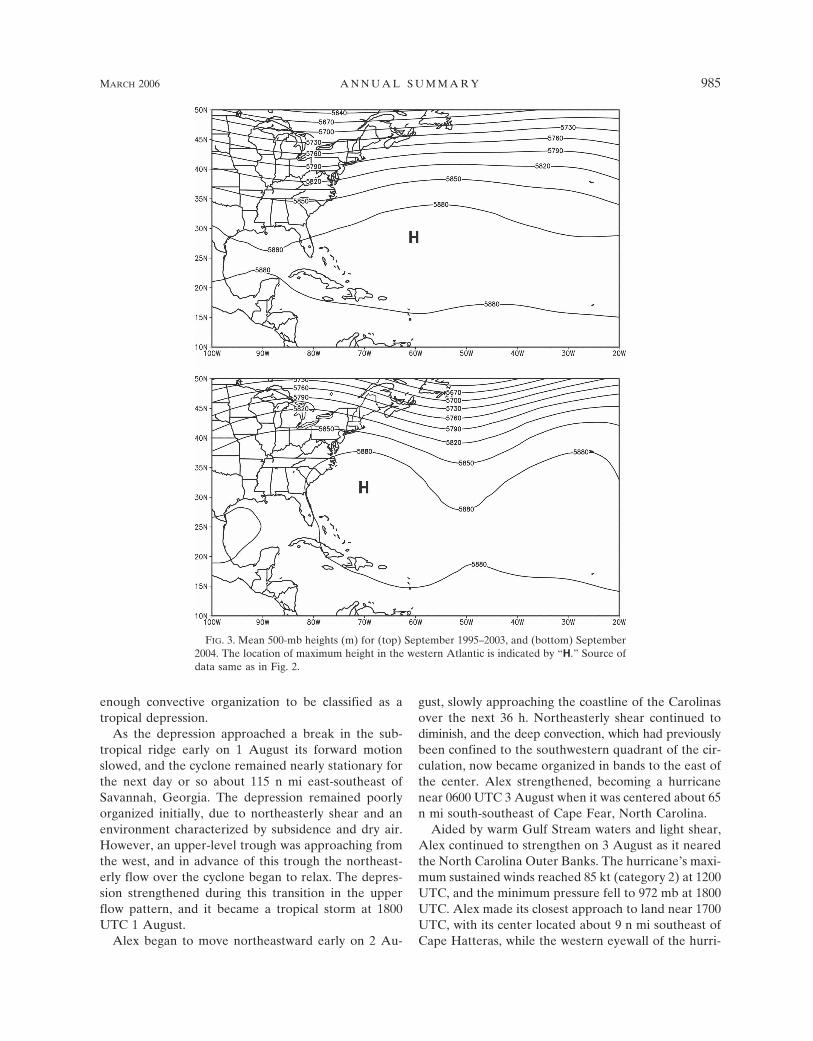
September 2004 are given in Fig. 2. It can be seen thatnearly the entire tropical Atlantic during the peak ofthe hurricane season was warmer than normal, the ex-ception being cool anomalies in the extreme westernAtlantic that largely reflect up-welling from Francesand Jeanne. Particularly large anomalies were presentin the eastern Atlantic north of 15°N; these may havecontributed to an unusually favorable thermodynamicenvironment for tropical waves. Large-scale steeringpatterns in 2004, however, differed significantly fromthose occurring over much of the past decade, whichhad been characterized by a midlevel trough near theeastern coast of the United States that took manystorms out to sea before they could make landfall. Incontrast, persistent high pressure over the easternUnited States and the western Atlantic during 2004(Fig. 3) kept this year’s storms on more westerly tracks.The season also featured lower than normal verticalwind shear over the Caribbean Sea and western Atlan-tic (Fig. 4); this combination allowed hurricanes ap-proaching the Caribbean and North America to main-tain much of their intensity. It remains to be seen whetherthe synoptic-scale patterns observed during 2004 rep-resent a 1-yr anomaly or something more ominous.
2. Storm and hurricane summaries
The individual cyclone summaries that follow arebased on the National Hurricane Center’s (NHC) post-storm meteorological analyses of a wide variety of (of-ten contradictory) data types described below. Theseanalyses result in the creation of a “best track” data-base for each storm, consisting of 6-hourly representa-
tive estimates of the cyclone’s center location, maxi-mum sustained (1-min average) surface (10 m) wind,minimum sea level pressure, and maximum extent of34-, 50-, and 64-kt winds in each of four quadrantsaround the center. The life cycle of each cyclone (cor-responding to the dates given in Table 1) is defined toinclude the tropical or subtropical depression stage, butdoes not include remnant low or extratropical stages.The tracks for the season’s tropical storms and hurri-canes are shown in Fig. 1 (see http://nhc.noaa.gov/pastall.shtml).1
For storms east of 55°W longitude, or those notthreatening land, the primary (and often sole) source ofinformation is geostationary and polar-orbiting weathersatellite imagery, interpreted using the Dvorak (1984)technique. For systems posing a threat to land, in situobservations are also generally available from aircraftreconnaissance flights conducted by the 53rd WeatherReconnaissance Squadron (“Hurricane Hunters”) ofthe Air Force Reserve Command (AFRC), and by theNational Oceanic and Atmospheric Administration(NOAA) Aircraft Operations Center (AOC). Duringreconnaissance flights, minimum sea level pressures areeither measured by dropsondes released at the circula-tion center or extrapolated hydrostatically from flightlevel. Surface (or very near surface) winds in the eye-
1 Tabulations of the 6-hourly best-track positions and intensitiescan be found in the NHC Tropical Cyclone reports. These reportscontain storm information omitted here due to limitations ofspace, including additional surface observations and a forecastand warning critique.
TABLE 1. 2004 Atlantic hurricane season statistics.
No. Name Classa DatesbMaximum
1-min wind (kt)Minimum sea
level pressure (mb) Direct deathsU.S. damage($ million)
1 Alex H 31 Jul–6 Aug 105 957 1 52 Bonnie T 3–13 Aug 55 1001 3 Minorc
3 Charley H 9–14 Aug 125 941 15 15,0004 Danielle H 13–21 Aug 95 9645 Earl T 13–15 Aug 45 10096 Frances H 25 Aug–8 Sep 125 935 8 89007 Gaston H 27 Aug–1 Sep 65 985 8 1308 Hermine T 27–31 Aug 50 10029 Ivan H 2–24 Sep 145 910 92 14,200
10 Jeanne H 13–28 Sep 105 950 3000� 6,90011 Karl H 16–24 Sep 125 93812 Lisa H 19 Sep–3 Oct 65 98713 Matthew T 8–10 Oct 40 997 Minorc
14 Nicole ST 10–11 Oct 45 98615 Otto T 29 Nov–3 Dec 45 995
a T � tropical storm and ST � subtropical storm, wind speed 34–63 kt (17–32 m s�1); H � hurricane, wind speed 64 kt (33 m s�1) or higher.b Dates begin at 0000 UTC and include tropical and subtropical depression stages but exclude extratropical stage.c Only minor damage was reported, but the extent of the damage was not quantified.
982 M O N T H L Y W E A T H E R R E V I E W VOLUME 134

wall or maximum wind band are often measured di-rectly using GPS dropwindsondes (Hock and Franklin1999), but more frequently are estimated from flight-level winds using empirical relationships derived from a3-yr sample of GPS dropwindsonde data (Franklin etal. 2003). During NOAA reconnaissance missions, sur-face winds can be estimated remotely using theStepped-Frequency Microwave Radiometer (SFMR)instrument (Uhlhorn and Black 2003). When available,satellite and reconnaissance data are supplemented byconventional land-based surface and upper-air observa-tions, ship and buoy reports, and weather radars. In keyforecast situations, the kinematic and thermodynamicstructure of the storm environment is obtained fromdropsondes released during operational “synoptic sur-veillance” flights of NOAA’s Gulfstream IV jet aircraft(Aberson and Franklin 1999).
Several satellite-based remote sensors play an impor-tant role in the analysis of tropical weather systems.Foremost of these is multichannel passive microwaveimagery [e.g., from the Tropical Rainfall Measuring
Mission (TRMM) satellite], which over the past decadehas provided radar-like depictions of systems’ convec-tive structure (Hawkins et al. 2001) and is of great helpin assessing system location and organization. The Sea-Winds scatterometer on board the Quick Scatterometer(QuikSCAT) satellite (Tsai et al. 2000) provides sur-face winds over large oceanic swaths. While the Quik-SCAT generally does not have the horizontal resolu-tion to determine a hurricane’s maximum winds, it cansometimes be used to estimate the intensity of weakersystems and to determine the extent of tropical-storm-force winds. In addition, it can be helpful in determin-ing whether an incipient tropical cyclone has acquired aclosed surface circulation. Finally, information on thethermal structure of cyclone cores is provided by theAdvanced Microwave Sounder Unit (AMSU; Veldenand Brueske 1999). Intensity estimates derived fromsuch data can in some cases be superior to Dvorakclassifications (Herndon and Velden 2004).
A number of organizations have developed Web sitesthat have proven to be extremely helpful for tropical
FIG. 1. Tracks of tropical storms, hurricanes, and subtropical storms in the Atlantic basin in 2004.
MARCH 2006 A N N U A L S U M M A R Y 983

cyclone forecasting and postanalysis. These include theNaval Research Laboratory (NRL) Monterey MarineMeteorology Division Tropical Cyclone Page (http://www.nrlmry.navy.mil/tc_pages/tc_home.html), with itscomprehensive suite of microwave products; the cy-clone phase diagnostics page of Florida State Univer-sity (http://moe.met.fsu.edu/cyclonephase/), which isfrequently consulted to help categorize systems astropical, subtropical, or nontropical; and the tropicalcyclone page of the University of Wisconsin/Cooper-ative Institute for Meteorological Satellite Studies (http://cimss.ssec.wisc.edu/tropic/tropic.html), which containsa variety of useful satellite-based synoptic analyses.
In the cyclone summaries below, U.S. damage esti-mates have been generally estimated by doubling theinsured losses reported by the American InsurancesService Group (AISG) for events exceeding their mini-mum reporting threshold ($25 million). The reader iscautioned, however, that the uncertainty in estimatingmeteorological parameters for tropical cyclones palesin comparison to the uncertainty in determining thecost of the damage caused by these cyclones when theymake landfall. Descriptions of the type and scope ofdamage are taken from a variety of sources, includinglocal government officials, media reports, and local Na-tional Weather Service (NWS) Weather Forecast Of-fices (WFOs) in the affected areas. Tornado counts arebased on reports provided by the WFOs. Hard copiesof these various reports are archived at the NHC.
Although specific dates and times in these summariesare given in coordinated universal time (UTC), localtime is implied whenever general expressions such as“afternoon,” “midday,” etc. are used.
a. Hurricane Alex: 31 July–6 August
Alex brought category 1 hurricane conditions to theNorth Carolina Outer Banks as its center passed justoffshore, and later strengthened to a category 3 hurri-cane at an unusually high latitude.
1) SYNOPTIC HISTORY
Three distinct weather systems may have played arole in the genesis of Alex. On 26 July, shower activityincreased several hundred miles to the east of thenorthwestern Bahamas. This activity was associatedwith a weak surface trough, likely of midlatitude origin.Disorganized showers persisted just to the east of theBahamas, in the diffluent region to the east of an upper-level low, for the next couple of days. On 28 July, whena tropical wave reached the area, the extent and orga-nization of the convection began to increase. Analysesshow that a broad area of surface low pressure formedearly on 30 July just northeast of the central Bahamas.The low moved northwestward, and over the next 36 hthe circulation slowly became better defined. By 1800UTC 31 July, when the low center was located about175 n mi east of Jacksonville, Florida, the system had
FIG. 2. Anomaly from the long-term (1968–96) mean of sea surface temperature (°C) forAugust–September 2004. Negative anomalies (below-normal temperatures) are shaded. Dataprovided by the NOAA–Cooperative Institute for Research in Environmental Sciences Cli-mate Diagnostics Center, Boulder, CO (http://www.cdc.noaa.gov/), based on the NationalCenters for Environmental Prediction–National Center for Atmospheric Research (NCEP–NCAR) reanalysis project (Kistler et al. 2001).
984 M O N T H L Y W E A T H E R R E V I E W VOLUME 134
enough convective organization to be classified as atropical depression.
As the depression approached a break in the sub-tropical ridge early on 1 August its forward motionslowed, and the cyclone remained nearly stationary forthe next day or so about 115 n mi east-southeast ofSavannah, Georgia. The depression remained poorlyorganized initially, due to northeasterly shear and anenvironment characterized by subsidence and dry air.However, an upper-level trough was approaching fromthe west, and in advance of this trough the northeast-erly flow over the cyclone began to relax. The depres-sion strengthened during this transition in the upperflow pattern, and it became a tropical storm at 1800UTC 1 August.
Alex began to move northeastward early on 2 Au-
gust, slowly approaching the coastline of the Carolinasover the next 36 h. Northeasterly shear continued todiminish, and the deep convection, which had previouslybeen confined to the southwestern quadrant of the cir-culation, now became organized in bands to the east ofthe center. Alex strengthened, becoming a hurricanenear 0600 UTC 3 August when it was centered about 65n mi south-southeast of Cape Fear, North Carolina.
Aided by warm Gulf Stream waters and light shear,Alex continued to strengthen on 3 August as it nearedthe North Carolina Outer Banks. The hurricane’s maxi-mum sustained winds reached 85 kt (category 2) at 1200UTC, and the minimum pressure fell to 972 mb at 1800UTC. Alex made its closest approach to land near 1700UTC, with its center located about 9 n mi southeast ofCape Hatteras, while the western eyewall of the hurri-
FIG. 3. Mean 500-mb heights (m) for (top) September 1995–2003, and (bottom) September2004. The location of maximum height in the western Atlantic is indicated by “H.” Source ofdata same as in Fig. 2.
MARCH 2006 A N N U A L S U M M A R Y 985

cane raked the Outer Banks with sustained category 1hurricane-force winds.
After passing the Outer Banks, Alex turned awayfrom land and accelerated as it became embedded in adeep layer of west-southwesterly flow. Alex strength-ened and became a major hurricane at 0000 UTC 5August, with winds of 105 kt and a minimum pressureof 957 mb. At this time Alex was at 38.5°N latitude (385n mi south-southwest of Halifax, Nova Scotia, Canada),moving east-northeastward at 20–25 kt, and over watersjust above 26°C—factors not normally associated withmajor hurricanes. Only Hurricane Ellen of 1973 at-tained major hurricane status farther to the north.While the basic environmental current surroundingAlex was low in shear, the unexpected strengthening ofAlex remains difficult to explain.
By late on 5 August Alex had moved north of theGulf Stream over sub-20°C waters and was weakeningrapidly. Moving at 40–45 kt, Alex weakened to a tropi-cal storm after 0600 UTC 6 August and became extra-tropical a few hours later about 830 n mi east of CapeRace, Newfoundland, Canada. The circulation of Alexwas absorbed into a larger extratropical low by 0000UTC 7 August.
2) METEOROLOGICAL STATISTICS
Although the center of Alex remained offshore (andtherefore the hurricane technically did not make land-fall), the western portion of the eyewall passed over theNorth Carolina Outer Banks on 3 August. There was arelatively high density of surface observations in thearea for this event, and these observations (Table 2)generally indicate that category 1 sustained winds wereexperienced in the Outer Banks. The highest gust ac-
cepted as accurate was an unofficial report from astorm chaser of 91 kt in Hatteras Village at 1814 UTC,with a maximum sustained wind report of 67 kt at aboutthe same time. A 5-min mean wind of 65 kt was re-ported from a 10-m anemometer at Avon Pier. Notincluded in the table is an unofficial gust report of 104kt at the Ocracoke Ferry office, believed to be in errorbased on nearby storm-chaser observations as well asthe nature of the damage. As Alex brushed past theOuter Banks, its maximum sustained winds offshorewere near 85 kt, an estimate based largely on drop-sonde surface observations of 77 and 87 kt. The highestobserved flight-level wind was 105 kt. Alex reached itsestimated maximum intensity after all reconnaissanceflights had ended; the peak wind estimate of 105 kt isbased on a blend of subjective and objective Dvoraknumbers (Velden et al. 1998).
The highest estimated surge values, near 1.8 m, oc-curred on the sound (west) side of the Outer Banks atBuxton and Ocracoke Village. Waters rose to 1 mabove normal levels along the lower reaches of theNeuse and Pamlico Rivers.
The highest measured rainfall amount associatedwith Alex, 192 mm, occurred at Ocracoke, with 143 mmreported in Beaufort. Doppler radar data indicated alarge area of 100–200-mm accumulations across ex-treme southeastern Craven County, eastern CarteretCounty, and extending northeastward across Hyde andDare Counties.
3) CASUALTY AND DAMAGE STATISTICS
A 26-yr-old male drowned in strong waves and re-sidual rip currents off Nags Head, North Carolina, twodays after the passage of Alex.
FIG. 4. Anomaly from the long-term (1971–2000) mean of 200–850-mb vertical wind shear(kt) for August–September 2004. Negative anomalies given by dashed contours. Source ofdata same as in Fig. 2.
986 M O N T H L Y W E A T H E R R E V I E W VOLUME 134

Storm surge damage and beach erosion was signifi-cant in Dare and Hyde Counties on the Outer Banks.Significant wind and water damage occurred from Bux-ton southward and across Ocracoke Island, where hun-dreds of vehicles and homes were flooded from sound-side surge. Hurricane-force winds produced minorstructural damage to homes and businesses and causedextensive damage to trees and power lines. Insureddamage from flooding was estimated to be about $2million. The state of North Carolina estimated damageto public facilities in Dare and Hyde Counties to benear $767,000, and officials in Dare County estimatedtotal damage there at near $2.4 million. The total dam-age from Alex is estimated to be not more than $5million.
b. Tropical Storm Bonnie: 3–13 August
Bonnie developed from a tropical wave that crossedDakar, Senegal, on 29 July and moved westward for
several days accompanied by cloudiness, thunder-storms, and a well-defined cyclonic rotation at themidlevels. The shower activity became concentrated,and the system developed convective bands as it movedwestward, becoming a tropical depression at 1200 UTC3 August when the system was located about 360 n mieast of Barbados in the Lesser Antilles. However, thedepression was moving westward rapidly, near 20 kt,and could not maintain a closed surface circulation. Thesystem degenerated to an open wave on 4 August in theeastern Caribbean Sea, and the depression’s remnantsmoved through the central Caribbean Sea over the nextfew days. Once the system reached the western Carib-bean Sea, the forward motion slowed and persistentconvection redeveloped. It is estimated that a smallclosed circulation reformed about 100 n mi southeast ofthe western tip of Cuba at 1200 UTC 8 August.
The regenerated depression moved west-northwest-ward across the Yucatan Channel and became a tropi-cal storm near the northeastern tip of the Yucatan Pen-
TABLE 2. Selected surface observations for Hurricane Alex, 31 Jul–6 Aug.
Location
Minimum sea level pressure Maximum surface wind speedStormsurge(m)c
Stormtide(m)d
Totalrain
(mm)Date/time
(UTC)Pressure
(mb)Date/time
(UTC)aSustained
(kt)bGust(kt)
North CarolinaCape Hatteras (HSE) 03/1551 991.2e 03/1623 38e 53Beaufort (MRH) 03/1356 999.2 03/1336 35 46 142.7Ocracoke 191.8Newport 73.2Buxton 1.8Ocracoke Village 1.8
North Carolina (unofficial)Wrightsville Beach Pier 03/ 34Hatteras Village 03/1810 981 03/1814 67 91Avon 03/1715 76e
Avon Pier 03/1735 65f 78Avon (Sound) 03/1900 64f 80Kure Beach 03/0900 34Bald Head Island 03/ 37
Buoys/C-MAN sites41025 03/1600 990.7e 03/1600 47e 6241013 03/0750 994.9 03/0710 35 4544140 05/2200 979.3Cape Lookout (CLKN7) 03/1300 994.7 03/1400 51 56Frying Pan Shoals (FPSN7) 03/1300 994.8 03/0900 33 45Duck (DUCN7) 03/2100 1002.7 03/1900 39 43 1.6g
a Date/time is for sustained wind when both sustained and gust are listed.b Except as noted, sustained wind averaging periods for C-MAN and land-based ASOS reports are 2 min; buoy averaging periods are
8 min.c Storm surge is water height above normal astronomical tide level.d Storm tide is water height above National Geodetic Vertical Datum (1929 mean sea level).e Record incomplete due to instrument failure.f Five-minute average.g Water height above mean lower low water.
MARCH 2006 A N N U A L S U M M A R Y 987

insula on 9 August. Bonnie moved into the central Gulfof Mexico and then turned northeastward on 11 Au-gust, reaching its maximum intensity of 55 kt and 1001mb at 1800 UTC that day. Strong southwesterly windshear then became established over Bonnie and thecyclone began to weaken. Bonnie made landfall justsouth of Apalachicola, Florida, near St. Vincent and St.George Islands, around 1400 UTC 12 August withmaximum winds near 40 kt. After moving inland, Bon-nie weakened to a tropical depression and continued tomove northeastward across eastern Georgia and theCarolinas. Bonnie produced roughly 30 tornadoes overthe southeastern United States, and one of these re-sulted in three deaths in Pender County, North Caro-lina. Deep convection gradually diminished and Bonniedegenerated to a weak remnant low just south of CapeCod, Massachusetts, on 14 August before becoming ab-sorbed within a frontal boundary.
A reconnaissance mission into Bonnie late on 9 Au-gust is notable for its report of a closed eyewall 8 n miin diameter at 2154 UTC. This feature was also ob-served in images from the Cancun, Mexico, radar ear-lier in the day (not shown). Yet the aircraft-estimatedminimum central pressure was only 1006 mb and thehighest 1500-ft flight-level winds encountered wereonly 56 kt, suggesting that Bonnie was at best a mod-erate tropical storm despite its apparent mesoscale or-
ganization. Tropical-storm-force winds at this timewere limited to an area within about 25 n mi of thecenter. A reconnaissance flight on 12 August is also ofinterest for its encounter with a mesocyclone withinBonnie’s circulation. At 0941 UTC, in the middle ofBonnie’s weakening trend, the aircraft reported a mini-mum pressure of 995 mb sandwiched between values of1010 and 1007 mb (at 0526 and 1123 UTC, respec-tively).
Selected surface observations for Bonnie are given inTable 3.
c. Hurricane Charley: 9–14 August
Hurricane Charley strengthened rapidly just beforestriking the southwestern coast of Florida as a category4 hurricane. Charley was the strongest hurricane to hitthe United States since Andrew in 1992 and, althoughsmall in size, caused catastrophic wind damage in Char-lotte County, Florida. Serious damage occurred wellinland over the Florida peninsula.
1) SYNOPTIC HISTORY
A tropical wave emerged from western Africa on 4August. Radiosonde data from Dakar showed that thiswave was accompanied by an easterly jet streak ofaround 55 kt near the 650-mb level, and the wave pro-
TABLE 3. Selected surface observations for Tropical Storm Bonnie, 3–13 Aug 2004.
Location
Minimum sea level pressure Maximum surface wind speedStormsurge(m)c
Stormtide(m)d
Totalrain
(mm)Date/time
(UTC)Pressure
(mb)Date/time
(UTC)aSustained
(kt)bGust(kt)
FloridaApalachicola NOAA/National Ocean
Service (NOS) 0.3 0.8Cedar Key NOS 0.6 1.6Cross City (KCTY) 81.8Gainesville (KGNV) 12/1636 1010.2 12/1752 23 34 3.0Perry (K40J) 79.0
Florida (unofficial)Alligator Point (Bald Point) 12/1629 1005.6 12/1140 30 35 34.3Mary Esther (Florosa Elementary
School) 12/1214 1010.2 12/0627 34
Buoys/C-MAN42001 11/1440 51 6642036 12/1450 1009.5 12/1520 31 3542039 12/1250 1002.9 12/1030 37 47SGOF1 12/1600 1008.5 12/1300 32 40
a Date/time is for sustained wind when both sustained and gust are listed.b Except as noted, sustained wind averaging periods for C-MAN and land-based ASOS reports are 2 min; buoy averaging periods are
8 min.c Storm surge is water height above normal astronomical tide level.d Storm tide is water height above National Geodetic Vertical Datum (1929 mean sea level).
988 M O N T H L Y W E A T H E R R E V I E W VOLUME 134
duced 24-h surface pressure falls of �5 mb near thewest coast of Africa. However, the initial satellite pre-sentation of this system was not particularly impressive,showing only a small area of associated deep convec-tion. As the wave progressed rapidly westward acrossthe tropical Atlantic, the cloud pattern gradually be-came better organized, with cyclonic turning becomingmore evident in the low clouds. Curved banding of thedeep convection became better defined early on 9 Au-gust, and this, along with surface observations from thesouthern Windward Islands, indicated that a tropicaldepression had formed about 100 n mi south-southeastof Barbados by 1200 UTC 9 August.
Late on 9 August, the depression moved into thesoutheastern Caribbean Sea. A strong deep-layer highpressure area to the north of the cyclone induced a swiftwest-northwestward motion of 20–25 kt. With low ver-tical shear and well-established upper-level outflow, thedepression strengthened into a tropical storm early on10 August. Fairly steady strengthening continued whilethe storm moved into the central Caribbean Sea, andwhen Charley approached Jamaica on 11 August, itbecame a hurricane. By this time, the forward speedhad slowed to about 14 kt. Charley’s center passedabout 35 n mi southwest of Jamaica around 0000 UTC12 August. The hurricane then turned northwestwardand headed for the Cayman Islands and western Cuba.It continued to strengthen, reaching category 2 statusaround 1500 UTC 12 August, just after passing about15 n mi northeast of Grand Cayman.
As Charley neared the western periphery of amidtropospheric ridge, it turned toward the north-northwest, its center passing about 20 n mi east of theIsle of Youth at 0000 UTC 13 August. Charleystrengthened just before it hit western Cuba, the eyecrossing the coast very near Playa del Cajio around0430 UTC 13 August. Cuban radar and microwave im-agery suggest that the eye shrank in size, and surfaceobservations from Cuba indicate that maximum windswere about 105 kt as the hurricane crossed the island.By 0600 UTC, the eye was emerging from the northcoast of Cuba about 12 n mi west of Havana. Aerialreconnaissance observations indicate that Charley thenweakened slightly over the lower Straits of Florida.Turning northward, the hurricane passed over the DryTortugas around 1200 UTC 13 August with maximumwinds near 95 kt.
By the time Charley reached the Dry Tortugas, itcame under the influence of an unseasonably strongdeep-layer trough that had dropped from the east-central United States into the eastern Gulf of Mexico.In response to the steering flow on the southeast side ofthis trough, the hurricane turned north-northeastward
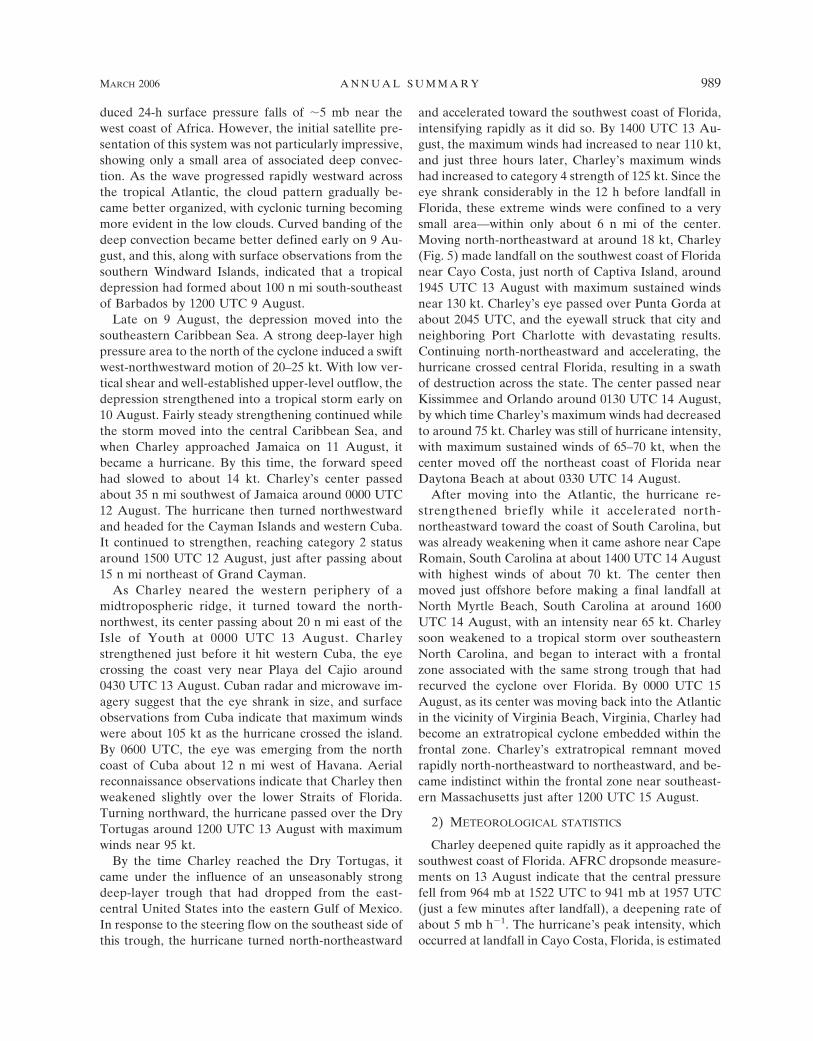
and accelerated toward the southwest coast of Florida,intensifying rapidly as it did so. By 1400 UTC 13 Au-gust, the maximum winds had increased to near 110 kt,and just three hours later, Charley’s maximum windshad increased to category 4 strength of 125 kt. Since theeye shrank considerably in the 12 h before landfall inFlorida, these extreme winds were confined to a verysmall area—within only about 6 n mi of the center.Moving north-northeastward at around 18 kt, Charley(Fig. 5) made landfall on the southwest coast of Floridanear Cayo Costa, just north of Captiva Island, around1945 UTC 13 August with maximum sustained windsnear 130 kt. Charley’s eye passed over Punta Gorda atabout 2045 UTC, and the eyewall struck that city andneighboring Port Charlotte with devastating results.Continuing north-northeastward and accelerating, thehurricane crossed central Florida, resulting in a swathof destruction across the state. The center passed nearKissimmee and Orlando around 0130 UTC 14 August,by which time Charley’s maximum winds had decreasedto around 75 kt. Charley was still of hurricane intensity,with maximum sustained winds of 65–70 kt, when thecenter moved off the northeast coast of Florida nearDaytona Beach at about 0330 UTC 14 August.
After moving into the Atlantic, the hurricane re-strengthened briefly while it accelerated north-northeastward toward the coast of South Carolina, butwas already weakening when it came ashore near CapeRomain, South Carolina at about 1400 UTC 14 Augustwith highest winds of about 70 kt. The center thenmoved just offshore before making a final landfall atNorth Myrtle Beach, South Carolina at around 1600UTC 14 August, with an intensity near 65 kt. Charleysoon weakened to a tropical storm over southeasternNorth Carolina, and began to interact with a frontalzone associated with the same strong trough that hadrecurved the cyclone over Florida. By 0000 UTC 15August, as its center was moving back into the Atlanticin the vicinity of Virginia Beach, Virginia, Charley hadbecome an extratropical cyclone embedded within thefrontal zone. Charley’s extratropical remnant movedrapidly north-northeastward to northeastward, and be-came indistinct within the frontal zone near southeast-ern Massachusetts just after 1200 UTC 15 August.
2) METEOROLOGICAL STATISTICS
Charley deepened quite rapidly as it approached thesouthwest coast of Florida. AFRC dropsonde measure-ments on 13 August indicate that the central pressurefell from 964 mb at 1522 UTC to 941 mb at 1957 UTC(just a few minutes after landfall), a deepening rate ofabout 5 mb h�1. The hurricane’s peak intensity, whichoccurred at landfall in Cayo Costa, Florida, is estimated
MARCH 2006 A N N U A L S U M M A R Y 989
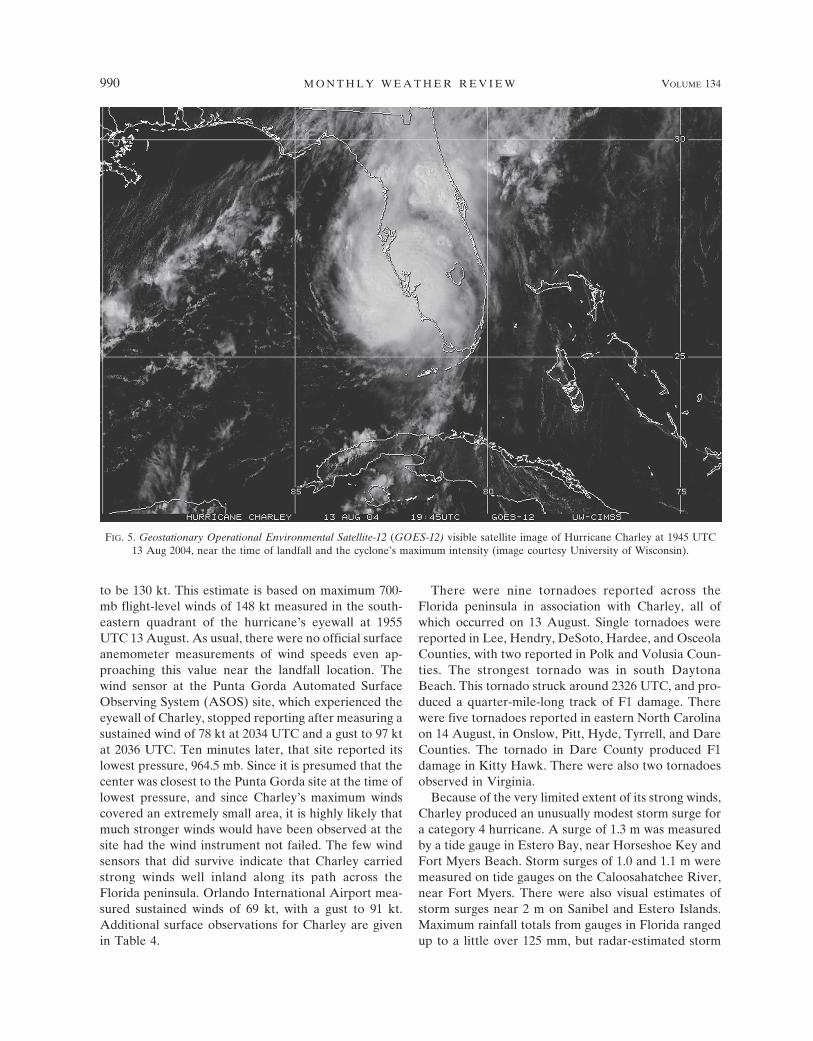
to be 130 kt. This estimate is based on maximum 700-mb flight-level winds of 148 kt measured in the south-eastern quadrant of the hurricane’s eyewall at 1955UTC 13 August. As usual, there were no official surfaceanemometer measurements of wind speeds even ap-proaching this value near the landfall location. Thewind sensor at the Punta Gorda Automated SurfaceObserving System (ASOS) site, which experienced theeyewall of Charley, stopped reporting after measuring asustained wind of 78 kt at 2034 UTC and a gust to 97 ktat 2036 UTC. Ten minutes later, that site reported itslowest pressure, 964.5 mb. Since it is presumed that thecenter was closest to the Punta Gorda site at the time oflowest pressure, and since Charley’s maximum windscovered an extremely small area, it is highly likely thatmuch stronger winds would have been observed at thesite had the wind instrument not failed. The few windsensors that did survive indicate that Charley carriedstrong winds well inland along its path across theFlorida peninsula. Orlando International Airport mea-sured sustained winds of 69 kt, with a gust to 91 kt.Additional surface observations for Charley are givenin Table 4.
There were nine tornadoes reported across theFlorida peninsula in association with Charley, all ofwhich occurred on 13 August. Single tornadoes werereported in Lee, Hendry, DeSoto, Hardee, and OsceolaCounties, with two reported in Polk and Volusia Coun-ties. The strongest tornado was in south DaytonaBeach. This tornado struck around 2326 UTC, and pro-duced a quarter-mile-long track of F1 damage. Therewere five tornadoes reported in eastern North Carolinaon 14 August, in Onslow, Pitt, Hyde, Tyrrell, and DareCounties. The tornado in Dare County produced F1damage in Kitty Hawk. There were also two tornadoesobserved in Virginia.
Because of the very limited extent of its strong winds,Charley produced an unusually modest storm surge fora category 4 hurricane. A surge of 1.3 m was measuredby a tide gauge in Estero Bay, near Horseshoe Key andFort Myers Beach. Storm surges of 1.0 and 1.1 m weremeasured on tide gauges on the Caloosahatchee River,near Fort Myers. There were also visual estimates ofstorm surges near 2 m on Sanibel and Estero Islands.Maximum rainfall totals from gauges in Florida rangedup to a little over 125 mm, but radar-estimated storm
FIG. 5. Geostationary Operational Environmental Satellite-12 (GOES-12) visible satellite image of Hurricane Charley at 1945 UTC13 Aug 2004, near the time of landfall and the cyclone’s maximum intensity (image courtesy University of Wisconsin).
990 M O N T H L Y W E A T H E R R E V I E W VOLUME 134

TABLE 4. Selected surface observations for Hurricane Charley, 9–14 Aug 2004.
Location
Minimum sea level pressure Maximum surface wind speedStormsurge(m)c
Stormtide(m)d
Totalrain
(mm)Date/time
(UTC)Pressure
(mb)Date/time
(UTC)aSustained
(kt)bGust(kt)
Grand Cayman IslandsGrand Cayman 12/1300 1008.2 12/1142 21 34 22.9Cayman Brac 12/0800 1008 12/1615 35 49 3.0
CubaPunta del Este 13/0000 1001.7 13/0100 36 45 125.7Nueva Gerona 13/0200 1006.2 13/0045 39 49 49.5San Antonio de’los Banos 13/0453 989.4 13/0453 97 115Guira de Melena 13/0459 971.6 13/0450 92 116 98.6Bauta 13/0530 971.0 84.8Playa Baracoa 13/0605 974 13/0530 103 130Santiago de las Vegas 13/0501 990.7 13/0620 63 79 106.4Casa Blanca 13/0530 1001.7 13/0630 61 76 56.4Playa Cajio 4.0
FloridaKey West (KEYW) 13/1153 1009.8 13/1413 42 50 36.6Key West Naval Air Station (NAS
(KNOX)13/1155 1010.2 13/1255 34 45 31.2
Marathon (KMTH) 13/0953 1012.4 13/1506 34 13.5Summerland Key (NWS Handar) 13/1250 29 45 7.6Big Pine Key (NWS Handar) 13/1350 31 39 9.4Naplese (KAPF) 13/1905 1004.4 13/1806 38 48 44.5Everglades City (KEGC) 13/1801 40 55Flamingo (KFLM) 13/1606 38 47Miami (KMIA) 13/1941 1013 13/1710 26 34 11.9Fort Lauderdale (KFLL) 13/1929 1010 13/1900 25 33 10.4West Palm Beach (KPBI) 13/2045 1013 13/2000 26 33 10.2Brighton Reservation Co-op 48.8Clewiston Co-op 41.9Devils Garden Co-op 44.5Marco Island Co-op 26.4Golden Gate Co-op 52.8Punta Gorda (KPGD)e 13/2046 964.5 13/2034 78 97Fort Myers (KFMY) 13/1953 998.1 13/2009 43 66Fort Myers (KRSW) 13/1957 1001.4 13/1949 53 68Winter Haven (KGIF) 13/2305 1000.3 13/2302 41 54Kissimmee (KISM)e 14/0035 53 65 132.1Orlando (KMCO)e 14/0139 984.2 14/0134 69 91 53.6Orlando (KORL)e 14/0129 980.7 14/0129 57 74 60.2Sanford (KSFB)e 14/0213 983.4 14/0210 63 80 88.6Lessburg (KLEE) 14/0158 1005.1 14/0135 29 34Patrick Air Force Base (AFB) (KCOF) 14/0044 28 43Daytona Beach (KDAB)e 14/0353 48 72 87.1Ormond Beach (KOMN) 14/0315 59 76Melbourne (KMLB) 14/0100 1010.5 14/0222 29 39 36.6Jacksonville NAS (KNIP) 14/0456 1012.4 14/0433 30 34Mayport NAS (KNRB)e 14/0529 1007.2 14/0430 37 46Fernandina Beach NOS 14/0700 1008.5 14/0742 18 28 0.3 0.8 17.0Mayport NOS 14/0700 1008.3 14/0500 30 42 0.5 0.7Vilano Beach NOS (29.9°N, 81.3°W) 14/0500 27 44Bings Landing NOS (29.6°N, 81.2°W) 14/0500 1000.6 14/0500 18 57Cresent Beach NOS (29.8°N, 81.3°W) 14/0500 26 58
Florida (unofficial)Key West Harbor 13/1200 1010.2 13/1612 32 44 0.4Cudjoe Key 13/1205 44Duck Key 13/0300 33 45Curry Hammock State Park 26.4
MARCH 2006 A N N U A L S U M M A R Y 991

TABLE 4. (Continued)
Location
Minimum sea level pressure Maximum surface wind speedStormsurge(m)c
Stormtide(m)d
Totalrain
(mm)Date/time
(UTC)Pressure
(mb)Date/time
(UTC)aSustained
(kt)bGust(kt)
Tavernier 17.8Dry Tortugas/Fort Jefferson 1.8f
Lake Okeechobee 13/2000 35Vanderbilt Beache 13/1950 73Naples 13/1930 47Moore Haven 13/2045 36North Naples 190.0Arcadia Emergency Operations
Center (EOC)13/2130 975.7 13/2140 90
Charlotte County Airport 13/2035 139Charlotte County Medical Center 13/2035 150Port Charlotte 13/2000 61Storm chaser M. Sudduth, near Port
Charlotte (27.0°N, 82.0°W)13/2057 943.6 13/2046 80 115
Storm chaser J. Leonard in PortCharlotte, near Faucet MemorialHospital
13/2051 950.0
Storm chaser M. Theiss, nearCharlotte Harbor
13/2042 942.0
Storm chaser J. Edds in Punta Gorda 13/2042f 943.0Big Carlos Pass (Lee County)
(26.4°N, 81.9°W)13/1954 997.1 13/1936 60 83
Plant City 13/2355 54Fort Myers Beach 13/1930 56Fort Myers 13/2023 83Cape Coral 13/1940 78Matanzas Pass Fort Myers Beach 1.8Estero Bay Horseshoe Key 1.4Port Boca Grand 1.3Sarasota 13/2119 44Lakeland 13/2336 50Haines City 13/2325 67Lake Wales (10 miles east) 13/2300 65Poinciana 14/0000 39Archbold 13/2100 49National Aeronautics and Space
Administration (NASA) WindTower 421 (28.78°N, 80.8°W)
14/0250 56 75
NASA Wind Tower 22 (28.8°N 80.8°W) 14/0250 53 75Daytona Beach International
Airport wind shear14/0325 84
Four miles southwest of Wimauma 1005.8 13/2200 35 48 0.7
South Florida Water ManagementDistrict stations
WRWX (28.05°N, 81.40°W) 14/0015 991.3 13/2116 57S65DWX (27.31°N, 81.02°W) 13/2306 50S61W (28.14°N, 81.35°W) 14/0030 990.7 14/0028 78S65CW (27.40°N, 81.11°W) 13/2242 50S65DWX (27.31°N, 81.02°W) 13/2216 50L001 (27.14°N, 80.79°W) 13/2234 46
GeorgiaSt. Simons Island (KSSI) 14/0723 1009.5 14/0654 18 22 0.2 1.2Baxley Co-op 13.0
South CarolinaCharleston (KCHS) 14/1258 1008 14/1322 25 33 25.9North Myrtle Beach (KCRE) 14/1609 998 14/1538 36 50 38.6
992 M O N T H L Y W E A T H E R R E V I E W VOLUME 134
TABLE 4. (Continued)
Location
Minimum sea level pressure Maximum surface wind speedStormsurge(m)c
Stormtide(m)d
Totalrain
(mm)Date/time
(UTC)Pressure
(mb)Date/time
(UTC)aSustained
(kt)bGust(kt)
Myrtle Beach (KMYR) 14/1550 35 45Myrtle Beach (Springmaid Pier NOS) 14/1542 998.2 14/1506 39g 53 1.8f 2.2
South Carolina (unofficial)Downtown Charleston 14/1238 32h 44 53.1Isle of Palms 14/1230 43 55 50.8Hampton 38.9Charleston Harbor 0.6f
Oyster Landing (North CharlestonCounty)
0.9
Little River Fire Department 50 42.9Myrtle Beach Pavilion 65 66.0Loris 50 78.5Conway 107.9Conway Horry County EOC 100.8Outland (Georgetown County) 75.4
North CarolinaWilmington (KILM) 14/1750 1005 14/1731 48 64 51.3Southport (KSUT) 14/1700 33 51 57.4Elizabethtown Co-op 84.3Burgaw Co-op 84.3Whiteville Co-op 81.8New River (KNCA) 14/1815 1008.1 14/1929 42 57New Bern (KEWN) 14/1900 1012.1 14/1847 34 46 32.0Cherry Point (KNKT) 14/1855 1014.1 14/1857 31 44 52.8Beaufort (KMRH) 14/1756 1017.1 14/1915 32 43 35.6Manteo (KMQI) 14/2120 1015.1 14/2200 35Washington (KOCW) 14/1900 1012.4 14/2001 50Edenton (KEDE) 14/2140 38 56Jacksonville (KOAJ) 14/1835 1012.4 14/1835 48 43.9Kinston (KISO) 14/1920 1009 14/1920 40Elizabeth City (KECG) 14/2106 1011 14/2249 38 56 58.4Greenville Co-op 128.3Kinston Co-op 111.3Richlands Co-op 86.6Williamston Co-op 63.5Wrightsville Beach NOS Johnnie
Mercer Pier14/1736 1007.3 14/1736 61g 74
Sunset Beach NOS 14/1600 998 14/1500 46 53
North Carolina (unofficial)Surf City 44Watha 39Wilmington battleship USS
North Carolina61 35.3
University of North Carolina (UNC)Wilmington Marine Science Center
72 54.4
Wrightsville Beach U.S. Coast GuardStation
63
North Carolina State Port 80Bay Shore Estates 81Carolina Beach 61Myrtle Grove 55Southport 74Oak Island (39th Place West) 66Oak Island (43rd Street East) 53St. James Plantation 58Holden Beach 74
MARCH 2006 A N N U A L S U M M A R Y 993
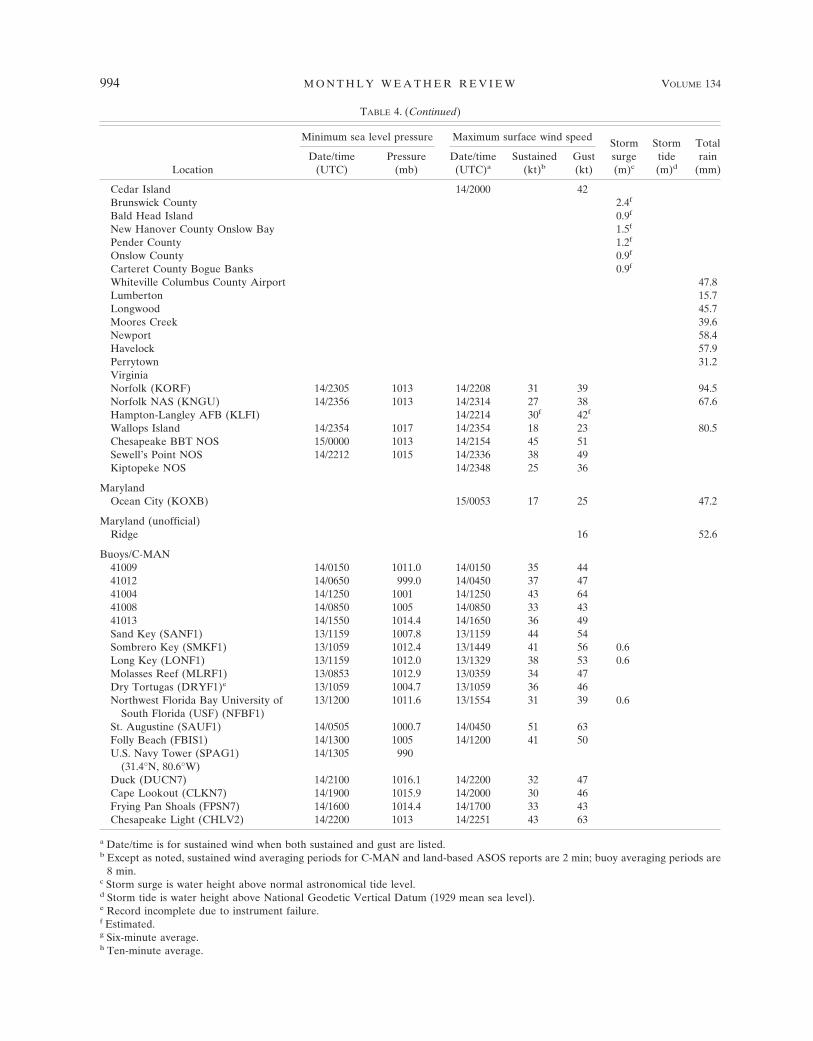
TABLE 4. (Continued)
Location
Minimum sea level pressure Maximum surface wind speedStormsurge(m)c
Stormtide(m)d
Totalrain
(mm)Date/time
(UTC)Pressure
(mb)Date/time
(UTC)aSustained
(kt)bGust(kt)
Cedar Island 14/2000 42Brunswick County 2.4f
Bald Head Island 0.9f
New Hanover County Onslow Bay 1.5f
Pender County 1.2f
Onslow County 0.9f
Carteret County Bogue Banks 0.9f
Whiteville Columbus County Airport 47.8Lumberton 15.7Longwood 45.7Moores Creek 39.6Newport 58.4Havelock 57.9Perrytown 31.2VirginiaNorfolk (KORF) 14/2305 1013 14/2208 31 39 94.5Norfolk NAS (KNGU) 14/2356 1013 14/2314 27 38 67.6Hampton-Langley AFB (KLFI) 14/2214 30f 42f
Wallops Island 14/2354 1017 14/2354 18 23 80.5Chesapeake BBT NOS 15/0000 1013 14/2154 45 51Sewell’s Point NOS 14/2212 1015 14/2336 38 49Kiptopeke NOS 14/2348 25 36
MarylandOcean City (KOXB) 15/0053 17 25 47.2
Maryland (unofficial)Ridge 16 52.6
Buoys/C-MAN41009 14/0150 1011.0 14/0150 35 4441012 14/0650 999.0 14/0450 37 4741004 14/1250 1001 14/1250 43 6441008 14/0850 1005 14/0850 33 4341013 14/1550 1014.4 14/1650 36 49Sand Key (SANF1) 13/1159 1007.8 13/1159 44 54Sombrero Key (SMKF1) 13/1059 1012.4 13/1449 41 56 0.6Long Key (LONF1) 13/1159 1012.0 13/1329 38 53 0.6Molasses Reef (MLRF1) 13/0853 1012.9 13/0359 34 47Dry Tortugas (DRYF1)e 13/1059 1004.7 13/1059 36 46Northwest Florida Bay University of
South Florida (USF) (NFBF1)13/1200 1011.6 13/1554 31 39 0.6
St. Augustine (SAUF1) 14/0505 1000.7 14/0450 51 63Folly Beach (FBIS1) 14/1300 1005 14/1200 41 50U.S. Navy Tower (SPAG1)
(31.4°N, 80.6°W)14/1305 990
Duck (DUCN7) 14/2100 1016.1 14/2200 32 47Cape Lookout (CLKN7) 14/1900 1015.9 14/2000 30 46Frying Pan Shoals (FPSN7) 14/1600 1014.4 14/1700 33 43Chesapeake Light (CHLV2) 14/2200 1013 14/2251 43 63
a Date/time is for sustained wind when both sustained and gust are listed.b Except as noted, sustained wind averaging periods for C-MAN and land-based ASOS reports are 2 min; buoy averaging periods are
8 min.c Storm surge is water height above normal astronomical tide level.d Storm tide is water height above National Geodetic Vertical Datum (1929 mean sea level).e Record incomplete due to instrument failure.f Estimated.g Six-minute average.h Ten-minute average.
994 M O N T H L Y W E A T H E R R E V I E W VOLUME 134

total precipitation amounts over central Florida were ashigh as 200 mm.
Observations from Cuba indicate that Charley was ofcategory 3 intensity as it crossed the island; Playa Bara-coa reported a sustained wind of 103 kt (Table 4).Storm surge heights of 4 m were determined from highwater marks at Playa Cajio on the south coast. Rainfalltotals of up to about 125 mm were reported in westernCuba.
3) CASUALTY AND DAMAGE STATISTICS
Charley was responsible for 15 direct deaths, includ-ing 10 in the United States. There were also four deathsin Cuba and one in Jamaica. Of the U.S. deaths, nine ofthese deaths occurred in Florida and one in Rhode Is-land. By hazard, the deaths are attributed to wind (8),fresh-water floods (1), and surf (1).
Insured damage in the United States from HurricaneCharley is estimated to be near $7.48 billion. The totaldamage is estimated to be near $15 billion, which makesCharley the second costliest hurricane in U.S. history,behind only Andrew of 1992.
d. Hurricane Danielle: 13–21 August
A vigorous westward-moving tropical wave movedacross the west coast of Africa early on 12 August andspawned a tropical depression the following day about210 n mi southeast of the southernmost Cape VerdeIslands. The cyclone strengthened quickly, becoming atropical storm at 0000 UTC 14 August and a hurricane24 h later. Moving northwestward toward a weakness inthe subtropical ridge, Danielle reached its estimatedmaximum intensity of 95 kt at 1800 UTC 16 Augustabout 755 n mi west of the north-westernmost CapeVerde Islands. Shortly after Danielle reached its peakintensity, a large mid- to upper-level trough began toincrease southwesterly vertical shear over the cyclone.Steady weakening ensued during the next three dayswhile the cyclone moved northward. Danielle weak-ened to a tropical depression around 1800 UTC 20 Au-gust about 600 n mi south-southwest of the Azores Is-lands, and degenerated into a nonconvective remnantlow pressure system by 1800 UTC the next day. Theremnant low moved slowly northwestward and re-mained devoid of significant convection until it dissi-pated at 0000 UTC 25 August about 690 n mi west-southwest of the Azores Islands. There were no reportsof damage or casualties associated with Danielle.
e. Tropical Storm Earl: 13–15 August
Earl formed from a tropical wave that moved fromAfrica to the eastern tropical Atlantic Ocean on
10 August. The wave developed into a tropical depres-sion on 13 August while centered about 1000 n mi eastof the Lesser Antilles. The cyclone was embedded indeep easterly flow to the south of a strong subtropicalridge, and moved westward at 18 to 25 kt during itsshort lifetime. Based on banding features observed onsatellite imagery and the associated Dvorak intensityestimates, the depression is estimated to have strength-ened to a tropical storm on 14 August about 325 n mieast of Barbados. Earl moved quickly across the south-ern Windward Islands on 15 August with maximumwinds estimated at 45 kt, and briefly brought winds of ator near tropical storm force to Barbados, Grenada, St.Vincent, and the Grenadines. Shortly thereafter, eventhough satellite imagery suggested that the system waswell organized, a hurricane hunter aircraft reportedthat the low-level circulation was not well defined. Earldegenerated to an open tropical wave later on 15 Au-gust, in almost the same location where Bonnie haddone so two weeks earlier. The remnant wave contin-ued westward to the eastern North Pacific Ocean whereit developed into Hurricane Frank.
The highest sustained wind reports associated withEarl’s passage through the Windward Islands were 30-kt observations from Barbados and St. Lucia. AfterEarl degenerated to an open wave, two ships reportedtropical-storm-force winds associated with the fast-moving wave over the central Caribbean Sea.
There were no reports of casualties associated withEarl, and damage was minor. There were media reportsof flooding and of damage to about a dozen roofs inGrenada. In nearby St. Vincent and the Grenadines, atleast two roofs were destroyed and banana crops weredamaged.
f. Hurricane Frances: 25 August–8 September
Frances was a Cape Verde tropical cyclone thatpassed through the Bahamas as a major hurricane andstruck the Florida east coast as a category 2 hurricane.
1) SYNOPTIC HISTORY
Frances developed from a vigorous tropical wavethat crossed the west coast of Africa on 21 August.Convection associated with the wave gradually becamebetter organized, and a tropical depression formedfrom the wave near 0000 UTC 25 August about 655 nmi west-southwest of the southern Cape Verde Islands.
The depression moved westward on the south side ofthe Atlantic subtropical ridge and intensified, becominga tropical storm later on 25 August. Frances continuedto strengthen as it turned west-northwestward, becom-ing a hurricane the next day and reaching an intensity
MARCH 2006 A N N U A L S U M M A R Y 995
of 115 kt on 28 August. Frances then weakened slightlyas a result of an eyewall replacement, but restrength-ened and reached its peak intensity of 125 kt (category4) late on 31 August as it passed north of the Leewardand Virgin Islands. On 1–2 September, the centerpassed just north of the Turks and Caicos Islands andthe southeastern Bahamas. During this time the hurri-cane underwent two more concentric eyewall cycles butwith little apparent variation in maximum winds. Mod-erate westerly vertical shear developed late on 2 Sep-tember, and Frances weakened during the next twodays; however, it was still a category 3 hurricane, withwinds of 100–110 kt, over the central Bahamas on 2–3September and a category 2 hurricane, with winds of85–90 kt, when it moved across the northwestern Ba-hamas on 3–4 September.
A high pressure ridge building west of the cyclonecaused steering currents to weaken as Frances reachedthe northwestern Bahamas, and this resulted in a slowmotion of the hurricane across the warm waters of theGulf Stream on 4 September. The westerly shear alsolessened at this time, but there was little change in in-tensity as Frances approached the Florida coastline.Hurricanes with large eyes are often observed tochange intensity relatively slowly, and the limited re-sponse of Frances to a seemingly favorable environ-ment may have been related to the structure of thehurricane’s inner core, which featured a 50–70 n miwide eye. Frances made landfall on the Florida eastcoast at the southern end of Hutchinson Island near0430 UTC 5 September as a category 2 hurricane, withmaximum sustained winds of near 90 kt.
After making landfall, Frances moved slowly west-northwestward across the Florida peninsula, weakeningto a tropical storm just before its center emerged intothe northeastern Gulf of Mexico near New Port Richeyearly on 6 September. Frances moved northwestwardand made its final landfall near the mouth of the Aucil-la River in the Florida Big Bend region, at about 1800UTC that afternoon. A northwestward motion contin-ued until 7 September, when Frances recurved north-eastward into the westerlies over extreme eastern Ala-bama. Frances weakened to a tropical depression earlyon 7 September and then became extratropical overWest Virginia early on 9 September, briefly producinggales as it accelerated northeastward across New Yorklater that day. The cyclone then crossed northern NewEngland and southeastern Canada, dissipating over theGulf of St. Lawrence late on 10 September.
2) METEOROLOGICAL STATISTICS
The AFRC and NOAA/AOC Hurricane Huntersflew 34 operational missions in Frances, including stan-
dard synoptic surveillance flights in the storm environ-ment. The strongest flight-level winds reported by thereconnaissance aircraft included a NOAA report of 144kt from 8000 ft at 1726 UTC 31 August, and an AFRCmeasurement of 138 kt from 700 mb at 1114 UTC 31August, and again at 0543 UTC 2 September. The low-est aircraft-measured pressure was 935 mb at 0712 UTC1 September.
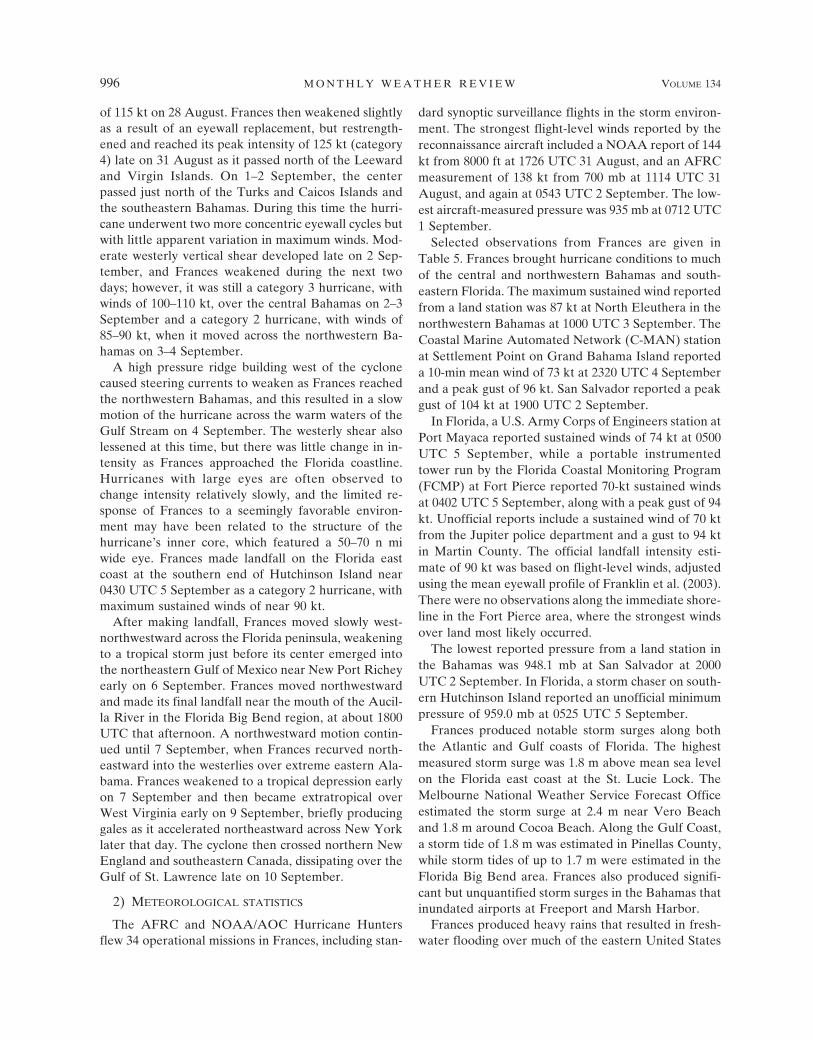
Selected observations from Frances are given inTable 5. Frances brought hurricane conditions to muchof the central and northwestern Bahamas and south-eastern Florida. The maximum sustained wind reportedfrom a land station was 87 kt at North Eleuthera in thenorthwestern Bahamas at 1000 UTC 3 September. TheCoastal Marine Automated Network (C-MAN) stationat Settlement Point on Grand Bahama Island reporteda 10-min mean wind of 73 kt at 2320 UTC 4 Septemberand a peak gust of 96 kt. San Salvador reported a peakgust of 104 kt at 1900 UTC 2 September.
In Florida, a U.S. Army Corps of Engineers station atPort Mayaca reported sustained winds of 74 kt at 0500UTC 5 September, while a portable instrumentedtower run by the Florida Coastal Monitoring Program(FCMP) at Fort Pierce reported 70-kt sustained windsat 0402 UTC 5 September, along with a peak gust of 94kt. Unofficial reports include a sustained wind of 70 ktfrom the Jupiter police department and a gust to 94 ktin Martin County. The official landfall intensity esti-mate of 90 kt was based on flight-level winds, adjustedusing the mean eyewall profile of Franklin et al. (2003).There were no observations along the immediate shore-line in the Fort Pierce area, where the strongest windsover land most likely occurred.
The lowest reported pressure from a land station inthe Bahamas was 948.1 mb at San Salvador at 2000UTC 2 September. In Florida, a storm chaser on south-ern Hutchinson Island reported an unofficial minimumpressure of 959.0 mb at 0525 UTC 5 September.
Frances produced notable storm surges along boththe Atlantic and Gulf coasts of Florida. The highestmeasured storm surge was 1.8 m above mean sea levelon the Florida east coast at the St. Lucie Lock. TheMelbourne National Weather Service Forecast Officeestimated the storm surge at 2.4 m near Vero Beachand 1.8 m around Cocoa Beach. Along the Gulf Coast,a storm tide of 1.8 m was estimated in Pinellas County,while storm tides of up to 1.7 m were estimated in theFlorida Big Bend area. Frances also produced signifi-cant but unquantified storm surges in the Bahamas thatinundated airports at Freeport and Marsh Harbor.
Frances produced heavy rains that resulted in fresh-water flooding over much of the eastern United States
996 M O N T H L Y W E A T H E R R E V I E W VOLUME 134

TABLE 5. Selected surface observations for Hurricane Frances, 25 Aug–8 Sep 2004.
Location
Minimum sea level pressure Maximum surface wind speedStormsurge(m)c
Stromtide(m)d
Totalrain
(mm)Date/time
(UTC)Pressure
(mb)Date/time
(UTC)aSustained
(kt)bGust(kt)
BahamasNorth Eleuthera 03/1400 958.6 03/1000 87North Norman Reef (NOAA/Coral Reef
Early Warning System)03/0400 992.0 03/0100 37 53
San Salvador 02/2000 948.1 02/1900 59 104 138.9
AlabamaDothan (KDHN) 07/0359 992.8 06/1937 32 45 25.4
FloridaChekikae 47Clearwater Beach NOS 06/0000 984.1 05/1854 54f 64 1.3Crescent Beach NOS 2.0Daytona Beach (KDAB) 05/2000 994.9 05/1000 49 65 253.0Fernandina Beach (K55J)g 06/0855 38Fernandina Beach NOS 06/0800 1002.7 06/0500 43 0.5 2.4Fort Lauderdale (KFXE) 04/1848 48Fort Lauderdale International Airport
(KFLL)05/0630 990.0 03/1916 36 48 108.2
Fort Myers (KFMY) 05/1922 992.2 05/1859 32 42 73.4Fort Myers (KRSW) 05/1926 992.6 06/1010 31 40 112.8Fort Myers NOS 05/1836 991.9 05/0700 37 1.2Gainesville (KGNV) 06/0044 991.0 05/2200 41 56 274.6Jacksonville Cecil Field (KVQQ) 06/0034 27 39 232.9Jacksonville Craig Executive Airport
(KCRG)g06/0753 998.6 05/2053 29 52 180.3
Jacksonville I-295 NOS 1.1Jacksonville International Airport
(KJAX)06/0922 998.2 06/0017 38 54 231.9
Jacksonville Main Street NOS 1.4Jacksonville NAS (KNIP) 06/0655 997.6 05/2246 42 54 161.8Key West International Airport
(KEYW)05/0953 1002.9 05/1640 31 38 40.1
Key West NAS (KNQX) 05/0955 1002.9 05/1033 43 41.9Key West NOS 05/1000 1003.6 04/2000 43 0.1 0.7Lake City (KLCQ) 06/1439 994.5 06/1909 29 41Lake Wales Ridgee 05/1246 43Leesburg (KLEE)g 05/1859 988.5 05/1949 52 164.1Marathon (KMTH) 05/0853 1001.7 05/1928 37 39.9Mariana (KMAI) 06/2323 990.8 06/1424 32 43 25.7Matanzas River NOS 2.1Mayport (KNRB) 06/0955 997.6 06/0144 45 55 130.8Mayport NOS 1.9Mayport NOS (Bar Pilots Dock) 06/0724 1001.7 06/0518 36f 49 1.8Mayport NOS (Degaussing Structure) 06/0800 1001.4 06/0900 35f 51McKay Bay 06/1318 38f 55Melbourne (KMLB)g 05/1858 995.9 04/2358 63 201.9Merrit Island Airport N/A 984.0 05/0935 64 78Miami International Airport (KMIA) 05/0807 995.0 05/1932 37 51 88.6Miami (KMFL) 04/1940 44 78.5Naples (KAPF) 05/2007 33 47 26.9Naples NOS 05/0900 996.3 05/1200 36f 47 1.3Oasise 04/2134 41Ocala (KOCF) 05/2255 987.8 05/1955 43 274.6Ochopeee 05/0636 39Opa Locka (KOPF) 05/0548 993.0 05/1730 37 47 87.1Orlando International Airport
(KMCO)g05/1052 989.4 05/0848 47 60 165.1
MARCH 2006 A N N U A L S U M M A R Y 997

TABLE 5. (Continued)
Location
Minimum sea level pressure Maximum surface wind speedStormsurge(m)c
Stromtide(m)d
Totalrain
(mm)Date/time
(UTC)Pressure
(mb)Date/time
(UTC)aSustained
(kt)bGust(kt)
Panama City (KPFN) 06/1835 993.9 05/2241 36 53 12.4Panama City Beach NOS 06/2200 995.4 07/0700 39Pembroke Pines (KHWO) 05/0542 992.0 05/0035 35 47 128.0Perry (K40J) 06/1615 987.1 06/1701 32 41 89.9Port Manatee NOS 1.4Punta Gorda (KPGD) 05/1905 989.2 06/0538 40 50Racy Pojnt NOS 05/2100 55Red Bay Point NOS 1.0St. Augustine (KSGJ) 05/2205 999.0 05/2015 41 53St. Petersburg (KPIE) 05/2216 982.4 06/0619 38 49 137.4St. Petersburg (KSPG) 05/2147 981.4 06/0101 38 50 159.3St. Petersburg NOS 05/2054 981.7 06/0612 36f 47 1.1 1.4Sanford (KSFB)g 05/1457 989.8 04/2313 44 61 111.8Sarasota (KSRQ) 05/2132 984.4 06/0850 36 46 119.1Tallahassee (KTLH) 06/1910 984.4 05/1938 41 52 63.0Tamiami Executive Airport (KTMB) 05/0827 996.0 05/2141 41 49 59.2Tampa (KTPA) 05/2225 980.0 05/1905 39 47 145.8Tenrawe 05/0723 44Trident Pier NOS 05/1300 989.1 05/1224 41f 57 1.3 2.2Vaca Key NOS 05/0900 1001.7 05/0300 36 0.3 0.7Vilano Beach NOS 05/2300 999.5 05/2300 33f 53Virginia Key NOS 05/0600 994.5 05/0836 38f 49 0.9West Palm Beach (KPBI) 05/0508 972.0 05/0656 56 71 344.4Winter Haven (KGIF)g 06/1602 977.3 06/1559 40 50
Florida (unofficial)Alligator Pointh 06/1719 984.6 05/1920 48Arlingtonh 06/0730 1000.6 06/0625 36Boca Raton 03/2030 50Boca Raton Water Treatment 03/2054 61Boynton Beach N/A 977.3 04/1420 61Boynton Beach 04/1723 66Boynton Beach 242.8Clearwaterh 06/1445 34 56Clermonth 05/1835 984.0 05/1600 56Delray 04/1835 52Deerfield Beach 203.2Dunedinh 05/2315 982.3 05/1515 42Flagler Beach Fire Department 05/2300 994.9 04/1730 63Fred Howard (Pinellas County) 04/ 61Fort Piercei 05/0402 70 94Goldon Beach 04/1743 50Holderh 06/0030 987.7 06/0700 39Indian Harbor Beach 05/1259 981.9 05/1455 46 68Jacksonvilleh 06/0700 1000.2 06/0512 40Juno Beachh 05/0345 963.7 05/0830 55Jupiter Police Department (PD) 04/1655 70 78Jupiter Inlet 04/1300 79Kendall 04/1900 57Kendall 04/1940 64Lake Apopkaj 05/1330 43Lake Winderj 05/1245 52Largoh 05/2100 981.9 05/1700 36Lawtey 342.9MacClenny 06/0840 998.0 06/0010 41 260.4Martin County 05/1145 92Melbourne 178.8
998 M O N T H L Y W E A T H E R R E V I E W VOLUME 134
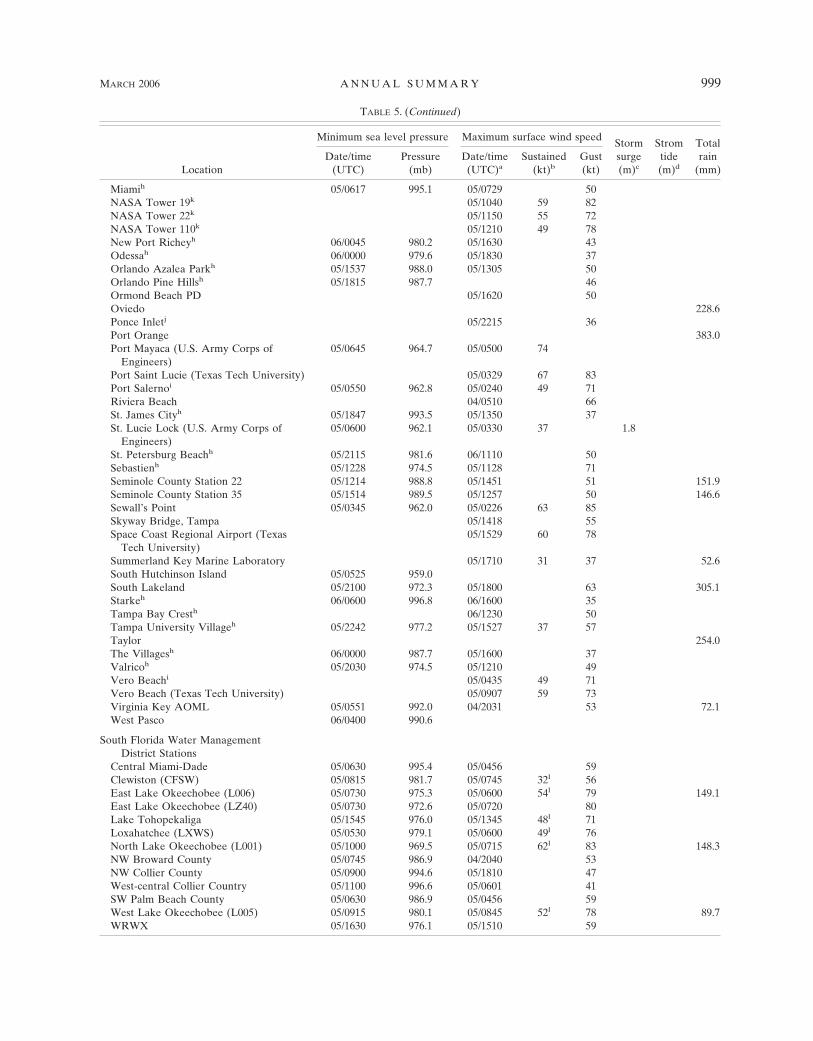
TABLE 5. (Continued)
Location
Minimum sea level pressure Maximum surface wind speedStormsurge(m)c
Stromtide(m)d
Totalrain
(mm)Date/time
(UTC)Pressure
(mb)Date/time
(UTC)aSustained
(kt)bGust(kt)
Miamih 05/0617 995.1 05/0729 50NASA Tower 19k 05/1040 59 82NASA Tower 22k 05/1150 55 72NASA Tower 110k 05/1210 49 78New Port Richeyh 06/0045 980.2 05/1630 43Odessah 06/0000 979.6 05/1830 37Orlando Azalea Parkh 05/1537 988.0 05/1305 50Orlando Pine Hillsh 05/1815 987.7 46Ormond Beach PD 05/1620 50Oviedo 228.6Ponce Inletj 05/2215 36Port Orange 383.0Port Mayaca (U.S. Army Corps of
Engineers)05/0645 964.7 05/0500 74
Port Saint Lucie (Texas Tech University) 05/0329 67 83Port Salernoi 05/0550 962.8 05/0240 49 71Riviera Beach 04/0510 66St. James Cityh 05/1847 993.5 05/1350 37St. Lucie Lock (U.S. Army Corps of
Engineers)05/0600 962.1 05/0330 37 1.8
St. Petersburg Beachh 05/2115 981.6 06/1110 50Sebastienh 05/1228 974.5 05/1128 71Seminole County Station 22 05/1214 988.8 05/1451 51 151.9Seminole County Station 35 05/1514 989.5 05/1257 50 146.6Sewall’s Point 05/0345 962.0 05/0226 63 85Skyway Bridge, Tampa 05/1418 55Space Coast Regional Airport (Texas
Tech University)05/1529 60 78
Summerland Key Marine Laboratory 05/1710 31 37 52.6South Hutchinson Island 05/0525 959.0South Lakeland 05/2100 972.3 05/1800 63 305.1Starkeh 06/0600 996.8 06/1600 35Tampa Bay Cresth 06/1230 50Tampa University Villageh 05/2242 977.2 05/1527 37 57Taylor 254.0The Villagesh 06/0000 987.7 05/1600 37Valricoh 05/2030 974.5 05/1210 49Vero Beachi 05/0435 49 71Vero Beach (Texas Tech University) 05/0907 59 73Virginia Key AOML 05/0551 992.0 04/2031 53 72.1West Pasco 06/0400 990.6
South Florida Water ManagementDistrict Stations
Central Miami-Dade 05/0630 995.4 05/0456 59Clewiston (CFSW) 05/0815 981.7 05/0745 32l 56East Lake Okeechobee (L006) 05/0730 975.3 05/0600 54l 79 149.1East Lake Okeechobee (LZ40) 05/0730 972.6 05/0720 80Lake Tohopekaliga 05/1545 976.0 05/1345 48l 71Loxahatchee (LXWS) 05/0530 979.1 05/0600 49l 76North Lake Okeechobee (L001) 05/1000 969.5 05/0715 62l 83 148.3NW Broward County 05/0745 986.9 04/2040 53NW Collier County 05/0900 994.6 05/1810 47West-central Collier Country 05/1100 996.6 05/0601 41SW Palm Beach County 05/0630 986.9 05/0456 59West Lake Okeechobee (L005) 05/0915 980.1 05/0845 52l 78 89.7WRWX 05/1630 976.1 05/1510 59
MARCH 2006 A N N U A L S U M M A R Y 999

TABLE 5. (Continued)
Location
Minimum sea level pressure Maximum surface wind speedStormsurge(m)c
Stromtide(m)d
Totalrain
(mm)Date/time
(UTC)Pressure
(mb)Date/time
(UTC)aSustained
(kt)bGust(kt)
Florida Automated Weather Network(FAWN)
Citra 166.6Fort Pierce 05/0300 50 87.4Hastings 05/0815 36 212.1Kenansville 163.6Live Oak 205.7Ocklawaha 227.1Okahumpka 186.7Pierson 229.9Putnam Hall 295.7Tavares 295.7Umatilla 225.0
USF Coastal Ocean Monitoring andPrediction System (COMPS)stations
Buoy NA2 05/2210 989.5 05/1810 39 47Aripeka (APK) 06/0212 979.2 1.4Egmont Key (EGK) 05/1936 45 54 1.2Homosassa (HOM) 06/0318 983.5 06/1724 47 57 1.4New Port Richey (PAS) 06/0136 979.6 05/1712 31 44 1.5North Florida Bay (NFB) 05/0624 999.6 05/0048 33 42 0.2 1.5Shell Point (SHP) 06/1706 992.7 1.5g
Tarpon Springs (TAS) 06/0036 980.7 05/2030 42 1.2
GeorgiaAlbany (KABY) 07/0042 991.8 0671942 38 59 115.1Alma (KAMG) 07/0002 996.9 07/0237 35 39 164.1Atlanta Hartsfield International
Airport (KATL)07/2151 998.3 07/0800 45 76.7
Bainbridge (KBGE) 06/1620 37Brasstowne 07/1206 39Byromvillee 07/0005 37Brunswick (KBQK) 06/2319 1002.3 06/0221 27 38Columbus (KCSG) 07/0751 994.4 07/0251 39 89.7Cooke 06/1804 34Douglas (KDQH) 06/2259 995.2 06/2259 35Fort Benning (KLSF) 07/0655 994.1 07/0155 39 99.1Fort Pulaski NOS 06/1148 32f 39 2.4Gainesville (KGVL) 08/0553 1000.1 07/1008 34 15.8Helen 7Ne 280.9Macon (KMCN) 07/0753 998.5 07/0337 44 143.8Newnane 07/0702 36Patterson (PATG1) 303.3Plainse 06/2003 35 174.5St. Simon’s Island (KSSI) 06/2300 1001.9 06/1807 37 47 87.6St. Simon Island NOS 0.6 2.5Savannah (KSAV) 07/2253 1004.8 06/2219 35 60.2Savannah Hunter (KSVN) 07/2255 1005.1 06/2155 38 114.6Valdosta (KVLD) 06/2105 993.2 06/0127 31 45 163.3Waycross (KAYS) 06/2320 997.3 07/0140 39Waycrosse 06/2304 40 168.7
Georgia (unofficial)Gannett Lake 06/0400 36Waycross 9SE 05/0204 45
1000 M O N T H L Y W E A T H E R R E V I E W VOLUME 134
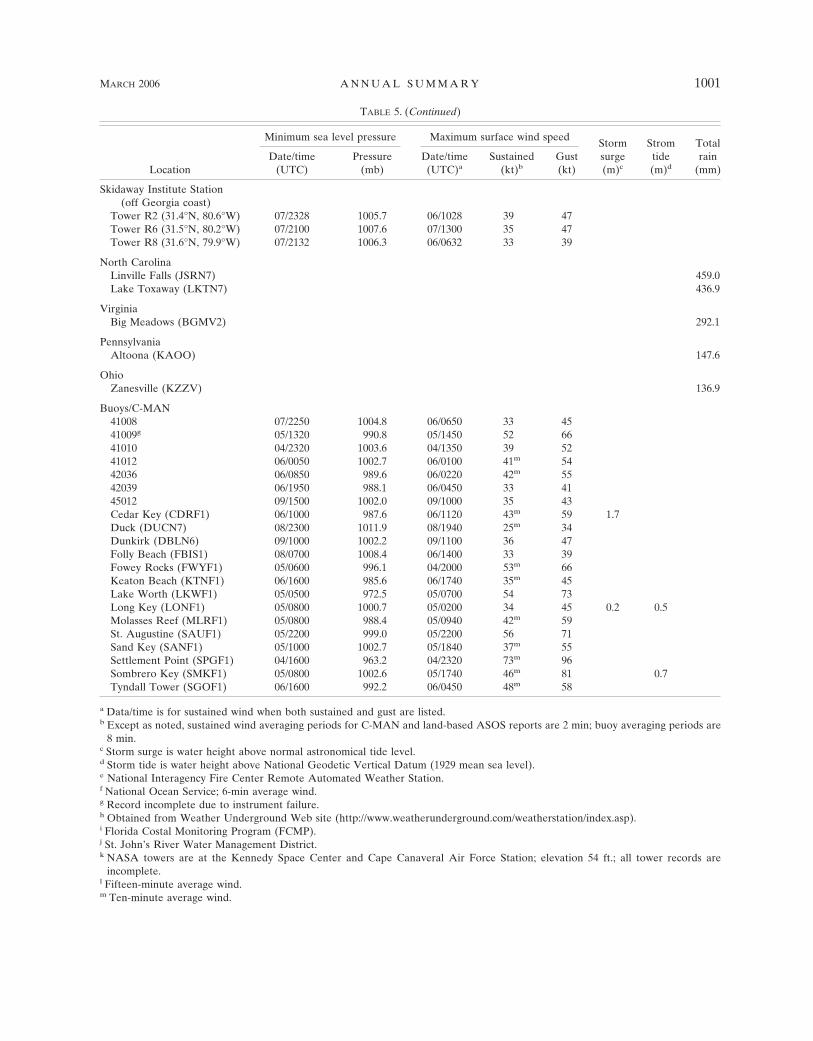
TABLE 5. (Continued)
Location
Minimum sea level pressure Maximum surface wind speedStormsurge(m)c
Stromtide(m)d
Totalrain
(mm)Date/time
(UTC)Pressure
(mb)Date/time
(UTC)aSustained
(kt)bGust(kt)
Skidaway Institute Station(off Georgia coast)
Tower R2 (31.4°N, 80.6°W) 07/2328 1005.7 06/1028 39 47Tower R6 (31.5°N, 80.2°W) 07/2100 1007.6 07/1300 35 47Tower R8 (31.6°N, 79.9°W) 07/2132 1006.3 06/0632 33 39
North CarolinaLinville Falls (JSRN7) 459.0Lake Toxaway (LKTN7) 436.9
VirginiaBig Meadows (BGMV2) 292.1
PennsylvaniaAltoona (KAOO) 147.6
OhioZanesville (KZZV) 136.9
Buoys/C-MAN41008 07/2250 1004.8 06/0650 33 4541009g 05/1320 990.8 05/1450 52 6641010 04/2320 1003.6 04/1350 39 5241012 06/0050 1002.7 06/0100 41m 5442036 06/0850 989.6 06/0220 42m 5542039 06/1950 988.1 06/0450 33 4145012 09/1500 1002.0 09/1000 35 43Cedar Key (CDRF1) 06/1000 987.6 06/1120 43m 59 1.7Duck (DUCN7) 08/2300 1011.9 08/1940 25m 34Dunkirk (DBLN6) 09/1000 1002.2 09/1100 36 47Folly Beach (FBIS1) 08/0700 1008.4 06/1400 33 39Fowey Rocks (FWYF1) 05/0600 996.1 04/2000 53m 66Keaton Beach (KTNF1) 06/1600 985.6 06/1740 35m 45Lake Worth (LKWF1) 05/0500 972.5 05/0700 54 73Long Key (LONF1) 05/0800 1000.7 05/0200 34 45 0.2 0.5Molasses Reef (MLRF1) 05/0800 988.4 05/0940 42m 59St. Augustine (SAUF1) 05/2200 999.0 05/2200 56 71Sand Key (SANF1) 05/1000 1002.7 05/1840 37m 55Settlement Point (SPGF1) 04/1600 963.2 04/2320 73m 96Sombrero Key (SMKF1) 05/0800 1002.6 05/1740 46m 81 0.7Tyndall Tower (SGOF1) 06/1600 992.2 06/0450 48m 58
a Data/time is for sustained wind when both sustained and gust are listed.b Except as noted, sustained wind averaging periods for C-MAN and land-based ASOS reports are 2 min; buoy averaging periods are
8 min.c Storm surge is water height above normal astronomical tide level.d Storm tide is water height above National Geodetic Vertical Datum (1929 mean sea level).e National Interagency Fire Center Remote Automated Weather Station.f National Ocean Service; 6-min average wind.g Record incomplete due to instrument failure.h Obtained from Weather Underground Web site (http://www.weatherunderground.com/weatherstation/index.asp).i Florida Costal Monitoring Program (FCMP).j St. John’s River Water Management District.k NASA towers are at the Kennedy Space Center and Cape Canaveral Air Force Station; elevation 54 ft.; all tower records are
incomplete.l Fifteen-minute average wind.m Ten-minute average wind.
MARCH 2006 A N N U A L S U M M A R Y 1001
(Fig. 6). The maximum reported rainfall was 459 mm atLinville Falls, North Carolina, part of a swath of rains inexcess of 250 mm along the Appalachian Mountains inwestern North Carolina and northeastern Georgia.Rainfall in excess of 250 mm also occurred over largeportions of the central and northern Florida peninsulaand southeastern Georgia, with a storm total of 402 mmat High Springs, Florida. Storm-total rainfalls of 125–250 mm were common elsewhere along Frances’ trackas a tropical cyclone, with reports of 75–150 mm alongthe extratropical portion of the track.
A total of 101 tornadoes were reported in associationwith Frances: 23 in Florida, 7 in Georgia, 45 in SouthCarolina, 11 in North Carolina, and 15 in Virginia.
3) CASUALTY AND DAMAGE STATISTICS
Frances is directly responsible for eight deaths: fivein Florida, and one each in Georgia, Ohio, and theBahamas. Of the U.S. deaths, three are attributed towind, one to storm surge, one to freshwater floods, oneto a tornado, and one to lightning.
Damage was extensive from Palm Beach Countynorthward to Brevard County and inland along thetrack of Frances. Insured damage in the United Statesis estimated to be near $4.43 billion, of which $4.11billion occurred in Florida. Total U.S. damage is esti-mated to be $8.9 billion. Extensive property damagealso occurred in the central and northwestern Bahamas.
g. Hurricane Gaston: 27 August–1 September
Gaston was a category 1 hurricane that made landfallalong the central South Carolina coast. After movinginland, Gaston produced heavy rainfall across portionsof the Carolinas and Virginia. Flooding in the Rich-mond, Virginia, metropolitan area resulted in eightdeaths.
1) SYNOPTIC HISTORY
The genesis of Gaston can be traced to a cold frontthat moved off the coast of the Carolinas into the At-lantic on 22 August, and drifted southward the follow-ing day before stalling on 24 August. Surface observa-tions indicate that a broad low formed along the weak-ening front on 25 August. Thunderstorm activityassociated with the low remained sporadic and disorga-nized until late on 26 August, when the convective ac-tivity began to increase and acquire a more bandedstructure. Early morning visible and microwave satel-lite images on 27 August suggest that the low had de-veloped into the seventh tropical depression of the
season by 1200 UTC that day, about 115 n mi east-southeast of Charleston, South Carolina. It is of notethat the frontal zone from which Gaston formed alsoinitiated the development of Tropical Storm Herminetwo days later.
Steering currents were weak initially and the depres-sion drifted slowly southward. Convective banding con-tinued to increase on 27 August and the depressionslowly strengthened, becoming a tropical storm earlythe next day as it drifted westward about 130 n misoutheast of Charleston. Strengthening continued on 28August, and the first reconnaissance aircraft to reachthe cyclone found maximum flight-level winds of 59 ktshortly after 1800 UTC.
Early on 29 August steering currents became betterdefined, with the development of a mid- to upper-levelridge northeast of Gaston and the approach of a mid-latitude trough over the Appalachians. Gaston beganmoving northwestward toward the South Carolinacoast, and the forward motion of the cyclone increasedfrom about 3 to 7 kt. Radar and satellite imageryshowed that Gaston continued to get better organizedas it approached the coast. Doppler radar observationsindicate that Gaston reached hurricane strength justbefore it made landfall near Awendaw, South Carolina,between Charleston and McClellanville, around 1400UTC 29 August, with maximum sustained winds esti-mated near 65 kt. The tropical cyclone then steadilyweakened while moving northward across northeasternSouth Carolina.
At 0000 UTC 30 August, Gaston weakened to atropical depression over northeastern South Carolina.Gaston then turned north-northeastward ahead of thetrough moving over the eastern United States and thecyclone crossed eastern North Carolina and southeast-ern Virginia during the day. Data from the ChesapeakeLight C-MAN site and a ship near the mouth of Chesa-peake Bay indicated that Gaston had regained tropicalstorm strength by 0000 UTC 31 August, while the cen-ter was still inland near Yorktown, Virginia. Tropical-storm-force winds at this time were confined to a smallarea over water southeast of the center, and the pri-mary impact of Gaston in Virginia was flooding pro-duced by 150–300-mm rains that occurred over aboutan 8-h period.
The center of Gaston moved across the southern por-tion of Chesapeake Bay and crossed the Delmarva Pen-insula shortly before 0600 UTC 31 August. The tropicalcyclone then accelerated northeastward, passing about60 n mi south of Nantucket Island, Massachusetts laterthat day. Gaston strengthened slightly as it continued toaccelerate to the east-northeast, before becoming ex-
1002 M O N T H L Y W E A T H E R R E V I E W VOLUME 134

FIG. 6. Storm-total rain accumulations (mm) associated with Hurricane Frances for (a)Florida and (b) the Mid-Atlantic states. Analysis provided by the NWS/HydrometeorologicalPrediction Center.
MARCH 2006 A N N U A L S U M M A R Y 1003

tratropical south of the Canadian Maritimes at 1200UTC 1 September. The extratropical remnants of Gas-ton were finally absorbed by a larger extratropical sys-tem on 3 September about 750 n mi south-southeast ofReykjavik, Iceland.
2) METEOROLOGICAL STATISTICS
Gaston was strengthening up until landfall, and wasoperationally assessed to be a strong tropical stormwhen it crossed the coast. However, a poststorm analy-sis of Doppler velocity data from the Charleston andWilmington NWS radars showed that Gaston hadwinds aloft that supported reclassification to a hurri-cane. The Wilmington radar observed a roughly 3 n miwide patch of average winds of 71 kt or more in thesoutheast quadrant between 1130 and 1200 UTC on 29August. These winds were observed at an altitude ofabout 11 000 ft, and would correspond to roughly 64 ktat the surface using standard adjustment factors. TheCharleston radar observed a similarly sized area in thenorthwest quadrant that also supported 64-kt surfacewinds. Neither radar had a good look at the northeastquadrant, where the strongest winds would have beenexpected. Based on these observations, Gaston wasposthumously upgraded to a hurricane.
There were no land-based observations of hurricaneforce surface winds, although the landfall area was notparticularly well sampled. A gust to 71 kt was recordedby a Carolinas Coastal Ocean Observing and PredictionSystem station just south of Capers Island, South Caro-lina, with a minimum pressure of 985.1 mb (Table 6). Agust to 70 kt was recorded by a storm chaser on thenearby Isle of Palms. The highest surge reported wasover 1.2 m inside of Bulls Bay.
In South Carolina, rainfall was heaviest in a swathfrom Berkeley and western Williamsburg Countiesthrough Florence and Darlington Counties. Kingstreereported 267 mm of rainfall, which produced urbanflooding of up to 1.5 m. Radar data suggest that up to380 mm may have fallen in some areas. Flash floodsoccurred in Lake City. One F1 tornado was reported inMarlboro County. Rains tapered off somewhat as Gas-ton moved through North Carolina, with accumulationsthere being generally less than 150 mm. Two tornadoeswere confirmed in North Carolina on 29 August: an F0in Scotland County and an unrated tornado in HokeCounty.
Gaston produced very heavy rains and flash floods asit moved through southeastern Virginia on 30 August,with the most severe conditions in the Richmond met-ropolitan area. Two locations in Richmond reportedover 300 mm of rain. Most of this rain occurred during
an 8-h period late on 30 August. The cyclone also pro-duced a dozen F0 tornadoes in eastern Virginia.
3) CASUALTY AND DAMAGE STATISTICS
Flash floods in the Richmond area directly resultedin eight fatalities. Five of these were from motoristsattempting to drive through flooded roadways, includ-ing one who drove around a barricade to do so. Threeindividuals were killed during rescue attempts.
Scattered freshwater flooding occurred in SouthCarolina. In Berkeley County, 20 structures were se-verely damaged or destroyed, and dozens of otherstructures suffered minor flooding damage. Winds as-sociated with Gaston caused minor damage to roughly3000 structures in Charleston, Berkeley, and Dorches-ter Counties.
In Virginia, Gaston washed out roads and bridges.Damage was concentrated in Chesterfield, Dinwiddie,Hanover, Henrico, and Prince George Counties. About350 homes and 230 businesses were either damaged ordestroyed. Tornadoes downed trees and damagedroofs.
Insured losses associated with Gaston are reported tobe $20 million in South Carolina, $15 million in NorthCarolina, and $30 million in Virginia. Total damage isestimated to be near $130 million.
h. Tropical Storm Hermine: 27–31 August
An area of showers detached from a decaying frontalzone in the western Atlantic on 26 August, and the nextday a tropical depression formed from the disturbanceabout 200 n mi south of Bermuda. The intensity of theconvection fluctuated during the following couple ofdays as the depression moved toward the west-northwest, but the overall organization of the systemincreased. The cyclone became a tropical storm on 29August, and reached its peak intensity of 50 kt the nextday. Hermine moved northward and gradually weak-ened under strong northerly shear caused by the upper-level outflow of Hurricane Gaston. Hermine reachedthe southern coast of Massachusetts near New Bedfordas a minimal tropical storm at 0600 UTC 31 August,and became extratropical shortly thereafter. The im-pact of Hermine was quite limited; the cyclone broughtwind gusts to tropical storm force over eastern Massa-chusetts, and rainfall amounts were generally less than10–15 mm. There were no reports of damage or casu-alties.
i. Hurricane Ivan: 2–24 September
Ivan, one of the strongest tropical cyclones on recordin the Atlantic basin, was a long-lived Cape Verde hur-
1004 M O N T H L Y W E A T H E R R E V I E W VOLUME 134

ricane that reached category 5 strength on three occa-sions. Ivan carved a path of destruction through theCaribbean, striking Grenada, Jamaica, the Cayman Is-lands, and Cuba as a major hurricane. Ivan also madelandfall as a major hurricane in the United States, caus-ing over $14 billion in damage.
1) SYNOPTIC HISTORY
Ivan developed from a large tropical wave thatmoved across the west coast of Africa on 31 August.Already accompanied by a closed surface circulationand an impressive upper-level outflow pattern, the pre-cocious wave began to develop banded convectionearly on 1 September, and Dvorak satellite classifica-tions were initiated later that day. Convective activityincreased and it is estimated that a tropical depressionformed around 1800 UTC 2 September about 365 n misouth-southwest of the Cape Verde Islands. The de-pression reached storm intensity on 3 September andcontinued to strengthen. By 0600 UTC 5 September,Ivan had become a hurricane about 1000 n mi east ofthe southern Windward Islands. Within 18 h, Ivan’s es-timated minimum pressure had fallen by roughly 40mb, its winds had increased from 65 to 115 kt, and Ivanhad become the southernmost storm on record to reachmajor hurricane status, at 10.2°N. Ivan’s eyewall con-vection then eroded and the hurricane’s winds de-creased to about 90 kt over the next 24 h, but Ivan hadregained category 3 strength by the time the centerpassed about 6 n mi south of Grenada near 2130 UTC7 September. This track took the northern eyewall ofthe major hurricane directly over the island.
After passing Grenada and entering the southeasternCaribbean Sea, Ivan strengthened again and became acategory 5 hurricane south of the Dominican Republic,its winds reaching 140 kt at 0600 UTC 9 September.Ivan’s forward motion slowed while the extremely dan-gerous hurricane moved west-northwestward across thecentral Caribbean Sea toward Jamaica. Ivan weakenedback to a category 4 hurricane late on 9 September, butabruptly reintensified late on 10 September as it nearedthe island. Although hit hard, Jamaica was spared adirect category 5 strike by an eyewall replacement cyclethat halted development, coupled with a last-minuteturn to the west on 11 September that kept the center ofIvan at least 20 n mi offshore.
As Ivan moved west-northwestward away from Ja-maica it reacquired category 5 status, reaching its peakintensity at 0000 UTC 12 September, with maximumwinds of 145 kt and a minimum pressure of 910 mb (Fig.7). Although Ivan was weakening while the centerpassed south of Grand Cayman on 12 September, the
hurricane still brought sustained winds of category 4strength onshore, producing a storm surge that over-swept nearly all of the island.
On 13 September, Ivan approached a weakness inthe subtropical ridge over the central Gulf of Mexicoand turned northwestward. As Ivan moved over thedeep reservoir of warm water in the northwestern Ca-ribbean Sea, the hurricane’s upper-tropospheric out-flow was enhanced by south-southwesterly upper-levelflow ahead of an approaching trough. This combinationof favorable conditions may have helped Ivan maintaincategory 5 strength for 30 h, an unusually long period.Ivan’s eastern eyewall clipped the sparsely populatedextreme western tip of Cuba near 0100 UTC 14 Sep-tember as its center passed through the Yucatan Chan-nel.
Shortly after emerging over the southern Gulf ofMexico early on 14 September, Ivan turned north-northwestward and then northward. Gradual weaken-ing occurred as moderate southwesterly flow ahead of alarge mid- to upper-level trough over the centralUnited States caused vertical shear to increase acrossthe hurricane. As Ivan neared the northern U.S. GulfCoast, the upper-level wind flow ahead of the troughincreased and became more westerly, which increasedthe vertical shear further and advected dry air into thehurricane’s core. Despite the unfavorable environment,Ivan weakened only slowly and made landfall at ap-proximately 0650 UTC 16 September, just west of GulfShores, Alabama. The strongest winds at landfall, 105kt (category 3), occurred over a narrow area near theAlabama–Florida border on the east side of Ivan’s 40–50 n mi wide eye.
After Ivan moved across the barrier islands of Ala-bama, the hurricane turned north-northeastward acrosseastern Mobile Bay, and later weakened to a tropicalstorm over central Alabama and to a depression overnortheastern Alabama. Ivan moved northeastward forthe next 36 h, producing gusty winds, heavy rains, andtornadoes over the southeastern United States beforethe circulation merged with a frontal system and be-came extratropical over the Delmarva Peninsulaaround 1800 UTC 18 September.
During the extratropical transition, the upper por-tions of Ivan’s circulation were sheared off to the north-east and separated from the surface low. A distinctremnant low-level feature, however, remained identifi-able in surface and rawinsonde data even after Ivanmerged with the frontal system. Over the next 3 days,the remnant surface low separated from the front,moved south and southwestward in the western Atlan-tic, and eventually crossed the Florida peninsula on
MARCH 2006 A N N U A L S U M M A R Y 1005
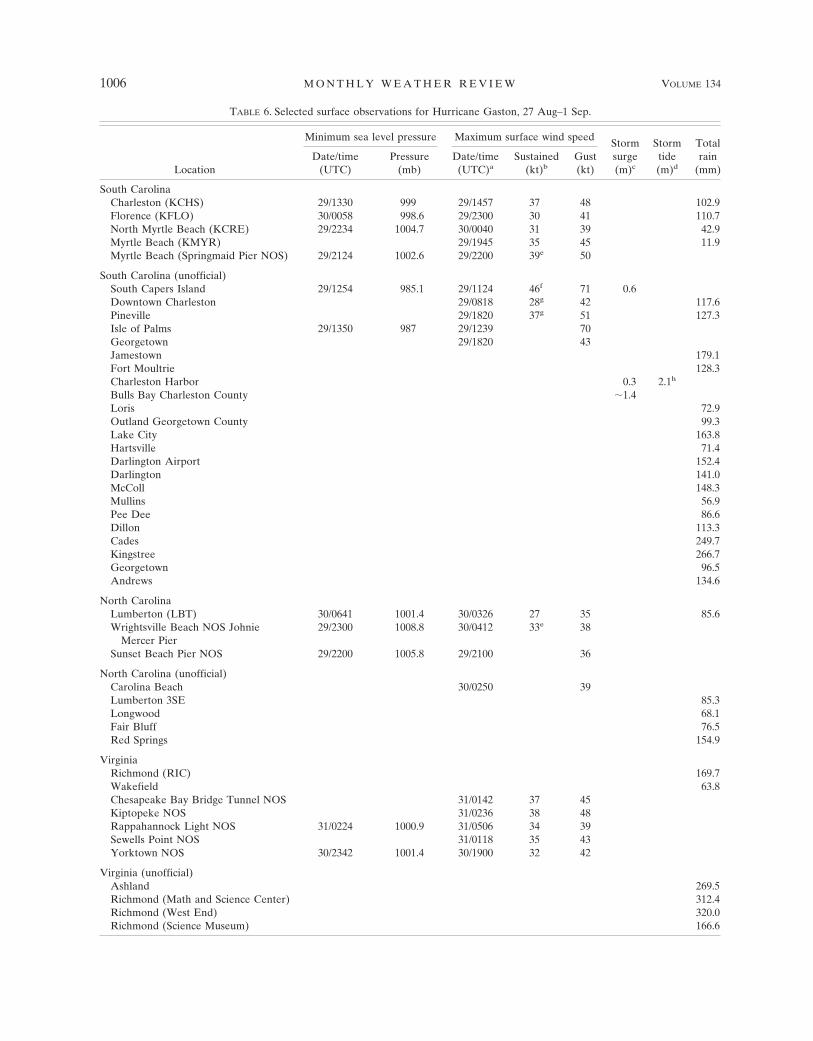
TABLE 6. Selected surface observations for Hurricane Gaston, 27 Aug–1 Sep.
Location
Minimum sea level pressure Maximum surface wind speedStormsurge(m)c
Stormtide(m)d
Totalrain
(mm)Date/time
(UTC)Pressure
(mb)Date/time
(UTC)aSustained
(kt)bGust(kt)
South CarolinaCharleston (KCHS) 29/1330 999 29/1457 37 48 102.9Florence (KFLO) 30/0058 998.6 29/2300 30 41 110.7North Myrtle Beach (KCRE) 29/2234 1004.7 30/0040 31 39 42.9Myrtle Beach (KMYR) 29/1945 35 45 11.9Myrtle Beach (Springmaid Pier NOS) 29/2124 1002.6 29/2200 39e 50
South Carolina (unofficial)South Capers Island 29/1254 985.1 29/1124 46f 71 0.6Downtown Charleston 29/0818 28g 42 117.6Pineville 29/1820 37g 51 127.3Isle of Palms 29/1350 987 29/1239 70Georgetown 29/1820 43Jamestown 179.1Fort Moultrie 128.3Charleston Harbor 0.3 2.1h
Bulls Bay Charleston County �1.4Loris 72.9Outland Georgetown County 99.3Lake City 163.8Hartsville 71.4Darlington Airport 152.4Darlington 141.0McColl 148.3Mullins 56.9Pee Dee 86.6Dillon 113.3Cades 249.7Kingstree 266.7Georgetown 96.5Andrews 134.6
North CarolinaLumberton (LBT) 30/0641 1001.4 30/0326 27 35 85.6Wrightsville Beach NOS Johnie
Mercer Pier29/2300 1008.8 30/0412 33e 38
Sunset Beach Pier NOS 29/2200 1005.8 29/2100 36
North Carolina (unofficial)Carolina Beach 30/0250 39Lumberton 3SE 85.3Longwood 68.1Fair Bluff 76.5Red Springs 154.9
VirginiaRichmond (RIC) 169.7Wakefield 63.8Chesapeake Bay Bridge Tunnel NOS 31/0142 37 45Kiptopeke NOS 31/0236 38 48Rappahannock Light NOS 31/0224 1000.9 31/0506 34 39Sewells Point NOS 31/0118 35 43Yorktown NOS 30/2342 1001.4 30/1900 32 42
Virginia (unofficial)Ashland 269.5Richmond (Math and Science Center) 312.4Richmond (West End) 320.0Richmond (Science Museum) 166.6
1006 M O N T H L Y W E A T H E R R E V I E W VOLUME 134

21 September and emerged over the southeastern Gulfof Mexico that afternoon. As the remnant low movedwestward across the warm water of the Gulf, showersand thunderstorms started developing and the low be-gan to reacquire tropical characteristics. By 1800 UTC22 September the system had become a tropical depres-sion again over the central Gulf of Mexico, and 6 h laterhad regained tropical storm strength about 120 n misouth of the mouth of the Mississippi River. Ivan turnednorthwestward, weakened, and made its final landfallas a tropical depression in extreme southwestern Loui-siana around 0200 UTC 24 September. Ivan dissipatedlater that morning about 20 n mi northwest of Beau-mont, Texas.
2) METEOROLOGICAL STATISTICS
Ivan’s track is notable in many respects. From initialgenesis to final dissipation, Ivan existed in some formfor 22.5 days and took a path over 5600 n mi long. Thesystem’s redevelopment into a tropical cyclone afterbecoming extratropical is almost unprecedented in the
Atlantic record.2 Ivan developed at an unusually lowlatitude, becoming one of only a dozen tropical cy-clones to reach storm strength south of 10°N, and wasthe southernmost system on record to reach major hur-ricane status. Ivan spent 10 days as a major hurricane(although not consecutively), the longest period sincethe reconnaissance era began in 1944, and 8 consecutivedays at category 4 or higher, also a record for thatperiod. Ivan’s minimum pressure of 910 mb has beensurpassed only by five other previous Atlantic tropicalcyclones: Gilbert (1988, 888 mb), the Labor Day Hur-
2 Storm number 3 in 1899 is another example. There was con-siderable debate as to whether the second genesis in the Gulf ofMexico should be given a new name and counted as a separatetropical cyclone. The decision to rename the system Ivan wasbased on NWS policy that “within a basin, if the remnant of atropical cyclone redevelops into a tropical cyclone, it is assignedits original number or name.” Given the length of time that Ivan’slow-level remnant lacked tropical characteristics, it would not beunreasonable to consider Ivan the Second as a distinct tropicalcyclone.
TABLE 6. (Continued)
Location
Minimum sea level pressure Maximum surface wind speedStormsurge(m)c
Stormtide(m)d
Totalrain
(mm)Date/time
(UTC)Pressure
(mb)Date/time
(UTC)aSustained
(kt)bGust(kt)
Richmond 162.6(St. Christopher’s School)Mechanicsville 271.8Chester 157.5Winterpock 144.5Sandston 205.7
Buoys/C-MAN41004 29/0850 99644004 31/1500 1012.2 31/1700 33g 4344008 31/2000 1000.4 31/2200 31 4244009 31/0700 1003.3 31/0940 27g 3444011 01/0200 1001.4 01/0310 28g 3844014 30/2300 1009.7 31/0500 28 3644137 01/0820 1000.4 01/0920 30 43Navy Tower R8 (TYBG1) 29/0532 1004.3 29/0432 39 47Navy Tower R2 (SPAG1) 29/0800 1003Duck (DUCN7) 30/2100 1009.7 31/0100 29 40Folly Beach (FBIS1) 29/1200 998 29/1200 32g 44Chesapeake Light (CHL V2) 31/0200 1006 31/0150 44g 51
a Date/time is for sustained wind when both sustained and gust are listed.b Except as noted, sustained wind averaging periods for C-MAN and land-based ASOS reports are 2 min; buoy averaging periods are
8 min.c Storm surge is water height above normal astronomical tide level.d Storm tide is water height above National Geodetic Vertical Datum (1929 mean sea level).e Six-minute average.f Two-minute average.g Ten-minute average.h Water height above mean lower low water.
MARCH 2006 A N N U A L S U M M A R Y 1007

ricane (1935, 892 mb), Allen (1980, 899 mb), Camille(1969, 905 mb), and Mitch (1998, 905 mb).
A total of 112 reconnaissance fixes were made inIvan: 95 by the AFRC and 17 by NOAA/AOC. In ad-dition, the NOAA Gulfstream-IV jet aircraft made 12synoptic surveillance flights around the periphery of thehurricane. Ivan’s official maximum wind estimate of145 kt is based on a flight-level (700 mb) reconnais-sance observation of 161 kt at 1917 UTC 11 September,when Ivan was located about 45 n mi west-southwest ofthe western tip of Jamaica. The lowest aircraft-reportedcentral pressure was 910 mb, measured at 0005 UTC 12September and again at 2053 UTC 13 September.
Selected surface observations for Ivan are given inTable 7. The highest surface wind observation fromIvan occurred on Grand Cayman at 1345 UTC 12 Sep-tember, where sustained winds of 130 kt and a gust to149 kt were reported. The highest U.S. report was froma storm chaser near Gulf Shores, Alabama, who mea-sured sustained 77-kt winds with a gust to 99 kt at 0602UTC 16 September. The highest official wind report inthe United States was 76 kt sustained with a gust to 93kt at the Pensacola Naval Air Station, Florida, at
0629 UTC 16 September. The lowest (unofficial) pres-sure observed in the United States was a storm-chaserreport of 943.1 mb in Fairhope, Alabama.
Ivan’s estimated intensity at its first U.S. landfall is105 kt. This estimate is based on a reconnaissance ob-servation of 120 kt at 700 mb just south of Gulf Shores,Alabama, at 0724 UTC 16 September, on NationalWeather Service Weather Surveillance Radar-1988Doppler (WSR-88D) observations of 120–122-kt in-bound velocities at an altitude of 1800 m over a periodof several hours, and on surface measurements fromthe SFMR instrument on the NOAA P-3 aircraft. TheSFMR data were evaluated by the NOAA HurricaneResearch Division (F. D. Marks Jr. 2004, personal com-munication; http://www.aoml.noaa.gov/hrd/project2005/SFMR.pdf), which concluded that the SFMR had mea-sured surface winds of 99 kt at 0135 UTC 16 Septemberabout 58 n mi south of the Alabama coast. Ivan’sstrongest winds over land most likely occurred overPerdido Key, to the west of the Pensacola Naval AirStation and to the east of the FCMP portable windtower at Gulf Shores, Alabama.
Rainfall exceeding 250 mm occurred on several of
FIG. 7. GOES-12 visible satellite image of Hurricane Ivan at 1815 UTC 13 Sep 2004, near the time of maximum intensity (imagecourtesy University of Wisconsin).
1008 M O N T H L Y W E A T H E R R E V I E W VOLUME 134
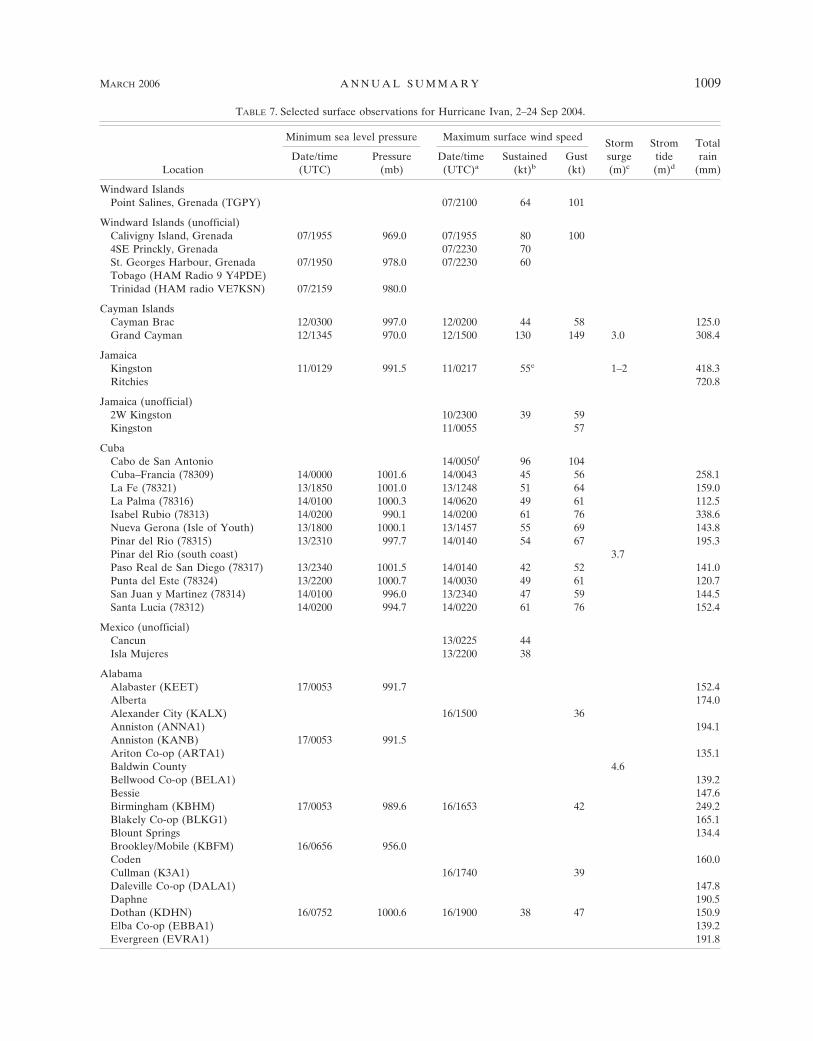
TABLE 7. Selected surface observations for Hurricane Ivan, 2–24 Sep 2004.
Location
Minimum sea level pressure Maximum surface wind speedStormsurge(m)c
Stromtide(m)d
Totalrain
(mm)Date/time
(UTC)Pressure
(mb)Date/time
(UTC)aSustained
(kt)bGust(kt)
Windward IslandsPoint Salines, Grenada (TGPY) 07/2100 64 101
Windward Islands (unofficial)Calivigny Island, Grenada 07/1955 969.0 07/1955 80 1004SE Princkly, Grenada 07/2230 70St. Georges Harbour, Grenada 07/1950 978.0 07/2230 60Tobago (HAM Radio 9 Y4PDE)Trinidad (HAM radio VE7KSN) 07/2159 980.0
Cayman IslandsCayman Brac 12/0300 997.0 12/0200 44 58 125.0Grand Cayman 12/1345 970.0 12/1500 130 149 3.0 308.4
JamaicaKingston 11/0129 991.5 11/0217 55e 1–2 418.3Ritchies 720.8
Jamaica (unofficial)2W Kingston 10/2300 39 59Kingston 11/0055 57
CubaCabo de San Antonio 14/0050f 96 104Cuba–Francia (78309) 14/0000 1001.6 14/0043 45 56 258.1La Fe (78321) 13/1850 1001.0 13/1248 51 64 159.0La Palma (78316) 14/0100 1000.3 14/0620 49 61 112.5Isabel Rubio (78313) 14/0200 990.1 14/0200 61 76 338.6Nueva Gerona (Isle of Youth) 13/1800 1000.1 13/1457 55 69 143.8Pinar del Rio (78315) 13/2310 997.7 14/0140 54 67 195.3Pinar del Rio (south coast) 3.7Paso Real de San Diego (78317) 13/2340 1001.5 14/0140 42 52 141.0Punta del Este (78324) 13/2200 1000.7 14/0030 49 61 120.7San Juan y Martinez (78314) 14/0100 996.0 13/2340 47 59 144.5Santa Lucia (78312) 14/0200 994.7 14/0220 61 76 152.4
Mexico (unofficial)Cancun 13/0225 44Isla Mujeres 13/2200 38
AlabamaAlabaster (KEET) 17/0053 991.7 152.4Alberta 174.0Alexander City (KALX) 16/1500 36Anniston (ANNA1) 194.1Anniston (KANB) 17/0053 991.5Ariton Co-op (ARTA1) 135.1Baldwin County 4.6Bellwood Co-op (BELA1) 139.2Bessie 147.6Birmingham (KBHM) 17/0053 989.6 16/1653 42 249.2Blakely Co-op (BLKG1) 165.1Blount Springs 134.4Brookley/Mobile (KBFM) 16/0656 956.0Coden 160.0Cullman (K3A1) 16/1740 39Daleville Co-op (DALA1) 147.8Daphne 190.5Dothan (KDHN) 16/0752 1000.6 16/1900 38 47 150.9Elba Co-op (EBBA1) 139.2Evergreen (EVRA1) 191.8
MARCH 2006 A N N U A L S U M M A R Y 1009

TABLE 7. (Continued)
Location
Minimum sea level pressure Maximum surface wind speedStormsurge(m)c
Stromtide(m)d
Totalrain
(mm)Date/time
(UTC)Pressure
(mb)Date/time
(UTC)aSustained
(kt)bGust(kt)
Flat Rock (FLRA1) 204.2Florence (C0168) 17/0050 37Fort Payne 6NE (LRWA1) 185.4Fort Payne (K4A9) 16/1920 45Gadsden (KGAD) 16/1735 37Geneva Co-op (GVAA1) 208.3Helena 119.9Huntsville (KHSV) 16/2353 994.3 16/2153 40Huntsville (KMDQ) 16/2242 35Jackson Shoals 102.9Ketona 246.1Lauderdale (RLDM6) 16/1113 47Lower Bryant Landing NOS 1.0Manchester 110.5Maxwell AFB (KMXF) 16/1755 989.9 16/1257 31 57 248.4Millers Ferry (MRFA1) 296.2Mobile (KMOB) 16/0725 964.4 16/0644 51 65 141.2Mobile 2S 251.5Mobile 3S 160.0Mobile 7S 165.9Mobile 10S 203.2Mobile County 2.7Montgomery (KMGM) 16/1753 989.5 16/1353 32 50Muscle Shoals (KMSL) 16/2253 998.7 16/2110 40Newton Co-op (NEWA1) 138.9Ozark/Fort Rucker (KOZR) 16/1055 999.8 16/0955 38 154.9Robertsdale 237.5Selma (SELA1) 225.3Silverhill (3S) 258.1Spanish Fort 16/0800 51 203.2Talladega 142.2Tannehill 247.9Troy (KTOI) 16/1755 994.7 16/1128 37Trussville (TRSA1) 227.8Tuscaloosa (KTCL) 16/1353 996.7 16/1453 43Valley Head (VYHA1) 210.1Wing 6NE (OPNA1) 16/1022 58Wedowee 132.1
Alabama (unofficial)Andalusia 253.0Fairhope 16/0418 63Fairhope (storm chaser) 16/ 943.1Fairhope FCMP Tower 2 (30.48°N,
87.88°W)16/0644 59 77
Grand Bay 16/0517 62Gulf Shores Airport Doppler on
Wheels (DOW3)16/ 73 95
Gulf Shores (Texas Tech University) 16/0615 70 89Gulf Shores (storm chaser
M. Sudduth)16/0647 947.2 16/0602e 77 99
Mobile (Wallace Tunnel) 16/0940 51Mobile (WKRG-TV) 16/0604 64Semmes 16/0830 967.5 16/0500 49 51 127.0Mobile Bay (USNS Fisher) 16/0830 957.0USS Alabama 16/0635e 91Ram Powell VK-956 Oil Rig (29.05°N,
88.10°W)15/2256f 952.6 15/2256f 102g 135g
1010 M O N T H L Y W E A T H E R R E V I E W VOLUME 134

TABLE 7. (Continued)
Location
Minimum sea level pressure Maximum surface wind speedStormsurge(m)c
Stromtide(m)d
Totalrain
(mm)Date/time
(UTC)Pressure
(mb)Date/time
(UTC)aSustained
(kt)bGust(kt)
Wolf Bay/Orange Beach SailboatOdalisque
16/0600f 126h
Wolf Field Airport 16/0515 66 87
FloridaApalachicola (KAAF) 104.4Baker (BAKF1) 264.4Bay County 3.0Big Pine Key 53.8Bristol Co-op (BRLF1) 177.8Bruce Co-op (BRUF1) 179.1Chipley Co-op (CHPF1) 137.7Crestview (CRVF1) 195.1Dixie County 1.2Eglin AFB (KVPS) 16/0755 991.6 16/0755 46 70 188.7Escambia County 4.6Franklin County 1.5Gulf County (St. Joseph State Park) 1.8Hillsborough County (Hillsborough
Bay)1.1
Huntsville (KHSV) 94.7Jefferson County 1.2Key West (KEYW) 14/0903 36 46 0.3 28.2Levy County (Cedar Key) 0.6Lowry Mill Co-op 186.2(LOWA1)Marianna Co-op (MALF1) 134.1Mayport NAS (KNRB) 21/0355 34Milligan (MLGF1) 287.3Mossy Head Co-op (MHDF1) 235.2Munson 165.1Nettles Island (NETF1) 193.5Niceville 166.4Okaloosa County 2.7Panama City (KPFN) 16/0853 999.9 16/1700 30 60Pensacola (KPNS) 16/0645 970.2 16/0650 67 87Pensacola NAS (KNPA) 16/0656 965.8 16/0629 76 93 203.2Pensacola (WEAR-TV) 401.1Perry (K40J) 16/1749 41Saint Augustine (KSGJ) 21/0300 36Santa Rosa County 4.6Seminole 5NE 205.7Tallahassee (KTLH) 16/1605 33 47Taylor County 1.2Walton County 3.0Wakulla County 1.5
Florida (unofficial)Carabelle Beach 15/2216 999.0 15/2216 28 37Crestview 213.4Cudjoe Key 13/1348 36Destin 16/0652 60 77Eglin AFB 5S Harold 16/0850 981.4Eglin 10S Harold 16/0740 982.1 16/0710 78 145.3Eglin 10N Mary Esther 16/0820 986.8 16/0730 75Eglin 5NE Semmole 16/0920 992.1 16/0940 75 205.7Eglin 5SW Mossy Head 16/0900 991.0Eglin 8SW Mossy Head 16/0710 60
MARCH 2006 A N N U A L S U M M A R Y 1011

TABLE 7. (Continued)
Location
Minimum sea level pressure Maximum surface wind speedStormsurge(m)c
Stromtide(m)d
Totalrain
(mm)Date/time
(UTC)Pressure
(mb)Date/time
(UTC)aSustained
(kt)bGust(kt)
Eglin 10S Mossy Head 16/0900 994.2 226.6Eglin 2SW Mary Esther 16/0850 103i
Fort Walton 153.9Molino Fire Department 16/0855 70Pensacola FCMP Tower 1 (30.48°N,
87.19°W)16/0649 69 92
Pensacola Police Department 16/0644 108h 342.9St. George Island 16/0150 1005 16/0150 39West Pensacola 16/ 84
GeorgiaChickamauga (FTOG1) 196.9Clayton 10W (TCLG1) 199.9Columbus (KCSG) 16/2151 997.1 16/2227 39Ellijay 7NW (MTNG1) 183.9Helen (HELG1) 217.7Helen 7N (BRSG1) 17/0306 61Hurst 3SE (HSTG1) 213.9Lafayette 5SW (LFYG1) 184.9Mountain City 2N (MTCG1) 180.3Nacoochee (NACG1) 233.7Pine Mountain (PIMG1) 198.1Preston Co-op (PRSG1) 141.5Tallula Falls (TLUG1) 200.2Titus (TUSG1) 235.5
LouisianaBootheville 16/0000 52 26.7Calcasieu Pass—East Jetty 0.5Cameron Prairie NWR 105.2Cocodrie 16/0000 36Grand Isle—East Point 0.5Lake Charles (KLCH) 23/2346 1012.5 24/0217 23 30 29.5Lake Pontchartrain—midlake 16/0330 35 46New Orleans (KNEW) 16/0125 994.2 16/0206 41 48 2.0New Orleans (KMSY) 16/0644 998.0 15/2138 33 40Pointe a la Hache—northeast Bay
Gardene16/0400 60
Rockefeller NWR 81.8Slidell (KASD) 16/0147 994.2 16/0011 32 37 6.6SW Pass NOS 0.9
MississippiBiloxi Bay NOS 1.0Biloxi Harbor—Pointe Cadet 16/0245 47 68Columbus AFB (KCBM) 16/1955 995.8 16/1855 35Gholson 8W (GHLM6) 135.9Gulfport (KGPT)e 16/0703 983.7 16/0059 40 53 43.2Keesler AFB (KBIX) 16/0655 982.9 16/0644 42 62 83.3Meridian NAS (KNMM) 16/1555 992.0 16/1255 30 51Orange Grove—Interstate 10 16/0715 46Pascagoula 3NNE 144.8Pascagoula (KPQL)e 16/0536 975.6 15/2349 37 51 29.2Pass Christian—U.S. Coast Guard
Merril Shell Bank Lighthouse16/0500 64
Van Cleave (BCVM6) 94.7Waveland NOS 16/0636 989.4 16/0242 34 49 1.0
1012 M O N T H L Y W E A T H E R R E V I E W VOLUME 134

TABLE 7. (Continued)
Location
Minimum sea level pressure Maximum surface wind speedStormsurge(m)c
Stromtide(m)d
Totalrain
(mm)Date/time
(UTC)Pressure
(mb)Date/time
(UTC)aSustained
(kt)bGust(kt)
Mississippi (unofficial)Pascagoula/Jackson County EOC 16/0600 76 159.8Waveland Hancock County EOC 16/0430 53
New HampshireJaffrey (AFN) 185.4
New JerseyColumbia (CMBN4) 139.7
New YorkDeposit (DEPN6) 136.4Fishs Eddy (FSHN6) 137.2Stuyvesant 5N (STYN6) 129.8Windham (WDMN6) 138.4
North CarolinaBlack Mountain (MMTN7) 229.9Boone (KTNB) 17/0801 45Cruso 431.8Canton 10SSW (SNBN7) 226.6Daniel Ridge (DNRN7) 209.6Hawk (HAKN7) 180.8Highlands (HILN7) 207.3Highlands (TVA) 300.5Hogback (IHBN7) 226.6Jonas Ridge (JSRN7) 227.3Laurel Springs (LRLN7) 17/0810 51e
Plumtree (PLMN7) 205.2Rich Mountain (RCMN7) 205.2Rosman 6E (CFFN7) 198.9Spruce Pine 3SE (SPPN7) 182.9Yancey (YNCN7) 190.5
OhioAlbany (ABNO1) 216.7
PennsylvaniaBlakeslee (TBYP1) 208.3Scrub Oak (SCBP1) 211.3
TennesseeMcDonald 280.2Sweetwater (SWET1) 228.3Whitwell 7SE (PCFT1) 16/2106 51
TexasBeckville (BEKT2) 199.6Eagle Point—Galveston Bay 0.5Galveston Pier 21 0.5Matagorda Island (MIRT2) 24/0512 47Sabine Pass North 0.4Steinhagen Lake (TBLT2) 179.6
VirginiaBig Meadows (BGMV2) 145.3Strasburg (STGV2) 139.7TS121 RAWS (37.9°N, 81.9°W) 17/2214 34
West VirginiaGallipois Dam (GALW2) 150.9Moundsville (MOUW2) 195.1
MARCH 2006 A N N U A L S U M M A R Y 1013

the Caribbean islands and caused extensive freshwaterflooding and/or mud slides. Rainfall totals include 721mm from Jamaica, 411 mm from Tobago, 339 mm fromwestern Cuba, and 308 mm from Grand Cayman. In theUnited States, rainfall totals exceeded 200 mm in nu-merous locations from Alabama and the Florida pan-handle northeastward across the eastern TennesseeValley. Highest reported totals include 401 mm inPensacola and 432 mm in Cruso, North Carolina. Wide-spread flooding resulted from these rains, which fell onground already saturated by Tropical Storm Bonnieand Hurricane Frances.
Nearly every location on Grand Cayman becamesubmerged at some point during Ivan’s passage, a con-sequence of a 3-m storm surge topped by large batter-ing waves. A storm surge of 3.0–4.6 m occurred fromDestin, Florida, to Mobile Bay. Storm surge values of
1.8–2.7 m were observed from Destin eastward to St.Marks in the Florida Big Bend region. The Tampa Bayarea, well away from the hurricane’s strong winds, ex-perienced a 1.0-m surge.
Ivan, responsible for an outbreak of 117 tornadoesover the period 15–17 September, is among the toptornado-producing cyclones on record. Thirty-seven ofthese occurred in Virginia, 25 in Georgia, 18 in Florida,9 in Pennsylvania, 8 in Alabama, 7 in South Carolina, 6in Maryland, 4 in North Carolina, and 3 in West Vir-ginia. At least two of these tornadoes were of F2 inten-sity.
3) CASUALTY AND DAMAGE STATISTICS
The direct death toll from Ivan stands at 92: 39 inGrenada, 25 in United States, 17 in Jamaica, 4 in Do-minican Republic, 3 in Venezuela, 2 in Cayman Islands,
TABLE 7. (Continued)
Location
Minimum sea level pressure Maximum surface wind speedStormsurge(m)c
Stromtide(m)d
Totalrain
(mm)Date/time
(UTC)Pressure
(mb)Date/time
(UTC)aSustained
(kt)bGust(kt)
C-MAN/BuoysSW Pass (BURL1) 15/2300 983.6 15/2310 72 87SW Pass (BURL1) 23/0500 1013.8 23/0300 35Chesapeake Light (CHLV2) 18/0400 1001.8 18/2230 39 48Dauphin Island (DPIA1) 16/0705 952.7 16/0405 63 89Duck (DUCN7) 19/0300 1011.4 19/0400 38 47Grand Isle (GDIL1) 16/0000 994.2 15/2310 46 61Galveston Pier (GLPT2) 23/2200 1012.2 22/0900 32 0.5Isle Dernieres (ILDL1) 23/0900 1013.7 23/0900 35Sand Key (SANF1) 13/1200 1010.9 13/1200 36 42Tyndall AFB C (SGOF1) 15/2100 1005.2 15/2200 49 62Ship Island Pass (SIPM6)e 15/2300 997.4 15/2300 38South Timbalier Block 52 (SPLL1) 16/0200 999.6 16/0200 42S. Timbalier Block 52 (SPLL1) 23/0700 1011.9 23/0700 36Thomas Point (TPLM2) 18/1740 34 41U.S. Navy Tower 8 (TYBG1) 21/0726 1016.6 21/0726 3542001 15/1050 995.2 15/0950 3742003 15/0750 993.5 15/0230 55 7242007e 16/0350 976.0 16/0350 49 6842036 15/2020 34 4942039 15/2350 995.1 15/2150 45 6242040 16/0150 955.3 15/2300 55 7342041 15/1950 997.6 15/1950 3544017 18/1650 1006.9 18/1650 35
a Date/time is for sustained wind when both sustained and gust are listed.b Except as noted, sustained wind averaging periods for C-MAN and land-based ASOS reports are 2 min; buoy averaging periods are
8 min.c Storm surge is water height above normal astronomical tide level.d Storm tide water height above National Geodetic Vertical Datum (1929 mean sea level).e Record incomplete due to instrument failure.f Estimated.g Elevation 122 m.h Elevation 22 m.i Elevation 61 m.
1014 M O N T H L Y W E A T H E R R E V I E W VOLUME 134

and 1 each in Tobago and Barbados. The U.S. deathsoccurred in Florida (14), North Carolina (8), Georgia(2), and Mississippi (1). The breakdown of U.S. deathsby hazard is as follows: tornado (7), storm surge (5),freshwater floods (4), mud slides (4), wind (3), and surf(2).
Damage was extensive throughout the Caribbean. InBarbados, over 175 homes were completely destroyed.In Grenada, Ivan became the worst hurricane disastersince Janet in 1955, with more than 14 000 homes dam-aged or destroyed, and at least 80% of the nutmeg treesdestroyed. At least 47 000 homes were damaged in Ja-maica, and most of the island’s utilities were damaged.Ninety-five percent of the homes and other structuresin the Cayman Islands were damaged or destroyed. InCuba, roofs were torn off homes in extreme westernPinar Del Rio Province, and flooding damaged houses,as well as fishing and farm installations.
Ivan is the third most costly hurricane disaster in theUnited States, with damage estimated to be near $14.2billion. The AISG reports an insured loss estimated at$7.11 billion. Damage was most severe in the Pensacolaarea, where Ivan was the most destructive hurricane inmore than 100 yr. Portions of the Interstate 10 bridgesystem over Pensacola Bay were severely damagedfrom surge and wave action; about a quarter-mile of thebridge collapsed into the bay. The U.S. Highway 90causeway across the northern part of the bay was alsoheavily damaged. To the southwest of Pensacola, Per-dido Key bore the brunt of Ivan’s fury and was essen-tially leveled. In the Alabama and Florida panhandleareas, widespread overwash occurred along much ofthe coastal highway system. In addition, extensivebeach erosion caused severe damage to or the destruc-tion of numerous beachfront homes and condominiumbuildings. Some buildings collapsed due to scouring ofthe sand from underneath the foundations by wave ac-tion.
Ivan’s effects were far-reaching. Ivan left more than1.8 million people without power across nine states.The Minerals Management Service of the Departmentof the Interior reported that the normal daily flow of475 000 barrels of oil and 1.8 billion cubic feet of naturalgas from the Gulf of Mexico was disrupted for morethan 4 weeks. A total of 12 large pipelines and 6 drillingplatforms sustained major damage; another 7 platformswere completely destroyed. Millions of acres of wood-lands and forests were destroyed.
Some damage estimates outside the United Stateswere provided by the Caribbean Development Bank.These include $1.85 billion in the Cayman Islands, $815million in Grenada, and $360 million in Jamaica.
j. Hurricane Jeanne: 13–28 September
Jeanne produced catastrophic flash floods in Haitithat killed over 3000 people, and later struck the eastcoast of Florida as a major hurricane. Jeanne was thefourth hurricane to hit the state of Florida in 2004, andthe second to strike Florida’s Treasure Coast in a3-week span.
1) SYNOPTIC HISTORY
Jeanne formed from a tropical wave that moved fromAfrica to the eastern tropical Atlantic Ocean on 7 Sep-tember. There was little development until the waveneared the Leeward Islands, where a tropical depres-sion formed on 13 September about 85 n mi east-southeast of Guadeloupe. The cyclone moved slowly tothe west-northwest in the flow to the south of the At-lantic subtropical ridge, becoming a tropical storm thenext day while still affecting the islands. Continuingwest-northwestward, Jeanne moved slowly over theVirgin Islands as it strengthened, making landfall on 15September in southeastern Puerto Rico with 60-ktwinds. After crossing Puerto Rico and entering theMona Passage, Jeanne reached hurricane strength be-fore moving inland again at the eastern tip of the Do-minican Republic at 1100 UTC 16 September.
Jeanne spent nearly 36 h over the rough terrain ofHispaniola, generating torrential rainfall before emerg-ing into the Atlantic north of the island as a poorlyorganized depression. Late on 18 September, Jeanne’slow-level center of circulation moved westward and dis-sipated away from the system’s deep convection; how-ever, a new center developed, giving the appearance ofa brief northeastward motion of the cyclone near theTurks and Caicos Islands (Fig. 1).
Meanwhile, steering currents in the western Atlanticwere weakening. The midlevel remnants of HurricaneIvan had combined with an extratropical short-wavetrough over the northeastern United States and movedinto the western Atlantic, eroding the subtropical ridgeto the north of Jeanne. Jeanne moved slowly throughand north of the southeastern Bahamas over the nextcouple of days while it gradually regained the strengthit had lost over Hispaniola. Jeanne became a hurricaneagain at 1800 UTC 20 September, and then began aslow anticyclonic loop about 500 n mi east of the north-western Bahamas. Jeanne strengthened at first, reach-ing category 2 intensity early on 22 September, butweakened the next day within a relatively dry environ-ment and over the cooler waters upwelled during itsloop and also earlier by Frances.
By 23 September, high pressure had built in over thenortheastern United States and the western Atlantic,
MARCH 2006 A N N U A L S U M M A R Y 1015

causing Jeanne to turn westward and increase its for-ward speed. Moving away from the cooler waters,Jeanne became a major hurricane at 1200 UTC 25 Sep-tember as the center moved over Abaco and thenGrand Bahama Island. At 0400 UTC 26 September, thecenter of Jeanne’s 50 n mi wide eye crossed the Floridacoast near Stuart, at virtually the identical spot thatFrances had come ashore 3 weeks earlier. Maximumwinds at the time of landfall are estimated to be near105 kt.
Jeanne weakened as it moved across central Florida,becoming a tropical storm at 1800 UTC 26 Septembernear Tampa, and then weakening to a depression a daylater over central Georgia. The depression was still ac-companied by heavy rain when it moved over the Caro-linas, Virginia, and the Delmarva Peninsula on 28 and29 September before merging with a frontal zone andbecoming extratropical at 0000 UTC on 29 September.
2) METEOROLOGICAL STATISTICS
Selected observations from Jeanne are given in Table8. Jeanne’s rains were the primary hazard for the is-lands of the Caribbean. Extreme rain accumulationsoccurred in Puerto Rico and Hispaniola, with 603 mmreported at Camp Garcia in Vieques, resulting in his-torical flooding levels at many riverside locations withinPuerto Rico. The St. Thomas airport reported 308 mmof rain, and there were unofficial reports of 300-mmrains in Guadeloupe and islands nearby. Wind reportsinclude a sustained wind of 45 kt in St. Croix and 43 ktin San Juan.
Jeanne’s estimated intensity at its Florida landfall,105 kt, is based in part on reconnaissance aircraft windspeeds of 113 kt measured at 700 mb at 1429 UTC on 25September and again at 0228 UTC on 26 September,adjusted to the surface using the standard 0.90 adjust-ment factor. The latter observation was made about 1.5h prior to landfall, just offshore of Sebastian, Florida,and about 35 n mi north of the hurricane’s center. Fur-ther supporting this estimate is an SFMR surface mea-surement of 99 kt, also obtained within 1.5 h of landfalljust offshore of Sebastian. A NOAA/Hurricane Re-search Division evaluation of the SFMR data forJeanne (F. D. Marks Jr. 2004, personal communication;http://www.aoml.noaa.gov/hrd/project2005/SFMR.pdf)concluded that this observation appeared to be reason-able. Unfortunately, there were no surface observationsat the coast near Sebastian to confirm whether thesecategory 3 winds reached the shoreline. The minimumsurface pressure in Jeanne is estimated to be 950 mb atthe time of landfall on the Florida east coast, basedprimarily on an observation of 952.9 mb at Fort Pierce,located 15 to 20 n mi north of where the center crossed
the coast. A dropsonde measured a 951-mb surfacepressure a few hours earlier.
The highest land-based sustained surface wind reportwas 79 kt at the Melbourne NWS office. This was ob-served at 0818 UTC when the center was about 45 n misouthwest of the observing site. A measurement of 69kt was made on the north shore of Lake Okeechobee at0515 UTC. The observations indicate that a swath ofhurricane-force sustained winds, about 90 n mi wide,affected the Florida east coast from near Cape Canav-eral southward to near Stuart. The highest wind gustreported in Florida was 111 kt at Fort Pierce Inlet, anda 106-kt gust was reported from Vero Beach. Sustainedhurricane-force winds spread westward and inlandabout halfway across Florida and tropical-storm-forcewinds affected a large portion of the remainder of cen-tral Florida.
A storm surge of 1.2 m above normal astronomicaltide levels was measured at Trident Pier at Port Canav-eral, Florida, about an hour after landfall. Storm surgeflooding of up to 1.8 m above normal tides likely oc-curred along the Florida east coast from the vicinity ofMelbourne southward to Fort Pierce. On the Floridawest coast, a negative storm surge of about 1.4 m belownormal tides was measured at Cedar Key when windswere blowing offshore. This was followed by a positivesurge of about 1.1 m above normal when winds becameonshore.
Widespread rainfall of up to 200 mm accompaniedHurricane Jeanne as it moved across eastern, central,and northern Florida. A narrower band of 280–330 mmwas observed in the vicinity of the eyewall track overOsceola, Broward, and Indian River counties of eastcentral Florida. A secondary radar-estimated rainfallmaximum of around 280 mm was observed over Duvaland Nassau Counties in northeast Florida. Rainfallamounts of 100–175 mm accompanied Jeanne acrosscentral Georgia and the western portions of the Caro-linas and Virginia.
3) CASUALTY AND DAMAGE STATISTICS
Media reports indicate that the death toll in Haiti isover 3000, including nearly 2900 in the mud-crustedcoastal city of Gonaives, and that some 200 000 peoplein Gonaives lost their homes, belongings, and liveli-hoods in the hurricane.
There were six direct deaths in the Unites States: onein Puerto Rico, three in Florida, one in South Carolina,and one in Virginia. In Puerto Rico, a woman was killedby falling debris from a collapsing home. In ClayCounty, Florida, a boy was playing outside during highwinds when a tree limb fell, striking him on the head. InBrevard County, Florida, a man driving his truck onto
1016 M O N T H L Y W E A T H E R R E V I E W VOLUME 134

TABLE 8. Selected surface observations for Hurricane Jeanne, 13–28 Sep 2004.
Location
Minimum sea level pressure Maximum surface wind speedStormsurge(m)c
Stormtide(m)d
Totalrain
(mm)Date/time
(UTC)Pressure
(mb)Date/time
(UTC)aSustained
(kt)bGust(kt)
FloridaCraig Field (KCRG) 15/1653 999.9 15/1929 37 55 31.2Cross City (KCTY) 27/0313 982.1 26/2149 39 54 140.0Daytona Beach (KDAB) 26/1908 993.6 26/1520 45 55 58.7Fargo (FFPG1) 179.1Fernandina Beach NOS 27/0800 999.4 0.8 2.8Fort Lauderdale (KFXE) 26/0200 990.8 26/0053 35 49 18.8Fort Pierce (KFPR) 26/0413 952.9 26/0215 45 76Gainesville (KGNV) 26/2333 985.1 27/0345 38 52 124.5Jacksonville (KJAX) 27/0011 995.9 27/0013 40 48 118.1Mayport NAS (KNRB) 26/2338 998.0 27/0004 44 49 0.7 2.4 48.3Mayport Bar Pilot Station NOS 26/2354 998.3 0.6 2.3Melbourne NWS 26/0818 79 155.4Melbourne (KMLB)e 26/0458 986.8 25/2343 52 68 153.4NAS Jacksonville (KNIP) 26/2355 995.9 44 55 105.7Ocala (KOCF) 26/2215 980.0 27/0515 30 44 176.8Orlando (KMCO) 26/1555 985.1 26/1055 53 67Orlando (KORL)e 26/0807 994.2 26/0501 34 47 137.2Ocilla (OCIGI) 142.2Palm Bay Co-op 26/0819 74 226.8Port Canaveral USCG 26/0610 76Palm Beach (KPBI) 26/0200 974.2 26/0153 60 231.1Pompano Beach (KPMP) 26/0200 989.5 26/0127 40 58 66.5Sanford (KSFB) 26/1943 988.8 26/1302 46 60 111.0St. Augustine (KSGJ) 26/2315 997.0 26/1955 42 53 80.3Tallahassee (KTLH) 27/0808 990.2 27/0601 29 42 30.7Trident Pier Port Canaveral NOS 1.2Vero Beach (KVRB)e 129.0Ashburn (ASHG1) 143.5Bell 4 WNW (BLLF1) 175.3Lakeland (LAKG1) 218.2Live Oak (LVOF1) 276.4Mayo (MAYF1) 193.0Tifton (TFTG1) 228.1
Florida (unofficial)STN 22 (28.66°N, 82.35°W)f 26/1730 987.8 26/1200 57 127.3STN 34 (28.82°N, 82.34°W)f 26/1900 990.1 26/2030 47 114.8STN 65 (28.61°N, 82.19°W)f 26/1600 988.6 26/1104 49S65 DWX (27.31°N, 81.02°W)g 26/0545 45 88L001 (27.14°N, 80.79°W)g 26/0700 960.4 26/0515 69h 91h
L005g 26/0645 974.4 26/0808 82L006g 26/0615 974.9 26/0646 79LXWSg 26/0334 77Fort Pierce Inlet (27.48°N, 80.3°W) 26/0528 111i
Jensen Beach (27.26°N, 80.23°W) 91Juno Beach (26.875°N, 80.070°W) 25/2250 959.6 25/2235 34 62Kenansville 304.0Lakeland (south) 26/1500 968 26/1100 71e 205.5NASA Wind Tower 1j (28.43°N,
80.57°W) 26/0340 39 73NASA Wind Tower 19j (28.74°N,
80.7°W) 26/0745 50 68NASA Wind Tower 22j (28.8°N,
80.74°W) 26/1855 50 66NASA Wind Tower 1007j (28.53°N,
80.77°W) 26/0955 50 72Port Saint Lucie 26/0424 953.7 26/0213 49 74
MARCH 2006 A N N U A L S U M M A R Y 1017

TABLE 8. (Continued)
Location
Minimum sea level pressure Maximum surface wind speedStormsurge(m)c
Stormtide(m)d
Totalrain
(mm)Date/time
(UTC)Pressure
(mb)Date/time
(UTC)aSustained
(kt)bGust(kt)
Sebastiank 26/0647 71 88Sebastian 92e
Sebastian (27.81°N, 80.48°W) 26/0235 971.4 26/0400 71 79Port Saint Lucie CW0572 26/0424 953.7Vero Beach KF4PKB 26/0625 965.5Vero Beachk 26/0417 68 106Wimauma 4SW 984 26/1524 48 70 65.5
GeorgiaFort Pulaski NOS 0.8 2.8Moody AFB (KVAD) 182.4Savannah (KSAV) 27/2153 1003 27/1640 29 38 24.9St. Simons Island NOS 0.4 2.9Valdosta (KVLD) 27/0849 987.8 27/0119 35 45 136.7
Georgia (unofficial)Homerville 208.8Nahunta 115.3Rocky Ford 81.0
South CarolinaCharleston (KCHS) 28/0856 1006 28/0622 28 36 0.4 2.1 25.7Fripps Inlet NOS 0.6 2.5
Puerto Rico and Virgin IslandsSan Juan 15/1908 1004.1 15/1734 43 62 151.9St. Croix Airport 15/0750 1003.1 15/0800 45 54 155.7St. Thomas Airport 15/0813 1010.2 15/1755 34 44 307.8Aibonito 1S (ALPP4) 474.2Corozal (ZDBP4) 362.0Jayuya near Bo. Saliente (JAZP4) 375.9Lago De Matrullas–Orocovis (OROP4) 388.1Queb. Blanca near San Lorenzo (SLGP4) 376.9Rio Icacos near Naguabo (NGIP4) 468.4Rio Mameyes near Sabana (MSAP4) 434.1Rio Matrullas Alert gage (ZDDP4) 386.1Rio Turabo near Borinquen (CAKP4) 361.2Vieques—Camp Garcia (WVEP4) 603.3
Puerto Rico (unofficial)Cayey Spotter 15/1425 63Hapenney Beach 15/1230 54
Virgin IslandsCharlotte Amalie, St. Thomas (XTCP4) 324.4Turpentine Run, St. Thomas (XTFP4) 307.1
Virgin Islands (unofficial)Maria Hill Spotter St. Croix 15/1156 995.8 15/1150 83 194.3St. Croix east end 15/0746 1007.8 15/0616 63 126.7
Guadeloupe (unofficial)Southwestern Guadeloupe 177.8�Marie-Galante 304.8�
C-MAN/buoysCedar Key (CDRF1) 26/2056 987.6 26/1800 30 40Egmont Key (EGKF1) 26/1818 46 55Lake Worth (LKWF1) 26/0300 974.2 26/0300 52 82Port Richey (PTRF1) 26/2130 44Settlement Point (SPGF1) 25/2100 961.8 26/0000 77 86St. Augustine (SAUF1) 26/2105 995.4 27/0150 48 65
1018 M O N T H L Y W E A T H E R R E V I E W VOLUME 134

a flooded roadway had his vehicle carried into a drain-age canal where he drowned. In Indian River County,Florida, an elderly woman was leaving her home to goto a shelter when a door blown open by wind threw herto the ground, causing fractures. She was hospitalizedfor her injuries and died a few days later. In FairfieldCounty, South Carolina, a man died in a tornado, and inPatrick County, Virginia, a woman drowned in a flashflood.
The AISG reports insured property losses in theUnited States of $3.44 billion. Total U.S. damage isestimated to be near $6.9 billion.
k. Hurricane Karl: 16–24 September
Karl formed from a strong tropical wave that movedwestward across the coast of Africa on 13 September.Shower activity increased on 14 September, and a tropi-cal depression formed near 0600 UTC 16 Septemberabout 340 n mi southwest of the southern Cape VerdeIslands. The depression initially moved westward southof the subtropical ridge and strengthened into a tropicalstorm later that day. Over the next few days Karlmoved generally northwestward over the open watersof the central Atlantic, becoming a hurricane on 18September, and a major hurricane, the sixth and last ofthe season, on 19 September. Karl’s estimated peakintensity of 125 kt occurred on 21 September. Karlturned northeastward the next day in response to adeep-layer baroclinic trough developing north of thehurricane, began to weaken, and became extratropicalon 25 September about 510 n mi east of Cape Race. As
an extratropical low, Karl moved northeastward andeastward across the North Atlantic Ocean and theNorth Sea, eventually reaching Norway before beingabsorbed into another extratropical low late on 28 Sep-tember.
l. Hurricane Lisa: 19 September–3 October
Developing from a tropical wave that crossed theAfrican coast on 16 September, Lisa had a relativelyinteresting history for a storm that remained entirely atsea. Early on 19 September the wave showed enoughorganization to warrant a Dvorak classification, and by1800 UTC that day the system had developed into atropical depression, about 450 n mi west-southwest ofthe Cape Verde Islands. The synoptic-scale environ-ment was not particularly favorable for development—the depression was located between Hurricane Karlabout 650 n mi to its west-northwest and a large andconvectively active tropical wave just a few hundredmiles to its southeast. Despite outflow from HurricaneKarl impinging on the depression from the north, asmall organized core developed and the depression rap-idly strengthened on 20 September, becoming a tropicalstorm by 1200 UTC and reaching an estimated intensityof 60 kt 18 h later. The northerly shear prevailed, how-ever, and Lisa gradually weakened over the next coupleof days. Meanwhile, the wave disturbance was ap-proaching Lisa from the east, and the two systems be-gan a Fujiwhara interaction. Lisa turned southward on22 September and then eastward the next day as theconvection from the two systems became hard to dis-
TABLE 8. (Continued)
Location
Minimum sea level pressure Maximum surface wind speedStormsurge(m)c
Stormtide(m)d
Totalrain
(mm)Date/time
(UTC)Pressure
(mb)Date/time
(UTC)aSustained
(kt)bGust(kt)
Tarpon Springs (TARF1) 26/2106 4441008 27/1250 1003 27/1450 29 3841010 25/2200 1000.5 25/2300 33 4341012 26/2250 999.442036 26/2350 997.6 26/1850 31 41
a Date/time is for sustained wind when both sustained and gust are listed.b Except as noted, sustained wind averaging periods for C-MAN and land-based ASOS reports are 2 min; buoy averaging periods are
8 min.c Storm surge is water height above normal astronomical tide level.d Storm tide is water height above National Geodetic Vertical Datum (1929 mean sea level).e Record incomplete due to instrument failure.f Seminole County Mesonet.g South Florida Water Management District.h Anemometer height 9 m AGL.i Davis Weather Wizard II anemometer, 16 m AGL.j Anemometer height 9 m AGL.k Florida Coastal Monitoring Program.
MARCH 2006 A N N U A L S U M M A R Y 1019

tinguish. Although Lisa weakened to a tropical depres-sion on 23 September, it was able to maintain a smallbut distinct low-level circulation throughout its mergerwith the disturbance. Lisa completed its cyclonic loopearly on 24 September, its intensity oscillating withvariations in the northerly wind shear.
On 25 September Lisa turned sharply northwardahead of a deep mid- to upper-level trough movingsoutheastward into the central Atlantic. Lisa movednorthward for five days as a tropical storm, nearlyreaching hurricane intensity on 29 September when anupper-level trough in the westerlies cut off to the south-west of Lisa, reducing the southwesterly shear over thestorm. During this time satellite images showed aragged eye ringed by shallow convection. The followingday Lisa crossed some cooler water upwelled by Hur-ricane Karl, convection diminished, and the cyclone’swinds dropped to 45 kt, even though the eye featureremained distinct.
On 1 October, Lisa turned northeastward and accel-erated ahead of an approaching shortwave trough inthe westerlies. Southwesterly shear diminished and Lisarestrengthened over 25°C waters. Early on 2 October,cloud tops cooled significantly around the eye andDvorak estimates reached as high as 77 kt. Based on thesatellite classifications, it is estimated that Lisa becamea hurricane, after 13 days of existence as a tropicalcyclone, at 0600 UTC 2 October, about 625 n mi south-east of Cape Race. At this time, water temperaturesunder the cyclone were close to 23°C. Lisa was a hur-ricane for less than 12 h before the cloud pattern beganto deteriorate rapidly. Lisa lost tropical characteristicsby 0600 UTC 3 October, and was absorbed into a fron-tal zone a few hours later, about 1000 n mi east-southeast of Cape Race.
m. Tropical Storm Matthew: 8–10 October
Matthew’s precursor disturbance was a weak tropicalwave that moved across the west coast of Africa on 19September. The wave was poorly defined between Af-rica and the Lesser Antilles because of its close prox-imity to (then) Tropical Storm Lisa and another largedisturbance in the tropical Atlantic, but became con-vectively active when it interacted with an upper-levellow in the eastern Caribbean Sea. The shower activityassociated with the wave reached the Bay of Campecheon 5 October, stalled, and gradually became better or-ganized. Over the next couple of days, upper-level ridg-ing developed over the convection and surface pres-sures began to fall, and on 7 October, data from a re-connaissance aircraft indicated a broad area of lowpressure had formed just east of Tampico, Mexico. Thesystem continued to develop, and a tropical depression
formed near 1200 UTC 8 October about 180 n misoutheast of Brownsville, Texas. By 1800 UTC that daythe cyclone had strengthened into a tropical storm.
Matthew moved eastward initially, but graduallyturned to the northeast and north around a large mid-to upper-level low over western Texas. It is estimatedthat Matthew reached its peak intensity of 40 kt at 1800UTC 9 October. Matthew made landfall just west ofCocodrie, Louisiana around 1100 UTC 10 October withmaximum winds of 35 kt. After landfall, Matthewweakened quickly to a depression and was absorbed bya frontal system by 1200 UTC 11 October.
Table 9 shows selected surface observations in Loui-siana associated with Matthew. The maximum rainfallreported was 412 mm at Reserve in St. John Parish. An83-kt wind gust from the BURL1 site appears to havebeen produced by an isolated convective cell, and is notconsidered representative of the strength of the tropicalstorm. The highest surge reported was 1.8 m at Frenier.Matthew is known to have spawned one tornado, nearGolden Meadow.
Local newspapers reported that Grand Isle sufferedextensive beachfront erosion. In Terrebonne Parishabout 20 homes were flooded by the combination ofrains and storm surge. Overall, damage was minor andthere were no reported deaths or injuries.
n. Subtropical Storm Nicole: 10–11 October
Nicole’s genesis appears to be associated with an up-per-tropospheric trough and a decaying frontal systemthat were over the southwestern North Atlantic duringthe first week of October. Although a persistent low-level trough also extended northward from the LesserAntilles at this time, analysis of satellite images andsurface data suggest that the tropical trough was notrelated to the development of the subtropical cyclone.By 8 October, a broad area of surface low pressurebecame evident about 400 n mi southeast of Bermuda,and although it lacked a single, well-defined center ofcirculation, this system began to produce gale forcewinds that affected Bermuda on 9 October (at 2055UTC, the island reported 37-kt sustained winds, with agust to 52 kt). Around 0000 UTC 10 October, a better-defined low-level circulation developed about 140 n mito the south of Bermuda, and a distinctly curved cloudband developed over the northwestern semicircle of thesystem shortly thereafter. It is estimated that a sub-tropical storm formed at 0600 UTC 10 October, cen-tered about 120 n mi southwest of Bermuda—the sub-tropical designation being based on the cloud pattern,which lacked deep convection over the center, and thelocation of the strongest winds, which were more than100 n mi from the center.
1020 M O N T H L Y W E A T H E R R E V I E W VOLUME 134

Nicole moved northwestward initially, but turnednortheastward due to the presence of a midtropo-spheric trough that was moving off the northeast coastof the United States. Nicole’s center passed about 50 nmi to the northwest of Bermuda around 0000 UTC 11October; sustained winds reached 39 kt at Bermuda asNicole passed by. Early on 11 October, some deep con-vection developed closer to Nicole’s center, suggestingthat the system was beginning to acquire fully tropicalcharacteristics. Deep convection failed to wrap aroundthe center, however, and strong upper-level southwest-erly flow sheared the convection away from the center.The storm did not strengthen significantly while it ac-celerated northeastward to north-northeastward, and itsoon came under the influence of a strong extratropicalcyclone that was centered just south of Nova Scotia.Nicole was absorbed by this cyclone shortly after 1800UTC 11 October.
o. Tropical Storm Otto: 29 November–3 December
A cold front emerged off the east coast of the UnitedStates on 21 November and moved slowly eastward be-
fore stalling about midway between Bermuda and theAzores early on 25 November. Around 0000 UTC 26November, an extratropical occluded low developedalong the front about 1000 n mi southwest of theAzores Islands in response to forcing from a strongupper-level trough. The occluded surface low quicklydeepened and developed a large area of gales later thatday, while the upper-level trough continued to digsouthward and cut off to the south of the occludedsurface low. The surface and upper-level lows movedgenerally southwestward at 5–10 kt in tandem for thenext three days. Late on 28 November, weak ridgingformed over the surface low and convective bandingfeatures began to develop near its center; this was con-current with the dissipation of the surface frontal struc-ture. Satellite classifications suggest that the system be-came a subtropical storm about 1000 n mi east-southeast of Bermuda near 1200 UTC 29 November.
Otto moved northwestward through a weakness inthe midlevel subtropical ridge located to its north. Con-vection continued to increase, and AMSU data suggestthat Otto had acquired enough of a warm core to be
TABLE 9. Selected surface observations for Tropical Storm Matthew, 8–10 Oct 2004.
Location
Minimum sea level pressure Maximum surface wind speedStormsurge(m)c
Stormtide(m)d
Totalrain
(mm)Date/time
(UTC)Pressure
(mb)Date/time
(UTC)aSustained
(kt)bGust(kt)
LouisianaNew Orleans Lakefront Airport
(KNEW)10/1205 1003.7 10/1306 33 41 103.1
Slidell (KASD) 131.1Baton Rouge (KBTR) 188.5New Orleans (KMSY) 190.5Lumcon 10/1000 1001.7 10/0200 34Louisiana State University (LSU)
Agricultural Station Citrus10/1506 38 138.9
Tambour Bay 10/1000 999.7Cocodrie 1.1Mandeville 1.6Frenier 1.8Galliano 362.7Thibodaux 239.5LSU Agricultural Station Sugarcane 330.7Houma 225.0Paradis 220.5Reserve 412.2
C-MANSW Pass (BURL1) 10/1200 1004.0 10/0940 42 48Grand Isle (GDIL1) 10/1100 1002.8 10/0927 40 1.1
a Date/time is for sustained wind when both sustained and gust are listed.b Except as noted, sustained wind averaging periods for C-MAN and land-based ASOS reports are 2 min; buoy averaging periods are
8 min.c Storm surge is water height above normal astronomical tide level.d Storm tide is water above National Geodetic Vertical Datum (1929 mean sea level).
MARCH 2006 A N N U A L S U M M A R Y 1021
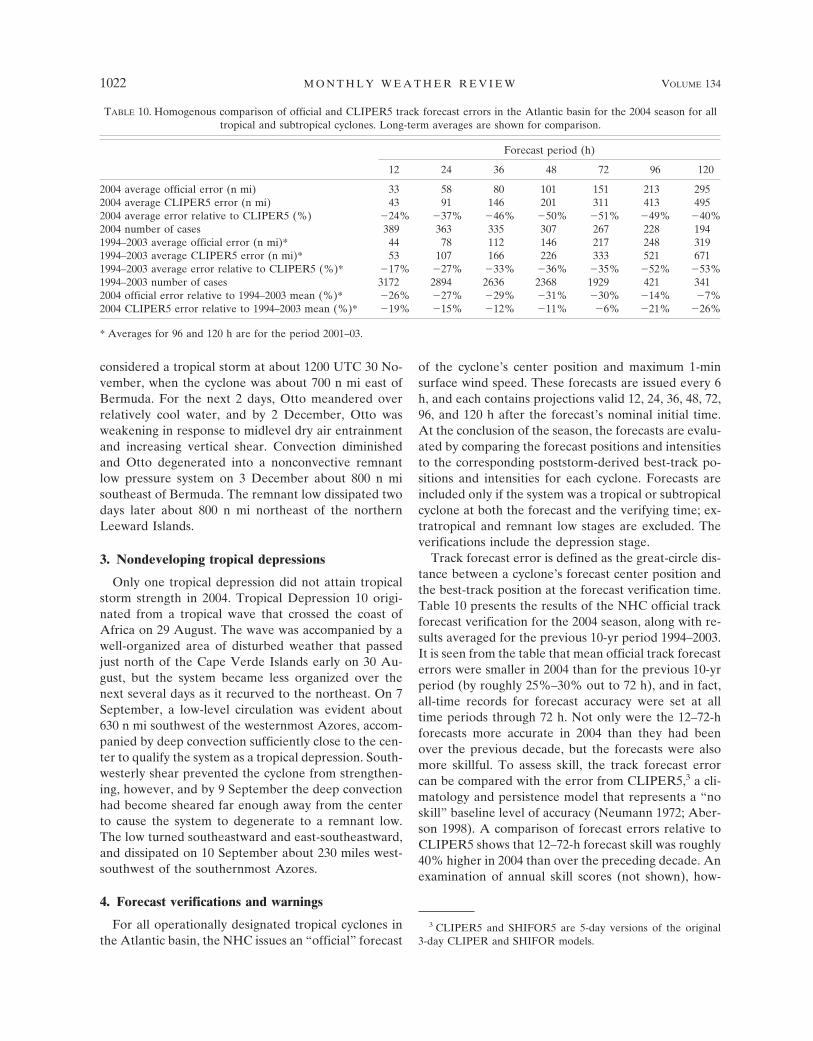
considered a tropical storm at about 1200 UTC 30 No-vember, when the cyclone was about 700 n mi east ofBermuda. For the next 2 days, Otto meandered overrelatively cool water, and by 2 December, Otto wasweakening in response to midlevel dry air entrainmentand increasing vertical shear. Convection diminishedand Otto degenerated into a nonconvective remnantlow pressure system on 3 December about 800 n misoutheast of Bermuda. The remnant low dissipated twodays later about 800 n mi northeast of the northernLeeward Islands.
3. Nondeveloping tropical depressions
Only one tropical depression did not attain tropicalstorm strength in 2004. Tropical Depression 10 origi-nated from a tropical wave that crossed the coast ofAfrica on 29 August. The wave was accompanied by awell-organized area of disturbed weather that passedjust north of the Cape Verde Islands early on 30 Au-gust, but the system became less organized over thenext several days as it recurved to the northeast. On 7September, a low-level circulation was evident about630 n mi southwest of the westernmost Azores, accom-panied by deep convection sufficiently close to the cen-ter to qualify the system as a tropical depression. South-westerly shear prevented the cyclone from strengthen-ing, however, and by 9 September the deep convectionhad become sheared far enough away from the centerto cause the system to degenerate to a remnant low.The low turned southeastward and east-southeastward,and dissipated on 10 September about 230 miles west-southwest of the southernmost Azores.
4. Forecast verifications and warnings
For all operationally designated tropical cyclones inthe Atlantic basin, the NHC issues an “official” forecast
of the cyclone’s center position and maximum 1-minsurface wind speed. These forecasts are issued every 6h, and each contains projections valid 12, 24, 36, 48, 72,96, and 120 h after the forecast’s nominal initial time.At the conclusion of the season, the forecasts are evalu-ated by comparing the forecast positions and intensitiesto the corresponding poststorm-derived best-track po-sitions and intensities for each cyclone. Forecasts areincluded only if the system was a tropical or subtropicalcyclone at both the forecast and the verifying time; ex-tratropical and remnant low stages are excluded. Theverifications include the depression stage.
Track forecast error is defined as the great-circle dis-tance between a cyclone’s forecast center position andthe best-track position at the forecast verification time.Table 10 presents the results of the NHC official trackforecast verification for the 2004 season, along with re-sults averaged for the previous 10-yr period 1994–2003.It is seen from the table that mean official track forecasterrors were smaller in 2004 than for the previous 10-yrperiod (by roughly 25%–30% out to 72 h), and in fact,all-time records for forecast accuracy were set at alltime periods through 72 h. Not only were the 12–72-hforecasts more accurate in 2004 than they had beenover the previous decade, but the forecasts were alsomore skillful. To assess skill, the track forecast errorcan be compared with the error from CLIPER5,3 a cli-matology and persistence model that represents a “noskill” baseline level of accuracy (Neumann 1972; Aber-son 1998). A comparison of forecast errors relative toCLIPER5 shows that 12–72-h forecast skill was roughly40% higher in 2004 than over the preceding decade. Anexamination of annual skill scores (not shown), how-
3 CLIPER5 and SHIFOR5 are 5-day versions of the original3-day CLIPER and SHIFOR models.
TABLE 10. Homogenous comparison of official and CLIPER5 track forecast errors in the Atlantic basin for the 2004 season for alltropical and subtropical cyclones. Long-term averages are shown for comparison.
Forecast period (h)
12 24 36 48 72 96 120
2004 average official error (n mi) 33 58 80 101 151 213 2952004 average CLIPER5 error (n mi) 43 91 146 201 311 413 4952004 average error relative to CLIPER5 (%) �24% �37% �46% �50% �51% �49% �40%2004 number of cases 389 363 335 307 267 228 1941994–2003 average official error (n mi)* 44 78 112 146 217 248 3191994–2003 average CLIPER5 error (n mi)* 53 107 166 226 333 521 6711994–2003 average error relative to CLIPER5 (%)* �17% �27% �33% �36% �35% �52% �53%1994–2003 number of cases 3172 2894 2636 2368 1929 421 3412004 official error relative to 1994–2003 mean (%)* �26% �27% �29% �31% �30% �14% �7%2004 CLIPER5 error relative to 1994–2003 mean (%)* �19% �15% �12% �11% �6% �21% �26%
* Averages for 96 and 120 h are for the period 2001–03.
1022 M O N T H L Y W E A T H E R R E V I E W VOLUME 134
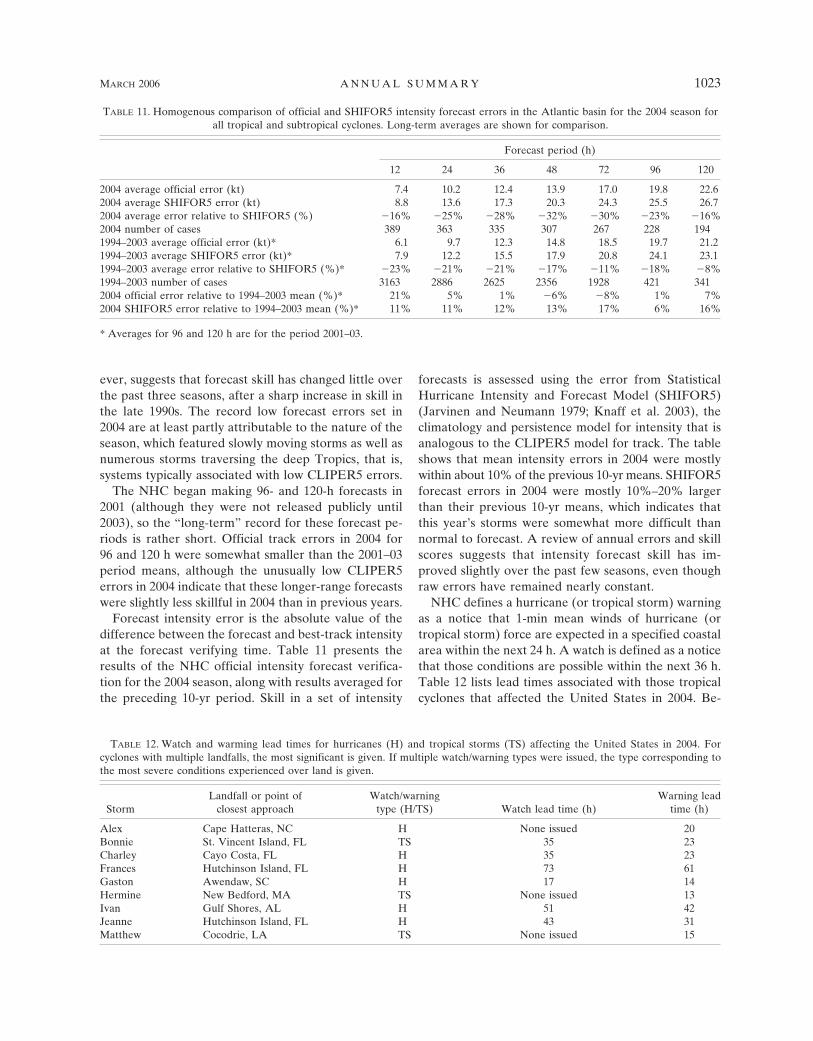
ever, suggests that forecast skill has changed little overthe past three seasons, after a sharp increase in skill inthe late 1990s. The record low forecast errors set in2004 are at least partly attributable to the nature of theseason, which featured slowly moving storms as well asnumerous storms traversing the deep Tropics, that is,systems typically associated with low CLIPER5 errors.
The NHC began making 96- and 120-h forecasts in2001 (although they were not released publicly until2003), so the “long-term” record for these forecast pe-riods is rather short. Official track errors in 2004 for96 and 120 h were somewhat smaller than the 2001–03period means, although the unusually low CLIPER5errors in 2004 indicate that these longer-range forecastswere slightly less skillful in 2004 than in previous years.
Forecast intensity error is the absolute value of thedifference between the forecast and best-track intensityat the forecast verifying time. Table 11 presents theresults of the NHC official intensity forecast verifica-tion for the 2004 season, along with results averaged forthe preceding 10-yr period. Skill in a set of intensity
forecasts is assessed using the error from StatisticalHurricane Intensity and Forecast Model (SHIFOR5)(Jarvinen and Neumann 1979; Knaff et al. 2003), theclimatology and persistence model for intensity that isanalogous to the CLIPER5 model for track. The tableshows that mean intensity errors in 2004 were mostlywithin about 10% of the previous 10-yr means. SHIFOR5forecast errors in 2004 were mostly 10%–20% largerthan their previous 10-yr means, which indicates thatthis year’s storms were somewhat more difficult thannormal to forecast. A review of annual errors and skillscores suggests that intensity forecast skill has im-proved slightly over the past few seasons, even thoughraw errors have remained nearly constant.
NHC defines a hurricane (or tropical storm) warningas a notice that 1-min mean winds of hurricane (ortropical storm) force are expected in a specified coastalarea within the next 24 h. A watch is defined as a noticethat those conditions are possible within the next 36 h.Table 12 lists lead times associated with those tropicalcyclones that affected the United States in 2004. Be-
TABLE 11. Homogenous comparison of official and SHIFOR5 intensity forecast errors in the Atlantic basin for the 2004 season forall tropical and subtropical cyclones. Long-term averages are shown for comparison.
Forecast period (h)
12 24 36 48 72 96 120
2004 average official error (kt) 7.4 10.2 12.4 13.9 17.0 19.8 22.62004 average SHIFOR5 error (kt) 8.8 13.6 17.3 20.3 24.3 25.5 26.72004 average error relative to SHIFOR5 (%) �16% �25% �28% �32% �30% �23% �16%2004 number of cases 389 363 335 307 267 228 1941994–2003 average official error (kt)* 6.1 9.7 12.3 14.8 18.5 19.7 21.21994–2003 average SHIFOR5 error (kt)* 7.9 12.2 15.5 17.9 20.8 24.1 23.11994–2003 average error relative to SHIFOR5 (%)* �23% �21% �21% �17% �11% �18% �8%1994–2003 number of cases 3163 2886 2625 2356 1928 421 3412004 official error relative to 1994–2003 mean (%)* 21% 5% 1% �6% �8% 1% 7%2004 SHIFOR5 error relative to 1994–2003 mean (%)* 11% 11% 12% 13% 17% 6% 16%
* Averages for 96 and 120 h are for the period 2001–03.
TABLE 12. Watch and warming lead times for hurricanes (H) and tropical storms (TS) affecting the United States in 2004. Forcyclones with multiple landfalls, the most significant is given. If multiple watch/warning types were issued, the type corresponding tothe most severe conditions experienced over land is given.
StormLandfall or point of
closest approachWatch/warning
type (H/TS) Watch lead time (h)Warning lead
time (h)
Alex Cape Hatteras, NC H None issued 20Bonnie St. Vincent Island, FL TS 35 23Charley Cayo Costa, FL H 35 23Frances Hutchinson Island, FL H 73 61Gaston Awendaw, SC H 17 14Hermine New Bedford, MA TS None issued 13Ivan Gulf Shores, AL H 51 42Jeanne Hutchinson Island, FL H 43 31Matthew Cocodrie, LA TS None issued 15
MARCH 2006 A N N U A L S U M M A R Y 1023

cause observations are generally inadequate to deter-mine when hurricane or tropical storm conditions firstreach the coastline, for purposes of this discussion thelead time is defined as the time elapsed between theissuance of the watch or warning and the time of land-fall or closest approach of the center to the coastline.Such a definition will usually overstate by a few hoursthe actual lead time available, particularly for tropicalstorm conditions. The table includes only the most sig-nificant (i.e., strongest) landfall for each cyclone, andonly verifies the strongest conditions occurring onshore. Issuance of warnings for non-U.S. territories isthe responsibility of the governments affected and isnot tabulated here.
The table shows that while 24-h notice was not al-ways achieved in 2004, ample warning was given for theseason’s most significant events (Charley, Frances,Ivan, and Jeanne). The lead time for Frances, in fact,was longer than desirable, resulting from Frances’ for-ward motion slowing more than anticipated. Lead timesfor the Alex and Gaston hurricane warnings were lessthan desirable due to unexpected strengthening ofthese systems. In the case of Matthew, a strong pressuregradient was already producing gale-force winds overthe northeastern Gulf of Mexico during the genesis ofthe tropical cyclone, and the tropical storm warning wasissued to supersede a preexisting gale warning on thecoast. Although not listed in the table, the BermudaWeather Service handled Subtropical Storm Nicole in asimilar fashion, issuing a gale warning for Bermudamore than a day before the subtropical cyclone formed.
While numerous records for accuracy were set in2004, forecasts for Hurricane Charley garnered consid-erable attention for a perceived lack of accuracy, withmany residents of the Charlotte Harbor area expressingsurprise at the hurricane’s landfall, despite the fact thata hurricane warning had been in effect there for 23 h.This surprise resulted from an unwarranted focus onspecific NHC forecast track positions issued in the final24 h before landfall, which showed Charley’s track in-tersecting the coastline in the Tampa Bay area. Char-ley’s landfall at Cayo Costa was about 60 n mi south asmeasured along the coastline from Tampa. Yet theforecast errors at Charley’s landfall were not unusuallylarge; the 12-h forecast verifying at 1800 UTC 13 Au-gust had an error of 29 n mi, better than 45% of all 12-hforecasts issued in 2004, and the 24-h error verifying atthe same time was only 40 n mi, better than 64% of the24-h forecasts issued in 2004. The potential for a largeapparent landfall error had been anticipated; the NHCTropical Cyclone Discussion product accompanying theinitial Florida hurricane warning stated, “BecauseCharley is expected to approach the west coast of
Florida at a sharply oblique angle . . . it is unusuallydifficult to pinpoint Charley’s landfall . . . as small er-rors in the track forecast would correspond to largeerrors in the location and timing of landfall.” No onenear the landfall location should have been unpreparedfor the arrival of Charley. Neither should they havebeen unprepared for a category 4 hurricane. The NHCintensity forecast made 24 h prior to landfall indicatedthat Charley would strengthen from category 2 to cat-egory 3. NHC routinely recommends in off-seasontraining sessions for decision makers to prepare for onecategory higher than the NHC is forecasting, due tolimitations in intensity forecast skill. Charley’s rapidstrengthening just prior to landfall is an example of whythat recommendation is made.
Acknowledgments. The authors thank Chris Veldenand David Stettner of the University of Wisconsin/Cooperative Institute for Meteorological Satellite Stud-ies (CIMSS) for the satellite images presented here.Tropical Prediction Center colleague Dr. Stephen R.Baig produced the track chart. Additional figures wereprovided by Dr. Gerry Bell of the NWS/Climate Pre-diction Center and David Roth of the NWS/Hydro-meteorological Prediction Center, and TPC colleagueJoan David. Much of the local impact information con-tained in the individual storm summaries was compiledby local NWS Weather Forecast Offices in the affectedareas.
REFERENCES
Aberson, S. D., 1998: Five-day tropical cyclone track forecasts inthe North Atlantic basin. Wea. Forecasting, 13, 1005–1015.
——, and J. L. Franklin, 1999: Impact on hurricane track andintensity forecasts of GPS dropwindsonde observations fromthe first season flights of the NOAA Gulfstream-IV jet air-craft. Bull. Amer. Meteor. Soc., 80, 421–427.
Dvorak, V. E., 1984: Tropical cyclone intensity analysis using sat-ellite data. NOAA Tech. Rep. NESDIS 11, 47 pp.
Franklin, J. L., M. L. Black, and K. Valde, 2003: GPS dropwind-sonde wind profiles in hurricanes and their operational im-plications. Wea. Forecasting, 18, 32–44.
Hawkins, J. D., T. F. Lee, J. Turk, C. Sampson, F. J. Kent, and K.Richardson 2001: Real-time Internet distribution of satelliteproducts for tropical cyclone reconnaissance. Bull. Amer.Meteor. Soc., 82, 567–578.
Herndon, D. C., and C. Velden, 2004: Upgrades to the UW-CIMSS AMSU-based tropical cyclone intensity estimationalgorithm. Preprints, 26th Conf. on Hurricanes and TropicalMeteorology, Miami, FL, Amer. Meteor. Soc., 118–119.
Hock, T. F., and J. L. Franklin, 1999: The NCAR GPS dropwind-sonde. Bull. Amer. Meteor. Soc., 80, 407–420.
Jarvinen, B. R., and C. J. Neumann, 1979: Statistical forecasts oftropical cyclone intensity for the North Atlantic basin.NOAA Tech. Memo. NWS NHC-10, 22 pp.
Kistler, R., and Coauthors, 2001: The NCEP–NCAR 50-Year Re-
1024 M O N T H L Y W E A T H E R R E V I E W VOLUME 134

analysis: Monthly means CD-ROM and documentation. Bull.Amer. Meteor. Soc., 82, 247–268.
Knaff, J. A., M. DeMaria, B. Sampson, and J. M. Gross, 2003: Sta-tistical, five-day tropical cyclone intensity forecasts derived fromclimatology and persistence. Wea. Forecasting, 18, 80–92.
Neumann, C. B., 1972: An alternate to the HURRAN (hurricaneanalog) tropical cyclone forecast system. NOAA Tech.Memo. NWS SR-62, 24 pp.
Saffir, H. S., 1973: Hurricane wind and storm surge. Mil. Eng., 423,4–5.
Simpson, R. H., 1974: The hurricane disaster potential scale.Weatherwise, 27, 169, 186.
Tsai, W.-Y., M. Spender, C. Wu, C. Winn, and K. Kellogg, 2000:SeaWinds of QuikSCAT: Sensor description and mission
overview. Proc. IGARSS 2000 Symp., Vol 3, Honolulu, HI,IEEE, 1021–1023.
Uhlhorn, E. W., and P. G. Black, 2003: Verification of remotelysensed sea surface winds in hurricanes. J. Atmos. OceanicTechnol., 20, 99–116.
Velden, C. S., and K. F. Brueske, 1999: Tropical cyclone warmcores as observed from the NOAA polar orbiting satellite’snew Advanced Microwave Sounder Unit. Preprints, 23dConf. on Hurricanes and Tropical Meteorology, Dallas, TX,Amer. Meteor. Soc., 182–185.
——, T. L. Olander, and R. M. Zehr, 1998: Development of anobjective scheme to estimate tropical cyclone intensity fromdigital geostationary satellite infrared imagery. Wea. Fore-casting, 13, 172–186.
MARCH 2006 A N N U A L S U M M A R Y 1025