the advisory board company - snl advisory board company in brief the advisory board company provides...
TRANSCRIPT
The Advisory Board Company
Fiscal Year 2003 Annual Report to Shareholders

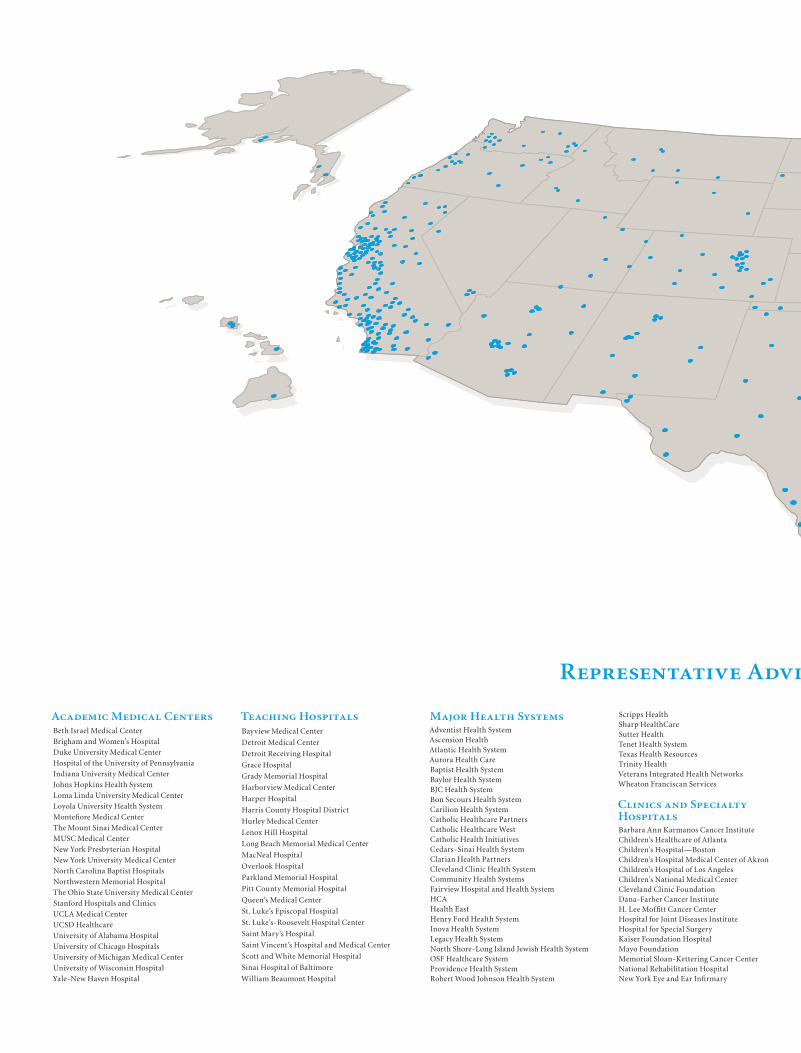
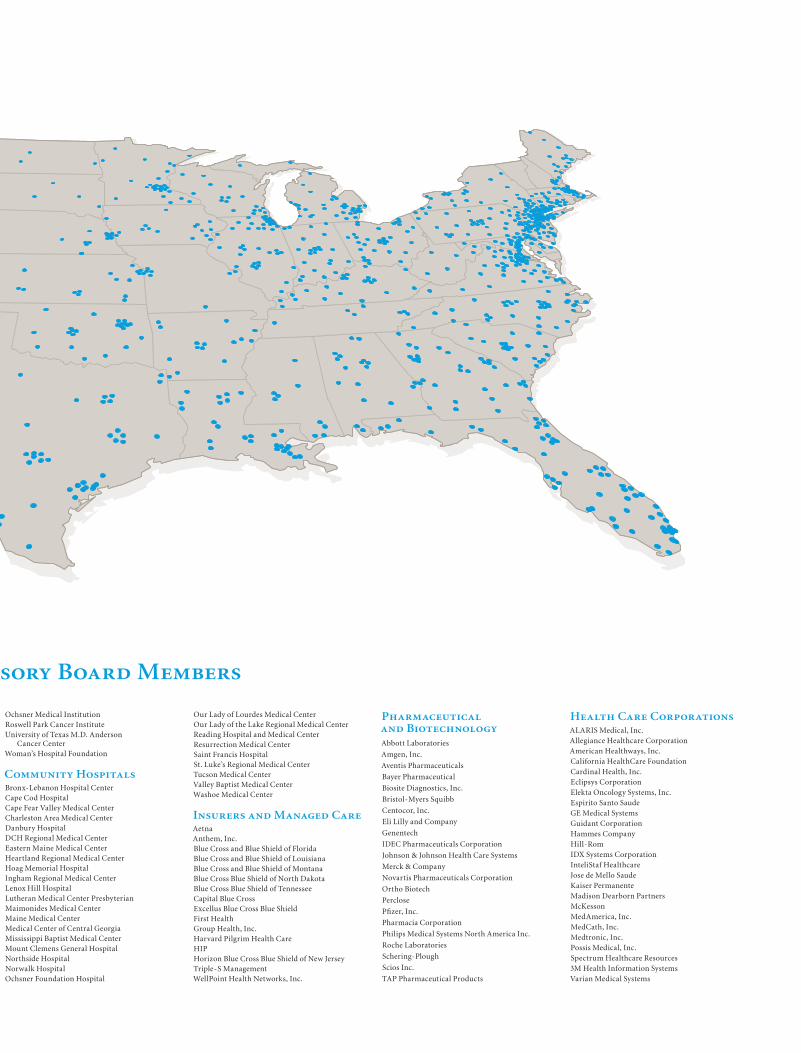
The Advisory Board Company in BriefThe Advisory Board Company provides best practices research and analysis to the health care industry, focusing on business strategy, operations, and general management issues. The company’s research services are offered through discrete annual programs to a membership of nearly 2,300 hospitals, health systems, pharmaceutical and biotech companies, health care insurers, and medical device companies.
Our business model is predicated on the view that there are economies of intellect in health care, compelling intellectual advantages to large numbers of health systems, corporations, and clinicians collaborating to identify ideas with potential to shape the industry. By providing a standardized set of services in each of our programs, we are able to spread our largely fi xed program cost structure across our membership base of participating companies. This economic model allows us to provide our members with access to industry best practices at a fraction of the cost of a customized analysis performed by a major consulting fi rm.
For a fi xed annual fee, members of each of our programs have access to an integrated set of services designed to provide valuable, timely information derived from lessons learned from the industry’s most progressive participants. These services can include:
• Best practice research studies
• Executive education seminars
• Customized research briefs
• Web-based access to content databases and decision-support tools
We strive to provide our members with an unparalleled level of service. Our hope is that our members conclude that they do not work with any other organization so dedicated to intelligent service and that therefore there is little question as to their long-term commitment to working with us.
2001 2002 2003
$63.7
$81.0
$100.7
2001 2002 2003
($0.6)
$3.8
$10.0 $8.9
$14.4 $15.1
Historical
Pro Forma*
* Pro forma presentations are not presented in accordance with Generally Accepted Accounting Principles (GAAP). See page 5 for a reconciliation of GAAP to pro forma results.
Annual Revenuesfor Fiscal Years Ending March 31
In Millions
Annual Revenuesfor Fiscal Years Ending March 31
In Millions
Net Income (Loss)for Fiscal Years Ending March 31
In Millions
Net Income (Loss)for Fiscal Years Ending March 31
In Millions
Representative Adviso
Academic Medical CentersBeth Israel Medical Center
Brigham and Women’s Hospital
Duke University Medical Center
Hospital of the University of Pennsylvania
Indiana University Medical Center
Johns Hopkins Health System
Loma Linda University Medical Center
Loyola University Health System
Montefi ore Medical Center
The Mount Sinai Medical Center
MUSC Medical Center
New York Presbyterian Hospital
New York University Medical Center
North Carolina Baptist Hospitals
Northwestern Memorial Hospital
The Ohio State University Medical Center
Stanford Hospitals and Clinics
UCLA Medical Center
UCSD Healthcare
University of Alabama Hospital
University of Chicago Hospitals
University of Michigan Medical Center
University of Wisconsin Hospital
Yale-New Haven Hospital
Teaching HospitalsBayview Medical Center
Detroit Medical Center
Detroit Receiving Hospital
Grace Hospital
Grady Memorial Hospital
Harborview Medical Center
Harper Hospital
Harris County Hospital District
Hurley Medical Center
Lenox Hill Hospital
Long Beach Memorial Medical Center
MacNeal Hospital
Overlook Hospital
Parkland Memorial Hospital
Pitt County Memorial Hospital
Queen’s Medical Center
St. Luke’s Episcopal Hospital
St. Luke’s-Roosevelt Hospital Center
Saint Mary’s Hospital
Saint Vincent’s Hospital and Medical Center
Scott and White Memorial Hospital
Sinai Hospital of Baltimore
William Beaumont Hospital
Major Health SystemsAdventist Health SystemAscension HealthAtlantic Health SystemAurora Health CareBaptist Health SystemBaylor Health SystemBJC Health SystemBon Secours Health SystemCarilion Health SystemCatholic Healthcare PartnersCatholic Healthcare WestCatholic Health InitiativesCedars-Sinai Health SystemClarian Health PartnersCleveland Clinic Health SystemCommunity Health SystemsFairview Hospital and Health SystemHCAHealth EastHenry Ford Health SystemInova Health SystemLegacy Health SystemNorth Shore-Long Island Jewish Health SystemOSF Healthcare SystemProvidence Health SystemRobert Wood Johnson Health System
Scripps HealthSharp HealthCareSutter HealthTenet Health SystemTexas Health ResourcesTrinity HealthVeterans Integrated Health NetworksWheaton Franciscan Services
Clinics and Specialty HospitalsBarbara Ann Karmanos Cancer InstituteChildren’s Healthcare of AtlantaChildren’s Hospital—BostonChildren’s Hospital Medical Center of AkronChildren’s Hospital of Los AngelesChildren’s National Medical CenterCleveland Clinic FoundationDana-Farber Cancer InstituteH. Lee Moffi tt Cancer CenterHospital for Joint Diseases InstituteHospital for Special SurgeryKaiser Foundation HospitalMayo FoundationMemorial Sloan-Kettering Cancer CenterNational Rehabilitation HospitalNew York Eye and Ear Infi rmary
OchsnRosweUnive
CaWoma
ComBronxCape Cape CharlDanbuDCH EasterHeartHoag InghaLenoxLutheMaimMaineMedicMissisMounNorthNorwOchsn
dvisory Board Members
Ochsner Medical InstitutionRoswell Park Cancer InstituteUniversity of Texas M.D. Anderson
Cancer CenterWoman’s Hospital Foundation
Community HospitalsBronx-Lebanon Hospital CenterCape Cod HospitalCape Fear Valley Medical CenterCharleston Area Medical CenterDanbury HospitalDCH Regional Medical CenterEastern Maine Medical CenterHeartland Regional Medical CenterHoag Memorial HospitalIngham Regional Medical CenterLenox Hill HospitalLutheran Medical Center PresbyterianMaimonides Medical CenterMaine Medical CenterMedical Center of Central GeorgiaMississippi Baptist Medical CenterMount Clemens General HospitalNorthside HospitalNorwalk HospitalOchsner Foundation Hospital
Our Lady of Lourdes Medical CenterOur Lady of the Lake Regional Medical CenterReading Hospital and Medical CenterResurrection Medical CenterSaint Francis HospitalSt. Luke’s Regional Medical Center Tucson Medical CenterValley Baptist Medical CenterWashoe Medical Center
Insurers and Managed CareAetnaAnthem, Inc.Blue Cross and Blue Shield of FloridaBlue Cross and Blue Shield of LouisianaBlue Cross and Blue Shield of MontanaBlue Cross Blue Shield of North DakotaBlue Cross Blue Shield of TennesseeCapital Blue CrossExcellus Blue Cross Blue ShieldFirst HealthGroup Health, Inc.Harvard Pilgrim Health CareHIPHorizon Blue Cross Blue Shield of New JerseyTriple-S ManagementWellPoint Health Networks, Inc.
Pharmaceutical and BiotechnologyAbbott Laboratories
Amgen, Inc.
Aventis Pharmaceuticals
Bayer Pharmaceutical
Biosite Diagnostics, Inc.
Bristol-Myers Squibb
Centocor, Inc.
Eli Lilly and Company
Genentech
IDEC Pharmaceuticals Corporation
Johnson & Johnson Health Care Systems
Merck & Company
Novartis Pharmaceuticals Corporation
Ortho Biotech
Perclose
Pfi zer, Inc.
Pharmacia Corporation
Philips Medical Systems North America Inc.
Roche Laboratories
Schering-Plough
Scios Inc.
TAP Pharmaceutical Products
Health Care CorporationsALARIS Medical, Inc.Allegiance Healthcare CorporationAmerican Healthways, Inc.California HealthCare FoundationCardinal Health, Inc.Eclipsys CorporationElekta Oncology Systems, Inc.Espirito Santo SaudeGE Medical SystemsGuidant CorporationHammes CompanyHill-RomIDX Systems CorporationInteliStaf HealthcareJose de Mello SaudeKaiser PermanenteMadison Dearborn PartnersMcKessonMedAmerica, Inc.MedCath, Inc.Medtronic, Inc.Possis Medical, Inc.Spectrum Healthcare Resources3M Health Information SystemsVarian Medical Systems
1
To Our Shareholders:
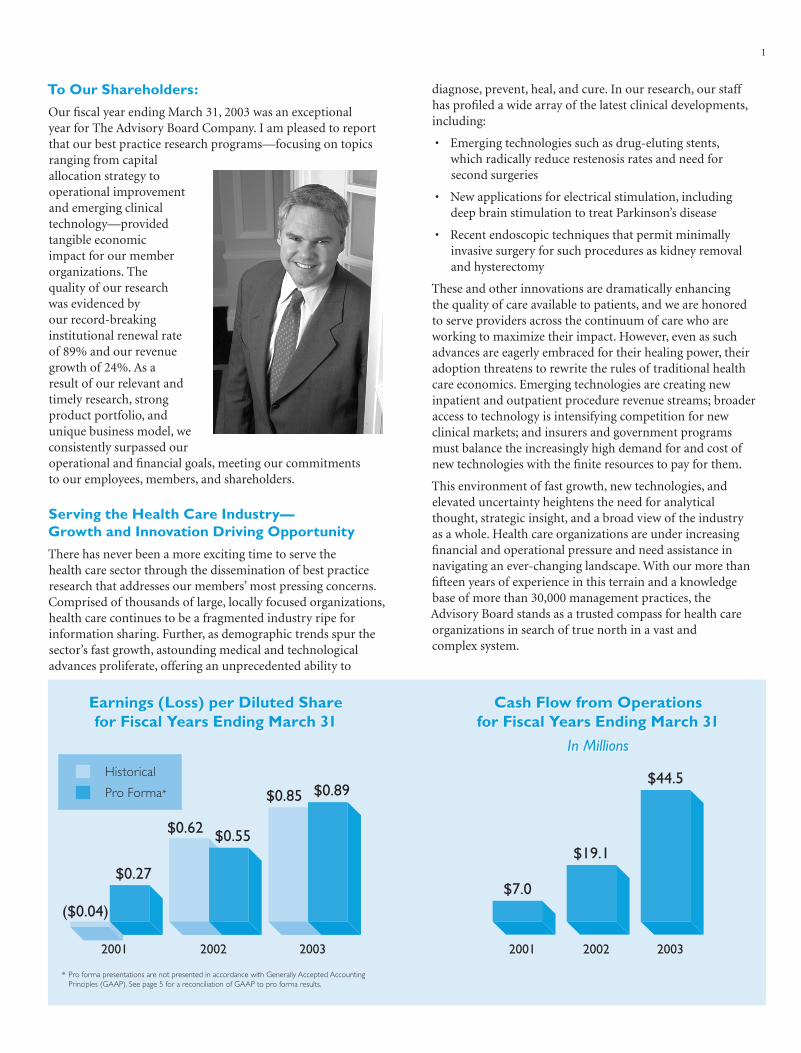
Our fi scal year ending March 31, 2003 was an exceptional year for The Advisory Board Company. I am pleased to report that our best practice research programs—focusing on topics ranging from capital allocation strategy to operational improvement and emerging clinical technology—provided tangible economic impact for our member organizations. The quality of our research was evidenced by our record-breaking institutional renewal rate of 89% and our revenue growth of 24%. As a result of our relevant and timely research, strong product portfolio, and unique business model, we consistently surpassed our operational and fi nancial goals, meeting our commitmentsto our employees, members, and shareholders.
Serving the Health Care Industry—Growth and Innovation Driving Opportunity
There has never been a more exciting time to serve the health care sector through the dissemination of best practice research that addresses our members’ most pressing concerns. Comprised of thousands of large, locally focused organizations, health care continues to be a fragmented industry ripe for information sharing. Further, as demographic trends spur the sector’s fast growth, astounding medical and technological advances proliferate, offering an unprecedented ability to
diagnose, prevent, heal, and cure. In our research, our staff has profi led a wide array of the latest clinical developments, including:
• Emerging technologies such as drug-eluting stents, which radically reduce restenosis rates and need for second surgeries
• New applications for electrical stimulation, including deep brain stimulation to treat Parkinson’s disease
• Recent endoscopic techniques that permit minimally invasive surgery for such procedures as kidney removal and hysterectomy
These and other innovations are dramatically enhancing the quality of care available to patients, and we are honored to serve providers across the continuum of care who are working to maximize their impact. However, even as such advances are eagerly embraced for their healing power, their adoption threatens to rewrite the rules of traditional health care economics. Emerging technologies are creating new inpatient and outpatient procedure revenue streams; broader access to technology is intensifying competition for new clinical markets; and insurers and government programs must balance the increasingly high demand for and cost of new technologies with the fi nite resources to pay for them.
This environment of fast growth, new technologies, and elevated uncertainty heightens the need for analytical thought, strategic insight, and a broad view of the industry as a whole. Health care organizations are under increasing fi nancial and operational pressure and need assistance in navigating an ever-changing landscape. With our more than fi fteen years of experience in this terrain and a knowledge base of more than 30,000 management practices, the Advisory Board stands as a trusted compass for health care organizations in search of true north in a vast and complex system.
2001 2002 2003
($0.04)
$0.27
$0.62 $0.55
$0.85 $0.89
2001 2002 2003
$7.0
$19.1
$44.5
* Pro forma presentations are not presented in accordance with Generally Accepted Accounting Principles (GAAP). See page 5 for a reconciliation of GAAP to pro forma results.
Historical
Pro Forma*
Earnings (Loss) per Diluted Sharefor Fiscal Years Ending March 31
Earnings (Loss) per Diluted Sharefor Fiscal Years Ending March 31
Cash Flow from Operationsfor Fiscal Years Ending March 31
In Millions
Cash Flow from Operationsfor Fiscal Years Ending March 31
In Millions
2
Fiscal Year 2003: Strong Growth and Financial Results
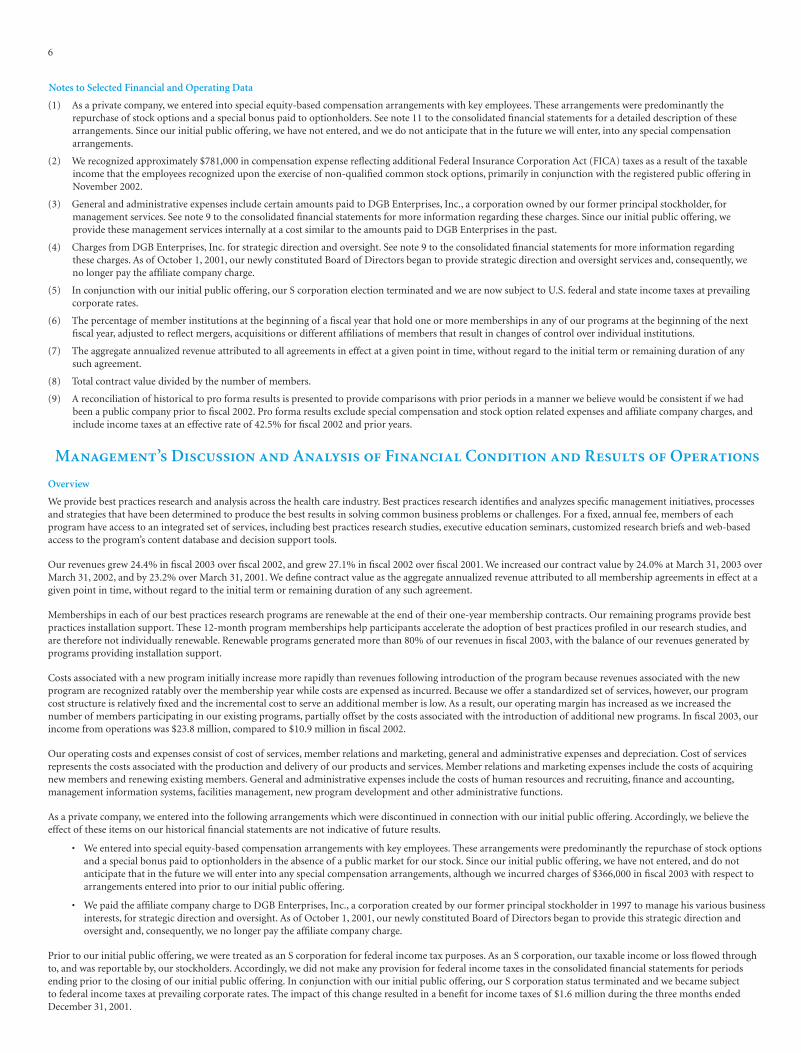
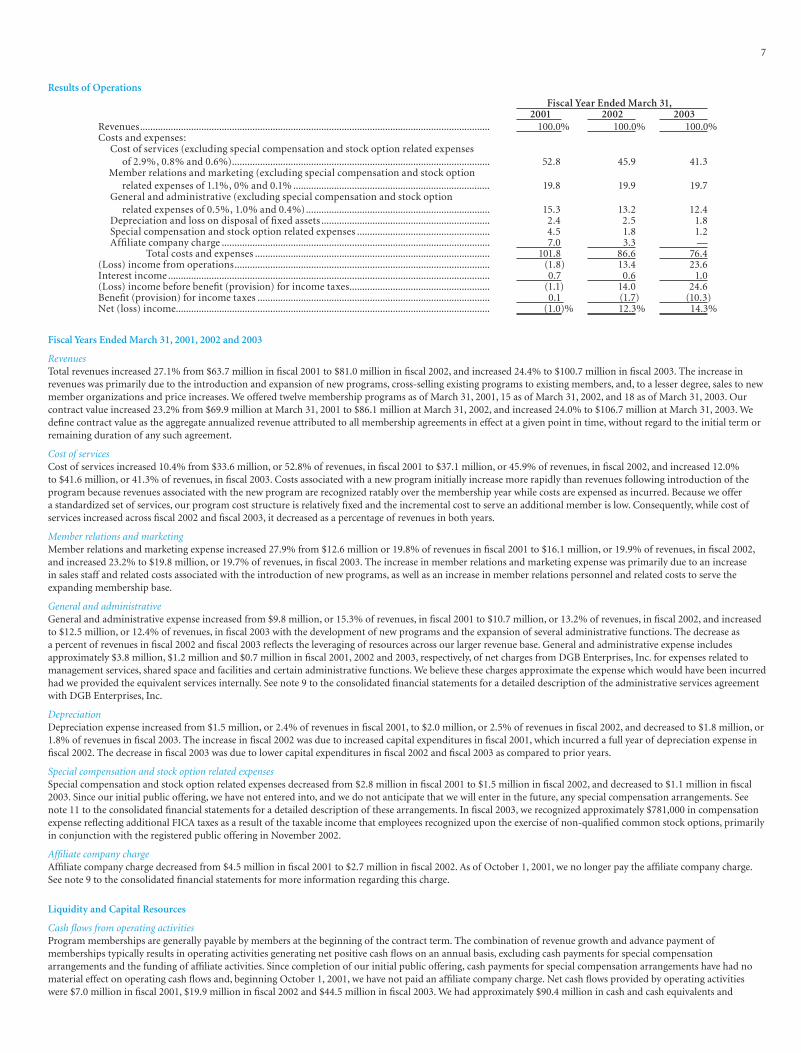
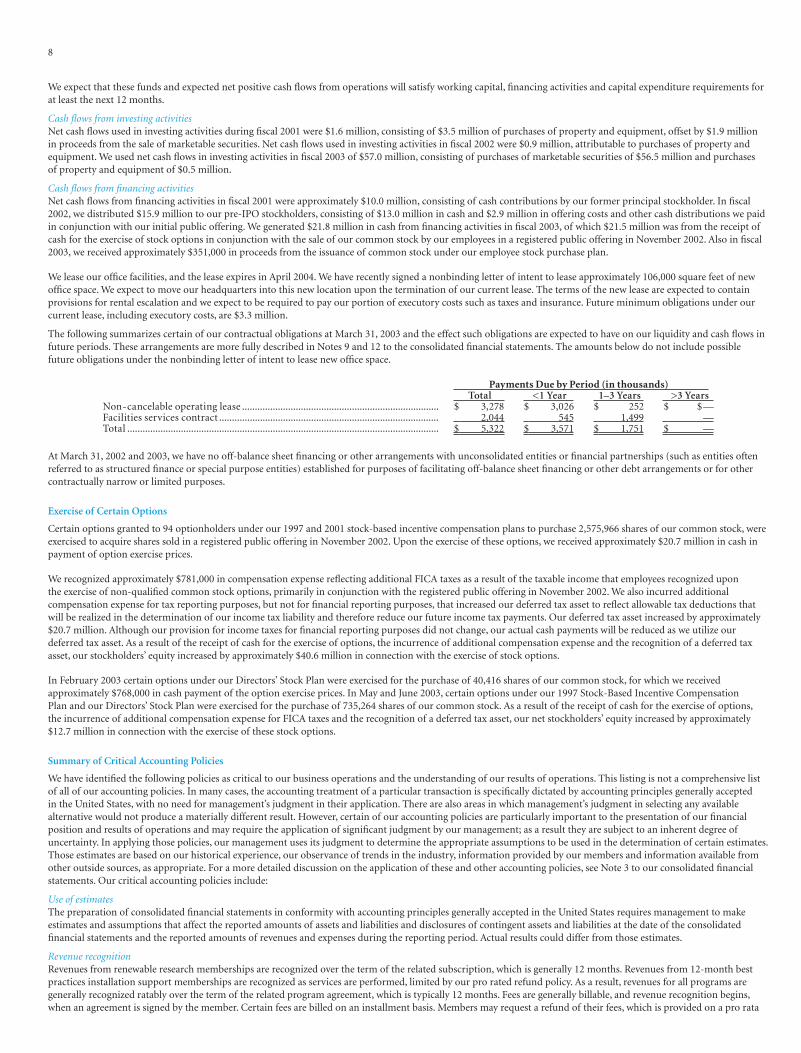
Across fi scal year 2003 we continued to focus on delivering consistent, organic growth. Accordingly, revenues grew 24%, from $81 million in fi scal 2002 to $100.7 million in fi scal 2003. Net income was up from $10 million in fi scal 2002 to $14.4 million in fi scal 2003, with earnings per share at $0.85 per diluted share versus $0.62 in the prior year. In addition, pro forma net income was up from $8.9 million in fi scal 2002 to $15.1 million in fi scal 2003, with pro forma earnings per share at $0.89 per diluted share versus $0.55 in the prior year. (See page 5 for a reconciliation of GAAP to pro forma results).
As in the past, sources of growth in fi scal year 2003 included new program launches, cross-selling programs to existing members, the addition of new member institutions, and price increases. Of particular note is the fact that the success of this year’s new program launches exceeded expectations, contributing to our stronger-than-anticipated revenue growth. As with all new program launches, the Margin Enhancement, Executive Leadership, and Service Line Management Programs were developed with the input of industry thought leaders who served as charter advisors, guiding the programs’ research agendas and service offerings. We are pleased to report that the fi scal 2003 program launches attracted such premier organizations as Duke University Health System, New
York-Presbyterian Hospital, Inova Health System, Scripps Health, and UCLA Medical Center.
Our strategy entails launching three to four new programs per year and leveraging our current cross-sell opportunity. In addition, our increased focus on health care operations and expansion into additional sectors such as medical devices, pharmaceuticals, and international markets will continue to grow our addressable market. Finally, our membership model, with its inherent network advantage, scalability, and high barriers to entry, serves as a strong foundation for our business moving forward. Looking ahead, the health care industry continues to be under signifi cant pressure as a result of a variety of adverse economic factors. While this may have an impact on our near-term growth outlook, our focus across the coming year will remain on aligning our resarch agendas and new program launches with the most important strategic, operational and fi nancial issues for our member executives.
The Force of Membership: Uniquely Positioned to Provide Cutting-Edge Research
Ultimately our success as a research organization is based on our ability to identify proven best practices across a wide range of complex topic areas. With a membership of nearly 2,300 health care organizations, the Advisory Board is uniquely positioned to provide cutting-edge research to the industry. We count among our members not only the top 17 hospitals as ranked by U.S. News and World Report (including The Cleveland Clinic, The Mayo Clinic, Johns Hopkins Hospital, Massachusetts General Hospital, University of Michigan Medical Center, and Stanford University Hospital) but also leading pharmaceutical and biotech companies, health care insurers, and medical device companies such as Aetna, Genentech, Johnson & Johnson, Medtronic, Merck, and Wyeth Pharmaceuticals.
The advantage of this network is twofold. First, through fax polls, roundtables, and other feedback mechanisms, our members drive our research agenda, ensuring that we focus on the most urgent issues facing health care organizations today. Second, because these members rely upon and are actively involved in our research, they offer us unparalleled access to the best practices in health care strategy and operations across the country. Our resulting productivity is high: in fi scal year 2003 we published 47 new studies on mission-critical issues for our members and researched more than 1,200 strategic and
”“The Advisory Board stands as
a trusted compass for health care organizations in search of true north
in a vast and complex system.
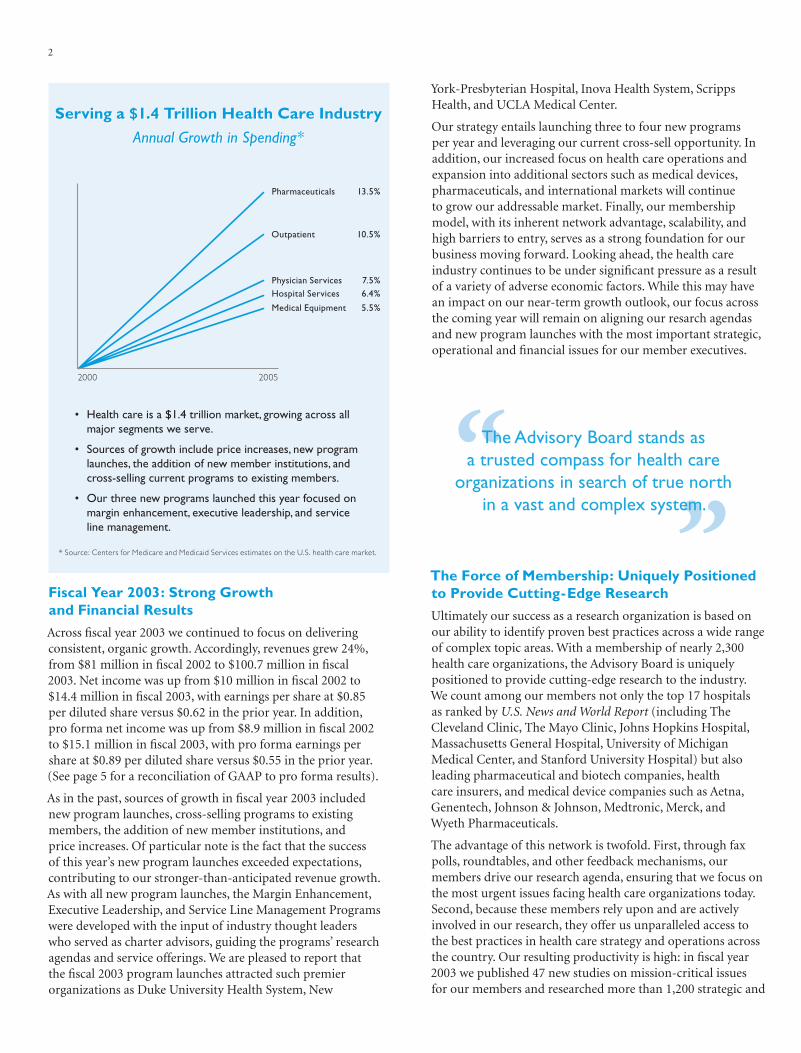
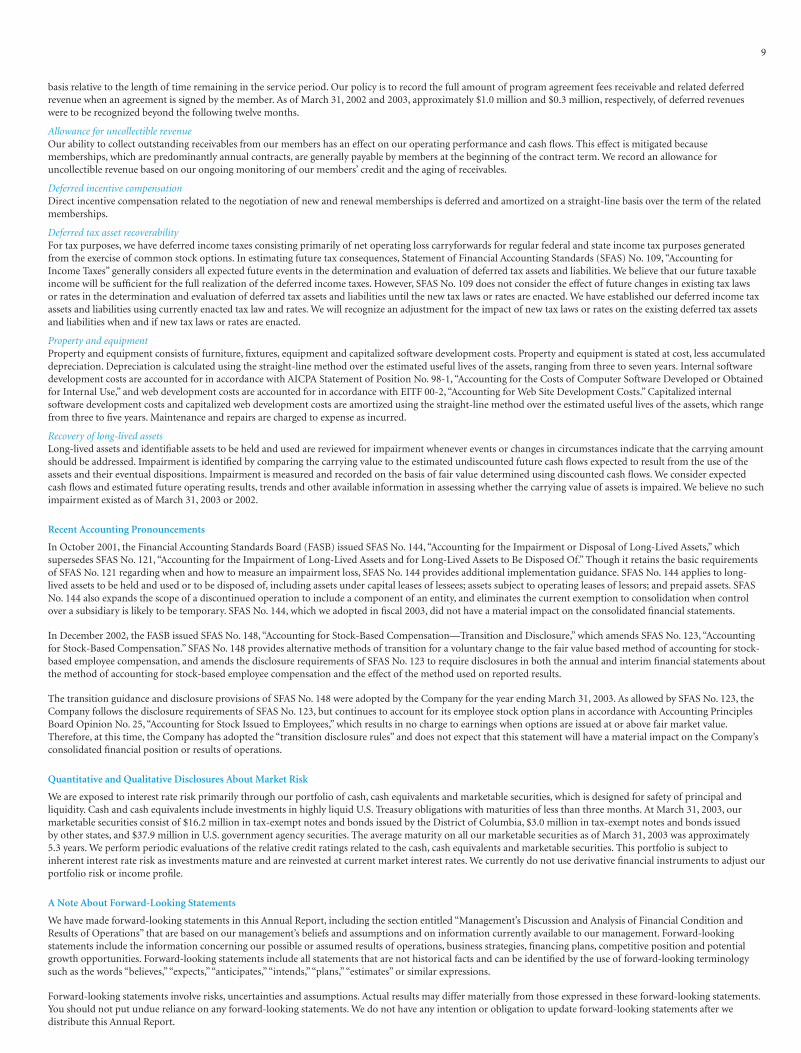
• Health care is a $1.4 trillion market, growing across all major segments we serve.
• Sources of growth include price increases, new program launches, the addition of new member institutions, and cross-selling current programs to existing members.
• Our three new programs launched this year focused on margin enhancement, executive leadership, and service line management.
Pharmaceuticals
Physician ServicesHospital Services
Outpatient
* Source: Centers for Medicare and Medicaid Services estimates on the U.S. health care market.
2000 2005
Medical Equipment
13.5%
7.5%6.4%
10.5%
5.5%
Serving a $1.4 Trillion Health Care Industry
Annual Growth in Spending*
Serving a $1.4 Trillion Health Care Industry
Annual Growth in Spending*
3
efforts in this terrain have not only provided a strategic framework for considering the new economics of care but have also profi led a myriad of concrete best practices for hardwiring cost discipline and improving revenue and cash collection.
As a result, we have found that our members are seeing signifi cant improvements in revenue cycle and cost metrics. For example, after implementing best practices profi led in our research, one 400-bed hospital member saw a 14% increase in charges captured as well as a 46% decrease in bad debt. Together, these improvements yielded $7 million of increased cash fl ows—not only a signifi cant impact on overall economic performance but also a substantial return on their membership investment. This represents one of the many tangible economic improvements that our members derive as a result of their Advisory Board memberships. We believe these tangible returns drive member satisfaction and have created high renewal rates.
Investing in an Organization to Support Growth
As we build our business for long-term growth, it is critically important that we invest in our underlying organization. Fortunately, here too, we begin from a strong position. First, our standardized approach to the research and our emphasis on quality control provide a scalable intellectual enterprise that consistently delivers a relevant, actionable, and valuable product to our members. In addition, our dedicated staff of over 500 employees represents top talent from the best graduate and undergraduate programs, consulting fi rms, and
operational best practices to build our proprietary library of management practices to more than 30,000.
Beyond sheer volume, we are able to leverage our industry-wide network and ever-gathering intellectual capital to tackle health care’s largest and most vexing questions in our research. This year we have been deeply involved in one such undertaking in our fl agship Health System Strategy Program for CEOs: mapping the health system of the future. This dedicated research effort focuses on the future of the hospital, infl uence of emerging clinical technologies, changing demographics of the population, and anticipated changes in the reimbursement system for health care services. Launched with the publishing of the Health System of the Future study and its attendant meeting series, the broader research effort has paved the way for a variety of new delivery formats such as future care briefi ngs, innovation summits, and service line opportunity assessments. Already, we have rolled out one such new format: the Innovations Center Quarterly. This publication gathers information related to new clinical technologies and future forecasting from across our program portfolio and presents it in an easily accessible format to individuals at all levels of the health care system. This is one of the many investments we have made in innovating our delivery formats to make sure that our research runs deep in our member organizations.
We are grateful to have the industry support and access that allows us to undertake such cutting-edge research with confi dence. Through our relentless focus on providing actionable solutions, we seek to consistently deliver superior value to our members.
“”
Through our relentless focus on providing actionable solutions, we seek to consistently deliver superior value to our members.
Driving Tangible Impact for Our Members
Cutting-edge research is exciting, but for it to be useful to our membership it must also offer concrete, actionable insights to positively impact their businesses. The fact that we provide a comprehensive solution to our members’ biggest problems—including a strategic framework, specifi c improvement opportunities, proven best practices, and ongoing performance measurement tools—is ultimately what yields high returns on their membership investment.
This year’s research on operating margin expansion provides a good example. With increased demand for health care services, our members face new challenges in managing growth. Solid (and improving) operating margin performance is required as institutions seek to fund construction projects, implement new technologies, and augment service line offerings. Our research
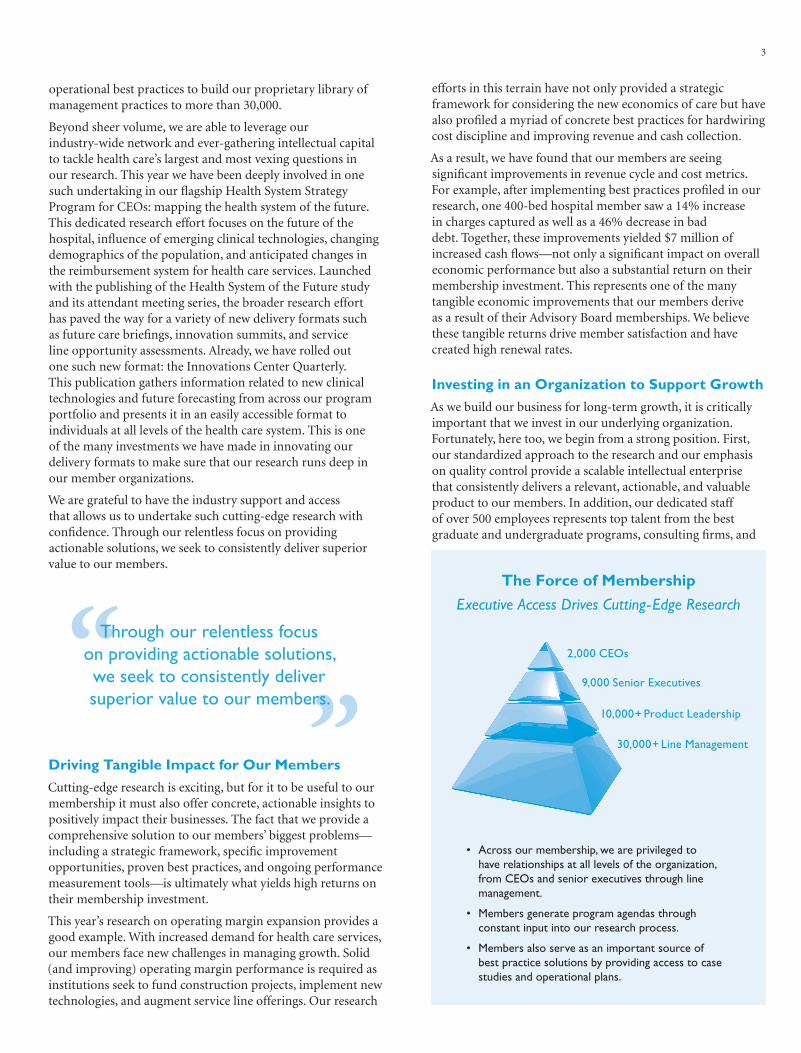
2,000 CEOs
9,000 Senior Executives
10,000+ Product Leadership
30,000+ Line Management
• Across our membership, we are privileged to have relationships at all levels of the organization, from CEOs and senior executives through line management.
• Members generate program agendas through constant input into our research process.
• Members also serve as an important source of best practice solutions by providing access to case studies and operational plans.
The Force of Membership
Executive Access Drives Cutting-Edge Research
The Force of Membership
Executive Access Drives Cutting-Edge Research
4
health care institutions. With career research staff retention rates well above 85%, this leadership team is committed to producing excellent research and serving our members to the highest standard.
Moreover, we continue to invest in our organization to ensure that these advantages are preserved and enhanced. Our investment in internal communication tools and ongoing staff development focuses on breakthrough member service and insight-driven research. We have also recently applied our best practice research to our own organization, introducing a comprehensive management development program. As of this writing, 85% of our management-level staff has been through the training, and early feedback suggests that the program will be successful in building our base of executive talent for the future.
Finally, I am very conscious of the fact that we must keep constant vigil to ensure that our culture remains intact and that our core values continue to be at the forefront of everything we do. To that end, we have instituted a number of internal initiatives aimed at communicating and reinforcing our focus on quality and member service. I am fully committed to the values upon which the Advisory Board was built: a culture of meritocracy, a dedication to the force of ideas, the delivery of superior value to our members, and a
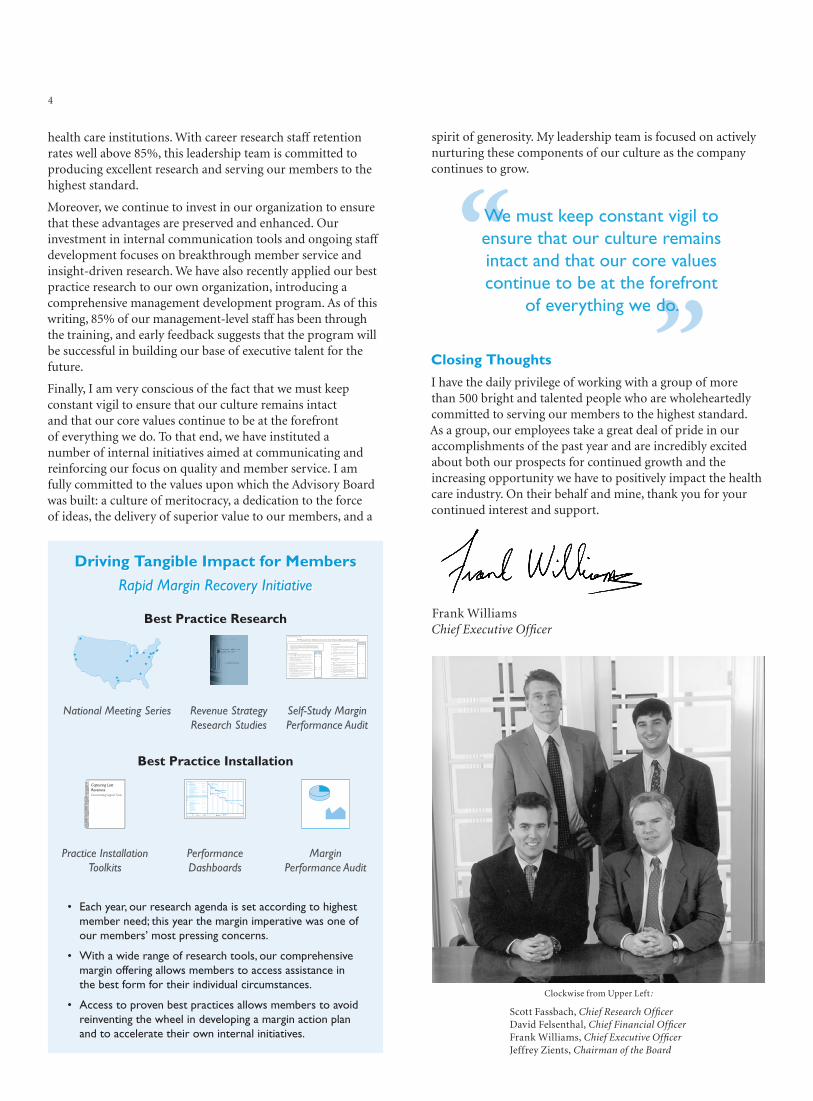
Frank WilliamsChief Executive Offi cer
spirit of generosity. My leadership team is focused on actively nurturing these components of our culture as the company continues to grow.
“”
We must keep constant vigil to ensure that our culture remains intact and that our core values continue to be at the forefront
of everything we do.
• Each year, our research agenda is set according to highest member need; this year the margin imperative was one of our members’ most pressing concerns.
• With a wide range of research tools, our comprehensive margin offering allows members to access assistance in the best form for their individual circumstances.
• Access to proven best practices allows members to avoid reinventing the wheel in developing a margin action plan and to accelerate their own internal initiatives.
Capturing Lost RevenuesDocumenting Support Tools
Practice Installation Toolkits
Performance Dashboards
Margin Performance Audit
Best Practice Installation
Best Practice Research
Yes No
Questions for the COO
#1 Is our ratio of FTEs to adjusted occupied beds less than 5.5 to 1? _____ _____
#2 Is our ratio of FTEs to 100 adjusted admissions less than 6 to 100? _____ _____
#3 Do aggregate salaries, wages, and benefi ts comprise less than 45 percent of our net revenue? _____ _____
#4 Do we have fewer than fi ve layers of staff between top hospital administrators and frontline staff? _____ _____
#5 Does our count of FTEs include contract labor and consultants? _____ _____
#6 Do expenditures (or write-offs) greater than $5,000 require senior executive approval? _____ _____
#7 Have nominal operating expenses per adjusted admission increased less than four percent per year across the last three years? _____ _____
#8 Have our expenses per adjusted discharge declined in real dollars over the last fi ve years? _____ _____
#9 Do we have automatic procedures for reducing FTEs when volumes decline in a department or service line? _____ _____
#10 Do our hospital-based physician contracts have subsidies and administrative fees that do not exceed market standards? _____ _____
#11 Do managers receive monthly “scorecards” on their department’s performance? _____ _____
70 Diagnostic Questions for the Senior Management Team
Margin Improvement Audit
Questions for the CFO
#12 Do we have fewer than 70 days in net accounts receivable? _____ _____
#13 Is our total number of unprocessed bills worth less than fi ve days of net revenue? _____ _____
#14 Have cash collections reached 99 percent of net revenue in the last 12 months? _____ _____
#15 Are capital expenditures roughly fi ve percent of total expenses? _____ _____
#16 Do we have accurate P&Ls for every discrete service line? _____ _____
#17 Do we have a preestablished approval process for disbursements and write-offs? _____ _____
Questions for the CNO
#18 Is our number of paid nursing hours per patient day between six and eight? ______ _____
#19 Do we use “fl ex scheduling” to maintain appropriate staffi ng ratios? _____ _____
#20 Have we adjusted our replacement factor for core staffi ng in lightof the Family and Medical Leave Act? _____ _____
#21 Do we include observation and outpatient hours in ourmeasurement of nurse productivity? _____ _____
#22 Do we account for nurse time spent on admissions, discharges, and transfers in our measurement of nurse productivity? _____ _____
#23 Do we perform a monthly benchmark analysis of agency and overtime use across nursing units? _____ _____
#24 Do we perform a biannual benchmark analysis of nurse wages in our market? _____ _____
#25 Do we track the ratio of worked to paid nursing hours to staff yield? _____ _____
Using This Tool
The questions below are intended to provide a “quick and dirty” guide to sources of potential ineffi ciency that, if attended to, might contribute to rapid margin improvement. The questions are excerpted from an audit that one turnaround fi rm, Cambio Health Solutions, uses on the fi rst day of its turnaround engagements. “No” responses indicate potential areas of focus.
Yes No
Revenue Strategy Research Studies
National Meeting Series
★
★
★
★★
★★
★
★
★★
★★★
★
Self-Study Margin Performance Audit
Clockwise from Upper Left :
Scott Fassbach, Chief Research Offi cerDavid Felsenthal, Chief Financial Offi cerFrank Williams, Chief Executive Offi cerJeffrey Zients, Chairman of the Board
Driving Tangible Impact for Members
Rapid Margin Recovery Initiative
Driving Tangible Impact for Members
Rapid Margin Recovery Initiative
Closing Thoughts
I have the daily privilege of working with a group of more than 500 bright and talented people who are wholeheartedly committed to serving our members to the highest standard. As a group, our employees take a great deal of pride in our accomplishments of the past year and are incredibly excited about both our prospects for continued growth and the increasing opportunity we have to positively impact the health care industry. On their behalf and mine, thank you for your continued interest and support.
5
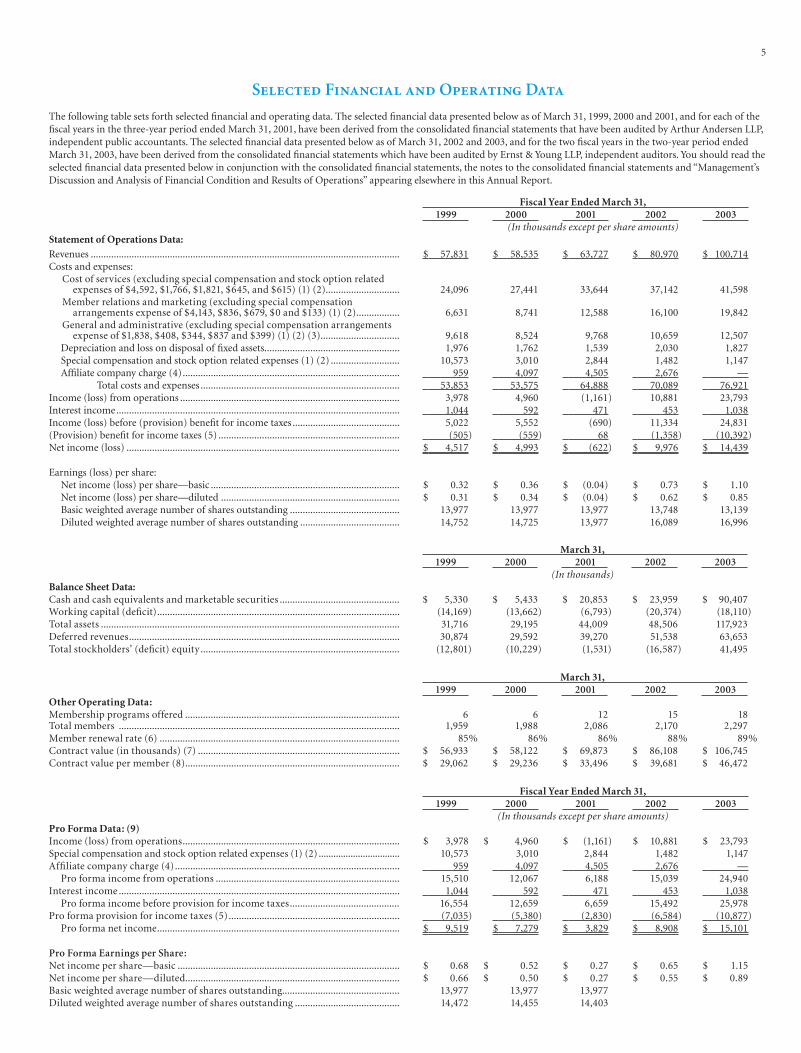
Selected Financial and Operating Data
The following table sets forth selected fi nancial and operating data. The selected fi nancial data presented below as of March 31, 1999, 2000 and 2001, and for each of the fi scal years in the three-year period ended March 31, 2001, have been derived from the consolidated fi nancial statements that have been audited by Arthur Andersen LLP, independent public accountants. The selected fi nancial data presented below as of March 31, 2002 and 2003, and for the two fi scal years in the two-year period ended March 31, 2003, have been derived from the consolidated fi nancial statements which have been audited by Ernst & Young LLP, independent auditors. You should read the selected fi nancial data presented below in conjunction with the consolidated fi nancial statements, the notes to the consolidated fi nancial statements and “Management’s Discussion and Analysis of Financial Condition and Results of Operations” appearing elsewhere in this Annual Report.
Fiscal Year Ended March 31,1999 2000 2001 2002 2003
(In thousands except per share amounts)Statement of Operations Data:
Revenues ......................................................................................................................... $ 57,831 $ 58,535 $ 63,727 $ 80,970 $ 100,714Costs and expenses:
Cost of services (excluding special compensation and stock option related expenses of $4,592, $1,766, $1,821, $645, and $615) (1) (2)............................. 24,096 27,441 33,644 37,142 41,598
Member relations and marketing (excluding special compensation arrangements expense of $4,143, $836, $679, $0 and $133) (1) (2)................. 6,631 8,741 12,588 16,100 19,842
General and administrative (excluding special compensation arrangements expense of $1,838, $408, $344, $837 and $399) (1) (2) (3)............................... 9,618 8,524 9,768 10,659 12,507
Depreciation and loss on disposal of fi xed assets..................................................... 1,976 1,762 1,539 2,030 1,827Special compensation and stock option related expenses (1) (2) ........................... 10,573 3,010 2,844 1,482 1,147Affi liate company charge (4)..................................................................................... 959 4,097 4,505 2,676 —
Total costs and expenses .............................................................................. 53,853 53,575 64,888 70,089 76,921Income (loss) from operations ...................................................................................... 3,978 4,960 (1,161) 10,881 23,793Interest income............................................................................................................... 1,044 592 471 453 1,038Income (loss) before (provision) benefi t for income taxes .......................................... 5,022 5,552 (690) 11,334 24,831(Provision) benefi t for income taxes (5) ....................................................................... (505) (559) 68 (1,358) (10,392)Net income (loss) ........................................................................................................... $ 4,517 $ 4,993 $ (622) $ 9,976 $ 14,439
Earnings (loss) per share:Net income (loss) per share—basic .......................................................................... $ 0.32 $ 0.36 $ (0.04) $ 0.73 $ 1.10Net income (loss) per share—diluted ...................................................................... $ 0.31 $ 0.34 $ (0.04) $ 0.62 $ 0.85Basic weighted average number of shares outstanding ........................................... 13,977 13,977 13,977 13,748 13,139Diluted weighted average number of shares outstanding ....................................... 14,752 14,725 13,977 16,089 16,996
March 31,1999 2000 2001 2002 2003
(In thousands)Balance Sheet Data:Cash and cash equivalents and marketable securities ............................................... $ 5,330 $ 5,433 $ 20,853 $ 23,959 $ 90,407Working capital (defi cit)............................................................................................... (14,169) (13,662) (6,793) (20,374) (18,110)Total assets ..................................................................................................................... 31,716 29,195 44,009 48,506 117,923Deferred revenues.......................................................................................................... 30,874 29,592 39,270 51,538 63,653Total stockholders’ (defi cit) equity.............................................................................. (12,801) (10,229) (1,531) (16,587) 41,495
March 31,1999 2000 2001 2002 2003
Other Operating Data:Membership programs offered .................................................................................... 6 6 12 15 18Total members .............................................................................................................. 1,959 1,988 2,086 2,170 2,297Member renewal rate (6) .............................................................................................. 85% 86% 86% 88% 89%Contract value (in thousands) (7) ............................................................................... $ 56,933 $ 58,122 $ 69,873 $ 86,108 $ 106,745Contract value per member (8).................................................................................... $ 29,062 $ 29,236 $ 33,496 $ 39,681 $ 46,472
Fiscal Year Ended March 31,1999 2000 2001 2002 2003
(In thousands except per share amounts)Pro Forma Data: (9)Income (loss) from operations..................................................................................... $ 3,978 $ 4,960 $ (1,161) $ 10,881 $ 23,793Special compensation and stock option related expenses (1) (2) ................................. 10,573 3,010 2,844 1,482 1,147Affi liate company charge (4)........................................................................................ 959 4,097 4,505 2,676 —
Pro forma income from operations ........................................................................ 15,510 12,067 6,188 15,039 24,940Interest income .............................................................................................................. 1,044 592 471 453 1,038
Pro forma income before provision for income taxes........................................... 16,554 12,659 6,659 15,492 25,978Pro forma provision for income taxes (5)................................................................... (7,035) (5,380) (2,830) (6,584) (10,877)
Pro forma net income............................................................................................... $ 9,519 $ 7,279 $ 3,829 $ 8,908 $ 15,101
Pro Forma Earnings per Share:Net income per share—basic ....................................................................................... $ 0.68 $ 0.52 $ 0.27 $ 0.65 $ 1.15Net income per share—diluted.................................................................................... $ 0.66 $ 0.50 $ 0.27 $ 0.55 $ 0.89Basic weighted average number of shares outstanding.............................................. 13,977 13,977 13,977Diluted weighted average number of shares outstanding ......................................... 14,472 14,455 14,403
6
Notes to Selected Financial and Operating Data
(1) As a private company, we entered into special equity-based compensation arrangements with key employees. These arrangements were predominantly the repurchase of stock options and a special bonus paid to optionholders. See note 11 to the consolidated fi nancial statements for a detailed description of these arrangements. Since our initial public offering, we have not entered, and we do not anticipate that in the future we will enter, into any special compensation arrangements.
(2) We recognized approximately $781,000 in compensation expense refl ecting additional Federal Insurance Corporation Act (FICA) taxes as a result of the taxable income that the employees recognized upon the exercise of non-qualifi ed common stock options, primarily in conjunction with the registered public offering in November 2002.
(3) General and administrative expenses include certain amounts paid to DGB Enterprises, Inc., a corporation owned by our former principal stockholder, for management services. See note 9 to the consolidated fi nancial statements for more information regarding these charges. Since our initial public offering, we provide these management services internally at a cost similar to the amounts paid to DGB Enterprises in the past.
(4) Charges from DGB Enterprises, Inc. for strategic direction and oversight. See note 9 to the consolidated fi nancial statements for more information regarding these charges. As of October 1, 2001, our newly constituted Board of Directors began to provide strategic direction and oversight services and, consequently, we no longer pay the affi liate company charge.
(5) In conjunction with our initial public offering, our S corporation election terminated and we are now subject to U.S. federal and state income taxes at prevailing corporate rates.
(6) The percentage of member institutions at the beginning of a fi scal year that hold one or more memberships in any of our programs at the beginning of the next fi scal year, adjusted to refl ect mergers, acquisitions or different affi liations of members that result in changes of control over individual institutions.
(7) The aggregate annualized revenue attributed to all agreements in effect at a given point in time, without regard to the initial term or remaining duration of any such agreement.
(8) Total contract value divided by the number of members.
(9) A reconciliation of historical to pro forma results is presented to provide comparisons with prior periods in a manner we believe would be consistent if we had been a public company prior to fi scal 2002. Pro forma results exclude special compensation and stock option related expenses and affi liate company charges, and include income taxes at an effective rate of 42.5% for fi scal 2002 and prior years.
Management’s Discussion and Analysis of Financial Condition and Results of Operations
Overview
We provide best practices research and analysis across the health care industry. Best practices research identifi es and analyzes specifi c management initiatives, processes and strategies that have been determined to produce the best results in solving common business problems or challenges. For a fi xed, annual fee, members of each program have access to an integrated set of services, including best practices research studies, executive education seminars, customized research briefs and web-based access to the program’s content database and decision support tools.
Our revenues grew 24.4% in fi scal 2003 over fi scal 2002, and grew 27.1% in fi scal 2002 over fi scal 2001. We increased our contract value by 24.0% at March 31, 2003 over March 31, 2002, and by 23.2% over March 31, 2001. We defi ne contract value as the aggregate annualized revenue attributed to all membership agreements in effect at a given point in time, without regard to the initial term or remaining duration of any such agreement.
Memberships in each of our best practices research programs are renewable at the end of their one-year membership contracts. Our remaining programs provide best practices installation support. These 12-month program memberships help participants accelerate the adoption of best practices profi led in our research studies, and are therefore not individually renewable. Renewable programs generated more than 80% of our revenues in fi scal 2003, with the balance of our revenues generated by programs providing installation support.
Costs associated with a new program initially increase more rapidly than revenues following introduction of the program because revenues associated with the new program are recognized ratably over the membership year while costs are expensed as incurred. Because we offer a standardized set of services, however, our program cost structure is relatively fi xed and the incremental cost to serve an additional member is low. As a result, our operating margin has increased as we increased the number of members participating in our existing programs, partially offset by the costs associated with the introduction of additional new programs. In fi scal 2003, our income from operations was $23.8 million, compared to $10.9 million in fi scal 2002.
Our operating costs and expenses consist of cost of services, member relations and marketing, general and administrative expenses and depreciation. Cost of services represents the costs associated with the production and delivery of our products and services. Member relations and marketing expenses include the costs of acquiring new members and renewing existing members. General and administrative expenses include the costs of human resources and recruiting, fi nance and accounting, management information systems, facilities management, new program development and other administrative functions.
As a private company, we entered into the following arrangements which were discontinued in connection with our initial public offering. Accordingly, we believe the effect of these items on our historical fi nancial statements are not indicative of future results.
• We entered into special equity-based compensation arrangements with key employees. These arrangements were predominantly the repurchase of stock options and a special bonus paid to optionholders in the absence of a public market for our stock. Since our initial public offering, we have not entered, and do not anticipate that in the future we will enter into any special compensation arrangements, although we incurred charges of $366,000 in fi scal 2003 with respect to arrangements entered into prior to our initial public offering.
• We paid the affi liate company charge to DGB Enterprises, Inc., a corporation created by our former principal stockholder in 1997 to manage his various business interests, for strategic direction and oversight. As of October 1, 2001, our newly constituted Board of Directors began to provide this strategic direction and oversight and, consequently, we no longer pay the affi liate company charge.
Prior to our initial public offering, we were treated as an S corporation for federal income tax purposes. As an S corporation, our taxable income or loss fl owed through to, and was reportable by, our stockholders. Accordingly, we did not make any provision for federal income taxes in the consolidated fi nancial statements for periods ending prior to the closing of our initial public offering. In conjunction with our initial public offering, our S corporation status terminated and we became subject to federal income taxes at prevailing corporate rates. The impact of this change resulted in a benefi t for income taxes of $1.6 million during the three months ended December 31, 2001.
7
Fiscal Year Ended March 31,2001 2002 2003
Revenues......................................................................................................................................... 100.0% 100.0% 100.0%Costs and expenses:
Cost of services (excluding special compensation and stock option related expenses of 2.9%, 0.8% and 0.6%)..................................................................................................... 52.8 45.9 41.3
Member relations and marketing (excluding special compensation and stock option related expenses of 1.1%, 0% and 0.1% ............................................................................. 19.8 19.9 19.7
General and administrative (excluding special compensation and stock option related expenses of 0.5%, 1.0% and 0.4%)........................................................................ 15.3 13.2 12.4
Depreciation and loss on disposal of fi xed assets .................................................................. 2.4 2.5 1.8Special compensation and stock option related expenses .................................................... 4.5 1.8 1.2Affi liate company charge ......................................................................................................... 7.0 3.3 —
Total costs and expenses ............................................................................................ 101.8 86.6 76.4(Loss) income from operations.................................................................................................... (1.8) 13.4 23.6Interest income .............................................................................................................................. 0.7 0.6 1.0(Loss) income before benefi t (provision) for income taxes....................................................... (1.1) 14.0 24.6Benefi t (provision) for income taxes ........................................................................................... 0.1 (1.7) (10.3)Net (loss) income........................................................................................................................... (1.0)% 12.3% 14.3%
Results of Operations
Fiscal Years Ended March 31, 2001, 2002 and 2003
Revenues Total revenues increased 27.1% from $63.7 million in fi scal 2001 to $81.0 million in fi scal 2002, and increased 24.4% to $100.7 million in fi scal 2003. The increase in revenues was primarily due to the introduction and expansion of new programs, cross-selling existing programs to existing members, and, to a lesser degree, sales to new member organizations and price increases. We offered twelve membership programs as of March 31, 2001, 15 as of March 31, 2002, and 18 as of March 31, 2003. Our contract value increased 23.2% from $69.9 million at March 31, 2001 to $86.1 million at March 31, 2002, and increased 24.0% to $106.7 million at March 31, 2003. We defi ne contract value as the aggregate annualized revenue attributed to all membership agreements in effect at a given point in time, without regard to the initial term or remaining duration of any such agreement.
Cost of services Cost of services increased 10.4% from $33.6 million, or 52.8% of revenues, in fi scal 2001 to $37.1 million, or 45.9% of revenues, in fi scal 2002, and increased 12.0% to $41.6 million, or 41.3% of revenues, in fi scal 2003. Costs associated with a new program initially increase more rapidly than revenues following introduction of the program because revenues associated with the new program are recognized ratably over the membership year while costs are expensed as incurred. Because we offer a standardized set of services, our program cost structure is relatively fi xed and the incremental cost to serve an additional member is low. Consequently, while cost of services increased across fi scal 2002 and fi scal 2003, it decreased as a percentage of revenues in both years.
Member relations and marketing Member relations and marketing expense increased 27.9% from $12.6 million or 19.8% of revenues in fi scal 2001 to $16.1 million, or 19.9% of revenues, in fi scal 2002, and increased 23.2% to $19.8 million, or 19.7% of revenues, in fi scal 2003. The increase in member relations and marketing expense was primarily due to an increase in sales staff and related costs associated with the introduction of new programs, as well as an increase in member relations personnel and related costs to serve the expanding membership base.
General and administrativeGeneral and administrative expense increased from $9.8 million, or 15.3% of revenues, in fi scal 2001 to $10.7 million, or 13.2% of revenues, in fi scal 2002, and increased to $12.5 million, or 12.4% of revenues, in fi scal 2003 with the development of new programs and the expansion of several administrative functions. The decrease as a percent of revenues in fi scal 2002 and fi scal 2003 refl ects the leveraging of resources across our larger revenue base. General and administrative expense includes approximately $3.8 million, $1.2 million and $0.7 million in fi scal 2001, 2002 and 2003, respectively, of net charges from DGB Enterprises, Inc. for expenses related to management services, shared space and facilities and certain administrative functions. We believe these charges approximate the expense which would have been incurred had we provided the equivalent services internally. See note 9 to the consolidated fi nancial statements for a detailed description of the administrative services agreement with DGB Enterprises, Inc.
Depreciation Depreciation expense increased from $1.5 million, or 2.4% of revenues in fi scal 2001, to $2.0 million, or 2.5% of revenues in fi scal 2002, and decreased to $1.8 million, or 1.8% of revenues in fi scal 2003. The increase in fi scal 2002 was due to increased capital expenditures in fi scal 2001, which incurred a full year of depreciation expense in fi scal 2002. The decrease in fi scal 2003 was due to lower capital expenditures in fi scal 2002 and fi scal 2003 as compared to prior years.
Special compensation and stock option related expenses Special compensation and stock option related expenses decreased from $2.8 million in fi scal 2001 to $1.5 million in fi scal 2002, and decreased to $1.1 million in fi scal 2003. Since our initial public offering, we have not entered into, and we do not anticipate that we will enter in the future, any special compensation arrangements. See note 11 to the consolidated fi nancial statements for a detailed description of these arrangements. In fi scal 2003, we recognized approximately $781,000 in compensation expense refl ecting additional FICA taxes as a result of the taxable income that employees recognized upon the exercise of non-qualifi ed common stock options, primarily in conjunction with the registered public offering in November 2002.
Affi liate company charge Affi liate company charge decreased from $4.5 million in fi scal 2001 to $2.7 million in fi scal 2002. As of October 1, 2001, we no longer pay the affi liate company charge. See note 9 to the consolidated fi nancial statements for more information regarding this charge.
Liquidity and Capital Resources
Cash fl ows from operating activities Program memberships are generally payable by members at the beginning of the contract term. The combination of revenue growth and advance payment of memberships typically results in operating activities generating net positive cash fl ows on an annual basis, excluding cash payments for special compensation arrangements and the funding of affi liate activities. Since completion of our initial public offering, cash payments for special compensation arrangements have had no material effect on operating cash fl ows and, beginning October 1, 2001, we have not paid an affi liate company charge. Net cash fl ows provided by operating activities were $7.0 million in fi scal 2001, $19.9 million in fi scal 2002 and $44.5 million in fi scal 2003. We had approximately $90.4 million in cash and cash equivalents and
8
We expect that these funds and expected net positive cash fl ows from operations will satisfy working capital, fi nancing activities and capital expenditure requirements for at least the next 12 months.
Cash fl ows from investing activitiesNet cash fl ows used in investing activities during fi scal 2001 were $1.6 million, consisting of $3.5 million of purchases of property and equipment, offset by $1.9 million in proceeds from the sale of marketable securities. Net cash fl ows used in investing activities in fi scal 2002 were $0.9 million, attributable to purchases of property and equipment. We used net cash fl ows in investing activities in fi scal 2003 of $57.0 million, consisting of purchases of marketable securities of $56.5 million and purchases of property and equipment of $0.5 million.
Cash fl ows from fi nancing activities Net cash fl ows from fi nancing activities in fi scal 2001 were approximately $10.0 million, consisting of cash contributions by our former principal stockholder. In fi scal 2002, we distributed $15.9 million to our pre-IPO stockholders, consisting of $13.0 million in cash and $2.9 million in offering costs and other cash distributions we paid in conjunction with our initial public offering. We generated $21.8 million in cash from fi nancing activities in fi scal 2003, of which $21.5 million was from the receipt of cash for the exercise of stock options in conjunction with the sale of our common stock by our employees in a registered public offering in November 2002. Also in fi scal 2003, we received approximately $351,000 in proceeds from the issuance of common stock under our employee stock purchase plan.
We lease our offi ce facilities, and the lease expires in April 2004. We have recently signed a nonbinding letter of intent to lease approximately 106,000 square feet of new offi ce space. We expect to move our headquarters into this new location upon the termination of our current lease. The terms of the new lease are expected to contain provisions for rental escalation and we expect to be required to pay our portion of executory costs such as taxes and insurance. Future minimum obligations under our current lease, including executory costs, are $3.3 million.
The following summarizes certain of our contractual obligations at March 31, 2003 and the effect such obligations are expected to have on our liquidity and cash fl ows in future periods. These arrangements are more fully described in Notes 9 and 12 to the consolidated fi nancial statements. The amounts below do not include possible future obligations under the nonbinding letter of intent to lease new offi ce space.
Payments Due by Period (in thousands)Total <1 Year 1–3 Years >3 Years
Non-cancelable operating lease ............................................................................. $ 3,278 $ 3,026 $ 252 $ $—Facilities services contract ...................................................................................... 2,044 545 1,499 —Total .......................................................................................................................... $ 5,322 $ 3,571 $ 1,751 $ —
At March 31, 2002 and 2003, we have no off-balance sheet fi nancing or other arrangements with unconsolidated entities or fi nancial partnerships (such as entities often referred to as structured fi nance or special purpose entities) established for purposes of facilitating off-balance sheet fi nancing or other debt arrangements or for other contractually narrow or limited purposes.
Exercise of Certain Options
Certain options granted to 94 optionholders under our 1997 and 2001 stock-based incentive compensation plans to purchase 2,575,966 shares of our common stock, were exercised to acquire shares sold in a registered public offering in November 2002. Upon the exercise of these options, we received approximately $20.7 million in cash in payment of option exercise prices.
We recognized approximately $781,000 in compensation expense refl ecting additional FICA taxes as a result of the taxable income that employees recognized upon the exercise of non-qualifi ed common stock options, primarily in conjunction with the registered public offering in November 2002. We also incurred additional compensation expense for tax reporting purposes, but not for fi nancial reporting purposes, that increased our deferred tax asset to refl ect allowable tax deductions that will be realized in the determination of our income tax liability and therefore reduce our future income tax payments. Our deferred tax asset increased by approximately $20.7 million. Although our provision for income taxes for fi nancial reporting purposes did not change, our actual cash payments will be reduced as we utilize our deferred tax asset. As a result of the receipt of cash for the exercise of options, the incurrence of additional compensation expense and the recognition of a deferred tax asset, our stockholders’ equity increased by approximately $40.6 million in connection with the exercise of stock options.
In February 2003 certain options under our Directors’ Stock Plan were exercised for the purchase of 40,416 shares of our common stock, for which we received approximately $768,000 in cash payment of the option exercise prices. In May and June 2003, certain options under our 1997 Stock-Based Incentive Compensation Plan and our Directors’ Stock Plan were exercised for the purchase of 735,264 shares of our common stock. As a result of the receipt of cash for the exercise of options, the incurrence of additional compensation expense for FICA taxes and the recognition of a deferred tax asset, our net stockholders’ equity increased by approximately $12.7 million in connection with the exercise of these stock options.
Summary of Critical Accounting Policies
We have identifi ed the following policies as critical to our business operations and the understanding of our results of operations. This listing is not a comprehensive list of all of our accounting policies. In many cases, the accounting treatment of a particular transaction is specifi cally dictated by accounting principles generally accepted in the United States, with no need for management’s judgment in their application. There are also areas in which management’s judgment in selecting any available alternative would not produce a materially different result. However, certain of our accounting policies are particularly important to the presentation of our fi nancial position and results of operations and may require the application of signifi cant judgment by our management; as a result they are subject to an inherent degree of uncertainty. In applying those policies, our management uses its judgment to determine the appropriate assumptions to be used in the determination of certain estimates. Those estimates are based on our historical experience, our observance of trends in the industry, information provided by our members and information available from other outside sources, as appropriate. For a more detailed discussion on the application of these and other accounting policies, see Note 3 to our consolidated fi nancial statements. Our critical accounting policies include:
Use of estimates The preparation of consolidated fi nancial statements in conformity with accounting principles generally accepted in the United States requires management to make estimates and assumptions that affect the reported amounts of assets and liabilities and disclosures of contingent assets and liabilities at the date of the consolidated fi nancial statements and the reported amounts of revenues and expenses during the reporting period. Actual results could differ from those estimates.
Revenue recognition Revenues from renewable research memberships are recognized over the term of the related subscription, which is generally 12 months. Revenues from 12-month best practices installation support memberships are recognized as services are performed, limited by our pro rated refund policy. As a result, revenues for all programs are generally recognized ratably over the term of the related program agreement, which is typically 12 months. Fees are generally billable, and revenue recognition begins, when an agreement is signed by the member. Certain fees are billed on an installment basis. Members may request a refund of their fees, which is provided on a pro rata
9
basis relative to the length of time remaining in the service period. Our policy is to record the full amount of program agreement fees receivable and related deferred revenue when an agreement is signed by the member. As of March 31, 2002 and 2003, approximately $1.0 million and $0.3 million, respectively, of deferred revenues were to be recognized beyond the following twelve months.
Allowance for uncollectible revenue Our ability to collect outstanding receivables from our members has an effect on our operating performance and cash fl ows. This effect is mitigated because memberships, which are predominantly annual contracts, are generally payable by members at the beginning of the contract term. We record an allowance for uncollectible revenue based on our ongoing monitoring of our members’ credit and the aging of receivables.
Deferred incentive compensation Direct incentive compensation related to the negotiation of new and renewal memberships is deferred and amortized on a straight-line basis over the term of the related memberships.
Deferred tax asset recoverability For tax purposes, we have deferred income taxes consisting primarily of net operating loss carryforwards for regular federal and state income tax purposes generated from the exercise of common stock options. In estimating future tax consequences, Statement of Financial Accounting Standards (SFAS) No. 109, “Accounting for Income Taxes” generally considers all expected future events in the determination and evaluation of deferred tax assets and liabilities. We believe that our future taxable income will be suffi cient for the full realization of the deferred income taxes. However, SFAS No. 109 does not consider the effect of future changes in existing tax laws or rates in the determination and evaluation of deferred tax assets and liabilities until the new tax laws or rates are enacted. We have established our deferred income tax assets and liabilities using currently enacted tax law and rates. We will recognize an adjustment for the impact of new tax laws or rates on the existing deferred tax assets and liabilities when and if new tax laws or rates are enacted.
Property and equipment Property and equipment consists of furniture, fi xtures, equipment and capitalized software development costs. Property and equipment is stated at cost, less accumulated depreciation. Depreciation is calculated using the straight-line method over the estimated useful lives of the assets, ranging from three to seven years. Internal software development costs are accounted for in accordance with AICPA Statement of Position No. 98-1, “Accounting for the Costs of Computer Software Developed or Obtained for Internal Use,” and web development costs are accounted for in accordance with EITF 00-2, “Accounting for Web Site Development Costs.” Capitalized internal software development costs and capitalized web development costs are amortized using the straight-line method over the estimated useful lives of the assets, which range from three to fi ve years. Maintenance and repairs are charged to expense as incurred.
Recovery of long-lived assets Long-lived assets and identifi able assets to be held and used are reviewed for impairment whenever events or changes in circumstances indicate that the carrying amount should be addressed. Impairment is identifi ed by comparing the carrying value to the estimated undiscounted future cash fl ows expected to result from the use of the assets and their eventual dispositions. Impairment is measured and recorded on the basis of fair value determined using discounted cash fl ows. We consider expected cash fl ows and estimated future operating results, trends and other available information in assessing whether the carrying value of assets is impaired. We believe no such impairment existed as of March 31, 2003 or 2002.
Recent Accounting Pronouncements
In October 2001, the Financial Accounting Standards Board (FASB) issued SFAS No. 144, “Accounting for the Impairment or Disposal of Long-Lived Assets,” which supersedes SFAS No. 121, “Accounting for the Impairment of Long-Lived Assets and for Long-Lived Assets to Be Disposed Of.” Though it retains the basic requirements of SFAS No. 121 regarding when and how to measure an impairment loss, SFAS No. 144 provides additional implementation guidance. SFAS No. 144 applies to long-lived assets to be held and used or to be disposed of, including assets under capital leases of lessees; assets subject to operating leases of lessors; and prepaid assets. SFAS No. 144 also expands the scope of a discontinued operation to include a component of an entity, and eliminates the current exemption to consolidation when control over a subsidiary is likely to be temporary. SFAS No. 144, which we adopted in fi scal 2003, did not have a material impact on the consolidated fi nancial statements.
In December 2002, the FASB issued SFAS No. 148, “Accounting for Stock-Based Compensation—Transition and Disclosure,” which amends SFAS No. 123, “Accounting for Stock-Based Compensation.” SFAS No. 148 provides alternative methods of transition for a voluntary change to the fair value based method of accounting for stock-based employee compensation, and amends the disclosure requirements of SFAS No. 123 to require disclosures in both the annual and interim fi nancial statements about the method of accounting for stock-based employee compensation and the effect of the method used on reported results.
The transition guidance and disclosure provisions of SFAS No. 148 were adopted by the Company for the year ending March 31, 2003. As allowed by SFAS No. 123, the Company follows the disclosure requirements of SFAS No. 123, but continues to account for its employee stock option plans in accordance with Accounting Principles Board Opinion No. 25, “Accounting for Stock Issued to Employees,” which results in no charge to earnings when options are issued at or above fair market value. Therefore, at this time, the Company has adopted the “transition disclosure rules” and does not expect that this statement will have a material impact on the Company’s consolidated fi nancial position or results of operations.
Quantitative and Qualitative Disclosures About Market Risk
We are exposed to interest rate risk primarily through our portfolio of cash, cash equivalents and marketable securities, which is designed for safety of principal and liquidity. Cash and cash equivalents include investments in highly liquid U.S. Treasury obligations with maturities of less than three months. At March 31, 2003, our marketable securities consist of $16.2 million in tax-exempt notes and bonds issued by the District of Columbia, $3.0 million in tax-exempt notes and bonds issued by other states, and $37.9 million in U.S. government agency securities. The average maturity on all our marketable securities as of March 31, 2003 was approximately 5.3 years. We perform periodic evaluations of the relative credit ratings related to the cash, cash equivalents and marketable securities. This portfolio is subject to inherent interest rate risk as investments mature and are reinvested at current market interest rates. We currently do not use derivative fi nancial instruments to adjust our portfolio risk or income profi le.
A Note About Forward-Looking Statements
We have made forward-looking statements in this Annual Report, including the section entitled “Management’s Discussion and Analysis of Financial Condition and Results of Operations” that are based on our management’s beliefs and assumptions and on information currently available to our management. Forward-looking statements include the information concerning our possible or assumed results of operations, business strategies, fi nancing plans, competitive position and potential growth opportunities. Forward-looking statements include all statements that are not historical facts and can be identifi ed by the use of forward-looking terminology such as the words “believes,” “expects,” “anticipates,” “intends,” “plans,” “estimates” or similar expressions.
Forward-looking statements involve risks, uncertainties and assumptions. Actual results may differ materially from those expressed in these forward-looking statements. You should not put undue reliance on any forward-looking statements. We do not have any intention or obligation to update forward-looking statements after we distribute this Annual Report.
10
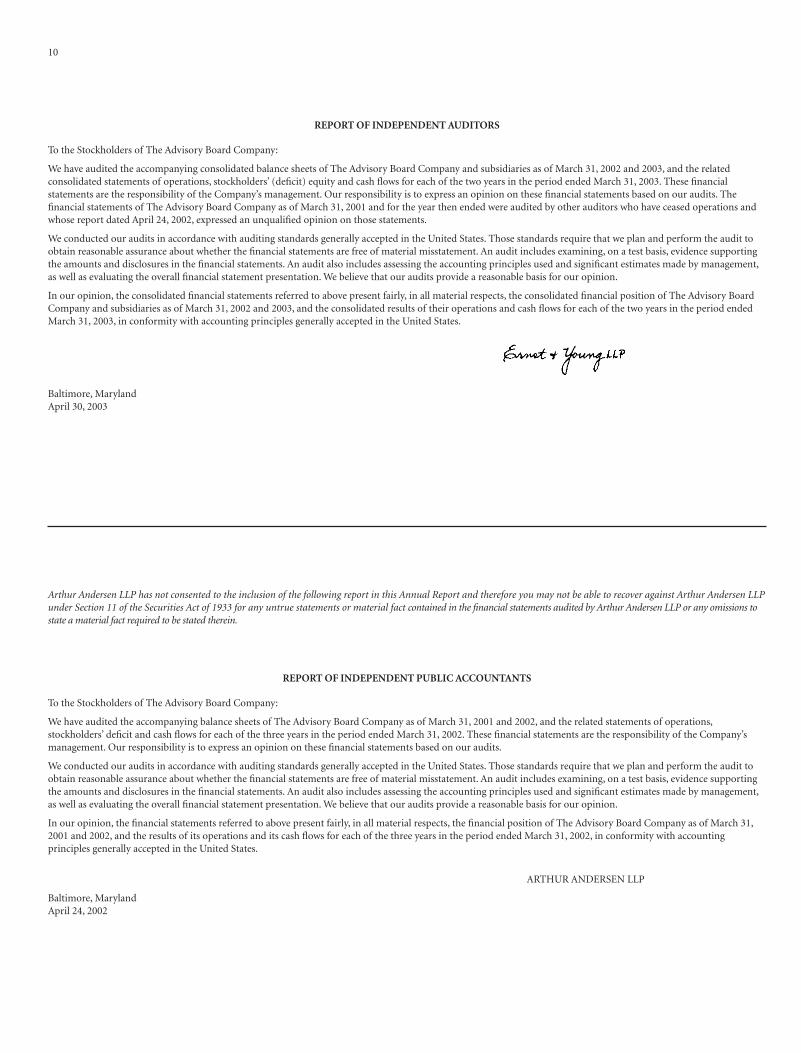
REPORT OF INDEPENDENT AUDITORS
To the Stockholders of The Advisory Board Company:
We have audited the accompanying consolidated balance sheets of The Advisory Board Company and subsidiaries as of March 31, 2002 and 2003, and the related consolidated statements of operations, stockholders’ (defi cit) equity and cash fl ows for each of the two years in the period ended March 31, 2003. These fi nancial statements are the responsibility of the Company’s management. Our responsibility is to express an opinion on these fi nancial statements based on our audits. The fi nancial statements of The Advisory Board Company as of March 31, 2001 and for the year then ended were audited by other auditors who have ceased operations and whose report dated April 24, 2002, expressed an unqualifi ed opinion on those statements.
We conducted our audits in accordance with auditing standards generally accepted in the United States. Those standards require that we plan and perform the audit to obtain reasonable assurance about whether the fi nancial statements are free of material misstatement. An audit includes examining, on a test basis, evidence supporting the amounts and disclosures in the fi nancial statements. An audit also includes assessing the accounting principles used and signifi cant estimates made by management, as well as evaluating the overall fi nancial statement presentation. We believe that our audits provide a reasonable basis for our opinion.
In our opinion, the consolidated fi nancial statements referred to above present fairly, in all material respects, the consolidated fi nancial position of The Advisory Board Company and subsidiaries as of March 31, 2002 and 2003, and the consolidated results of their operations and cash fl ows for each of the two years in the period ended March 31, 2003, in conformity with accounting principles generally accepted in the United States.
Baltimore, MarylandApril 30, 2003
REPORT OF INDEPENDENT PUBLIC ACCOUNTANTS
To the Stockholders of The Advisory Board Company:
We have audited the accompanying balance sheets of The Advisory Board Company as of March 31, 2001 and 2002, and the related statements of operations, stockholders’ defi cit and cash fl ows for each of the three years in the period ended March 31, 2002. These fi nancial statements are the responsibility of the Company’s management. Our responsibility is to express an opinion on these fi nancial statements based on our audits.
We conducted our audits in accordance with auditing standards generally accepted in the United States. Those standards require that we plan and perform the audit to obtain reasonable assurance about whether the fi nancial statements are free of material misstatement. An audit includes examining, on a test basis, evidence supporting the amounts and disclosures in the fi nancial statements. An audit also includes assessing the accounting principles used and signifi cant estimates made by management, as well as evaluating the overall fi nancial statement presentation. We believe that our audits provide a reasonable basis for our opinion.
In our opinion, the fi nancial statements referred to above present fairly, in all material respects, the fi nancial position of The Advisory Board Company as of March 31, 2001 and 2002, and the results of its operations and its cash fl ows for each of the three years in the period ended March 31, 2002, in conformity with accounting principles generally accepted in the United States.
ARTHUR ANDERSEN LLP
Baltimore, MarylandApril 24, 2002
Arthur Andersen LLP has not consented to the inclusion of the following report in this Annual Report and therefore you may not be able to recover against Arthur Andersen LLP under Section 11 of the Securities Act of 1933 for any untrue statements or material fact contained in the fi nancial statements audited by Arthur Andersen LLP or any omissions to state a material fact required to be stated therein.
11
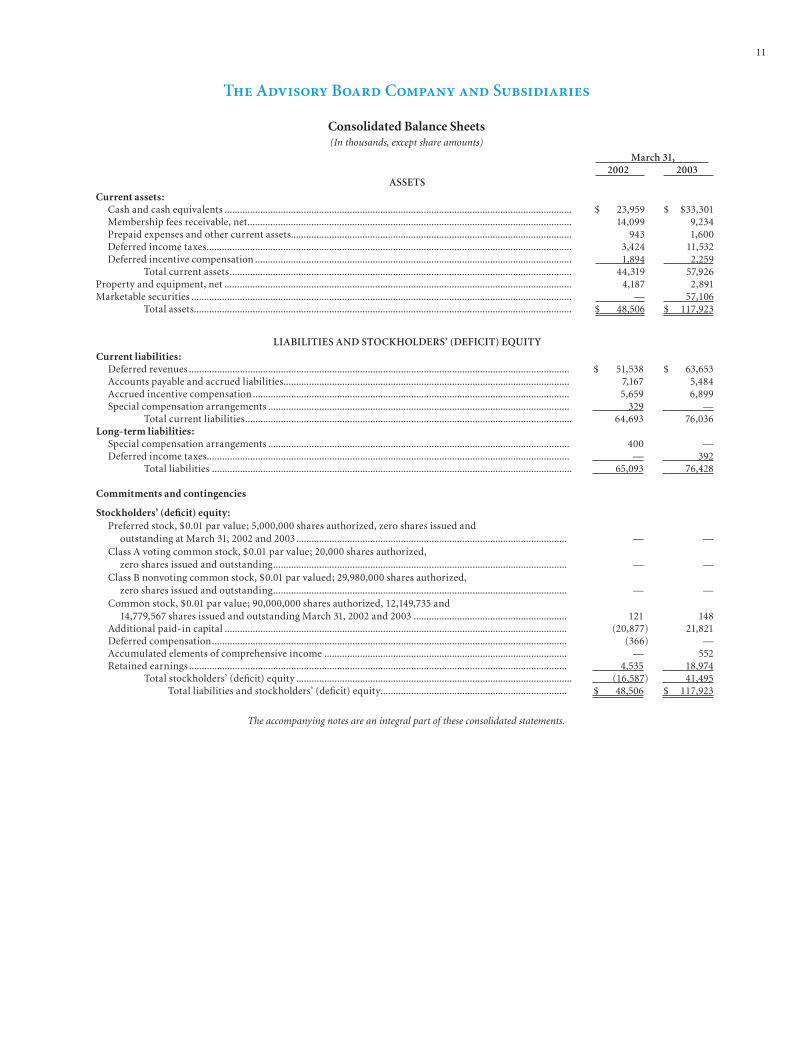
The Advisory Board Company and Subsidiaries
Consolidated Balance Sheets(In thousands, except share amounts)
March 31,2002 2003
ASSETS
Current assets:Cash and cash equivalents ........................................................................................................................................ $ 23,959 $ $33,301Membership fees receivable, net............................................................................................................................... 14,099 9,234Prepaid expenses and other current assets.............................................................................................................. 943 1,600Deferred income taxes............................................................................................................................................... 3,424 11,532Deferred incentive compensation ............................................................................................................................ 1,894 2,259
Total current assets...................................................................................................................................... 44,319 57,926Property and equipment, net ........................................................................................................................................ 4,187 2,891Marketable securities ..................................................................................................................................................... — 57,106
Total assets.................................................................................................................................................... $ 48,506 $ 117,923
LIABILITIES AND STOCKHOLDERS’ (DEFICIT) EQUITY
Current liabilities:Deferred revenues ..................................................................................................................................................... $ 51,538 $ 63,653Accounts payable and accrued liabilities................................................................................................................ 7,167 5,484Accrued incentive compensation............................................................................................................................ 5,659 6,899Special compensation arrangements ...................................................................................................................... 329 —
Total current liabilities................................................................................................................................ 64,693 76,036Long-term liabilities:
Special compensation arrangements ...................................................................................................................... 400 —Deferred income taxes.............................................................................................................................................. — 392
Total liabilities ............................................................................................................................................. 65,093 76,428
Commitments and contingencies
Stockholders’ (defi cit) equity:Preferred stock, $0.01 par value; 5,000,000 shares authorized, zero shares issued and
outstanding at March 31, 2002 and 2003.......................................................................................................... — —Class A voting common stock, $0.01 par value; 20,000 shares authorized,
zero shares issued and outstanding................................................................................................................... — —Class B nonvoting common stock, $0.01 par valued; 29,980,000 shares authorized,
zero shares issued and outstanding................................................................................................................... — —Common stock, $0.01 par value; 90,000,000 shares authorized, 12,149,735 and
14,779,567 shares issued and outstanding March 31, 2002 and 2003 ............................................................ 121 148Additional paid-in capital ...................................................................................................................................... (20,877) 21,821Deferred compensation........................................................................................................................................... (366) —Accumulated elements of comprehensive income ............................................................................................... — 552Retained earnings .................................................................................................................................................... 4,535 18,974
Total stockholders’ (defi cit) equity ............................................................................................................ (16,587) 41,495Total liabilities and stockholders’ (defi cit) equity......................................................................... $ 48,506 $ 117,923
The accompanying notes are an integral part of these consolidated statements.
12
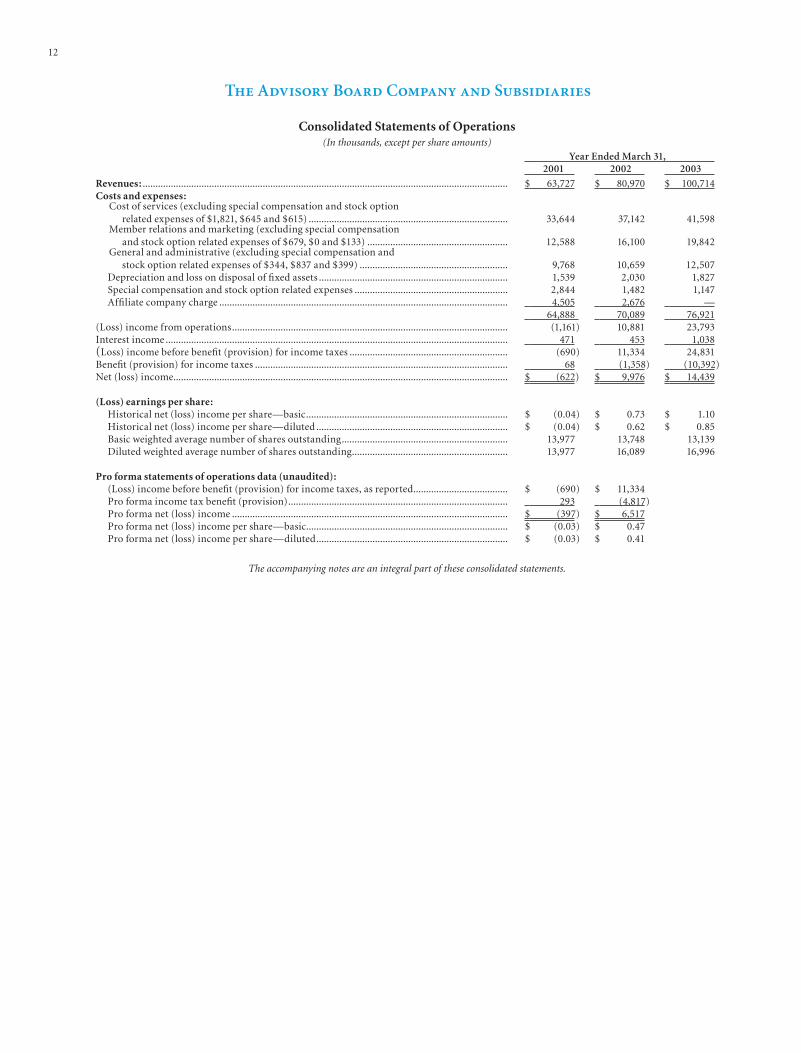
Year Ended March 31,2001 2002 2003
Revenues: ............................................................................................................................................... $ 63,727 $ 80,970 $ 100,714Costs and expenses:
Cost of services (excluding special compensation and stock option related expenses of $1,821, $645 and $615) .............................................................................. 33,644 37,142 41,598
Member relations and marketing (excluding special compensation and stock option related expenses of $679, $0 and $133) ....................................................... 12,588 16,100 19,842
General and administrative (excluding special compensation and stock option related expenses of $344, $837 and $399) .......................................................... 9,768 10,659 12,507
Depreciation and loss on disposal of fi xed assets .......................................................................... 1,539 2,030 1,827Special compensation and stock option related expenses ............................................................ 2,844 1,482 1,147Affi liate company charge ................................................................................................................. 4,505 2,676 —
64,888 70,089 76,921(Loss) income from operations............................................................................................................ (1,161) 10,881 23,793Interest income ...................................................................................................................................... 471 453 1,038(Loss) income before benefi t (provision) for income taxes .............................................................. (690) 11,334 24,831Benefi t (provision) for income taxes ................................................................................................... 68 (1,358) (10,392)Net (loss) income................................................................................................................................... $ (622) $ 9,976 $ 14,439
(Loss) earnings per share:Historical net (loss) income per share—basic............................................................................... $ (0.04) $ 0.73 $ 1.10Historical net (loss) income per share—diluted ........................................................................... $ (0.04) $ 0.62 $ 0.85Basic weighted average number of shares outstanding................................................................. 13,977 13,748 13,139Diluted weighted average number of shares outstanding............................................................. 13,977 16,089 16,996
Pro forma statements of operations data (unaudited):(Loss) income before benefi t (provision) for income taxes, as reported..................................... $ (690) $ 11,334Pro forma income tax benefi t (provision)...................................................................................... 293 (4,817)Pro forma net (loss) income ............................................................................................................ $ (397) $ 6,517Pro forma net (loss) income per share—basic............................................................................... $ (0.03) $ 0.47Pro forma net (loss) income per share—diluted........................................................................... $ (0.03) $ 0.41
Consolidated Statements of Operations(In thousands, except per share amounts)
The Advisory Board Company and Subsidiaries
The accompanying notes are an integral part of these consolidated statements.
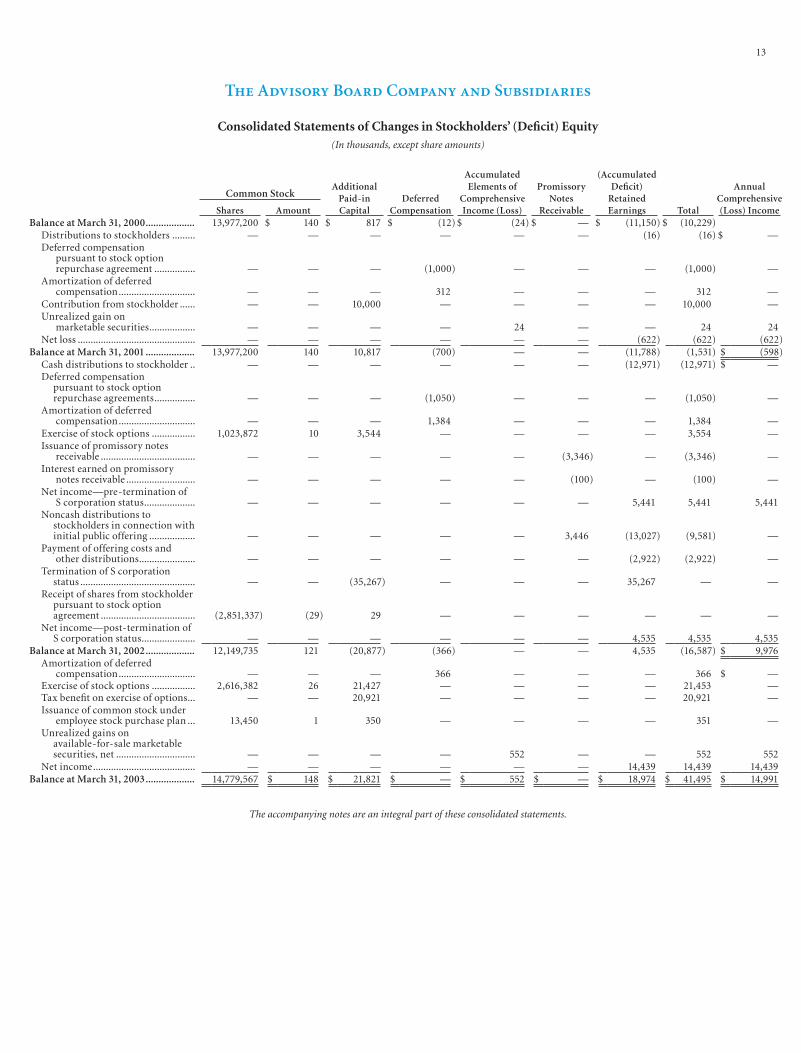
13
Consolidated Statements of Changes in Stockholders’ (Defi cit) Equity(In thousands, except share amounts)
The Advisory Board Company and Subsidiaries
The accompanying notes are an integral part of these consolidated statements.
Common StockAdditional
Paid-in Capital
Deferred Compensation
Accumulated Elements of
Comprehensive Income (Loss)
Promissory Notes
Receivable
(Accumulated Defi cit)
Retained Earnings Total
Annual Comprehensive (Loss) IncomeShares Amount
Balance at March 31, 2000................... 13,977,200 $ 140 $ 817 $ (12) $ (24) $ — $ (11,150) $ (10,229)Distributions to stockholders ......... — — — — — — (16) (16) $ —Deferred compensation
pursuant to stock option repurchase agreement ................ — — — (1,000) — — — (1,000) —
Amortization of deferred compensation.............................. — — — 312 — — — 312 —
Contribution from stockholder ...... — — 10,000 — — — — 10,000 —Unrealized gain on
marketable securities.................. — — — — 24 — — 24 24Net loss .............................................. — — — — — — (622) (622) (622)
Balance at March 31, 2001 ................... 13,977,200 140 10,817 (700) — — (11,788) (1,531) $ (598)Cash distributions to stockholder .. — — — — — — (12,971) (12,971) $ —Deferred compensation
pursuant to stock option repurchase agreements................ — — — (1,050) — — — (1,050) —
Amortization of deferred compensation.............................. — — — 1,384 — — — 1,384 —
Exercise of stock options ................. 1,023,872 10 3,544 — — — — 3,554 —Issuance of promissory notes
receivable ..................................... — — — — — (3,346) — (3,346) —Interest earned on promissory
notes receivable ........................... — — — — — (100) — (100) —Net income—pre-termination of
S corporation status.................... — — — — — — 5,441 5,441 5,441Noncash distributions to
stockholders in connection with initial public offering .................. — — — — — 3,446 (13,027) (9,581) —
Payment of offering costs and other distributions...................... — — — — — — (2,922) (2,922) —
Termination of S corporation status ............................................. — — (35,267) — — — 35,267 — —
Receipt of shares from stockholder pursuant to stock option agreement ..................................... (2,851,337) (29) 29 — — — — — —
Net income—post-termination of S corporation status..................... — — — — — — 4,535 4,535 4,535
Balance at March 31, 2002................... 12,149,735 121 (20,877) (366) — — 4,535 (16,587) $ 9,976Amortization of deferred
compensation.............................. — — — 366 — — — 366 $ —Exercise of stock options ................. 2,616,382 26 21,427 — — — — 21,453 —Tax benefi t on exercise of options... — — 20,921 — — — — 20,921 —Issuance of common stock under
employee stock purchase plan ... 13,450 1 350 — — — — 351 —Unrealized gains on
available-for-sale marketable securities, net ............................... — — — — 552 — — 552 552
Net income........................................ — — — — — — 14,439 14,439 14,439Balance at March 31, 2003................... 14,779,567 $ 148 $ 21,821 $ — $ 552 $ — $ 18,974 $ 41,495 $ 14,991
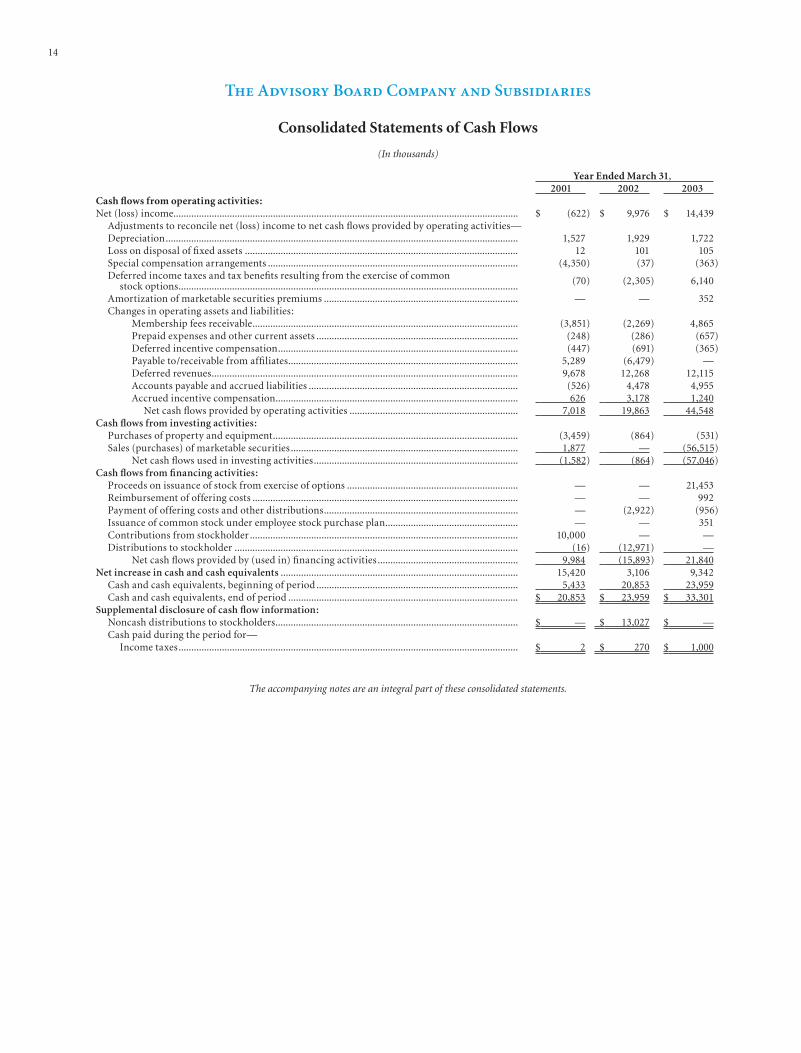
14
Consolidated Statements of Cash Flows
(In thousands)
The Advisory Board Company and Subsidiaries
Year Ended March 31,2001 2002 2003
Cash fl ows from operating activities:Net (loss) income....................................................................................................................................... $ (622) $ 9,976 $ 14,439
Adjustments to reconcile net (loss) income to net cash fl ows provided by operating activities—Depreciation.......................................................................................................................................... 1,527 1,929 1,722Loss on disposal of fi xed assets ........................................................................................................... 12 101 105Special compensation arrangements .................................................................................................. (4,350) (37) (363)Deferred income taxes and tax benefi ts resulting from the exercise of common
stock options..................................................................................................................................... (70) (2,305) 6,140
Amortization of marketable securities premiums ............................................................................ — — 352Changes in operating assets and liabilities:
Membership fees receivable........................................................................................................ (3,851) (2,269) 4,865Prepaid expenses and other current assets ............................................................................... (248) (286) (657)Deferred incentive compensation.............................................................................................. (447) (691) (365)Payable to/receivable from affi liates.......................................................................................... 5,289 (6,479) —Deferred revenues........................................................................................................................ 9,678 12,268 12,115Accounts payable and accrued liabilities .................................................................................. (526) 4,478 4,955Accrued incentive compensation............................................................................................... 626 3,178 1,240
Net cash fl ows provided by operating activities .................................................................. 7,018 19,863 44,548Cash fl ows from investing activities:
Purchases of property and equipment................................................................................................ (3,459) (864) (531)Sales (purchases) of marketable securities ......................................................................................... 1,877 — (56,515)
Net cash fl ows used in investing activities................................................................................ (1,582) (864) (57,046)Cash fl ows from fi nancing activities:
Proceeds on issuance of stock from exercise of options ................................................................... — — 21,453Reimbursement of offering costs ........................................................................................................ — — 992Payment of offering costs and other distributions............................................................................ — (2,922) (956)Issuance of common stock under employee stock purchase plan.................................................... — — 351Contributions from stockholder ......................................................................................................... 10,000 — —Distributions to stockholder ............................................................................................................... (16) (12,971) —
Net cash fl ows provided by (used in) fi nancing activities ....................................................... 9,984 (15,893) 21,840Net increase in cash and cash equivalents ............................................................................................. 15,420 3,106 9,342
Cash and cash equivalents, beginning of period ............................................................................... 5,433 20,853 23,959Cash and cash equivalents, end of period .......................................................................................... $ 20,853 $ 23,959 $ 33,301
Supplemental disclosure of cash fl ow information:Noncash distributions to stockholders............................................................................................... $ — $ 13,027 $ —Cash paid during the period for—
Income taxes..................................................................................................................................... $ 2 $ 270 $ 1,000
The accompanying notes are an integral part of these consolidated statements.
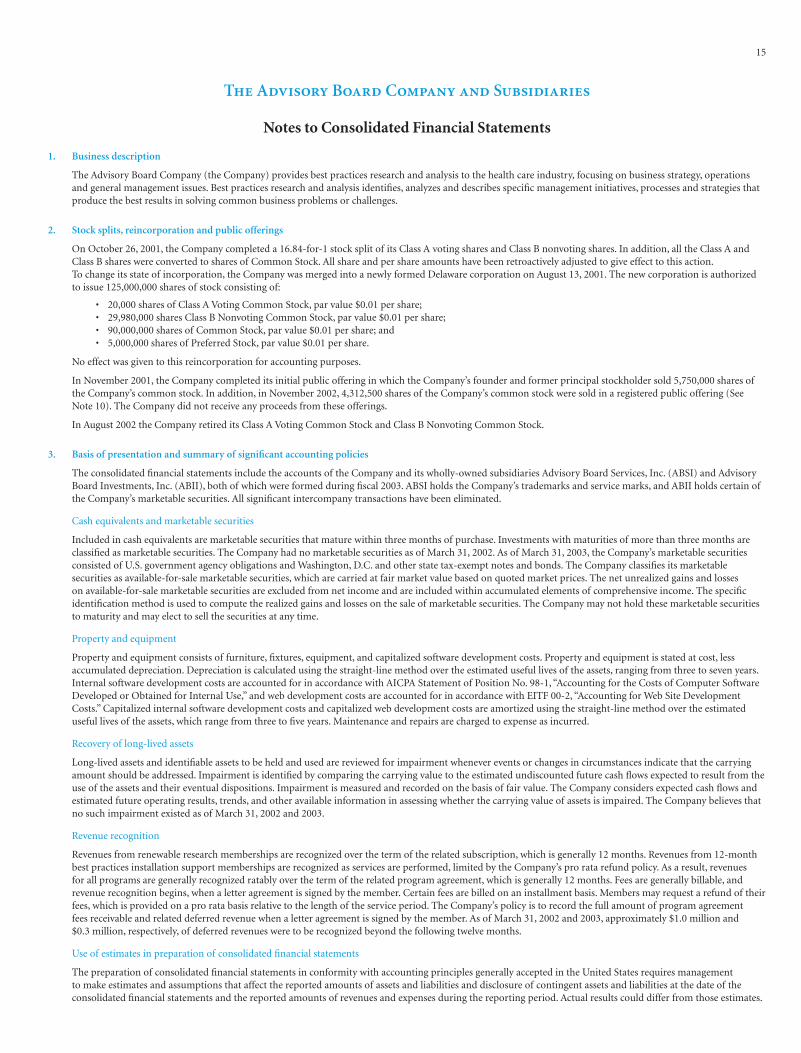
15
Notes to Consolidated Financial Statements
The Advisory Board Company and Subsidiaries
1. Business description
The Advisory Board Company (the Company) provides best practices research and analysis to the health care industry, focusing on business strategy, operations and general management issues. Best practices research and analysis identifi es, analyzes and describes specifi c management initiatives, processes and strategies that produce the best results in solving common business problems or challenges.
2. Stock splits, reincorporation and public offerings
On October 26, 2001, the Company completed a 16.84-for-1 stock split of its Class A voting shares and Class B nonvoting shares. In addition, all the Class A and Class B shares were converted to shares of Common Stock. All share and per share amounts have been retroactively adjusted to give effect to this action. To change its state of incorporation, the Company was merged into a newly formed Delaware corporation on August 13, 2001. The new corporation is authorized to issue 125,000,000 shares of stock consisting of:
• 20,000 shares of Class A Voting Common Stock, par value $0.01 per share;• 29,980,000 shares Class B Nonvoting Common Stock, par value $0.01 per share;• 90,000,000 shares of Common Stock, par value $0.01 per share; and• 5,000,000 shares of Preferred Stock, par value $0.01 per share.
No effect was given to this reincorporation for accounting purposes.
In November 2001, the Company completed its initial public offering in which the Company’s founder and former principal stockholder sold 5,750,000 shares of the Company’s common stock. In addition, in November 2002, 4,312,500 shares of the Company’s common stock were sold in a registered public offering (See Note 10). The Company did not receive any proceeds from these offerings.
In August 2002 the Company retired its Class A Voting Common Stock and Class B Nonvoting Common Stock.
3. Basis of presentation and summary of signifi cant accounting policies
The consolidated fi nancial statements include the accounts of the Company and its wholly-owned subsidiaries Advisory Board Services, Inc. (ABSI) and Advisory Board Investments, Inc. (ABII), both of which were formed during fi scal 2003. ABSI holds the Company’s trademarks and service marks, and ABII holds certain of the Company’s marketable securities. All signifi cant intercompany transactions have been eliminated.
Cash equivalents and marketable securities
Included in cash equivalents are marketable securities that mature within three months of purchase. Investments with maturities of more than three months are classifi ed as marketable securities. The Company had no marketable securities as of March 31, 2002. As of March 31, 2003, the Company’s marketable securities consisted of U.S. government agency obligations and Washington, D.C. and other state tax-exempt notes and bonds. The Company classifi es its marketable securities as available-for-sale marketable securities, which are carried at fair market value based on quoted market prices. The net unrealized gains and losses on available-for-sale marketable securities are excluded from net income and are included within accumulated elements of comprehensive income. The specifi c identifi cation method is used to compute the realized gains and losses on the sale of marketable securities. The Company may not hold these marketable securities to maturity and may elect to sell the securities at any time.
Property and equipment
Property and equipment consists of furniture, fi xtures, equipment, and capitalized software development costs. Property and equipment is stated at cost, less accumulated depreciation. Depreciation is calculated using the straight-line method over the estimated useful lives of the assets, ranging from three to seven years. Internal software development costs are accounted for in accordance with AICPA Statement of Position No. 98-1, “Accounting for the Costs of Computer Software Developed or Obtained for Internal Use,” and web development costs are accounted for in accordance with EITF 00-2, “Accounting for Web Site Development Costs.” Capitalized internal software development costs and capitalized web development costs are amortized using the straight-line method over the estimated useful lives of the assets, which range from three to fi ve years. Maintenance and repairs are charged to expense as incurred.
Recovery of long-lived assets
Long-lived assets and identifi able assets to be held and used are reviewed for impairment whenever events or changes in circumstances indicate that the carrying amount should be addressed. Impairment is identifi ed by comparing the carrying value to the estimated undiscounted future cash fl ows expected to result from the use of the assets and their eventual dispositions. Impairment is measured and recorded on the basis of fair value. The Company considers expected cash fl ows and estimated future operating results, trends, and other available information in assessing whether the carrying value of assets is impaired. The Company believes that no such impairment existed as of March 31, 2002 and 2003.
Revenue recognition
Revenues from renewable research memberships are recognized over the term of the related subscription, which is generally 12 months. Revenues from 12-month best practices installation support memberships are recognized as services are performed, limited by the Company’s pro rata refund policy. As a result, revenues for all programs are generally recognized ratably over the term of the related program agreement, which is generally 12 months. Fees are generally billable, and revenue recognition begins, when a letter agreement is signed by the member. Certain fees are billed on an installment basis. Members may request a refund of their fees, which is provided on a pro rata basis relative to the length of the service period. The Company’s policy is to record the full amount of program agreement fees receivable and related deferred revenue when a letter agreement is signed by the member. As of March 31, 2002 and 2003, approximately $1.0 million and $0.3 million, respectively, of deferred revenues were to be recognized beyond the following twelve months.
Use of estimates in preparation of consolidated fi nancial statements
The preparation of consolidated fi nancial statements in conformity with accounting principles generally accepted in the United States requires management to make estimates and assumptions that affect the reported amounts of assets and liabilities and disclosure of contingent assets and liabilities at the date of the consolidated fi nancial statements and the reported amounts of revenues and expenses during the reporting period. Actual results could differ from those estimates.
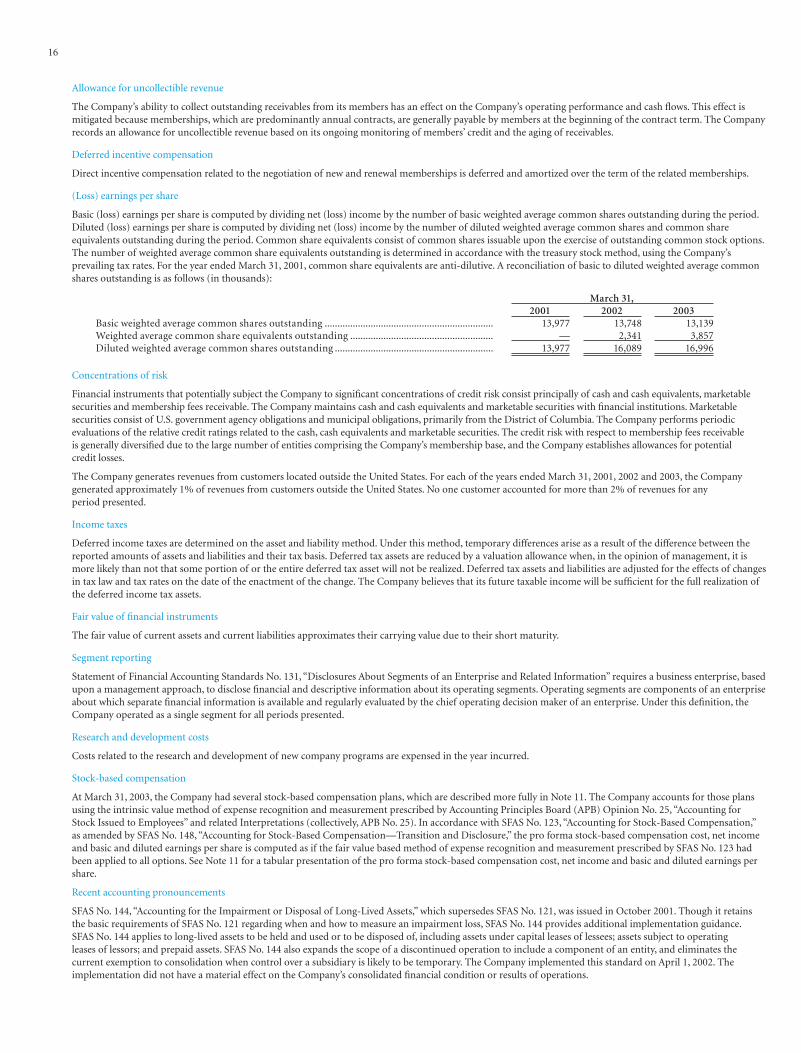
16
Allowance for uncollectible revenue
The Company’s ability to collect outstanding receivables from its members has an effect on the Company’s operating performance and cash fl ows. This effect is mitigated because memberships, which are predominantly annual contracts, are generally payable by members at the beginning of the contract term. The Company records an allowance for uncollectible revenue based on its ongoing monitoring of members’ credit and the aging of receivables.
Deferred incentive compensation
Direct incentive compensation related to the negotiation of new and renewal memberships is deferred and amortized over the term of the related memberships.
(Loss) earnings per share
Basic (loss) earnings per share is computed by dividing net (loss) income by the number of basic weighted average common shares outstanding during the period. Diluted (loss) earnings per share is computed by dividing net (loss) income by the number of diluted weighted average common shares and common share equivalents outstanding during the period. Common share equivalents consist of common shares issuable upon the exercise of outstanding common stock options. The number of weighted average common share equivalents outstanding is determined in accordance with the treasury stock method, using the Company’s prevailing tax rates. For the year ended March 31, 2001, common share equivalents are anti-dilutive. A reconciliation of basic to diluted weighted average common shares outstanding is as follows (in thousands):
March 31,2001 2002 2003
Basic weighted average common shares outstanding .................................................................. 13,977 13,748 13,139Weighted average common share equivalents outstanding ........................................................ — 2,341 3,857Diluted weighted average common shares outstanding .............................................................. 13,977 16,089 16,996
Concentrations of risk
Financial instruments that potentially subject the Company to signifi cant concentrations of credit risk consist principally of cash and cash equivalents, marketable securities and membership fees receivable. The Company maintains cash and cash equivalents and marketable securities with fi nancial institutions. Marketable securities consist of U.S. government agency obligations and municipal obligations, primarily from the District of Columbia. The Company performs periodic evaluations of the relative credit ratings related to the cash, cash equivalents and marketable securities. The credit risk with respect to membership fees receivable is generally diversifi ed due to the large number of entities comprising the Company’s membership base, and the Company establishes allowances for potential credit losses.
The Company generates revenues from customers located outside the United States. For each of the years ended March 31, 2001, 2002 and 2003, the Company generated approximately 1% of revenues from customers outside the United States. No one customer accounted for more than 2% of revenues for any period presented.
Income taxes
Deferred income taxes are determined on the asset and liability method. Under this method, temporary differences arise as a result of the difference between the reported amounts of assets and liabilities and their tax basis. Deferred tax assets are reduced by a valuation allowance when, in the opinion of management, it is more likely than not that some portion of or the entire deferred tax asset will not be realized. Deferred tax assets and liabilities are adjusted for the effects of changes in tax law and tax rates on the date of the enactment of the change. The Company believes that its future taxable income will be suffi cient for the full realization of the deferred income tax assets.
Fair value of fi nancial instruments
The fair value of current assets and current liabilities approximates their carrying value due to their short maturity.
Segment reporting
Statement of Financial Accounting Standards No. 131, “Disclosures About Segments of an Enterprise and Related Information” requires a business enterprise, based upon a management approach, to disclose fi nancial and descriptive information about its operating segments. Operating segments are components of an enterprise about which separate fi nancial information is available and regularly evaluated by the chief operating decision maker of an enterprise. Under this defi nition, the Company operated as a single segment for all periods presented.
Research and development costs
Costs related to the research and development of new company programs are expensed in the year incurred.
Stock-based compensation
At March 31, 2003, the Company had several stock-based compensation plans, which are described more fully in Note 11. The Company accounts for those plans using the intrinsic value method of expense recognition and measurement prescribed by Accounting Principles Board (APB) Opinion No. 25, “Accounting for Stock Issued to Employees” and related Interpretations (collectively, APB No. 25). In accordance with SFAS No. 123, “Accounting for Stock-Based Compensation,” as amended by SFAS No. 148, “Accounting for Stock-Based Compensation—Transition and Disclosure,” the pro forma stock-based compensation cost, net income and basic and diluted earnings per share is computed as if the fair value based method of expense recognition and measurement prescribed by SFAS No. 123 had been applied to all options. See Note 11 for a tabular presentation of the pro forma stock-based compensation cost, net income and basic and diluted earnings per share.
Recent accounting pronouncements
SFAS No. 144, “Accounting for the Impairment or Disposal of Long-Lived Assets,” which supersedes SFAS No. 121, was issued in October 2001. Though it retains the basic requirements of SFAS No. 121 regarding when and how to measure an impairment loss, SFAS No. 144 provides additional implementation guidance. SFAS No. 144 applies to long-lived assets to be held and used or to be disposed of, including assets under capital leases of lessees; assets subject to operating leases of lessors; and prepaid assets. SFAS No. 144 also expands the scope of a discontinued operation to include a component of an entity, and eliminates the current exemption to consolidation when control over a subsidiary is likely to be temporary. The Company implemented this standard on April 1, 2002. The implementation did not have a material effect on the Company’s consolidated fi nancial condition or results of operations.
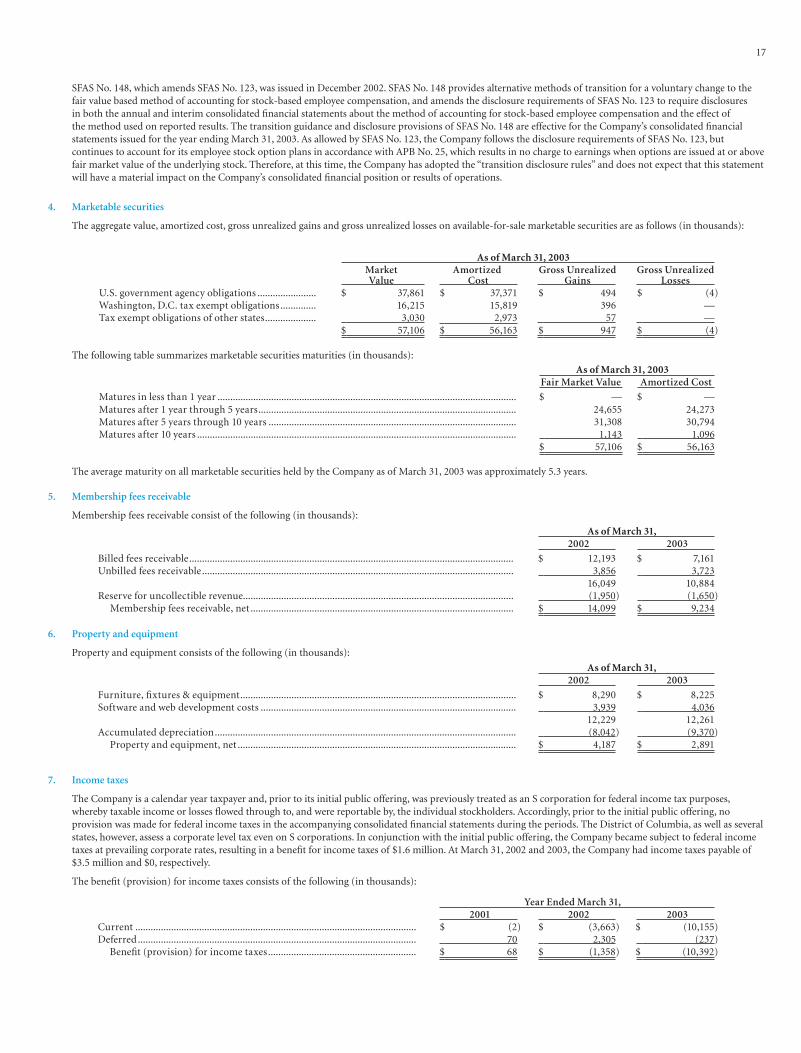
17
SFAS No. 148, which amends SFAS No. 123, was issued in December 2002. SFAS No. 148 provides alternative methods of transition for a voluntary change to the fair value based method of accounting for stock-based employee compensation, and amends the disclosure requirements of SFAS No. 123 to require disclosures in both the annual and interim consolidated fi nancial statements about the method of accounting for stock-based employee compensation and the effect of the method used on reported results. The transition guidance and disclosure provisions of SFAS No. 148 are effective for the Company’s consolidated fi nancial statements issued for the year ending March 31, 2003. As allowed by SFAS No. 123, the Company follows the disclosure requirements of SFAS No. 123, but continues to account for its employee stock option plans in accordance with APB No. 25, which results in no charge to earnings when options are issued at or above fair market value of the underlying stock. Therefore, at this time, the Company has adopted the “transition disclosure rules” and does not expect that this statement will have a material impact on the Company’s consolidated fi nancial position or results of operations.
4. Marketable securities
The aggregate value, amortized cost, gross unrealized gains and gross unrealized losses on available-for-sale marketable securities are as follows (in thousands):
As of March 31, 2003Market Value
Amortized Cost
Gross Unrealized Gains
Gross Unrealized Losses
U.S. government agency obligations ....................... $ 37,861 $ 37,371 $ 494 $ (4)Washington, D.C. tax exempt obligations.............. 16,215 15,819 396 —Tax exempt obligations of other states.................... 3,030 2,973 57 —
$ 57,106 $ 56,163 $ 947 $ (4)
The following table summarizes marketable securities maturities (in thousands):
As of March 31, 2003Fair Market Value Amortized Cost
Matures in less than 1 year ..................................................................................................................... $ — $ —Matures after 1 year through 5 years..................................................................................................... 24,655 24,273Matures after 5 years through 10 years ................................................................................................. 31,308 30,794Matures after 10 years ............................................................................................................................. 1,143 1,096
$ 57,106 $ 56,163
The average maturity on all marketable securities held by the Company as of March 31, 2003 was approximately 5.3 years.
5. Membership fees receivable
Membership fees receivable consist of the following (in thousands):
As of March 31,2002 2003
Billed fees receivable............................................................................................................................... $ 12,193 $ 7,161Unbilled fees receivable.......................................................................................................................... 3,856 3,723
16,049 10,884Reserve for uncollectible revenue.......................................................................................................... (1,950) (1,650)
Membership fees receivable, net ....................................................................................................... $ 14,099 $ 9,234
6. Property and equipment
Property and equipment consists of the following (in thousands):
As of March 31,2002 2003
Furniture, fi xtures & equipment............................................................................................................ $ 8,290 $ 8,225Software and web development costs .................................................................................................... 3,939 4,036
12,229 12,261Accumulated depreciation...................................................................................................................... (8,042) (9,370)
Property and equipment, net ............................................................................................................. $ 4,187 $ 2,891
7. Income taxes
The Company is a calendar year taxpayer and, prior to its initial public offering, was previously treated as an S corporation for federal income tax purposes, whereby taxable income or losses fl owed through to, and were reportable by, the individual stockholders. Accordingly, prior to the initial public offering, no provision was made for federal income taxes in the accompanying consolidated fi nancial statements during the periods. The District of Columbia, as well as several states, however, assess a corporate level tax even on S corporations. In conjunction with the initial public offering, the Company became subject to federal income taxes at prevailing corporate rates, resulting in a benefi t for income taxes of $1.6 million. At March 31, 2002 and 2003, the Company had income taxes payable of $3.5 million and $0, respectively.
The benefi t (provision) for income taxes consists of the following (in thousands):
Year Ended March 31,2001 2002 2003
Current .............................................................................................................. $ (2) $ (3,663) $ (10,155)Deferred ............................................................................................................. 70 2,305 (237)
Benefi t (provision) for income taxes.......................................................... $ 68 $ (1,358) $ (10,392)
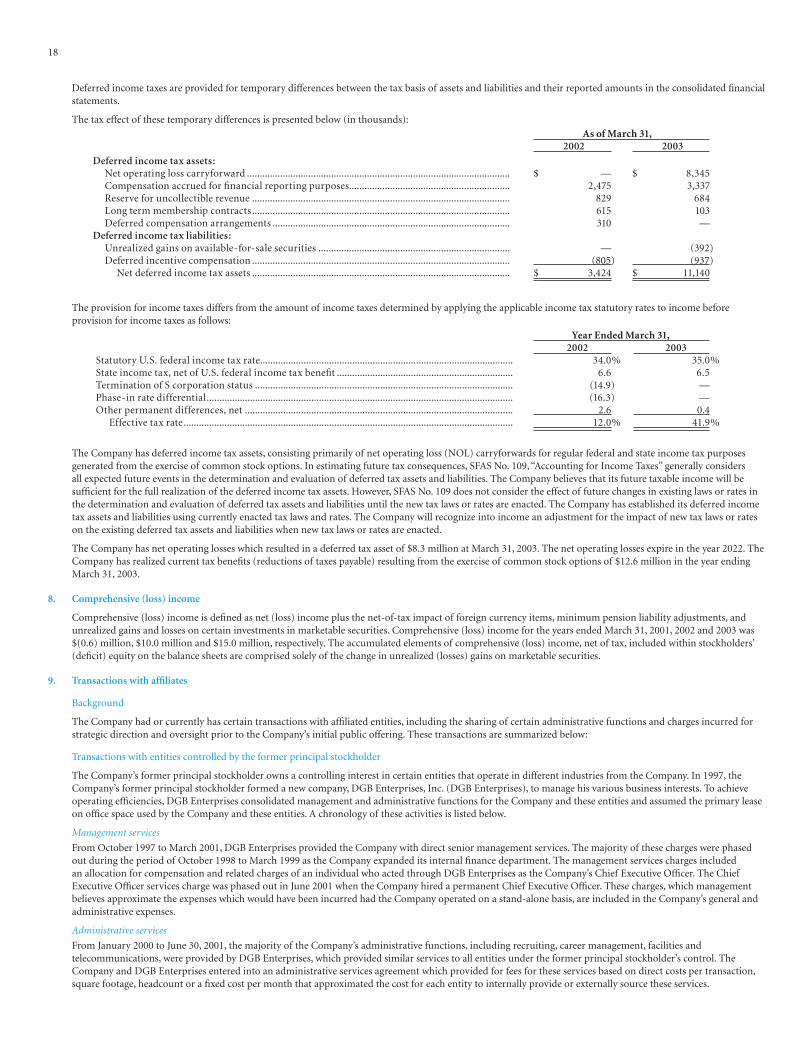
18
Deferred income taxes are provided for temporary differences between the tax basis of assets and liabilities and their reported amounts in the consolidated fi nancial statements.
The tax effect of these temporary differences is presented below (in thousands):
The provision for income taxes differs from the amount of income taxes determined by applying the applicable income tax statutory rates to income before provision for income taxes as follows:
Year Ended March 31,2002 2003
Statutory U.S. federal income tax rate................................................................................................... 34.0% 35.0%State income tax, net of U.S. federal income tax benefi t ..................................................................... 6.6 6.5Termination of S corporation status ..................................................................................................... (14.9) —Phase-in rate differential........................................................................................................................ (16.3) —Other permanent differences, net ......................................................................................................... 2.6 0.4
Effective tax rate................................................................................................................................. 12.0% 41.9%
The Company has deferred income tax assets, consisting primarily of net operating loss (NOL) carryforwards for regular federal and state income tax purposes generated from the exercise of common stock options. In estimating future tax consequences, SFAS No. 109, “Accounting for Income Taxes” generally considers all expected future events in the determination and evaluation of deferred tax assets and liabilities. The Company believes that its future taxable income will be suffi cient for the full realization of the deferred income tax assets. However, SFAS No. 109 does not consider the effect of future changes in existing laws or rates in the determination and evaluation of deferred tax assets and liabilities until the new tax laws or rates are enacted. The Company has established its deferred income tax assets and liabilities using currently enacted tax laws and rates. The Company will recognize into income an adjustment for the impact of new tax laws or rates on the existing deferred tax assets and liabilities when new tax laws or rates are enacted.
The Company has net operating losses which resulted in a deferred tax asset of $8.3 million at March 31, 2003. The net operating losses expire in the year 2022. The Company has realized current tax benefi ts (reductions of taxes payable) resulting from the exercise of common stock options of $12.6 million in the year ending March 31, 2003.
8. Comprehensive (loss) income
Comprehensive (loss) income is defi ned as net (loss) income plus the net-of-tax impact of foreign currency items, minimum pension liability adjustments, and unrealized gains and losses on certain investments in marketable securities. Comprehensive (loss) income for the years ended March 31, 2001, 2002 and 2003 was $(0.6) million, $10.0 million and $15.0 million, respectively. The accumulated elements of comprehensive (loss) income, net of tax, included within stockholders’ (defi cit) equity on the balance sheets are comprised solely of the change in unrealized (losses) gains on marketable securities.
9. Transactions with affi liates
Background
The Company had or currently has certain transactions with affi liated entities, including the sharing of certain administrative functions and charges incurred for strategic direction and oversight prior to the Company’s initial public offering. These transactions are summarized below:
Transactions with entities controlled by the former principal stockholder
The Company’s former principal stockholder owns a controlling interest in certain entities that operate in different industries from the Company. In 1997, the Company’s former principal stockholder formed a new company, DGB Enterprises, Inc. (DGB Enterprises), to manage his various business interests. To achieve operating effi ciencies, DGB Enterprises consolidated management and administrative functions for the Company and these entities and assumed the primary lease on offi ce space used by the Company and these entities. A chronology of these activities is listed below.
Management services
From October 1997 to March 2001, DGB Enterprises provided the Company with direct senior management services. The majority of these charges were phased out during the period of October 1998 to March 1999 as the Company expanded its internal fi nance department. The management services charges included an allocation for compensation and related charges of an individual who acted through DGB Enterprises as the Company’s Chief Executive Offi cer. The Chief Executive Offi cer services charge was phased out in June 2001 when the Company hired a permanent Chief Executive Offi cer. These charges, which management believes approximate the expenses which would have been incurred had the Company operated on a stand-alone basis, are included in the Company’s general and administrative expenses.
Administrative services
From January 2000 to June 30, 2001, the majority of the Company’s administrative functions, including recruiting, career management, facilities and telecommunications, were provided by DGB Enterprises, which provided similar services to all entities under the former principal stockholder’s control. The Company and DGB Enterprises entered into an administrative services agreement which provided for fees for these services based on direct costs per transaction, square footage, headcount or a fi xed cost per month that approximated the cost for each entity to internally provide or externally source these services.
As of March 31,2002 2003
Deferred income tax assets:Net operating loss carryforward ....................................................................................................... $ — $ 8,345Compensation accrued for fi nancial reporting purposes............................................................... 2,475 3,337Reserve for uncollectible revenue ..................................................................................................... 829 684Long term membership contracts..................................................................................................... 615 103Deferred compensation arrangements ............................................................................................. 310 —
Deferred income tax liabilities:Unrealized gains on available-for-sale securities ........................................................................... — (392)Deferred incentive compensation ..................................................................................................... (805) (937)
Net deferred income tax assets ..................................................................................................... $ 3,424 $ 11,140
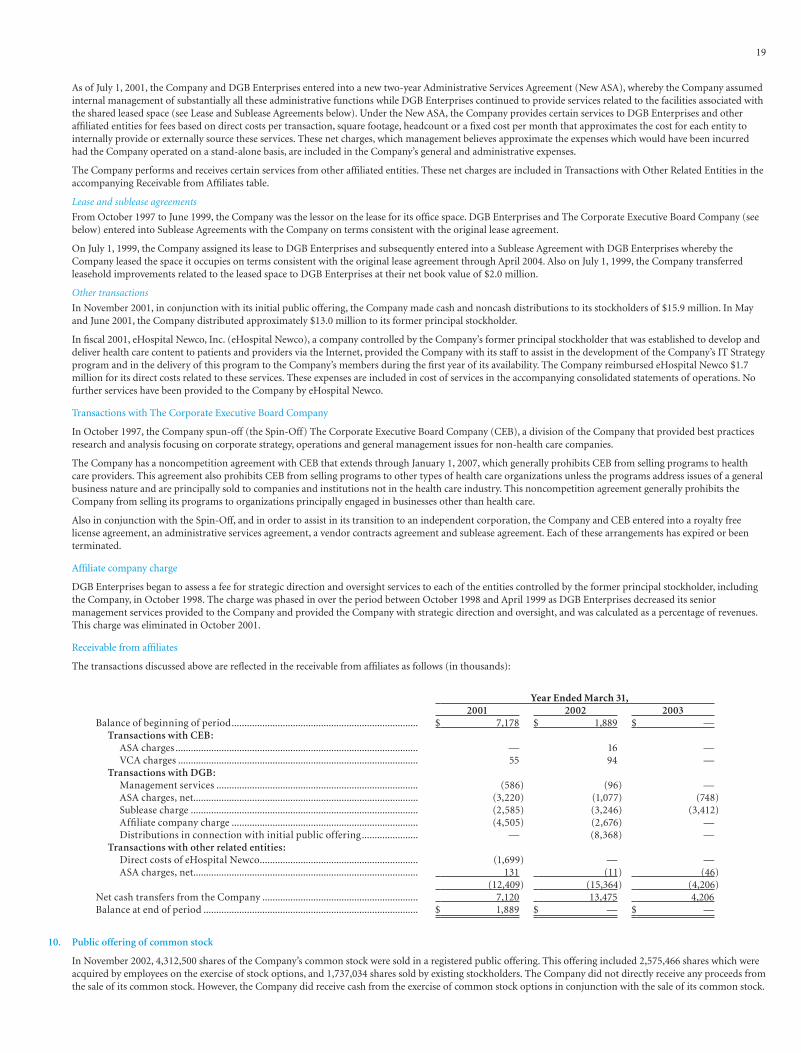
19
As of July 1, 2001, the Company and DGB Enterprises entered into a new two-year Administrative Services Agreement (New ASA), whereby the Company assumed internal management of substantially all these administrative functions while DGB Enterprises continued to provide services related to the facilities associated with the shared leased space (see Lease and Sublease Agreements below). Under the New ASA, the Company provides certain services to DGB Enterprises and other affi liated entities for fees based on direct costs per transaction, square footage, headcount or a fi xed cost per month that approximates the cost for each entity to internally provide or externally source these services. These net charges, which management believes approximate the expenses which would have been incurred had the Company operated on a stand-alone basis, are included in the Company’s general and administrative expenses.
The Company performs and receives certain services from other affi liated entities. These net charges are included in Transactions with Other Related Entities in the accompanying Receivable from Affi liates table.
Lease and sublease agreements
From October 1997 to June 1999, the Company was the lessor on the lease for its offi ce space. DGB Enterprises and The Corporate Executive Board Company (see below) entered into Sublease Agreements with the Company on terms consistent with the original lease agreement.
On July 1, 1999, the Company assigned its lease to DGB Enterprises and subsequently entered into a Sublease Agreement with DGB Enterprises whereby the Company leased the space it occupies on terms consistent with the original lease agreement through April 2004. Also on July 1, 1999, the Company transferred leasehold improvements related to the leased space to DGB Enterprises at their net book value of $2.0 million.
Other transactions
In November 2001, in conjunction with its initial public offering, the Company made cash and noncash distributions to its stockholders of $15.9 million. In May and June 2001, the Company distributed approximately $13.0 million to its former principal stockholder.
In fi scal 2001, eHospital Newco, Inc. (eHospital Newco), a company controlled by the Company’s former principal stockholder that was established to develop and deliver health care content to patients and providers via the Internet, provided the Company with its staff to assist in the development of the Company’s IT Strategy program and in the delivery of this program to the Company’s members during the fi rst year of its availability. The Company reimbursed eHospital Newco $1.7 million for its direct costs related to these services. These expenses are included in cost of services in the accompanying consolidated statements of operations. No further services have been provided to the Company by eHospital Newco.
Transactions with The Corporate Executive Board Company
In October 1997, the Company spun-off (the Spin-Off) The Corporate Executive Board Company (CEB), a division of the Company that provided best practices research and analysis focusing on corporate strategy, operations and general management issues for non-health care companies.
The Company has a noncompetition agreement with CEB that extends through January 1, 2007, which generally prohibits CEB from selling programs to health care providers. This agreement also prohibits CEB from selling programs to other types of health care organizations unless the programs address issues of a general business nature and are principally sold to companies and institutions not in the health care industry. This noncompetition agreement generally prohibits the Company from selling its programs to organizations principally engaged in businesses other than health care.
Also in conjunction with the Spin-Off, and in order to assist in its transition to an independent corporation, the Company and CEB entered into a royalty free license agreement, an administrative services agreement, a vendor contracts agreement and sublease agreement. Each of these arrangements has expired or been terminated.
Affi liate company charge
DGB Enterprises began to assess a fee for strategic direction and oversight services to each of the entities controlled by the former principal stockholder, including the Company, in October 1998. The charge was phased in over the period between October 1998 and April 1999 as DGB Enterprises decreased its senior management services provided to the Company and provided the Company with strategic direction and oversight, and was calculated as a percentage of revenues. This charge was eliminated in October 2001.
Receivable from affi liates
The transactions discussed above are refl ected in the receivable from affi liates as follows (in thousands):
Year Ended March 31,2001 2002 2003
Balance of beginning of period......................................................................... $ 7,178 $ 1,889 $ —Transactions with CEB:
ASA charges ............................................................................................... — 16 —VCA charges .............................................................................................. 55 94 —
Transactions with DGB:Management services ............................................................................... (586) (96) —ASA charges, net........................................................................................ (3,220) (1,077) (748)Sublease charge ......................................................................................... (2,585) (3,246) (3,412)Affi liate company charge ......................................................................... (4,505) (2,676) —Distributions in connection with initial public offering...................... — (8,368) —
Transactions with other related entities:Direct costs of eHospital Newco.............................................................. (1,699) — —ASA charges, net........................................................................................ 131 (11) (46)
(12,409) (15,364) (4,206)Net cash transfers from the Company ............................................................. 7,120 13,475 4,206Balance at end of period .................................................................................... $ 1,889 $ — $ —
10. Public offering of common stock
In November 2002, 4,312,500 shares of the Company’s common stock were sold in a registered public offering. This offering included 2,575,466 shares which were acquired by employees on the exercise of stock options, and 1,737,034 shares sold by existing stockholders. The Company did not directly receive any proceeds from the sale of its common stock. However, the Company did receive cash from the exercise of common stock options in conjunction with the sale of its common stock.
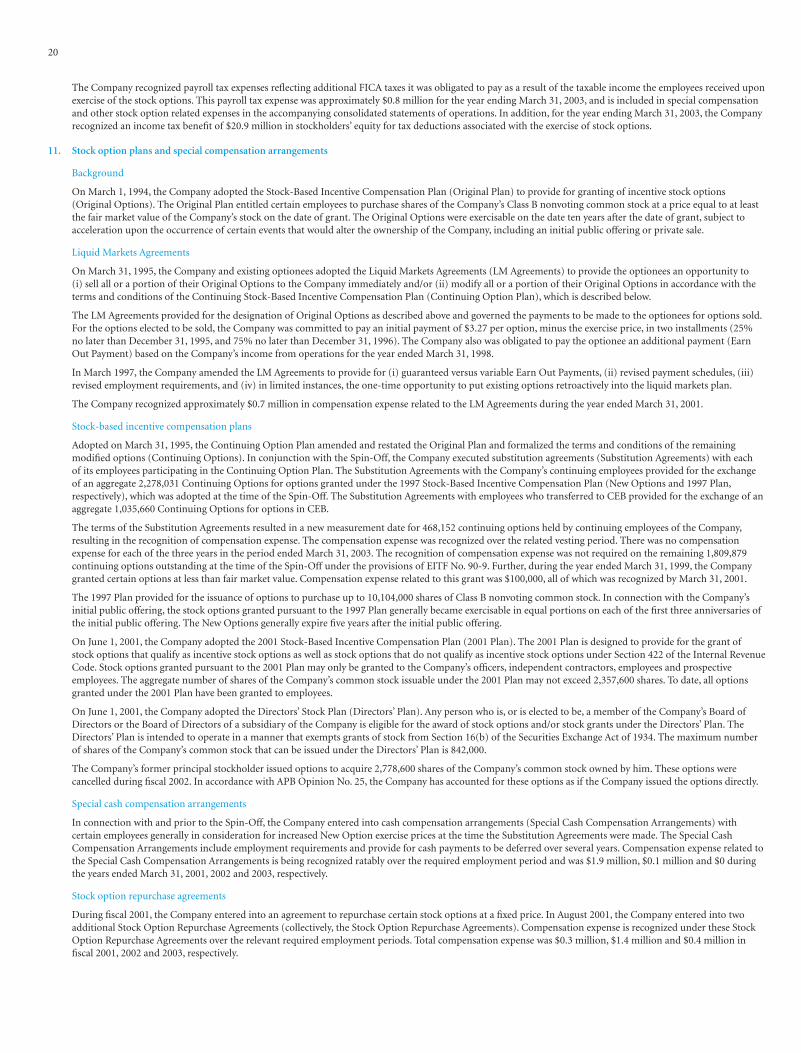
20
The Company recognized payroll tax expenses refl ecting additional FICA taxes it was obligated to pay as a result of the taxable income the employees received upon exercise of the stock options. This payroll tax expense was approximately $0.8 million for the year ending March 31, 2003, and is included in special compensation and other stock option related expenses in the accompanying consolidated statements of operations. In addition, for the year ending March 31, 2003, the Company recognized an income tax benefi t of $20.9 million in stockholders’ equity for tax deductions associated with the exercise of stock options.
11. Stock option plans and special compensation arrangements
Background
On March 1, 1994, the Company adopted the Stock-Based Incentive Compensation Plan (Original Plan) to provide for granting of incentive stock options (Original Options). The Original Plan entitled certain employees to purchase shares of the Company’s Class B nonvoting common stock at a price equal to at least the fair market value of the Company’s stock on the date of grant. The Original Options were exercisable on the date ten years after the date of grant, subject to acceleration upon the occurrence of certain events that would alter the ownership of the Company, including an initial public offering or private sale.
Liquid Markets Agreements
On March 31, 1995, the Company and existing optionees adopted the Liquid Markets Agreements (LM Agreements) to provide the optionees an opportunity to (i) sell all or a portion of their Original Options to the Company immediately and/or (ii) modify all or a portion of their Original Options in accordance with the terms and conditions of the Continuing Stock-Based Incentive Compensation Plan (Continuing Option Plan), which is described below.
The LM Agreements provided for the designation of Original Options as described above and governed the payments to be made to the optionees for options sold. For the options elected to be sold, the Company was committed to pay an initial payment of $3.27 per option, minus the exercise price, in two installments (25% no later than December 31, 1995, and 75% no later than December 31, 1996). The Company also was obligated to pay the optionee an additional payment (Earn Out Payment) based on the Company’s income from operations for the year ended March 31, 1998.
In March 1997, the Company amended the LM Agreements to provide for (i) guaranteed versus variable Earn Out Payments, (ii) revised payment schedules, (iii) revised employment requirements, and (iv) in limited instances, the one-time opportunity to put existing options retroactively into the liquid markets plan.
The Company recognized approximately $0.7 million in compensation expense related to the LM Agreements during the year ended March 31, 2001.
Stock-based incentive compensation plans
Adopted on March 31, 1995, the Continuing Option Plan amended and restated the Original Plan and formalized the terms and conditions of the remaining modifi ed options (Continuing Options). In conjunction with the Spin-Off, the Company executed substitution agreements (Substitution Agreements) with each of its employees participating in the Continuing Option Plan. The Substitution Agreements with the Company’s continuing employees provided for the exchange of an aggregate 2,278,031 Continuing Options for options granted under the 1997 Stock-Based Incentive Compensation Plan (New Options and 1997 Plan, respectively), which was adopted at the time of the Spin-Off. The Substitution Agreements with employees who transferred to CEB provided for the exchange of an aggregate 1,035,660 Continuing Options for options in CEB.
The terms of the Substitution Agreements resulted in a new measurement date for 468,152 continuing options held by continuing employees of the Company, resulting in the recognition of compensation expense. The compensation expense was recognized over the related vesting period. There was no compensation expense for each of the three years in the period ended March 31, 2003. The recognition of compensation expense was not required on the remaining 1,809,879 continuing options outstanding at the time of the Spin-Off under the provisions of EITF No. 90-9. Further, during the year ended March 31, 1999, the Company granted certain options at less than fair market value. Compensation expense related to this grant was $100,000, all of which was recognized by March 31, 2001.
The 1997 Plan provided for the issuance of options to purchase up to 10,104,000 shares of Class B nonvoting common stock. In connection with the Company’s initial public offering, the stock options granted pursuant to the 1997 Plan generally became exercisable in equal portions on each of the fi rst three anniversaries of the initial public offering. The New Options generally expire fi ve years after the initial public offering.
On June 1, 2001, the Company adopted the 2001 Stock-Based Incentive Compensation Plan (2001 Plan). The 2001 Plan is designed to provide for the grant of stock options that qualify as incentive stock options as well as stock options that do not qualify as incentive stock options under Section 422 of the Internal Revenue Code. Stock options granted pursuant to the 2001 Plan may only be granted to the Company’s offi cers, independent contractors, employees and prospective employees. The aggregate number of shares of the Company’s common stock issuable under the 2001 Plan may not exceed 2,357,600 shares. To date, all options granted under the 2001 Plan have been granted to employees.
On June 1, 2001, the Company adopted the Directors’ Stock Plan (Directors’ Plan). Any person who is, or is elected to be, a member of the Company’s Board of Directors or the Board of Directors of a subsidiary of the Company is eligible for the award of stock options and/or stock grants under the Directors’ Plan. The Directors’ Plan is intended to operate in a manner that exempts grants of stock from Section 16(b) of the Securities Exchange Act of 1934. The maximum number of shares of the Company’s common stock that can be issued under the Directors’ Plan is 842,000.
The Company’s former principal stockholder issued options to acquire 2,778,600 shares of the Company’s common stock owned by him. These options were cancelled during fi scal 2002. In accordance with APB Opinion No. 25, the Company has accounted for these options as if the Company issued the options directly.
Special cash compensation arrangements
In connection with and prior to the Spin-Off, the Company entered into cash compensation arrangements (Special Cash Compensation Arrangements) with certain employees generally in consideration for increased New Option exercise prices at the time the Substitution Agreements were made. The Special Cash Compensation Arrangements include employment requirements and provide for cash payments to be deferred over several years. Compensation expense related to the Special Cash Compensation Arrangements is being recognized ratably over the required employment period and was $1.9 million, $0.1 million and $0 during the years ended March 31, 2001, 2002 and 2003, respectively.
Stock option repurchase agreements
During fi scal 2001, the Company entered into an agreement to repurchase certain stock options at a fi xed price. In August 2001, the Company entered into two additional Stock Option Repurchase Agreements (collectively, the Stock Option Repurchase Agreements). Compensation expense is recognized under these Stock Option Repurchase Agreements over the relevant required employment periods. Total compensation expense was $0.3 million, $1.4 million and $0.4 million in fi scal 2001, 2002 and 2003, respectively.
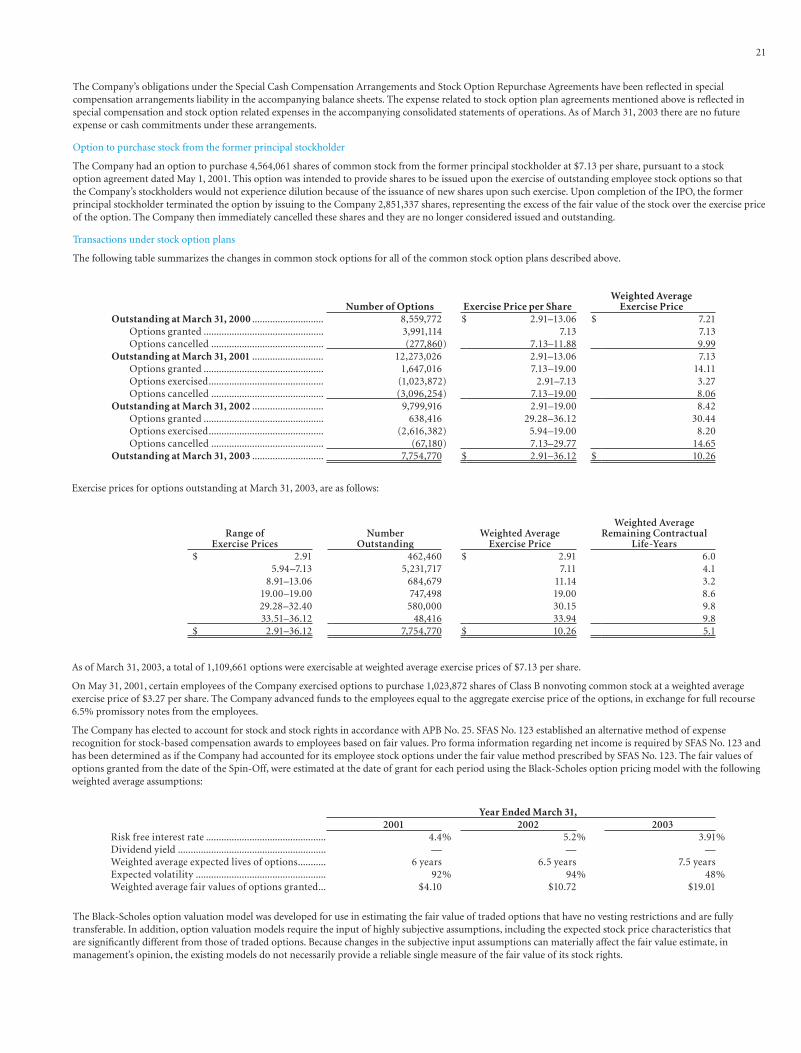
21
The Company’s obligations under the Special Cash Compensation Arrangements and Stock Option Repurchase Agreements have been refl ected in special compensation arrangements liability in the accompanying balance sheets. The expense related to stock option plan agreements mentioned above is refl ected in special compensation and stock option related expenses in the accompanying consolidated statements of operations. As of March 31, 2003 there are no future expense or cash commitments under these arrangements.
Option to purchase stock from the former principal stockholder
The Company had an option to purchase 4,564,061 shares of common stock from the former principal stockholder at $7.13 per share, pursuant to a stock option agreement dated May 1, 2001. This option was intended to provide shares to be issued upon the exercise of outstanding employee stock options so that the Company’s stockholders would not experience dilution because of the issuance of new shares upon such exercise. Upon completion of the IPO, the former principal stockholder terminated the option by issuing to the Company 2,851,337 shares, representing the excess of the fair value of the stock over the exercise price of the option. The Company then immediately cancelled these shares and they are no longer considered issued and outstanding.
Transactions under stock option plans
The following table summarizes the changes in common stock options for all of the common stock option plans described above.
Exercise prices for options outstanding at March 31, 2003, are as follows:
As of March 31, 2003, a total of 1,109,661 options were exercisable at weighted average exercise prices of $7.13 per share.
On May 31, 2001, certain employees of the Company exercised options to purchase 1,023,872 shares of Class B nonvoting common stock at a weighted average exercise price of $3.27 per share. The Company advanced funds to the employees equal to the aggregate exercise price of the options, in exchange for full recourse 6.5% promissory notes from the employees.
The Company has elected to account for stock and stock rights in accordance with APB No. 25. SFAS No. 123 established an alternative method of expense recognition for stock-based compensation awards to employees based on fair values. Pro forma information regarding net income is required by SFAS No. 123 and has been determined as if the Company had accounted for its employee stock options under the fair value method prescribed by SFAS No. 123. The fair values of options granted from the date of the Spin-Off, were estimated at the date of grant for each period using the Black-Scholes option pricing model with the following weighted average assumptions:
Year Ended March 31,2001 2002 2003
Risk free interest rate ............................................... 4.4% 5.2% 3.91%Dividend yield .......................................................... — — —Weighted average expected lives of options........... 6 years 6.5 years 7.5 yearsExpected volatility ................................................... 92% 94% 48%Weighted average fair values of options granted... $4.10 $10.72 $19.01
The Black-Scholes option valuation model was developed for use in estimating the fair value of traded options that have no vesting restrictions and are fully transferable. In addition, option valuation models require the input of highly subjective assumptions, including the expected stock price characteristics that are signifi cantly different from those of traded options. Because changes in the subjective input assumptions can materially affect the fair value estimate, in management’s opinion, the existing models do not necessarily provide a reliable single measure of the fair value of its stock rights.
Number of Options Exercise Price per ShareWeighted Average
Exercise PriceOutstanding at March 31, 2000 ............................ 8,559,772 $ 2.91–13.06 $ 7.21
Options granted ............................................... 3,991,114 7.13 7.13Options cancelled ............................................ (277,860) 7.13–11.88 9.99
Outstanding at March 31, 2001 ............................ 12,273,026 2.91–13.06 7.13Options granted ............................................... 1,647,016 7.13–19.00 14.11Options exercised............................................. (1,023,872) 2.91–7.13 3.27Options cancelled ............................................ (3,096,254) 7.13–19.00 8.06
Outstanding at March 31, 2002 ............................ 9,799,916 2.91–19.00 8.42Options granted ............................................... 638,416 29.28–36.12 30.44Options exercised............................................. (2,616,382) 5.94–19.00 8.20Options cancelled ............................................ (67,180) 7.13–29.77 14.65
Outstanding at March 31, 2003 ............................ 7,754,770 $ 2.91–36.12 $ 10.26
Range of Exercise Prices
NumberOutstanding
Weighted AverageExercise Price
Weighted AverageRemaining Contractual
Life-Years$ 2.91 462,460 $ 2.91 6.0
5.94–7.13 5,231,717 7.11 4.18.91–13.06 684,679 11.14 3.2
19.00–19.00 747,498 19.00 8.629.28–32.40 580,000 30.15 9.8
33.51–36.12 48,416 33.94 9.8$ 2.91–36.12 7,754,770 $ 10.26 5.1
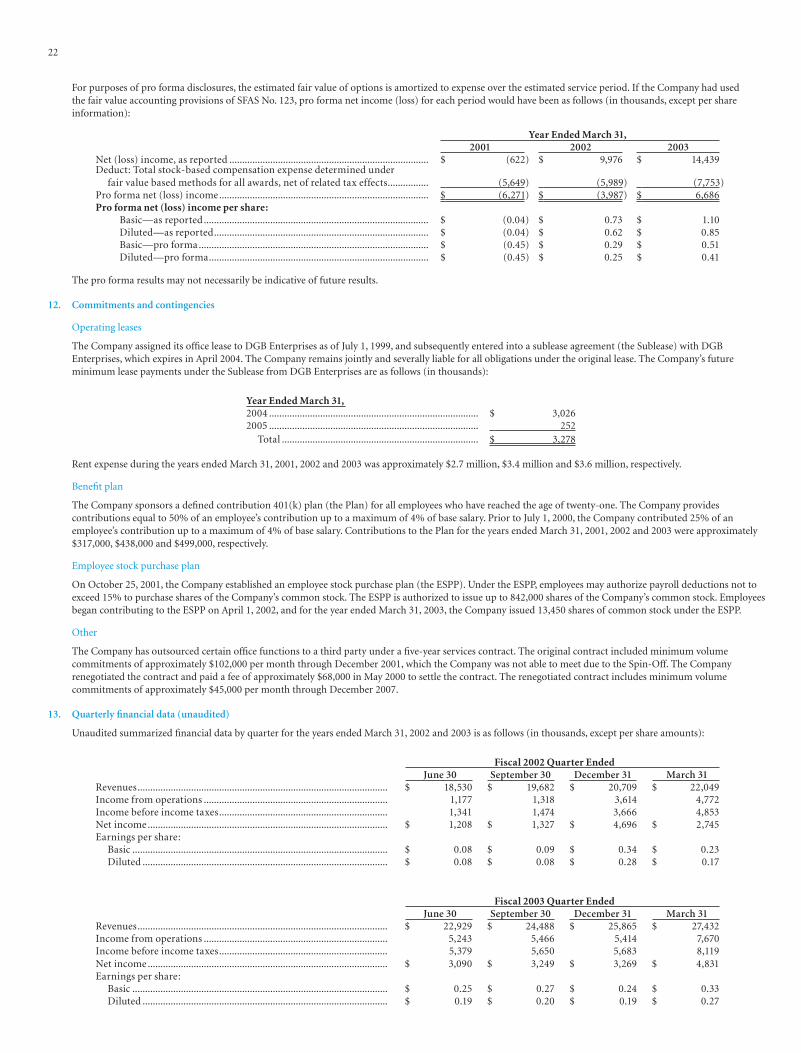
22
Year Ended March 31,2001 2002 2003
Net (loss) income, as reported .............................................................................. $ (622) $ 9,976 $ 14,439Deduct: Total stock-based compensation expense determined under
fair value based methods for all awards, net of related tax effects................ (5,649) (5,989) (7,753)Pro forma net (loss) income.................................................................................. $ (6,271) $ (3,987) $ 6,686Pro forma net (loss) income per share:
Basic—as reported........................................................................................ $ (0.04) $ 0.73 $ 1.10Diluted—as reported.................................................................................... $ (0.04) $ 0.62 $ 0.85Basic—pro forma.......................................................................................... $ (0.45) $ 0.29 $ 0.51Diluted—pro forma...................................................................................... $ (0.45) $ 0.25 $ 0.41
The pro forma results may not necessarily be indicative of future results.
12. Commitments and contingencies
Operating leases
The Company assigned its offi ce lease to DGB Enterprises as of July 1, 1999, and subsequently entered into a sublease agreement (the Sublease) with DGB Enterprises, which expires in April 2004. The Company remains jointly and severally liable for all obligations under the original lease. The Company’s future minimum lease payments under the Sublease from DGB Enterprises are as follows (in thousands):
Year Ended March 31, 2004 .................................................................................. $ 3,0262005 .................................................................................. 252
Total ............................................................................. $ 3,278
Rent expense during the years ended March 31, 2001, 2002 and 2003 was approximately $2.7 million, $3.4 million and $3.6 million, respectively.
Benefi t plan
The Company sponsors a defi ned contribution 401(k) plan (the Plan) for all employees who have reached the age of twenty-one. The Company provides contributions equal to 50% of an employee’s contribution up to a maximum of 4% of base salary. Prior to July 1, 2000, the Company contributed 25% of an employee’s contribution up to a maximum of 4% of base salary. Contributions to the Plan for the years ended March 31, 2001, 2002 and 2003 were approximately $317,000, $438,000 and $499,000, respectively.
Employee stock purchase plan
On October 25, 2001, the Company established an employee stock purchase plan (the ESPP). Under the ESPP, employees may authorize payroll deductions not to exceed 15% to purchase shares of the Company’s common stock. The ESPP is authorized to issue up to 842,000 shares of the Company’s common stock. Employees began contributing to the ESPP on April 1, 2002, and for the year ended March 31, 2003, the Company issued 13,450 shares of common stock under the ESPP.
Other
The Company has outsourced certain offi ce functions to a third party under a fi ve-year services contract. The original contract included minimum volume commitments of approximately $102,000 per month through December 2001, which the Company was not able to meet due to the Spin-Off. The Company renegotiated the contract and paid a fee of approximately $68,000 in May 2000 to settle the contract. The renegotiated contract includes minimum volume commitments of approximately $45,000 per month through December 2007.
13. Quarterly fi nancial data (unaudited)
Unaudited summarized fi nancial data by quarter for the years ended March 31, 2002 and 2003 is as follows (in thousands, except per share amounts):
Fiscal 2002 Quarter EndedJune 30 September 30 December 31 March 31
Revenues.................................................................................................. $ 18,530 $ 19,682 $ 20,709 $ 22,049Income from operations ........................................................................ 1,177 1,318 3,614 4,772Income before income taxes.................................................................. 1,341 1,474 3,666 4,853Net income.............................................................................................. $ 1,208 $ 1,327 $ 4,696 $ 2,745Earnings per share:
Basic .................................................................................................... $ 0.08 $ 0.09 $ 0.34 $ 0.23Diluted ................................................................................................ $ 0.08 $ 0.08 $ 0.28 $ 0.17
Fiscal 2003 Quarter EndedJune 30 September 30 December 31 March 31
Revenues.................................................................................................. $ 22,929 $ 24,488 $ 25,865 $ 27,432Income from operations ........................................................................ 5,243 5,466 5,414 7,670Income before income taxes.................................................................. 5,379 5,650 5,683 8,119Net income.............................................................................................. $ 3,090 $ 3,249 $ 3,269 $ 4,831Earnings per share:
Basic .................................................................................................... $ 0.25 $ 0.27 $ 0.24 $ 0.33Diluted ................................................................................................ $ 0.19 $ 0.20 $ 0.19 $ 0.27
For purposes of pro forma disclosures, the estimated fair value of options is amortized to expense over the estimated service period. If the Company had used the fair value accounting provisions of SFAS No. 123, pro forma net income (loss) for each period would have been as follows (in thousands, except per share information):
23
Change in Independent Auditor
On June 7, 2002, upon the recommendation of our Audit Committee, we dismissed Arthur Andersen LLP as our independent auditors and appointed Ernst & Young LLP to serve as our independent auditors for fi scal 2003. On June 17, 2002, our Audit Committee authorized Ernst & Young LLP to re-audit the consolidated fi nancial statements and schedule as of and for the year ended March 31, 2002. We fi led a current report on Form 8-K with the SEC on June 14, 2002, which included a notifi cation that the change was effective on June 7, 2002.
Arthur Andersen LLP’s reports on the consolidated fi nancial statements for each of the two fi scal years ending March 31, 2002 and 2001 did not contain an adverse opinion or disclaimer of opinion, nor were such reports qualifi ed or modifi ed as to uncertainty, audit scope or accounting principles.
During each of our two fi scal years ending March 31, 2002 and 2001, there were:
• no disagreements with Arthur Andersen LLP on any matter of accounting principle or practice, fi nancial statement disclosure or auditing scope or procedure which, if not resolved to Arthur Andersen LLP’s satisfaction, would have caused them to make reference to the subject matter in connection with their report on the consolidated fi nancial statements for such years; and
• there were no reportable events as defi ned in Item 304(a)(1)(v) of Regulation S-K.
During each of our two fi scal years ending March 31, 2001 and 2002, and through June 7, 2002, we did not consult Ernst & Young LLP with respect to the application of accounting principles to a specifi ed transaction, either completed or proposed, or the type of audit opinion that might be rendered on its fi nancial statements, or any other matters or reportable events as set forth in Items 304(a)(2)(i) and (ii) of Regulation S-K. By letter dated June 7, 2002, Arthur Andersen LLP stated that it agrees with the foregoing statement.
Executive Offi cers and Directors
Jeffrey D. Zients LeAnne M. Zumwalt*‡Chairman of the Board Director
Frank J. Williams Scott M. FassbachChief Executive Offi cer and Director Chief Research Offi cer
Marc N. Casper*†‡ David L. FelsenthalDirector Chief Financial Offi cer, Secretary, and Treasurer
Michael A. D’Amato Scott A. SchirmeierDirector General Manager, Sales and Marketing
Kelt Kindick*†‡ Richard A. SchwartzDirector General Manager, Research
Joseph E. Laird, Jr.†‡Director
* Member of the Audit Committee of the Board of Directors† Member of the Compensation Committee of the Board of Directors‡ Member of the Governance Committee of the Board of Directors
Corporate Information
Form 10-K/Investor ContactA copy of the Company’s Annual Report on Form 10-K for the fi scal year ending March 31, 2003 (without exhibits) is available from the Company at no charge. Requests for the Annual Report on Form 10-K and other investor contacts should be directed to David L. Felsenthal, Chief Financial Offi cer, Secretary and Treasurer, at the Company’s corporate offi ce.
Common Stock Dividend InformationThe common stock of The Advisory Board Company has been traded on the Nasdaq National Market under the symbol ABCO since the initial public offering on November 12, 2001. As of December 2003, there were approximately 7,600 holders of the common stock, including eight stockholders of record. The Company has not declared or paid any cash dividend on the common stock since the closing of its initial public offering, and it does not anticipate declaring or paying cash dividends in the foreseeable future. The timing and amount of future cash dividends, if any, would be determined by the Company’s Board of Directors and would depend upon the Company’s earnings, fi nancial condition, and cash requirements.
Corporate Offi ce Registrar and Transfer Agent Independent Public AccountantsThe Advisory Board Company Wachovia Bank, N.A. Ernst & Young LLPThe Watergate Equity Services Group 621 East Pratt Street600 New Hampshire Avenue, NW 1525 West WT Harris Boulevard, 3C3 Baltimore, MD 21202Washington, DC 20037 Charlotte, NC 28262202-266-5600 800-829-8432www.advisoryboardcompany.com
The following table sets forth, for the periods indicated, the high and low closing prices per share of our common stock as reported on the Nasdaq Stock Market.
High Low
Fiscal year ending March 31, 2002
Third Quarter.......................................................................... $28.91 $22.55Fourth Quarter ....................................................................... $35.80 $26.00
Fiscal year ending March 31, 2003
First Quarter............................................................................ $43.34 $31.76Second Quarter ...................................................................... $37.46 $26.37Third Quarter.......................................................................... $35.04 $25.31Fourth Quarter ....................................................................... $35.02 $28.85

the a dv isory boa r d compa n yThe Watergate � 600 New Hampshire Avenue, NW � Washington, DC 20037
Telephone: 202-266-5600 � Facsimile: 202-266-5700 � www.advisoryboardcompany.com