future of orthopedics - the advisory board company
TRANSCRIPT

Service Line Innovation Brief Fall 2003
Health Care Advisory Boardwashington, d.c.
Innovations Center
Strategic Forecast for a Service Line Under Siege
Future of Orthopedics
Executive Summary

� Profi ts Under Siege
� Vision of the Future
� The New Management Ambition
Innovations Center
Strategic Forecast for a Service Line Under Siege
Future of Orthopedics
Service Line Innovation Brief Executive Summary
© 2004 The Advisory Board Company

ii
© 2004 The Advisory Board Company
T h e I n n o v a t i o n s C e n t e r
Strategic Forecasting for Leading Hospitals and Health Systems
S i x S e r v i c e s f o r A d v i s o r y B o a r d M e m b e r s
Annual Future Care Briefing
Presentation and facilitated discussion for boards and senior executives on emerging trends of greatest immediate concern to hospitals and health systems.
Service Line Innovation Briefs
Series of fast-paced briefs—each focusing on a specifi c service line—highlighting emerging clinical technologies and their impact, payment, and demand projections, as well as the fi nancial outlook for the service line.
Health System Future Facility Reports
Series of reports—each focusing on a particular facility innovation or technology—highlighting the likely investment required, expected payback, implementation hurdles, and likely ROI.
Annual Health Care Innovation Summit
Two-day sessions in which Innovations Center staff present the highlights of that year’s research, focusing on emerging clinical innovations and market trends of greatest immediate concern to members.
The Center Quarterly
Quarterly briefi ng across key issue areas—health plan reform, the new consumerism, Medicare and Medicaid, physician relations, technology watch—highlighting top-line insights of immediate relevance to hospitals and health systems.
Service Line Opportunity Assessments
Tools and templates for customizing national patient demand and fi nancial projections to individual member market circumstances, including tools for assessing the business case for future investment.

iii
© 2004 The Advisory Board Company
F o r e c a s t i n g t h e F u t u r e f o r O r t h o p e d i c s
The Orthopedics Initiative in BriefTwelve months ago, the Innovations Center set out to assess the future prospects for the most important hospital service lines. The fortunes of orthopedics, among our fi rst areas of inquiry, proved to be a timely topic. Today, orthopedics is a service line under siege, its economics threatened by rising implant costs and unresponsive reimbursement. Looking forward, hospitals have areas of rich opportunity in orthopedics, but also continuing (and new) vulnerabilities. Accordingly, the strategic forecasting initiative for orthopedics maps out principal regions of future growth within the service line, as well as less favored offerings. Further, the initiative identifi es the most leveraged areas for management focus, serving as a roadmap for future orthopedics strategy and investment.
For Further Information
Members with any questions related to this study, upcoming publications, or other issues are encouraged to contact Kyle Rose at 202-266-5306 or [email protected].
Executive briefi ng of critical fi ndings from orthopedic service line initiative. Includes forecasts of future profi ts, volumes, and resource requirements for orthopedics as a whole, as well as for key offerings—spine surgery, joint replacement, and so on. Assesses orthopedics in context of larger service line portfolio. Identifi es leveraged opportunities for management efforts and selective investment.
Future of Orthopedics
Executive Summary
Future of Orthopedics
Service Line Innovation Brief
Fall 2003
Today’s Report
Future of Orthopedics
Service Line Opportunity Assessment
Fall 2003
200-page report assesses future prospects for orthopedic service line. Includes the material contained in the Executive Summary; in addition, features detailed examination of drivers of change for orthopedic services. Special sections focusing on investment considerations for spine surgery, joint replacement, sports medicine, and fracture care. Also includes in-depth assessments of several dozen potentially disruptive technologies.
Interactive spreadsheets for customizing orthopedics volume, profi tability, and bed demand projections to individual member circumstances.
iv
© 2004 The Advisory Board Company
Creative ServicesElliott Antal • Angelika Barbato • Margaret Blair • Katie Carrier • Allen Cobb • Kennon Crymble • Garth Fry • Angel Gac •
J. Wallace Garner • Amy Kim • Tish King • Kori Lusignan • Bob Reynolds • Amy Sebra • Hillary Tisdale • Lauren Walsh
Legal CaveatThe Advisory Board Company has worked to ensure the accuracy of the information it provides to members. This report relies on data obtained from many sources, however, and The Advisory Board Company cannot guarantee the accuracy of the information provided or any analysis based thereon, in all cases. Further, neither The Advisory Board Company nor any of its programs are in the business of giving legal, clinical, accounting, or other professional advice, and its reports should not be construed as professional advice on any particular set of facts or circumstances. In particular, members should not rely on any legal commentary in this report as a basis for action, or assume that any tactics described herein would be permitted by applicable law. Members are advised to consult with their medical staff with respect to matters that involve clinical practice and patient treatment, and with other appropriate professionals concerning legal, tax, or accounting issues, before implementing any of these tactics. Neither The Advisory Board Company nor any of its programs shall be liable for any claims or losses that may arise from (a) any errors or omissions in their work product, whether caused by The Advisory Board Company or any of its programs or sources, or (b) reliance on any graded ranking or recommendation by The Advisory Board Company.
Note to MembersThis document has been prepared by the Health Care Advisory Board for the exclusive use of its members. It contains valuable proprietary information belonging to The Advisory Board Company, and each member should make it available only to those employees and agents who require such access in order to learn from the profi les described herein, and who undertake not to disclose it to third parties. In the event that you are unwilling to assume this confi dentiality obligation, please return this document and all copies in your possession promptly to The Advisory Board Company.
Note on Data UseWhile the data and analyses presented in this publication were obtained from a variety of sources, some data for use in this publication were supplied by Solucient, LLC, Evanston, Illinois. Any analysis, interpretation, or conclusions based on these data is solely that of the authors, and Solucient disclaims responsibility for any such analysis, interpretation, or conclusions.
Innovations Center Staff
Project AuthorsMichael Koppenheffer, M.B.A.
Kyle M. Rose
Contributing ConsultantsKen Sypal
Satish Cheema
Lead DesignerDavid Seitzinger
Managing DirectorAndré Cheng, M.D., Ph.D.

v
© 2004 The Advisory Board Company
Order Form
Fax to: Delivery Services
202-266-6550
Name & Title ________________________________________________________________
Institution ________________________________________________________________
Address ________________________________________________________________
________________________________________________________________
________________________________________________________________
Telephone _____________________ E-mail __________________________________
Number of Copies Requested
Future of OrthopedicsExecutive Summary __________
Health Care Advisory Board
Unlimited Copies
This publication is available to members in unlimited quantity without charge. To obtain additional copies of any of our studies, please call 202-266-5920 and ask to speak with a delivery services associate, or fax in the order form below. Studies may also be ordered via our website at http://advisory.com.
HCB-100-118

vi
© 2004 The Advisory Board Company

vii
© 2004 The Advisory Board Company
A d v i s o r s t o O u r Wo r k
Across the last twelve months, we have been indebted to a group of leaders in orthopedic surgery, as well as a handful of hospital and health system executives, industry executives, and government offi cials, who have given generously of their time to guide and inform our Innovations Center efforts. Many of these individuals have participated under the auspices of the American Orthopaedic Association, which has lent its support to our work as well. Whatever immediate value members fi nd in this series of publications, they owe in no small measure to these contributors. Apart from those people and institutions who prefer to remain anonymous, the advisors to this project are listed below.
Physicians
Joseph Buckwalter, M.D.
Chairman, Orthopedics
University of Iowa Medical School
Kenneth E. DeHaven, M.D.
Director, Athletic Medicine
University of Rochester Medical School
Mary Jensen, M.D.
Director, Interventional Neuroradiology
University of Virginia Health System
William N. Levine, M.D.
Chief, Sports Medicine
New York Presbyterian Hospital
David Lewallen, M.D.
Department of Orthopedics
Mayo Clinic (Rochester)
Isador Lieberman, M.D.
Chairman, Spine Center
Cleveland Clinic
Bernard Morrey, M.D.
Chairman, Orthopedics
Mayo Clinic (Rochester)
Regis O’Keefe, M.D., Ph.D.
Department of Orthopedics
University of Rochester Medical School
Randy Rosier, M.D., Ph.D.
Chairman, Orthopedics
University of Rochester Medical School
James Sferra, M.D.
Head of Foot and Ankle Section
Cleveland Clinic
Dan Spengler, M.D.
Chairman, Orthopedics
Vanderbilt University Medical Center
Marc Swiontkowski, M.D.
Chairman, Orthopedics
University of Minnesota School of Medicine
Russell Windsor, M.D.
Co-Chief, Knee Center
Hospital for Special Surgery
Hospital Executives and Administrators
Michael Austrin
Director, Business Development
BJC Healthcare
Kathy Clark
Product Line Director, Orthopedics
St. Vincent Hospital
Mary-Fran Delaune
Director, Rehabilitation Services
Anne Arundel Medical Center
Mary Elington
Corporate Director, Orthopedics
Sharp Healthcare
Warren Green
CEO
LifeBridge Health
Ed Goldberg
President and CEO
Alexian Brothers Hospital Network
Karim Habibi
Director, Managed Care
Hospital for Joint Diseases
Leanne Hammer
Chief Administrator, Orthopedics
Abbott Northwestern Hospital
Michael Lachina, M.D.
Senior Vice President, Medical Affairs
First Health Moore
Doug Silverstein
President
Glenbrook Hospital
Greg Spurlock
President
BONES (Society of Orthopedic
Administrators)
Pam Troup
Executive Director, Orthopedics
St. Anthony Hospital
Industry and Government
Chris Erekson
Director, Corporate Sales
Biomet Orthopedics
Ann Fagan
Division of Acute Care
Center for Medicare and Medicaid
Services
Tom Keegan
Director, Marketing
Endius, Inc.
Stan Mendenhall
Editor
Orthopedic Network News
Robb Peterson
Director, Reimbursement
Medtronic Sofamor Danek
Cindy Read
Outpatient Rule Division
Center for Medicare and Medicaid
Services
Mitch Sugarman
Director, Reimbursement
Medtronic
Peter Weissman
Product Manager, Spine
Oratec (Smith & Nephew)

viii
© 2004 The Advisory Board Company
I n n o v a t i o n s C e n t e r M e t h o d o l o g y i n B r i e f
The Foundation of Our ModelIn developing quantitative forecasts of future orthopedic demand and profi tability, the Innovations Center obtained and analyzed data from a variety of sources in both the private and public sectors. These databases of health care utilization, costs, and revenues served as the foundation of our forecasting model. After integrating and reconciling the different sources, the Center developed a comprehensive national picture of current utilization and fi nances as well as the prevailing trends across the last 25 years. From there, volume, length of stay, and profi tability forecasts were constructed, infl ecting each of 46 orthopedics DRGs and upward of 1,500 diagnosis and procedure codes by demographic changes, utilization shifts, emerging technological innovations, and health care market dynamics. Innovations Center forecasts represent national, all-payer statistics for short-term, general acute care hospitals unless otherwise stated.
Innovations Center Futures Database Sources
� Agency for Healthcare Research and Quality Health Care Utilization Project Hospital inpatient and outpatient utilization
� Centers for Disease Control and Prevention National Hospital Discharge Survey Hospital inpatient utilization
� Center for Medicare and Medicaid Services MEDPAR Database Hospital inpatient utilization and fi nances
� U.S. Census Bureau International Data Base Population estimates and projections
� Center for Medicare and Medicaid Services HOPPS Database Hospital outpatient utilization and fi nances
� Solucient LLC All-Payer Inpatient MPIDB Hospital inpatient utilization and fi nances
� Center for Medicare and Medicaid Services Standard Analytic Files (5%) Hospital inpatient and outpatient, freestanding, and
physician offi ce utilization and fi nances
� Solucient LLC OutpatientView™ Hospital, freestanding, and physician offi ce
outpatient utilization
Predicting Change in Four Layers
Establishing a Baseline Projection by Applying Demographic Trends
Modifying the Baseline to Refl ect Shifts in Utilization
Incorporating Technology’s Impact
Adding in Payment and Cost
The Innovations Center projected baseline volumes at the DRG and procedure level by assimilating multiple sources of utilization data, establishing utilization by age cohort, then “aging” and “growing” the population using Census forecasts.
Next, the Center selectively adjusted its baseline projection to refl ect shifts in per capita utilization, assuming that market forces currently working to increase (or decrease) utilization rates will often continue to affect utilization in the future.
The Center further infl ected future utilization rates—procedure by procedure and diagnosis by diagnosis—to account for the expected impact of new clinical technologies and changes in care delivery; these procedure and diagnosis-level projections were then rolled up to determine aggregate volume projections.
Anticipated changes in reimbursement (fee schedule updates, procedures moving from passthrough payment to established APC) were evaluated relative to recent reimbursement trends and projected cost increases, then run against volume predictions to establish revenue and profi t forecasts.
2003 2008 2013
Revenues Costs Profi tsOrthopedics Volumes
2003 20132008 2003 20132008 2003 20132008
Orthopedics VolumesOrthopedics Volumes
Population Growth and Aging
Utilization Changes
Technological Innovations

ix
© 2004 The Advisory Board Company
Strategy and Operations Implications
Impact Across the Service Line
Drivers of Change
Future Volumes
Implant Technologies
Growth Factors
Minimally Invasive Techniques
Outpatient Migration
Non-Hospital Competition
Medicare Reimbursement
Commercial Reimbursement
Length of Stay Declines
Demographics
Lifestyle Factors
Penetration of Existing Technologies
Medical Prevention
Biological Treatments
New Procedures
Profi tabilityPaymentLength of Stay
Capital Requirements
Physician Requirements
Clinical Staffi ng
F o r e c a s t i n g t h e F u t u r e o f O r t h o p e d i c s
Spine SurgerySports Medicine
Joint ReplacementFracture Surgeries
Medical OrthopedicsHand Surgery
Foot and Ankle
x
© 2004 The Advisory Board Company
Profits Under Siege
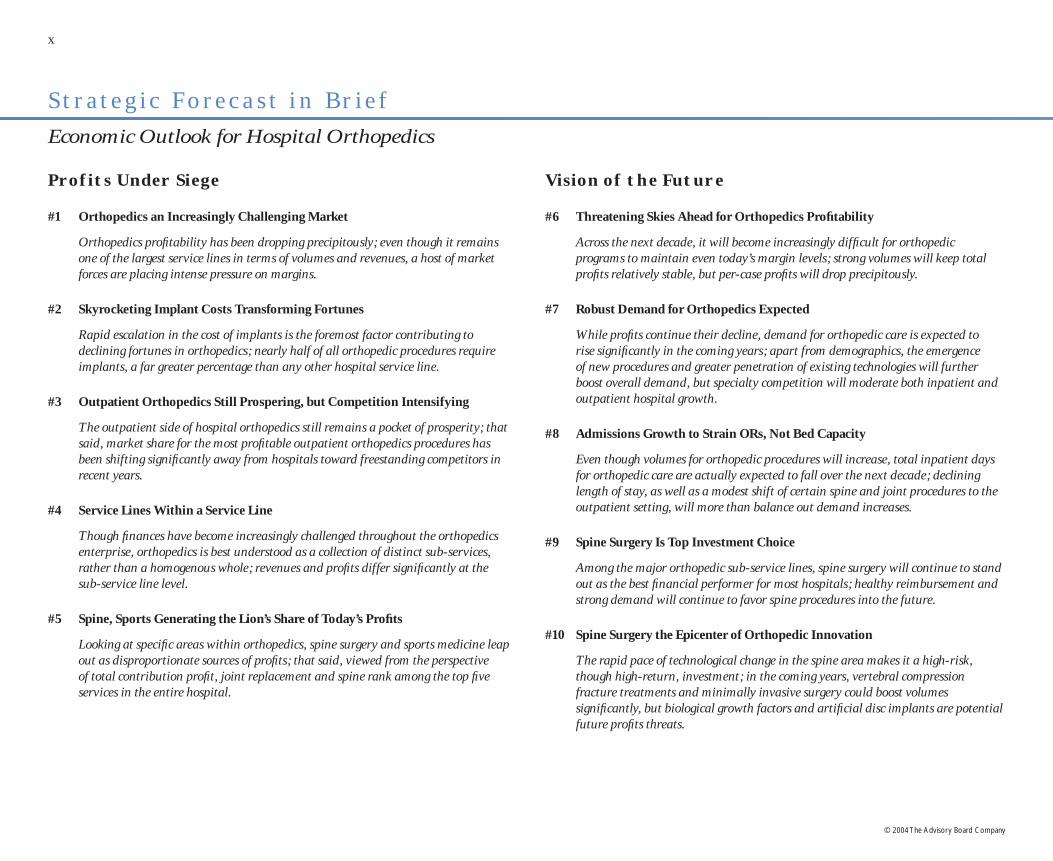
#1 Orthopedics an Increasingly Challenging Market
Orthopedics profi tability has been dropping precipitously; even though it remains one of the largest service lines in terms of volumes and revenues, a host of market forces are placing intense pressure on margins.
#2 Skyrocketing Implant Costs Transforming Fortunes
Rapid escalation in the cost of implants is the foremost factor contributing to declining fortunes in orthopedics; nearly half of all orthopedic procedures require implants, a far greater percentage than any other hospital service line.
#3 Outpatient Orthopedics Still Prospering, but Competition Intensifying
The outpatient side of hospital orthopedics still remains a pocket of prosperity; that said, market share for the most profi table outpatient orthopedics procedures has been shifting signifi cantly away from hospitals toward freestanding competitors in recent years.
#4 Service Lines Within a Service Line
Though fi nances have become increasingly challenged throughout the orthopedics enterprise, orthopedics is best understood as a collection of distinct sub-services, rather than a homogenous whole; revenues and profi ts differ signifi cantly at the sub-service line level.
#5 Spine, Sports Generating the Lion’s Share of Today’s Profi ts
Looking at specifi c areas within orthopedics, spine surgery and sports medicine leap out as disproportionate sources of profi ts; that said, viewed from the perspective of total contribution profi t, joint replacement and spine rank among the top fi ve services in the entire hospital.
S t r a t e g i c F o r e c a s t i n B r i e f
Economic Outlook for Hospital Orthopedics
Vision of the Future
#6 Threatening Skies Ahead for Orthopedics Profi tability
Across the next decade, it will become increasingly diffi cult for orthopedic programs to maintain even today’s margin levels; strong volumes will keep total profi ts relatively stable, but per-case profi ts will drop precipitously.
#7 Robust Demand for Orthopedics Expected
While profi ts continue their decline, demand for orthopedic care is expected to rise signifi cantly in the coming years; apart from demographics, the emergence of new procedures and greater penetration of existing technologies will further boost overall demand, but specialty competition will moderate both inpatient and outpatient hospital growth.
#8 Admissions Growth to Strain ORs, Not Bed Capacity
Even though volumes for orthopedic procedures will increase, total inpatient days for orthopedic care are actually expected to fall over the next decade; declining length of stay, as well as a modest shift of certain spine and joint procedures to the outpatient setting, will more than balance out demand increases.
#9 Spine Surgery Is Top Investment Choice
Among the major orthopedic sub-service lines, spine surgery will continue to stand out as the best fi nancial performer for most hospitals; healthy reimbursement and strong demand will continue to favor spine procedures into the future.
#10 Spine Surgery the Epicenter of Orthopedic Innovation
The rapid pace of technological change in the spine area makes it a high-risk, though high-return, investment; in the coming years, vertebral compression fracture treatments and minimally invasive surgery could boost volumes signifi cantly, but biological growth factors and artifi cial disc implants are potential future profi ts threats.

xi
© 2004 The Advisory Board Company
#11 Sports Medicine a Winner in the Near Term
Sports medicine is also an appealing area for investment; Baby Boomer consumerism and advances in arthroscopic treatment of joint conditions are boosting demand, although competition for volumes from freestanding competitors is intensifying.
#12 Joints Still Volume Mainstay, but Margin Pressures Increasing
The picture for joint replacement surgery is more mixed yet; demand will grow signifi cantly over the next decade, but further increases in implant costs will continue to place downward pressure on margins.
#13 Joint Replacement Moving Toward a Younger Population
One bright spot for joints is that growth has been disproportionately in the younger, commercial-pay population; more durable implants and less invasive procedures will continue to drive growth in the younger age groups, but most joint replacements will still be performed in Medicare patients at the end of the decade.
#14 Fracture Care—Mission, Not Margins
Fracture care, never a strong fi nancial contributor relative to other areas of orthopedics, will become even less profi table in the coming years as the cost of implants increases; moreover, effective osteoporosis prevention is expected to decrease demand for fracture care across the next decade.
#15 Two Eras in Orthopedics—Timeline of (Potentially) Disruptive Technologies
Today’s state-of-the-art orthopedics care mainly consists of mechanical interventions for musculoskeletal conditions; biological solutions now in development could upend the economics and delivery of orthopedic care, but are unlikely to progress much beyond the concept stage in the next ten years.
The New Management Ambition
#16 Forecasts Not (Necessarily) Destiny
Although every hospital will face daunting pressures to orthopedics profi tability moving forward, most institutions have the potential to restore the service line to its position as a leading margin contributor; key levers of profi tability include controlling implant costs, optimizing reimbursement, improving product mix, and containing specialty competition.
#17 Ambition #1—Controlling Implant Costs
Hospitals can signifi cantly reduce implant costs through hard-line negotiating for best prices; achieving consensus among surgeons on appropriate use of the most expensive implant models is also critical for controlling spending.
#18 Ambition #2—Optimizing Reimbursement
Institutions can make substantial gains in orthopedic margin by improving reimbursement on the commercial side; the top priority for most hospitals should be negotiating carve -out agreements for implant expenses with insurers.
#19 Ambition #3—Improving Product (and Payer) Mix
Given the striking differences in profi tability among the services within orthopedics, hospitals should proactively invest in the procedures (and payers) generating the highest return; avenues for shifting mix include hiring subspecialist orthopedic surgeons, marketing to selected patients through “Center of Excellence”-type branding, and targeting profi table payers or employer groups for outreach efforts.
#20 Ambition #4—Containing Specialty Competition
While an all-or-nothing phenomenon dependent on local market circumstances, specialty competition represents the single greatest threat to hospital orthopedic volumes and profi tability; defending against surgical hospital cherry-picking and addressing ambulatory surgery center threats are equally important.

xii
© 2004 The Advisory Board Company

1
© 2004 The Advisory Board Company
Future of Orthopedics
Profits Under Siege

2 Future of Orthopedics
© 2004 The Advisory Board Company
A Service Line Under SiegeThe past several years have been diffi cult for orthopedic fi nances. Nationally, profi tability has been slipping precipitously. Medicare net margins are now barely in the black, falling from a healthy nine percent in 1997 to scarcely one percent in 2001. No institution is immune; hospitals of every size and status across the nation have been experiencing sudden fi nancial fl ashpoints in orthopedics. Orthopedics profi ts are genuinely under siege.
Dropping in the RankingsOnce a core contributor to hospital profi tability, orthopedics is no longer one of the top profi t-generating inpatient service lines (at least on a fully allocated basis). Many hospital executives still perceive orthopedics as one of the principal profi t drivers of the institution, next to cardiovascular services and general surgery, but as of 2001 orthopedics barely made the roster of the top ten most-profi table service lines.
O r t h o p e d i c s a n I n c r e a s i n g l y C h a l l e n g i n g M a r k e t
Orthopedics Inpatient ProfitNational Medicare
1997 1999 2001
Top Service Lines
Net Margin 9% 1%
Percentage of Total Inpatient Profi ts
Neurosurgery
Urology
Thoracic Surgery
General Medicine
Oncology
Vascular Surgery
Pulmonology
Orthopedics
Cardiac
General Surgery
3%
3%
3%
3%
11%
11%
12%
25%
28%
37%
Orthopedics
Neurosurgery
Urology
General Medicine
Thoracic Surgery
Oncology
Pulmonology
Vascular Surgery
General Surgery
Cardiac
2%
3%
3%
3%
4%
4%
8%
9%
38%
41%
1997 20 01$752 M
$96 M
$226 M
3%
Source: Innovations Center Futures Database. Source: Innovations Center Futures Database.

Profi ts Under Siege 3
© 2004 The Advisory Board Company
Rising in the Rankings
Assailed from Many QuartersMultiple factors have contributed to the recent diffi culties for hospital orthopedics. Growth in implant costs has been the most powerful driver of orthopedics fortunes, but the service line has also been struggling under the burden of specialty competition, new capital demands, and lackluster reimbursement.
Forces at Play in Orthopedics
Unfavorable Reimbursement
Trend
Payers Slow to Cover New Technologies
Increasing Utilization of
Premium Implants
Rising Implant Prices
Expensive Biological
Innovations
NewCapital
Demands
ASC Competition
Proliferating Surgical
Hospitals
Yet Too Important to IgnoreEven as its profi ts plummet, the orthopedic service line remains a major source of business for the hospital. With respect to both volumes and revenues, orthopedics is still the third largest service line for general acute-care hospitals. Because of its sheer size, as well as its past history of profi tability, orthopedics is worthy of concerted management attention.
I npat ient Ser v ice L ines , 20 01
Volumes Revenues
1. Cardiac 1. Cardiac
2. Obstetrics 2. General Surgery
3. Orthopedics 3. Orthopedics
4. Pulmonology 4. Pulmonology
5. General Surgery 5. Obstetrics
Source: Innovations Center Futures Database.

4 Future of Orthopedics
© 2004 The Advisory Board Company
Hip and Knee Implant Acquisition Cost
S k y r o c k e t i n g I m p l a n t C o s t s Tr a n s f o r m i n g F o r t u n e s
Implant Burden Growing UncheckedThe declining fortunes of the orthopedic service line over the past several years can be largely attributed to a single phenomenon—soaring implant costs. After gaining control over implant expenses in the early 1990s, hospitals are fi nding the costs of orthopedic implants again in the ascendancy. Seemingly powerless to control spending with savvy purchasing practices or stringent utilization controls, hospitals around the country have seen implant costs rise at double-digit rates for several years running.
Reimbursement Not Keeping PaceThe growth in implant spending would be immaterial if payers were absorbing the increased cost. However, while implant expenses have soared, reimbursement for the majority of orthopedics procedures has remained fl at or even declined. Joint replacement is a prime example—even as the cost of hip and knee implants rose at an unprecedented rate, Medicare payments fell four of fi ve years.
JJ
J
J
JJ J
J
J
J
J
1992 1993 1994 1995 1996 1997 1998 1999 2000 2001 2002$0
$2,000
$4,000
Reimbursement and Implant Cost ChangesJoint Replacement
1998 1999 2000 2001 2002
1%
(3%)
8%
(2%)
18%
(2%)
14%
1%
9%
(2%)
12.1% CAGR since 1998
Implant Costs
Medicare Reimbursement
Source: Orthopedic Network News, Ann Arbor, Mich; Innovations Center analysis. Source: Orthopedic Network News, Ann Arbor, Mich; Innovations Center analysis.

Profi ts Under Siege 5
© 2004 The Advisory Board Company
Joint Replacement Spine Fracture Care
Total hip implant $2,000–$10,000
Fusion cage $4,800–$11,800
Plate$80–$600
Partial hip implant $750–$2,600
Rod and screw system$2,900–$9,000
Screw$500–$1,000
Total knee implant $3,200–$8,400
Plate$1,300–$1,900
Intramedullary nail$165–$2,500
Unicompartmental knee $2,500–$5,000
Electrical stimulators$4,100–$4,700
External fi xation$1,000–$6,900
A Particular Issue for OrthopedicsThe fi nancial burden of rising implant costs is not unique to orthopedics. The cardiac service line is currently experiencing a similar phenomenon with stents, pacemakers, and defi brillators, while emerging technologies in the neurosciences suggests that implants will become an important issue in neurosurgery economics as well. However, orthopedics is especially at risk for implant cost growth, with a much higher proportion of procedures incorporating implants compared to other service lines.
In addition, implants are an issue throughout orthopedics, not just in one procedure or area. Joint replacement, spine surgery, and fracture care all require increasingly expensive implants.
Common Orthopedic Implants2003 Cost Ranges
Percentage of Surgeries Requiring Implants2000
Orthopedics Cardiac Neurosciences OtherSurgeries
45%
22%
4% 3%
Source: Orthopedic Network News, Ann Arbor, Mich; Innovations Center analysis.Source: Innovations Center analysis.
6 Future of Orthopedics
© 2004 The Advisory Board Company
Urology
ENT
Gynecology
Musculoskeletal
Ophthalmology
Digestive
Cardiovascular $2.67 B
$2.59 B
$1.26 B
$1.13 B
$709 M
$377 M
$319 M
O u t p a t i e n t O r t h o p e d i c s S t i l l P r o s p e r i n g , b u t C o m p e t i t i o n I n t e n s i f y i n g
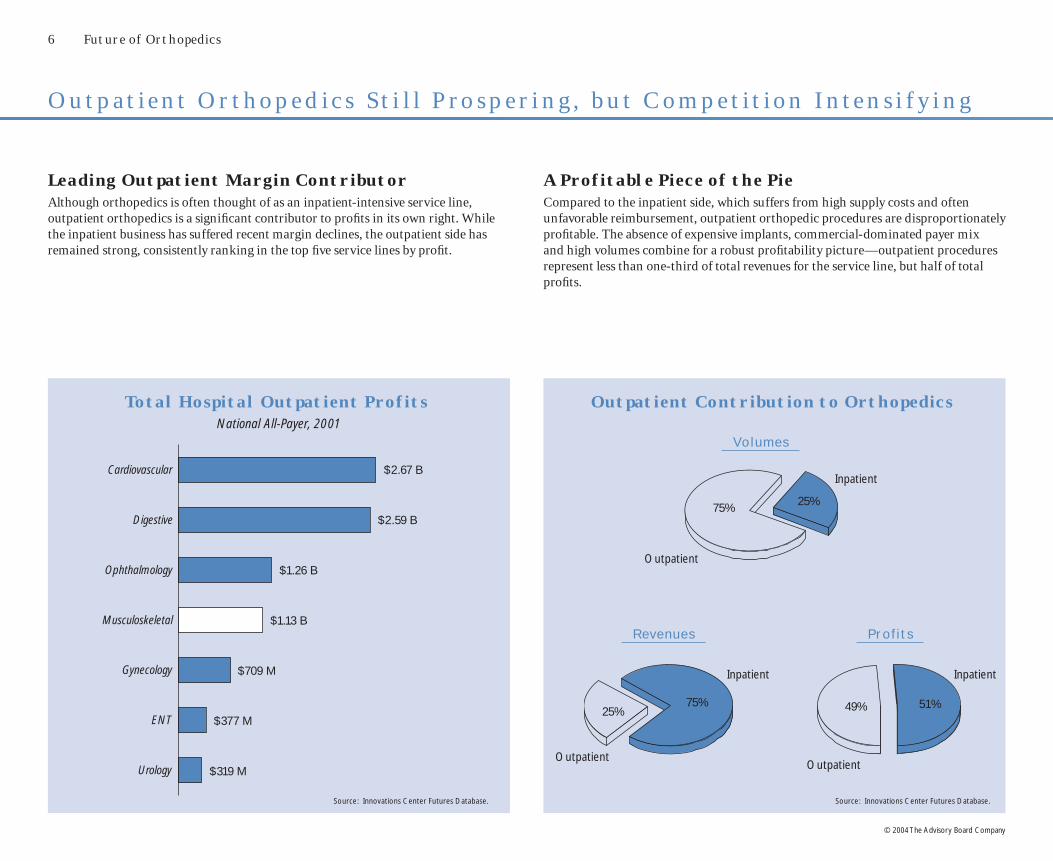
Leading Outpatient Margin ContributorAlthough orthopedics is often thought of as an inpatient-intensive service line, outpatient orthopedics is a signifi cant contributor to profi ts in its own right. While the inpatient business has suffered recent margin declines, the outpatient side has remained strong, consistently ranking in the top fi ve service lines by profi t.
Total Hospital Outpatient ProfitsNational All-Payer, 2001
A Profitable Piece of the PieCompared to the inpatient side, which suffers from high supply costs and often unfavorable reimbursement, outpatient orthopedic procedures are disproportionately profi table. The absence of expensive implants, commercial-dominated payer mix and high volumes combine for a robust profi tability picture—outpatient procedures represent less than one-third of total revenues for the service line, but half of total profi ts.
25%75% 49% 51%
Outpatient Contribution to Orthopedics
Revenues Prof i t s
Inpatient
Outpatient
Volumes
25%75%
OutpatientOutpatient
Inpatient
Inpatient
Source: Innovations Center Futures Database. Source: Innovations Center Futures Database.

Profi ts Under Siege 7
© 2004 The Advisory Board Company
Ancillaries Yielding Even MoreOrthopedic patients also contribute to several of the hospital’s other key outpatient services, including radiology, laboratory, and pharmacy. This makes the ancillary and downstream profi ts of orthopedic patients a critical part of the service line’s overall contribution. Imaging alone—plain fi lm and MRI—contributes almost half of the profi ts governed by outpatient orthopedics, more than the primary procedure itself.
Beginning to Slip AwayDespite the signifi cant contribution of outpatient orthopedics, the hospital share of the market is eroding as ambulatory surgery centers (ASCs) continue to garner a larger share of the business. Nationally, ASC surgery volumes grew 45 percent from 1999 to 2001, compared with seven percent for hospital outpatient volumes; in selected markets the contrast is even starker.
Total Outpatient Orthopedics Profits2001
Orthopedics Surgery Volume GrowthNational, 1999–2001
ASCs Hospital
45%
7%
46%
2%
9%6%
30%
7%Imaging$1.39 B
Offi ce Visits$59 M
EmergencyDepartment
$254 M
Pharmacy$170 M
Procedures$884 M
Laboratory$219 M
Source: Innovations Center Futures Database. Source: Innovations Center Futures Database.
8 Future of Orthopedics
© 2004 The Advisory Board Company
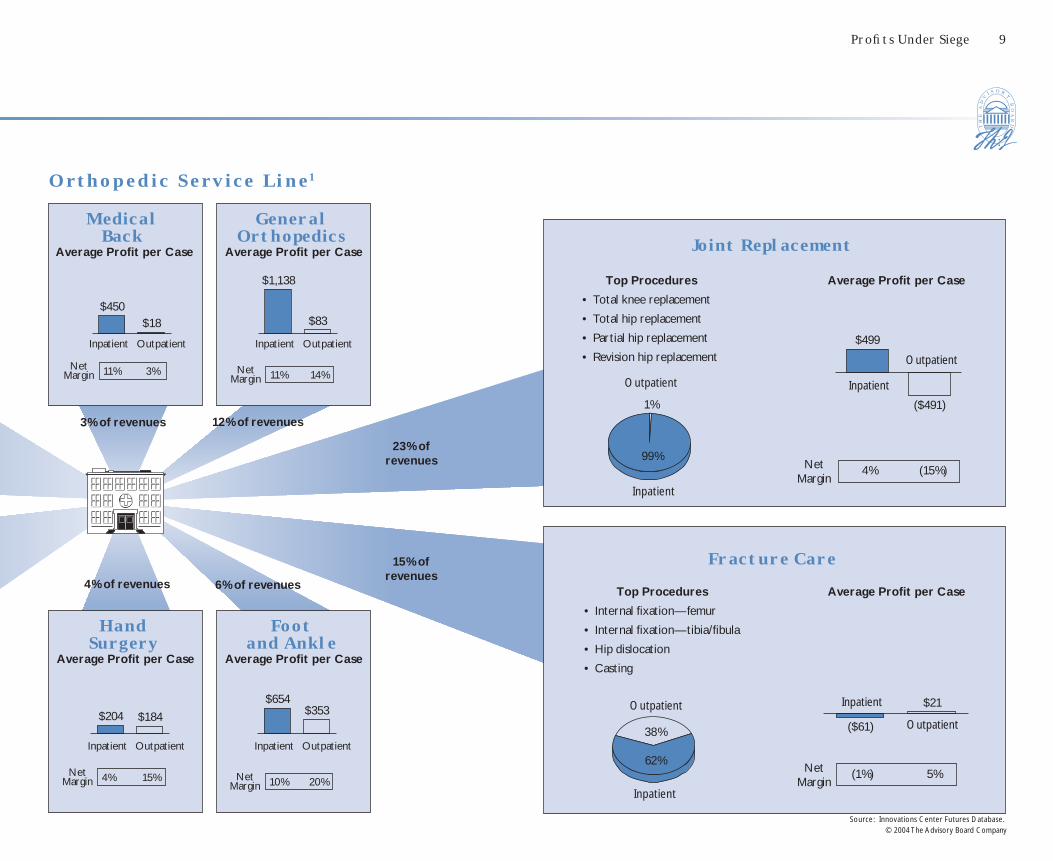
S e r v i c e L i n e s W i t h i n a S e r v i c e L i n e
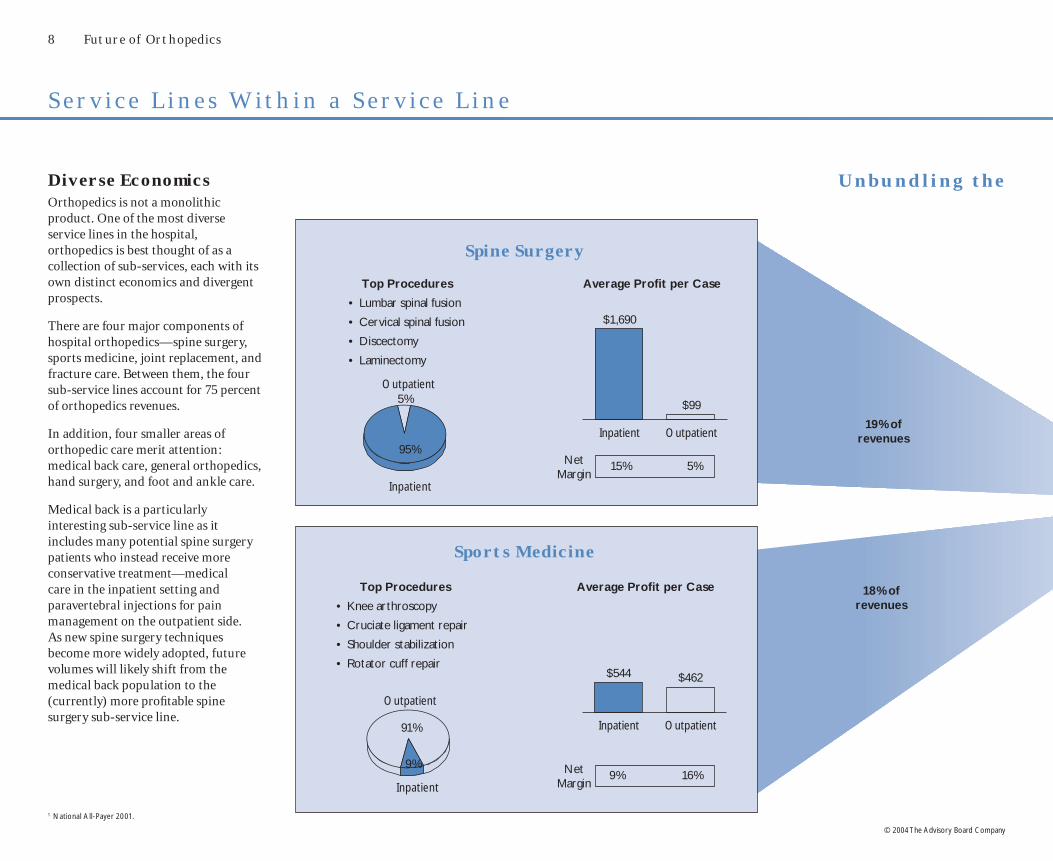
18% of revenues
19% of revenues
Diverse EconomicsOrthopedics is not a monolithic product. One of the most diverse service lines in the hospital, orthopedics is best thought of as a collection of sub-services, each with its own distinct economics and divergent prospects.
There are four major components of hospital orthopedics—spine surgery, sports medicine, joint replacement, and fracture care. Between them, the four sub-service lines account for 75 percent of orthopedics revenues.
In addition, four smaller areas of orthopedic care merit attention: medical back care, general orthopedics, hand surgery, and foot and ankle care.
Medical back is a particularly interesting sub-service line as it includes many potential spine surgery patients who instead receive more conservative treatment—medical care in the inpatient setting and paravertebral injections for pain management on the outpatient side. As new spine surgery techniques become more widely adopted, future volumes will likely shift from the medical back population to the (currently) more profi table spine surgery sub-service line.
U n b u n d l i n g t h e
Spine Surgery
Top Procedures
• Lumbar spinal fusion
• Cervical spinal fusion
• Discectomy
• Laminectomy
Inpatient Outpatient
$1,690
$99
Inpatient
Outpatient
Average Profi t per Case
Net Margin
5%
95%
Sports Medicine
Top Procedures
• Knee arthroscopy
• Cruciate ligament repair
• Shoulder stabilization
• Rotator cuff repair
Inpatient Outpatient
$544 $462
Inpatient
Outpatient
Average Profi t per Case
9% 16%Net Margin
91%
9%
15% 5%
1 National All-Payer 2001.
Profi ts Under Siege 9
© 2004 The Advisory Board Company
General Orthopedics
Average Profi t per Case
23% of revenues
15% of revenues
3% of revenues
Foot and Ankle
Average Profi t per Case
$654$353
Inpatient Outpatient
10% 20%Net Margin
12% of revenues
Inpatient Outpatient
11% 14%Net Margin
4% of revenues
$204 $184
Inpatient Outpatient
4% 15%Net Margin
6% of revenues
O r t h o p e d i c S e r v i c e L i n e 1
Top Procedures
• Total knee replacement
• Total hip replacement
• Partial hip replacement
• Revision hip replacement
Joint Replacement
Inpatient
Outpatient
$499
($491)
Inpatient
Outpatient
Average Profi t per Case
Fracture Care
Top Procedures
• Internal fi xation—femur
• Internal fi xation—tibia/fi bula
• Hip dislocation
• Casting
Inpatient
Outpatient($61)
$21
Inpatient
Outpatient
Average Profi t per Case
(1%) 5%Net Margin
99%
38%
62%
Hand Surgery
Average Profi t per Case
$450$18
Inpatient Outpatient
11% 3%Net Margin
Medical Back
Average Profi t per Case
(15%)Net Margin
Source: Innovations Center Futures Database.
4%
$1,138
$83
1%

10 Future of Orthopedics
© 2004 The Advisory Board Company
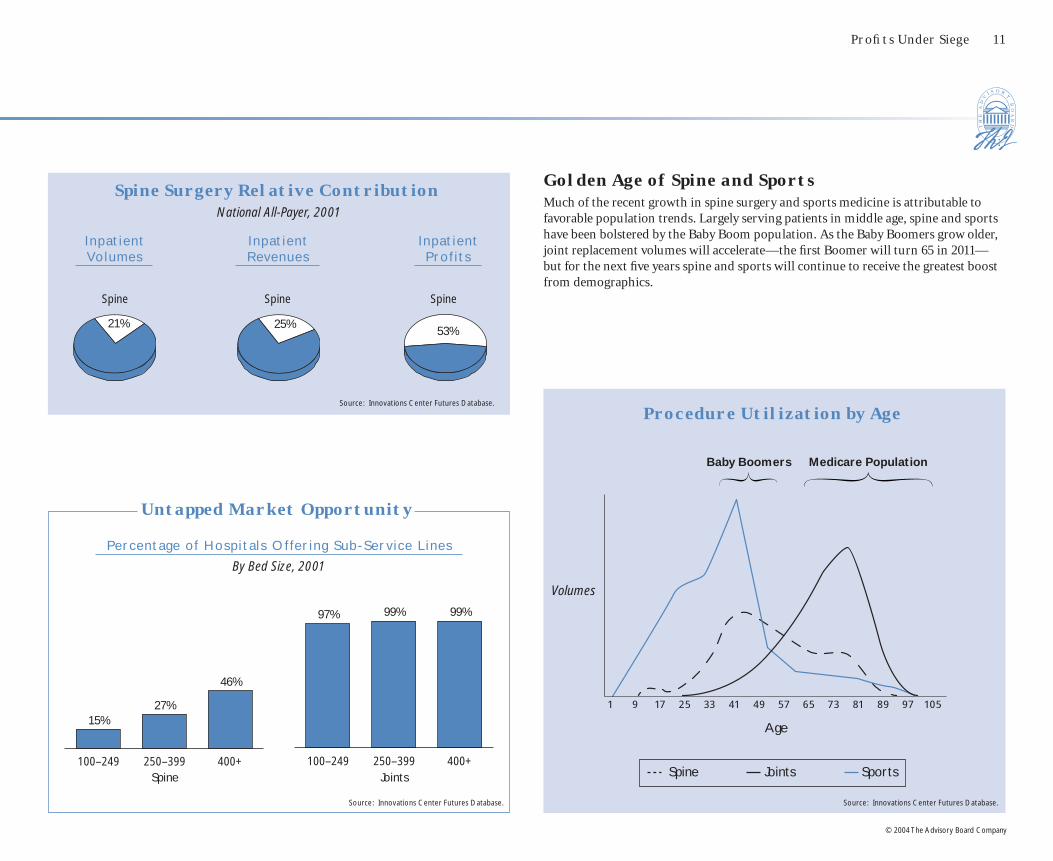
All Sub-Service Lines Not Created EqualAcross all of orthopedics, spine surgery stands out as generating a disproportionate share of total profi ts for the service line. As seen on the opposing page, in 2001 spine yielded the majority of inpatient orthopedic profi ts, while composing less than a quarter of volumes. Moreover, spine surgery is offered by only a minority of institutions today, so its impact at the institution level is greater still. Similarly, on the outpatient side, sports medicine generated a majority of total profi ts, due to its high per-case margins.
Notably, on a contribution profi t basis (looking only at direct costs), joint replacement also rises to the fore—joints, as well as spine, are ranked among the top fi ve hospital services in terms of average contribution profi t per patient day.
S p i n e , S p o r t s G e n e r a t i n g t h e L i o n’s S h a r e o f To d a y ’s P r o f i t s
Total Profit by Sub-Service LineNational All-Payer, 2003 (E)
Benchmarking Contribution per DayNational Inpatient Medicare, 2001
Surg ica l Ser v ice L ines
Inpat ient Outpat ient
$1,568$1,434
$1,045 $989 $862 $852 $802 $775 $725 $700 $690 $685 $624 $545 $515 $478
53%19%
28%
53%47%
Spine
Sports Medicine
$513 $507 $494 $466 $464 $428 $419 $414 $402 $359 $337 $292 $288 $274 $262 $179
Medica l Ser v ice L ines
Cardiac Surgery
Cardiac Cath
Spine Neuro-surgery
Joints General Surgery
Thoracic Surgery
Vascular Surgery
General Ortho
(Surgical)
Trauma Gynecology SportsMedicine
Hand ENT Fracture Care
(Surgical)
Foot
Medical Oncology
Ophthal-mology
General Medicine
Pulmon-ology
Cardiology GI General Ortho
(Medical)
Neurology Nephro-logy
Endocrin-ology
Rheuma-tology
Derma-tology
Medical Back
Fracture Care
(Medical)
Rehab Psychiatry
Average Medical
$400
Average Surgical
$929
Joint Replacement
Source: Innovations Center Futures Database.
Source: Innovations Center Futures Database.
Other
Other
Profi ts Under Siege 11
© 2004 The Advisory Board Company
Golden Age of Spine and SportsMuch of the recent growth in spine surgery and sports medicine is attributable to favorable population trends. Largely serving patients in middle age, spine and sports have been bolstered by the Baby Boom population. As the Baby Boomers grow older, joint replacement volumes will accelerate—the fi rst Boomer will turn 65 in 2011—but for the next fi ve years spine and sports will continue to receive the greatest boost from demographics.
Procedure Utilization by Age
Baby Boomers Medicare Population
Spine Joints Sports
1 9 17 25 33 41 49 57 65 73 81 89 97 105
Source: Innovations Center Futures Database.
Spine Surgery Relative ContributionNational All-Payer, 2001
I npat ient Volumes
Inpat ient Revenues
Inpat ient Prof i t s
21% 25%53%
Spine Spine Spine
Untapped Market Opportunity
Percent age of Hosp i t a l s Of fer ing Sub -Ser v ice L ines
By Bed Size, 2001
Spine Joints100–249 250–399 400+
15%27%
46%
100–249 250–399 400+
97% 99% 99%
Source: Innovations Center Futures Database.
Source: Innovations Center Futures Database.
Age
Volumes

12 Future of Orthopedics
© 2004 The Advisory Board Company
13
© 2004 The Advisory Board Company
Future of Orthopedics
Vision of the Future

14 Future of Orthopedics
© 2004 The Advisory Board Company
T h r e a t e n i n g S k i e s A h e a d f o r O r t h o p e d i c s P r o f i t a b i l i t y
Total Profit Stable, but Profit per Case FallingBolstered by robust volume growth, total profi ts for orthopedics are expected to be relatively stable into the future. Profi t per case, however, will fall sharply—some procedures, such as joint replacement, crossing into the red.
Reimbursement the Critical UncertaintyBeyond cost challenges, orthopedics fi nances are at the mercy of third-party reimbursement decisions. At present course and speed for cost and reimbursement trends, the orthopedics service line could approach break-even by 2010 (at the national level). On the other hand, if insurers were to increase payments in line with expected cost increases, total profi ts for orthopedics could nearly double across the decade. The Innovations Center consensus estimate takes a middle course, assuming that the gap between reimbursement and cost growth will narrow but not close in the
coming years.
Challenged by Implants, Biologicals, CompetitionAcross the next decade, it will become increasingly diffi cult for orthopedic programs to maintain even today’s margins. The threats massed against orthopedic profi tability suggest that the fi nancial gap between strong performers and the typical institution is set to widen signifi cantly. Rising implant expenses will continue to pose the greatest challenge to procedure profi ts. Other notable threats include expensive new biological materials, selective poaching by specialty competitors, and the shift (albeit modest) to the outpatient setting.
Profit per Procedure Forecasts
Outpatient
FF
F($72)
($225)($493)
B BB
$550 $552 $445H
H
H$491 $366
$30
JJ
J$1,683
$1,892$1,728
2003 2008 2013($1,000)
$0
$1,000
$2,000
F F F
$21 $14 $0
B B B$490 $513 $500
H
H
H
($521)($714)
($1,012)
J JJ
$105 $75 ($3)
2003 2008 2013($1,200)
($600)
$0
$600
Total Orthopedics Profits ForecastTotal Orthopedic Profi ts
Optimistic Scenario1
“Current Course and Speed”2
Innovations CenterForecast
Inpatient
J
J
J
BB
BH
H
H
2003 2008 2013($1 B)
$0
$3 B
$6 B
$3.28 B$4.38 B
$5.47 B
$3.16 B
($0.85 B)
$3.65 B
$1.82 B
1 Assumes reimbursement changes at the same rate as costs, keeping percentage profi t margins constant but increasing profi ts in dollars.2 Assumes gap between reimbursement and cost growth seen over past fi ve years persists into the future.
Source: Innovations Center Futures Database.

Vision of the Future 15
© 2004 The Advisory Board Company
Strongly Positive Effect (>30%)
Moderately Positive Effect (5%–30%)
No Effect
Strongly Negative Effect (>30%)
Driver Current Impact Five-Year Impact Ten-Year Impact Innovations Center Commentary
Implant Pricing
Implant pricing to continue playing major role in pushing down profi ts, supported by ongoing industry consolidation; over long term, price increases expected to moderate but not disappear
New Implant Technologies
Additional driver of implant costs is shift to new premium designs; while unicompartmental knee replacement and other innovations may actually lower costs in near term, shift to other, more expensive implants will accelerate across next several years
Growth Factors
For now, impact of high-priced biological growth factors for orthopedic procedures muted by incremental reimbursement; over time, ever-broader applications will overwhelm any decreases in growth factor pricing
Minimally Invasive Techniques
Need for specialized instruments and equipment to increase costs of procedures; slow adoption of techniques will limit impact
Outpatient Migration
Vast majority of today’s inpatient procedures will remain within hospital setting; ten years hence, minority of joint replacement and spine surgeries could become ambulatory surgeries, likely yielding smaller fi nancial contribution
Non-Hospital Competition
Ambulatory surgery centers currently targeting profi table outpatient sports medicine procedures; long-term, threat to inpatient profi ts will intensify, with for-profi t specialty hospitals increasingly skimming most desirable patients
Medicare Reimbursement
Although past two years have seen absolute increases in Medicare payments for some orthopedics procedures, almost guaranteed that government reimbursement will not keep pace with cost increases; macro trend is for declining DRG case weights for orthopedics
Commercial Reimbursement
Short-term opportunity for implementing pass-through arrangements for implants; over long run, loss of hospital leverage relative to payers a virtual certainty
Payer Mix
Large industrywide shifts in payer mix unlikely; that said, aging of population and demographic profi le of orthopedic procedures will tilt scales somewhat in favor of Medicare patients
Product Mix
Innovations in (higher-margin) spine and (lower-margin) joint replacement will grow volumes in both specialties, resulting in little net change; small decline in proportion of fracture care cases could be a modest fi nancial boon
Length of Stay Declines
Expected LOS declines made possible by emerging minimally invasive techniques will present hospitals opportunity to profi t from cost reductions until reimbursement levels catch up; slow adoption of relevant techniques make this a ten-year phenomenon seen mainly in later years
D r i v e r s o f F u t u r e P r o f i t a b i l i t y
Moderately Negative Effect (5%–30%)

16 Future of Orthopedics
© 2004 The Advisory Board Company
Orthopedics Hospital Volumes Forecast
R o b u s t D e m a n d f o r O r t h o p e d i c s E x p e c t e d
Tota l Volumes Volume Change by Sub -Ser v ice L ine
Inpatient Admissions
No Shortage of PatientsOver the next ten years, demand of orthopedic care will rise signifi cantly, with relatively balanced growth between hospital inpatient and outpatient settings. Aging and growing of the population supports an optimistic volume forecast—a 17 percent increase for inpatient admissions and 13 percent growth for outpatient procedures. While the emergence of new procedures and greater penetration of existing technologies will further boost overall demand, specialty competition will moderate both inpatient and outpatient hospital volume growth. Hospital outpatient volumes will be particularly affected by loss of share to non-hospital care settings; the total outpatient market (hospital and non-hospital) is actually expected to grow 46 percent over the next decade. Inpatient utilization rates will also decrease as a result of new technology spurring shifts to the outpatient setting.
Competition the WildcardCompetition from ASCs and surgical hospitals is the greatest wildcard in forecasting future orthopedics demand. While it is a virtual certainty that orthopedics care will (continue to) migrate to non-hospital settings, this is very much a local market phenomenon. Although some will successfully fend off the competitive threat, institutions confronted with specialty competitors in their local market are at risk for devastating volume declines in key orthopedic procedures.
Spine Joint
Sports
Fracture Care
7% 10%
23%
41%
(4%)(9%)
3% 6%
Spine Joint Sports Fracture Care
13%25%
7% 11%
275% 343%154%
544%
Outpatient Procedures
2003–2008
2003–2013
Source: Innovations Center Futures Database.
J J J
BB
B
2003 2008 2013
Inpatient Admissions
Outpatient Procedures
8 M
4 M
02.5 M 2.7 M 2.9 M
6.0 M 6.5 M7.0 M
Population Utilization Net
17%14%
(3%)
Population Utilization Net
13%17%3%
Inpatient Outpatient
Drivers o f Volume Change , 20 03 –2013

Vision of the Future 17
© 2004 The Advisory Board Company
D r i v e r s o f F u t u r e Vo l u m e s
Driver Current Impact Five-Year Impact Ten-Year Impact Innovations Center Commentary
Demographics Population growth and aging driving moderate, gradual increase in inpatient and outpatient volumes; spine surgery and sports medicine to benefi t most in next fi ve years, joint replacement and fracture care thereafter
Lifestyle Factors
Changes in lifestyle factors to accelerate volume growth further; growing obesity rates across the population and rising activity levels among Baby Boomers expected to increase need for musculoskeletal care beyond demographics
Penetration of Existing Technologies
Long-term trend of broadening applications for core orthopedic procedures (joint replacements, spine surgeries) to new populations of patients; technology the principal driver of past volume growth, with no reason to expect procedures have reached saturation point
Medical Prevention
Drugs preventing osteoporosis are effective at reducing fracture risk, but limited diagnosis and poor patient compliance will radically restrict impact; medical solutions for osteoarthritis and degenerative disk disease are years if not decades away
Biological Treatments
Biological techniques for treating musculoskeletal diseases hold great potential to radically transform service line; that said, broad applications of stem cells, gene therapy, and tissue engineering unlikely to reach the clinic in next fi ve or even ten years
New Procedures
Over long term, potential for emerging procedures to expand volumes signifi cantly, reaching previously untreated patients; key examples are kyphoplasty and vertebroplasty, fi rst successful interventions for osteoporotic vertebral compression fractures
Outpatient Shift
Vast majority of today’s inpatient procedures will remain within hospital setting; ten years hence, minority of joint replacement and spine surgeries could become ambulatory surgeries, increasing vulnerability to competition
Non-Hospital Competition
Ambulatory surgery centers currently targeting outpatient sports medicine procedures; over time, intensifying threat to inpatient profi ts from surgical hospital poaching best inpatient payers and procedures
Strongly Negative Effect (>30%)
Moderately Negative Effect (5%–30%)
No Effect
Moderately Positive Effect (5%–30%)
Strongly Positive Effect (>30%)

18 Future of Orthopedics
© 2004 The Advisory Board Company
A d m i s s i o n s G r o w t h To S t r a i n O R s , N o t B e d C a p a c i t y
Flat Forecast for Inpatient DaysIn the next decade, more orthopedics patients will not necessarily require more inpatient beds. The total number of orthopedic procedures performed is certain to rise signifi cantly, placing heavy demands on current operating room capacity. By contrast, bed needs related to orthopedics are expected to be relatively unchanged.
Compared to the 14 percent growth forecast for inpatient orthopedics admissions in the next ten years, orthopedic inpatient days will actually trend downward—a 0.6 percent average annual decrease across the next decade. Declining length of stay is primarily responsible, although the shift of procedures to the outpatient setting will also play a role, especially in later years.
Continued Length of Stay Declines ExpectedConsistent with the trends observed across the past decades in orthopedics, length of stay is expected to decline signifi cantly in the coming years. The adoption of more effi cient inpatient management protocols and better rehabilitation techniques will continue to drive LOS declines. In addition, minimally invasive approaches to common orthopedic procedures will enable a radically shorter inpatient stay for certain patients.
J
J
J
4.46
4.01
3.56
2003 2008 2013
Orthopedics Length of StayOrthopedics Inpatient Days
2003 2008 2013
11.27 M10.56 M
11.17 M
Source: Innovations Center Futures Database. Source: Innovations Center Futures Database.
10% decline
20% declineDays

Vision of the Future 19
© 2004 The Advisory Board Company
Spotlight on Minimally Invasive TechniquesThe major technological driver of declining length of stay over the next ten years will be adoption of minimally invasive techniques for joint replacement and spine surgery. Although results for minimally invasive spine and joint techniques are still preliminary, and adoption is expected to be slow and gradual, minimally invasive approaches have the potential to reduce inpatient stays radically or even move procedures to the ambulatory setting. Early studies of minimally invasive hip replacement, discectomy, and spinal fusion report dramatic reductions in LOS relative to conventional techniques.
Outpatient Shift to Be LimitedAs minimally invasive techniques become more broadly used, several major inpatient orthopedic procedures will begin to be performed as ambulatory surgeries. In theory, hip replacement, knee replacement, discectomy, and spinal fusion can all be performed as outpatient procedures. However, the impact of the outpatient shift will be limited throughout the next decade: slow adoption is predicted for minimally invasive orthopedic procedures, and outpatient migration is expected to be even slower as surgeons become comfortable with the new techniques.
Percentage of Procedures Performed Outpatient
HipReplacement
KneeReplacement
Discectomy Spinal Fusion
0% 1%4%
0% 1%4%
2%
15%
30%
0%3%
10%
2003 2008 2013
Median Length of Stay2003 Estimate, Days
HipReplacement
KneeReplacement
Discectomy Spinal Fusion
2
5
2
4
1
3 3
5
Standard Procedure
Minimally Invasive
Percentage Decrease 60% 50% 66% 40%
Source: Innovations Center interviews and analysis. Source: Innovations Center interviews and analysis.

20 Future of Orthopedics
© 2004 The Advisory Board Company
Spine Surgery Sub-Service Line Forecast
S p i n e S u r g e r y I s To p I n v e s t m e n t C h o i c e
Significant Upside OpportunityOn average, spine surgery is, and will continue to be, the most profi table service within orthopedics. Spine has a number of elements in its favor—high-dollar procedures, a payer mix weighted toward commercial patients, periodic favorable reimbursement updates from Medicare, and a long-term trend of increasing per capita utilization. In addition, novel techniques (notably, new procedures for treating vertebral compression fractures) could be an engine for further growth over the next several years.
High Return, High RiskSpine is also the most volatile orthopedic sub-service line, with signifi cant potential for technological disruption. Programs have already begun to confront the cost of the new biological growth factors, although payers seem to be defusing the impact for now. Another key technology expected within the next few years—artifi cial discs—could replace many spinal fusions, with the threat of higher costs without commensurate payment. Over the long term, given ongoing debates over the appropriateness of surgical spine intervention, medical consensus could shift and use rates could stabilize or even plummet. With this risk profi le, spine may not be for everyone—indeed, fewer than half of hospitals have programs today—but those who invest may be rewarded handsomely.
2003 2008 2013
$1,683$1,892
$1,728
JJ J
B B B
2003 2008 2013
2003 2008 2013
$105
$75
($3)
Average Prof i t per Case , Inpat ient
Average Prof i t per Case , Outpat ient
Tot a l Prof i t s
Tot a l Volumes
2003 2008 2013
$895 M$1.21 B $1.28 B
$1 M$2 M $ 0
$1.28 B$1.21 B$894 M
OutpatientInpatient
Inpatient
Outpatient
Source: Innovations Center Futures Database.
531 K 571 K 586 K
7 K 28 K 33 K
Vision of the Future 21
© 2004 The Advisory Board Company
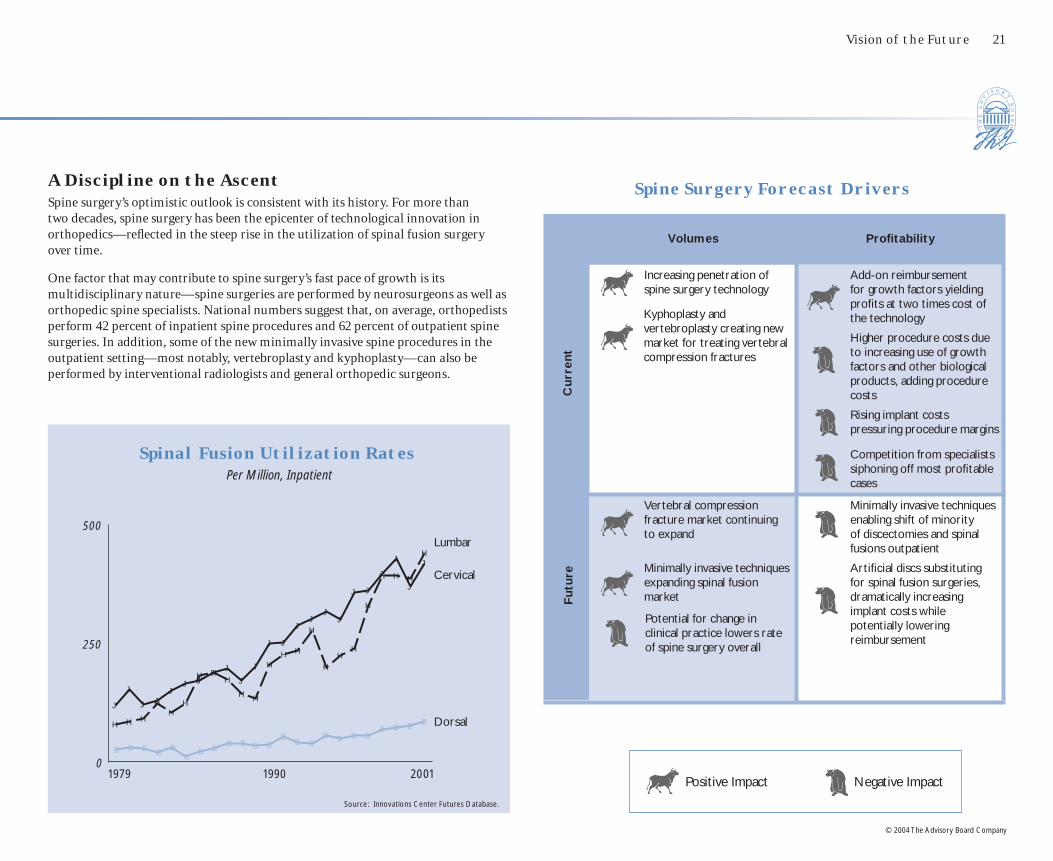
Kyphoplasty and vertebroplasty creating new market for treating vertebral compression fractures
Spine Surgery Forecast Drivers
Positive Impact Negative Impact
Volumes Profi tability
Increasing penetration of spine surgery technology
Add-on reimbursement for growth factors yielding profi ts at two times cost of the technology
Higher procedure costs due to increasing use of growth factors and other biological products, adding procedure costs
Rising implant costs pressuring procedure margins
Competition from specialists siphoning off most profi table cases
Vertebral compression fracture market continuing to expand
Minimally invasive techniques enabling shift of minority of discectomies and spinal fusions outpatient
Minimally invasive techniques expanding spinal fusion market
Artifi cial discs substituting for spinal fusion surgeries, dramatically increasing implant costs while potentially lowering reimbursement
Cu
rren
tF
utu
re
Potential for change in clinical practice lowers rate of spine surgery overall
J
J
JJ
JJ J
JJ
J
J
J J
JJ
JJ
J J
J
J
J
J
B B BB
B
BB B
B B B BB
B BB B B B
B B BBH H H
H
H
H
H HH
HH
H
HH
H
H
HH
H
H H H
H
0
250
500
1979 1990 2001
Lumbar
Cervical
Dorsal
Spinal Fusion Utilization RatesPer Million, Inpatient
A Discipline on the AscentSpine surgery’s optimistic outlook is consistent with its history. For more than two decades, spine surgery has been the epicenter of technological innovation in orthopedics—refl ected in the steep rise in the utilization of spinal fusion surgery over time.
One factor that may contribute to spine surgery’s fast pace of growth is its multidisciplinary nature—spine surgeries are performed by neurosurgeons as well as orthopedic spine specialists. National numbers suggest that, on average, orthopedists perform 42 percent of inpatient spine procedures and 62 percent of outpatient spine surgeries. In addition, some of the new minimally invasive spine procedures in the outpatient setting—most notably, vertebroplasty and kyphoplasty—can also be performed by interventional radiologists and general orthopedic surgeons.
Source: Innovations Center Futures Database.

22 Future of Orthopedics
© 2004 The Advisory Board Company
S p i n e S u r g e r y t h e E p i c e n t e r o f O r t h o p e d i c I n n o v a t i o n
Key Disruptive Technologies Expected in the Coming Decade
Vertebral Fracture TreatmentsTwo procedures for treating compression fractures in the spine are emerging as the greatest drivers of spine surgery volume growth across the next several years. While the profi tability picture is still uncertain—many payers are still deciding at what level to reimburse for the procedures—the potential market is huge. Currently, vertebroplasty is profi table as an outpatient procedure, while kyphoplasty, which requires an additional component, is usually only profi table if performed inpatient.
Minimally Invasive SurgeryTechniques for performing disc excision and spinal fusion procedures through smaller incisions, while sparking considerable interest among patients and physicians, will see slow adoption over the next few years, limiting their impact. Over the long term, minimally invasive spine techniques could signifi cantly reduce length of stay and even enable a shift to the outpatient setting.
• Treats vertebral fractures with bone cement delivered through catheter
• Reduces pain, restores height
• Inpatient or outpatient procedure, usually under general anesthesia
• Performed in OR with fl uoroscopy or in angio suite
• Requires $2,000 disposable balloon and instruments
• Reimbursement at $1,000 to $4,000 and above
Kyphoplasty
• Treats vertebral fractures with bone cement delivered through catheter
• Reduces pain
• Outpatient procedure, usually under local anesthesia
• Performed in OR with fl uoroscopy or in angio suite
• Direct procedure costs approximately $300
• Reimbursement near $1,000
Vertebroplasty
Market Potent i a l
Vertebral Compression Fractures Annual Incidence
Endoscopic Spinal Fusion
• Fuses spinal segments, introducing implant through portal
• Uses fi ber-optic endoscopes and/or fl uoroscopic imaging
• Reduces LOS by 1+ days
• Requires $1,000 to $2,000 in additional instrumentation
Endoscopic Discectomy
• Removes portion of degenerated disc through portal
• Uses fi ber-optic endoscopes and/or fl uoroscopic imaging
• Can be performed as 23-hour outpatient procedure
• Requires $1,000 to $2,000 in additional instrumentation
Endoscopic Sp ine Surger y Adopt ion Rate
Spinal Fusion
Discectomy
2003 2008 2013
0% 1%5%
12% 15%
35%
Source: Innovations Center interviews and analysis. Source: Innovations Center interviews and analysis.
500 K 250 KResolve Independently
Cause Chronic
Pain

Vision of the Future 23
© 2004 The Advisory Board Company
WithoutGrowth Factors
WithGrowth Factors
$11,623
$5,000
$20,523
$9,000
Artificial Disc ReplacementPotentially a signifi cant disruption to spinal fusion volumes, artifi cial discs treat spinal disc degeneration by replacing the damaged disc, rather than fusing adjacent spine segments together. Many expect artifi cial discs to take substantial market share away from spinal fusion surgery after their introduction in 2005. The main concern for hospitals is the cost of the implants—estimated at $8,000 per level—and their provisional classifi cation into lower-paying back and neck procedure DRGs rather than more remunerative spinal fusion codes. By 2007 or 2008, insurers are expected to resolve gross reimbursement inequities related to artifi cial discs, but in the worst case artifi cial discs could be a serious blow to spine profi ts for several years.
Growth FactorsBiological bone growth factors represent a major threat to spine procedure economics. The fi rst growth factor on the market, Medtronic’s INFUSE product (BMP-2), costs $3,500–$4,900 per fusion level—representing a signifi cant additional expense. Following its 2002 launch, INFUSE has captured a sizeable portion of the spine market—the product is now used in around 10 percent of fusion surgeries. However, CMS and some private insurers have defused the threat for now, providing ample reimbursement for the added costs. For Medicare patients, CMS actually approved a $8,900 DRG pass-through payment, which would result in a $4,000–$5,000 net gain for single-level fusion cases with INFUSE. Over the long term, broader adoption of INFUSE, new growth factors, and other biological products for use in spine may pose additional challenges, depending on insurer response.
SpinalFusion Surgery
Artificial DiscReplacement
$11,623
$5,000 $5,649$8,000
Expected Medicare Reimbursement1
Implant Costs (Estimated)
Comparat ive Economics , Sp ina l Fus ion Versus Ar t i f i c i a l Discs
DePuy Charite III Artifi cial Disc
• Replaces degenerated disc with artifi cial device
• Unlike fusion, retains mobility and shock absorption of spine
• Inpatient or outpatient procedure, usually under general anesthesia
Impac t o f Growth Fac tor Pass -Through on Medicare Sp ina l Fus ion Re imbursement
Medtronic INFUSE Growth Factor
• Biological product for use in stimulating bone growth
• Approved for use in anterior lumbar fusion surgeries in July 2002
• Intended to substitute for bone graft harvested from iliac crest
• Approval pending for broader spinal fusion indications
Source: Innovations Center interviews and analysis. Source: Innovations Center interviews and analysis.1 Based on 2001 national reimbursement levels for spinal fusion without complications
Expected Medicare Reimbursement
Implant Costs (Estimated)

24 Future of Orthopedics
© 2004 The Advisory Board Company
Attractive Profit MarginsOn the whole, orthopedic sports medicine is—and will remain for some time—an attractive business. Although sports medicine procedures are largely outpatient and therefore lower-dollar than other offerings within hospital orthopedics, most sports medicine procedures generate a healthy profi t. Moreover, a critical advantage of sports medicine procedures is that they generally do not require implants, reducing exposure to cost increases. Future prospects for the sports medicine market are if anything brighter as active Baby Boomers continue to suffer from activity-related injuries. The most tangible threat to profi ts is the long-term potential for commercial insurers to shift to an APC-like prospective payment methodology, which could dramatically reduce commercial outpatient reimbursement levels.
S p o r t s M e d i c i n e a W i n n e r i n t h e N e a r Te r m
Vulnerable to CompetitionThe sunny outlook for hospital-based sports medicine is tempered by intensifying competition. The attractive fundamentals of sports medicine has not gone unnoticed by non-hospital players. In many markets, sports medicine is currently “ground zero” for competition from ASCs and physician offi ces. Already, more than a third of all knee arthroscopies are done outside the hospital, and ambulatory surgery centers are actively seeking to capture a larger share of the outpatient market. Thus, even though the sports medicine market has the potential to grow rapidly, hospitals may not capture the lion’s share of that growth.
Sports Medicine Sub-Service Line Forecast
2003 2008 2013
$550 $552
$445
2003 2008 2013
B B B
JJ
J
2003 2008 2013
2003 2008 2013
$490 $513 $500
Average Prof i t per Case , Inpat ient
Average Prof i t per Case , Outpat ient
Tot a l Prof i t s
Tot a l Volumes
$953 M$1.1 B $1.15 B
$855 M $1.01 B $1.09 B
$57 M$91 M$98 M
Source: Innovations Center Futures Database.
Inpatient Outpatient
Inpatient Outpatient
1.7 M2.0 M 2.2 M
179 K 172 K 162 K

Vision of the Future 25
© 2004 The Advisory Board Company
Volume Boost from New ProceduresSports medicine programs will benefi t from the adoption of new, less-invasive procedures to treat common activity-related injuries. These new procedures, largely outpatient, have been used to date mainly in the commercial-pay population, which has translated to positive economics. Moreover, at least anecedotally, these procedures have generated considerable interest among active consumers by offering dramatically quicker recovery.
New Sports Medicine Procedures
Arthroscopic Rotator Cuff Repair
Cuts less tissue than open procedure, dramatically reducing recovery time
Alleviates chronic pain with half the recovery time of open procedure
Arthroscopic Ankle Reconstruction
Provides relief for young, active patients who want to delay knee replacement
Unispacer Knee Implant
Provides an alternative to life-long pain and poor performance from shredded elbow tendon
Tommy John Surgery
Allows surgeons to secure small wrist bones without a large scar
Minimally Invasive Wrist
Fixation
Re-grafts tendon onto bone using a combination of endoscopic and mini-open techniques
Arthroscopic ACL Reconstruction
Positive Impact Negative Impact
Volumes Profi tability
Expensive tissue-engineered autologous cartilage transplants potentially a substantial net loss per case
Increasing physical activity levels among middle-aged and elderly leading to rising rates of chronic and acute sports injuries
Consumer comfort with “lifestyle procedures” increasing likelihood that patients seek surgical intervention for chronic conditions
Competition from ASCs capturing outpatient surgeries
Questions about effi cacy of knee arthroscopy in arthritis patients limiting growth
Potential shift away from charge-based to prospective payment methodology for commercial outpatient business reducing payment levels
Biological approaches for repairing damaged cartilage expanding market
Cu
rren
tF
utu
reCompetition from ASCs capturing outpatient surgeries
Sports Medicine Forecast Drivers

26 Future of Orthopedics
© 2004 The Advisory Board Company
Joint Replacement Sub-Service Line Forecast
No Respite from Implant ChallengeAs in the past, the future fortunes of joint replacement procedures will turn on trends in implant costs. Driven by continued increases in implant expenses without commensurate increases in reimbursement, the Innovations Center anticipates that the average joint replacement case—commercial cases included—will be a break-even proposition within the next ten years. At the same time, volumes for joint replacement will be robust, presenting an opportunity for hospitals who manage to moderate implant costs to net attractive returns.
Considerable Volume Growth AheadDemand for joint replacements will escalate sharply across the next ten years. Toward the end of the decade, demographics-fueled growth in joint replacements will spike, as Baby Boomers begin to wear out their joints. The greater effect will be from increases in utilization rates, which have risen steeply across the past several decades and will continue to climb. New procedures, new techniques, and changes in consumer behavior will contribute to higher utilization in the future.
J o i n t s S t i l l Vo l u m e M a i n s t a y, b u t M a r g i n P r e s s u r e s I n c r e a s i n g
2003 2008 2013
$491
$366
$302003 2008
2013
J
J
J
B B B
2003 2008 2013
2003 2008 2013
($521)
($714)
($1,012)
Average Prof i t per Case , Inpat ient
Average Prof i t per Case , Outpat ient
Tot a l Prof i t s
Tot a l Volumes
$328 M $288 M
($25 M)
Inpatient Outpatient
$332 M $303 M
$28 M
($53 M)($15 M)($4 M)
Source: Innovations Center Futures Database.
Inpatient Outpatient
833 K676 K
953 K
8 K 21 K 52 K

Vision of the Future 27
© 2004 The Advisory Board Company
Joint Replacement Forecast Drivers
Positive Impact Negative Impact
Volumes Profi tability
More durable implants expanding market to younger patients
Implant prices continuing to rise
Unicompartmental knee replacement expanding market to younger patients
Increased activity levels among the middle-aged and elderly leading to more chronic joint wear
Hip joint resurfacing procedure expanding market
(Modest) shift of hip and knee replacements to outpatient setting
Minimally invasive hip and knee replacement expanding market, particularly to younger patients
Competition from specialists siphoning off most profi table cases
Biological approaches for repairing damaged cartilage expanding market
Cu
rren
tF
utu
re
Competition from specialists siphoning off most profi table cases
Growth in under-65 market shifting payer mix toward commercial insurers
Shift to more durable (and more expensive) implants
Tissue-Engineered Cartilage
Tissue-Engineered Total Knee
Gene Therapy
Stem Cell Therapy
Tissue-Engineered Tendon
Tissue-Engineered Bone
A Disruptive (but Distant) Future for BiologicsThe potential for biologics to have a truly disruptive impact on joint replacement demand and profi tability warrants awe—and caution. Ultimately, the most remarkable innovations will likely come in the fi elds of gene therapy and stem cell therapy—reversing the effects of aging and preventing osteoarthritis, the underlying disease that necessitates joint replacement in the fi rst place. However, progress here is measured not in years, but decades.
In the intervening years, joint replacement surgeries will begin to incorporate human tissue-engineered implants rather than today’s metal and synthetic implants. The fi rst tissue-engineered application to market—autologous cartilage transplantation—has experienced limited success to date, due to high costs (exceeding $12,000), inconsistent reimbursement, and narrow indications.
Biological Solutions for Joint Degeneration
28 Future of Orthopedics
© 2004 The Advisory Board Company
Hip Joint Resurfacing
• Coats ball and socket of hip joint with metal lining
• Approved in Europe; clinical trials ongoing in The United States
J o i n t R e p l a c e m e n t M o v i n g To w a r d a Yo u n g e r P o p u l a t i o n
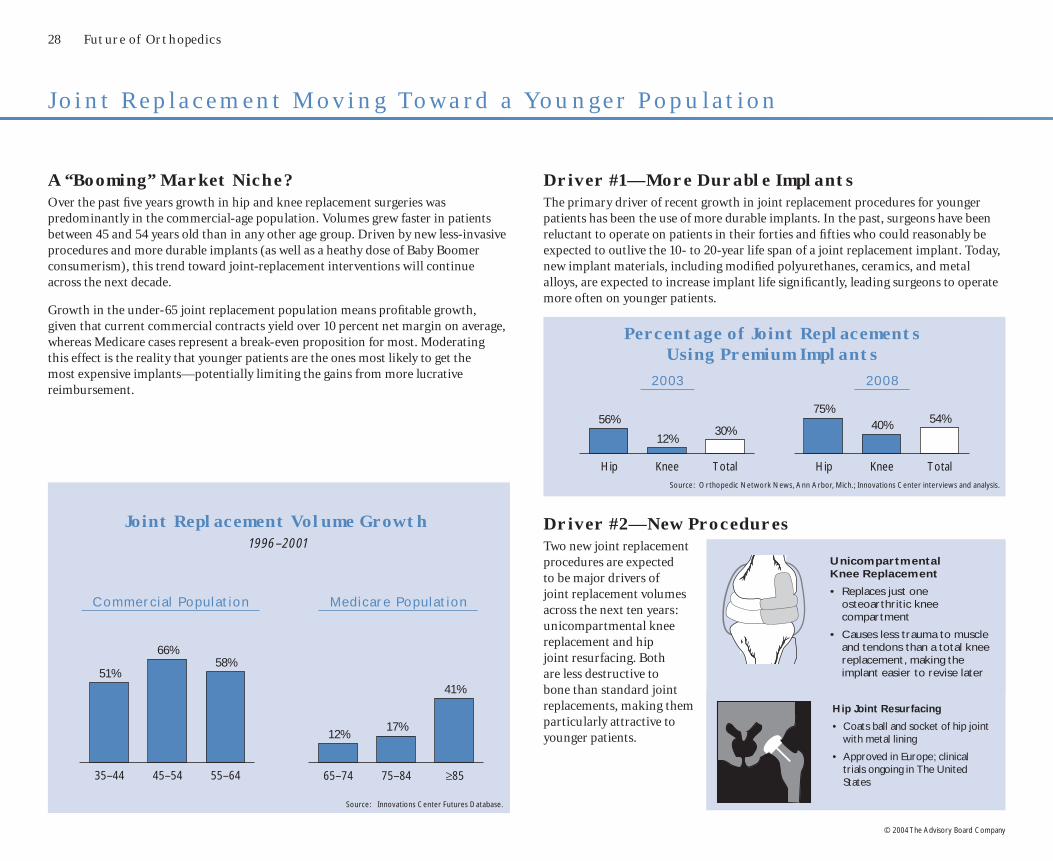
A “Booming” Market Niche?Over the past fi ve years growth in hip and knee replacement surgeries was predominantly in the commercial-age population. Volumes grew faster in patients between 45 and 54 years old than in any other age group. Driven by new less-invasive procedures and more durable implants (as well as a heathy dose of Baby Boomer consumerism), this trend toward joint-replacement interventions will continue across the next decade.
Growth in the under-65 joint replacement population means profi table growth, given that current commercial contracts yield over 10 percent net margin on average, whereas Medicare cases represent a break-even proposition for most. Moderating this effect is the reality that younger patients are the ones most likely to get the most expensive implants—potentially limiting the gains from more lucrative reimbursement.
Joint Replacement Volume Growth1996–2001
Driver #1—More Durable ImplantsThe primary driver of recent growth in joint replacement procedures for younger patients has been the use of more durable implants. In the past, surgeons have been reluctant to operate on patients in their forties and fi fties who could reasonably be expected to outlive the 10- to 20-year life span of a joint replacement implant. Today, new implant materials, including modifi ed polyurethanes, ceramics, and metal alloys, are expected to increase implant life signifi cantly, leading surgeons to operate more often on younger patients.
Unicompartmental Knee Replacement
• Replaces just one osteoarthritic knee compartment
• Causes less trauma to muscle and tendons than a total knee replacement, making the implant easier to revise later
35–44 45–54 55–64
51%
66%58%
65–74 75–84 ≥85
12%17%
41%
Commerc i a l Populat ion Medicare Populat ion
Source: Innovations Center Futures Database.
Driver #2—New ProceduresTwo new joint replacement procedures are expected to be major drivers of joint replacement volumes across the next ten years: unicompartmental knee replacement and hip joint resurfacing. Both are less destructive to bone than standard joint replacements, making them particularly attractive to younger patients.
Hip Knee Total
56%
12%30%
Hip Knee Total
75%40% 54%
Percentage of Joint ReplacementsUsing Premium Implants
Source: Orthopedic Network News, Ann Arbor, Mich. ; Innovations Center interviews and analysis.
20 03 20 08

Vision of the Future 29
© 2004 The Advisory Board Company
31%
10%
25%
34%
Bottom Line: Still Mainly Serving the ElderlyAcross the next decade, demand for joint replacement will continue to be dominated by senior-age Medicare patients. Despite rapid growth in joint replacements in the younger population, hip and knee replacement will continue to be a procedure primarily performed on the elderly. Even with the recent growth in under-65 patients undergoing joint replacements, only 31 percent of patients getting hip and knee replacements are under age 65 today.
Joint Replacement Volumes by Age Group
85 and Older
Under 65
65–74
75–84
(Minor) Driver #3—Minimally Invasive HipThe joint replacement procedure attracting the most attention of late has been minimally invasive hip replacement. The potential of minimally invasive hip is appealing: dramatic reductions in inpatient stays, radically faster recovery, and substantially reduced post-operative pain. Over the long term, the benefi ts of minimally invasive hip (as well as knee) replacement procedures will expand volumes, especially in younger patients. However, adoption of the new joint replacement techniques is likely to be modest for a number of years to come.
Steep Learning Curve
Although manufacturers are investing heavily in product development and physician education, minimally invasive hip replacement has a steep learning curve. Even joint replacement specialists face a substantial challenge in mastering the new procedures; general orthopedists who perform only a few joint replacements each month will be reluctant to spend the considerable effort required to learn the new techniques.
Limited Eligibility
Based on current clinical guidelines, only a fraction of hip replacement patients would be eligible for minimally invasive hip surgery. Over time, patient eligibility will probably expand signifi cantly, but for now adoption of the procedure will be slowed by its limited applicability—at best, approximately one-third of patients.
Minimally Invasive Hip Adoption Forecast
2003 2008 2013
0%
10%
30%
29%11%
31%
30%
65–74
Under 65
75–84
85 and Older
20 01
1996
Source: Innovations Center Futures Database.Source: Innovations Center interviews and analysis.

30 Future of Orthopedics
© 2004 The Advisory Board Company
F r a c t u r e C a r e — M i s s i o n , N o t M a r g i n s
Modest (and Diminishing) ContributionNever a leading profi t center, fracture care margins will decline slightly as the cost of implants continues to rise and reimbursement remains steady. Over the long term, the use of growth factors and other biological products to accelerate bone healing could signifi cantly increase costs, but widespread adoption is a number of years away.
Growth Sluggish at BestUnlike other areas of orthopedics, hospital-based fracture care—surgical and medical treatment for fractures, sprains, and dislocations—is not poised for signifi cant growth. As osteoporosis prevention becomes more widespread, the incidence of severe fractures will decline—an effect already observed over the past several years. That said, fracture care will continue to account for a signifi cant portion of overall orthopedics volumes
Fracture Care Sub-Service Line Forecast
Average Prof i t per Case , Inpat ient
Average Prof i t per Case , Outpat ient
2003 2008 2013
($78) ($69)
($152)
($252) ($263)
($580)
2003 2008 2013
$13
$266
$6
$277
($10)
$268
Source: Innovations Center Futures Database.
2003 2008 2013
JJ
J
B B B
H H H
F F F
2003 2008 2013
Inpatient Outpatient
Tota l Prof i t s
Tot a l Volumes
($25 M)
($147 M)
($372 M)
$22 M $16 M
($371 M)
($1 M)
($163 M)($47 M)
Medical Surgical
Medical Surgical
Outpatient Medical
Inpatient Surgical
Inpatient Medical
Outpatient Surgical
1.12 M1.05 M
1.16 M
477 K 489 K 501 K
176 K 185 K 190 K
31 K 36 K 41 K

Osteoporosis Prevention Having an EffectEfforts to reduce osteoporosis are beginning to have an effect; per capita utilization for fracture procedures has (slowly) declined over the past several years. Still, today fewer than a quarter of the patients at high risk for osteoporosis are adhering to a preventative regimen—diet, exercise, and bone-strengthening drugs—even though the current arsenal of pharmaceuticals is highly effective at preventing fractures. Across the next ten years, the trend toward declining fracture care utilization may accelerate as the result of better diagnosis of osteoporosis and more consistent prescribing of preventative drugs.
Fracture Care Utilization RatesPer Thousand, Inpatient
Fracture Care Forecast Drivers
Volumes
Cu
rren
tF
utu
re
Profi tability
Increasing physical activity levels among middle-aged and elderly leading to rising rates of chronic and acute sports injuries
Rising cost of implants
Medical prevention decreasing incidence of osteoporosis-related fractures
Lengthening life spans resulting in more fractures in the elderly
Potential for biological growth factors to be used in fracture healing, increasing procedure costs
Positive Impact Negative Impact
1996 1997 1998 1999 2000 20010
2.4
2.5
2.6
2.7
2.8
9% decline, 1996–2001
Source: Innovations Center Futures Database.
Vision of the Future 31
© 2004 The Advisory Board Company

Spinal Directed Energy Therapies
Tw o E r a s i n O r t h o p e d i c s
Timeline of (Potentially) Disruptive Technologies
Era of Mechanical InterventionsEra of Mechanical Interventions
2003 2004 2005 2006 2007 2008 2009 2010 2011
Next-Generation Implants
“Ship-in-a-Bottle” Implants
EndoscopicSpinal Fusion
“Smart” Implants
Minimally Invasive Hip Replacement
Computer-Aided Surgery
Kyphoplasty
VertebroplastyGrowth
Factors–Spine
Growth Factors–Long Bone
Artifi cial Discs Next-Generation Pain Medication
Artifi cialNuclei
UnicompartmentalKnee Replacement
Osteoporosis Prevention and
Screening
Minimally Invasive
Discectomy
Mobile-Bearing Knee Implant
Minimally InvasiveKnee Replacement Tissue-Engineered
Cartilage
32 Future of Orthopedics
© 2004 The Advisory Board Company
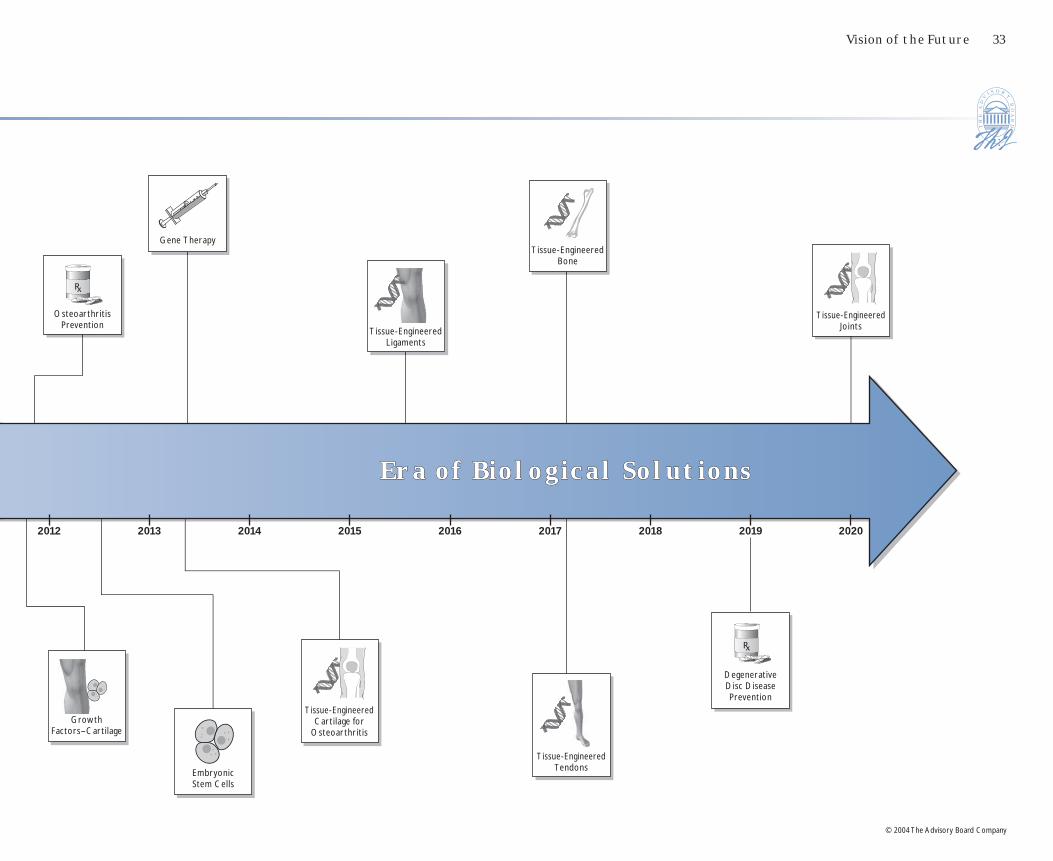
Era of Biological SolutionsEra of Biological Solutions
2012 2013 2014 2015 2016 2017 2018 2019
Tissue-Engineered TendonsEmbryonic
Stem Cells
Tissue-Engineered Cartilage for
OsteoarthritisGrowth
Factors–Cartilage
Tissue-Engineered Bone
Gene Therapy
Osteoarthritis Prevention
DegenerativeDisc Disease Prevention
Tissue-Engineered Joints
2020
Tissue-Engineered Ligaments
Vision of the Future 33
© 2004 The Advisory Board Company
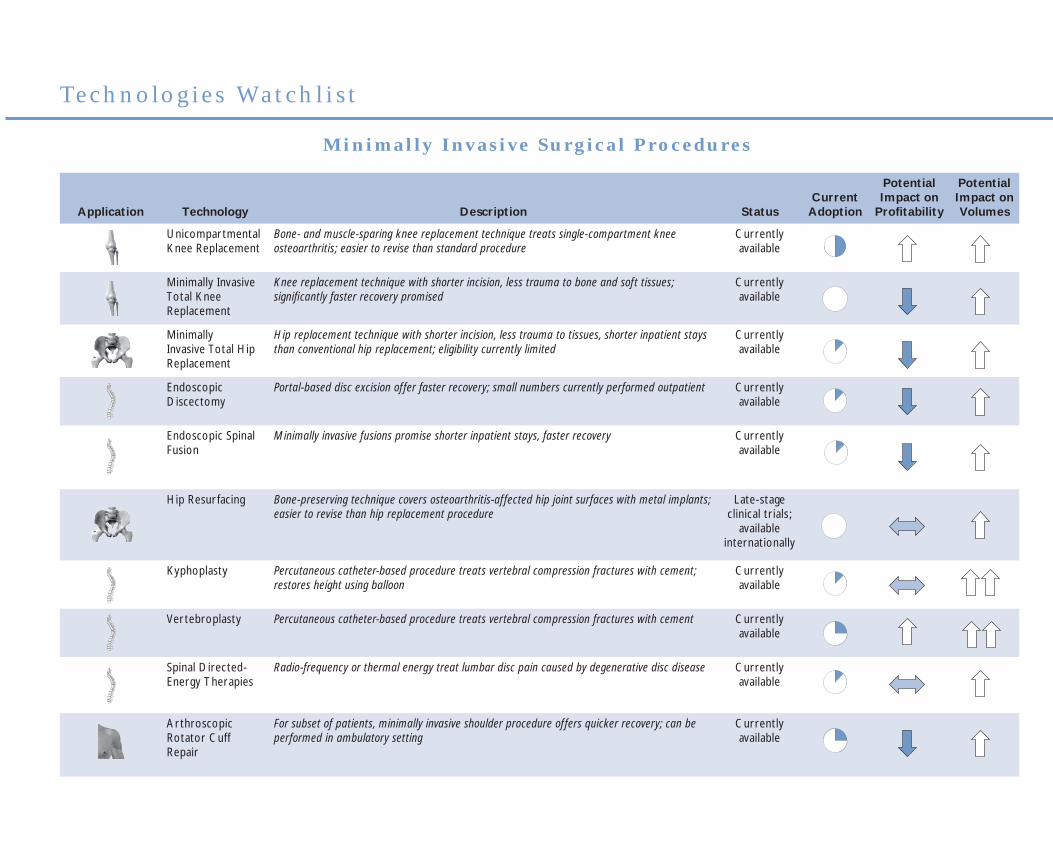
Te c h n o l o g i e s Wa t c h l i s t
Application Technology Description StatusCurrent
Adoption
Potential Impact on
Profi tability
Potential Impact on Volumes
Unicompartmental Knee Replacement
Bone- and muscle-sparing knee replacement technique treats single-compartment knee osteoarthritis; easier to revise than standard procedure
Currently available
Minimally Invasive Total Knee Replacement
Knee replacement technique with shorter incision, less trauma to bone and soft tissues; signifi cantly faster recovery promised
Currently available
Minimally Invasive Total Hip Replacement
Hip replacement technique with shorter incision, less trauma to tissues, shorter inpatient stays than conventional hip replacement; eligibility currently limited
Currently available
Endoscopic Discectomy
Portal-based disc excision offer faster recovery; small numbers currently performed outpatient Currently available
Endoscopic Spinal Fusion
Minimally invasive fusions promise shorter inpatient stays, faster recovery Currently available
Hip Resurfacing Bone-preserving technique covers osteoarthritis-affected hip joint surfaces with metal implants; easier to revise than hip replacement procedure
Late-stage clinical trials;
available internationally
Kyphoplasty Percutaneous catheter-based procedure treats vertebral compression fractures with cement; restores height using balloon
Currently available
Vertebroplasty Percutaneous catheter-based procedure treats vertebral compression fractures with cement Currently available
Spinal Directed-Energy Therapies
Radio-frequency or thermal energy treat lumbar disc pain caused by degenerative disc disease Currently available
Arthroscopic Rotator Cuff Repair
For subset of patients, minimally invasive shoulder procedure offers quicker recovery; can be performed in ambulatory setting
Currently available
M i n i m a l l y I n v a s i v e S u r g i c a l P r o c e d u r e s
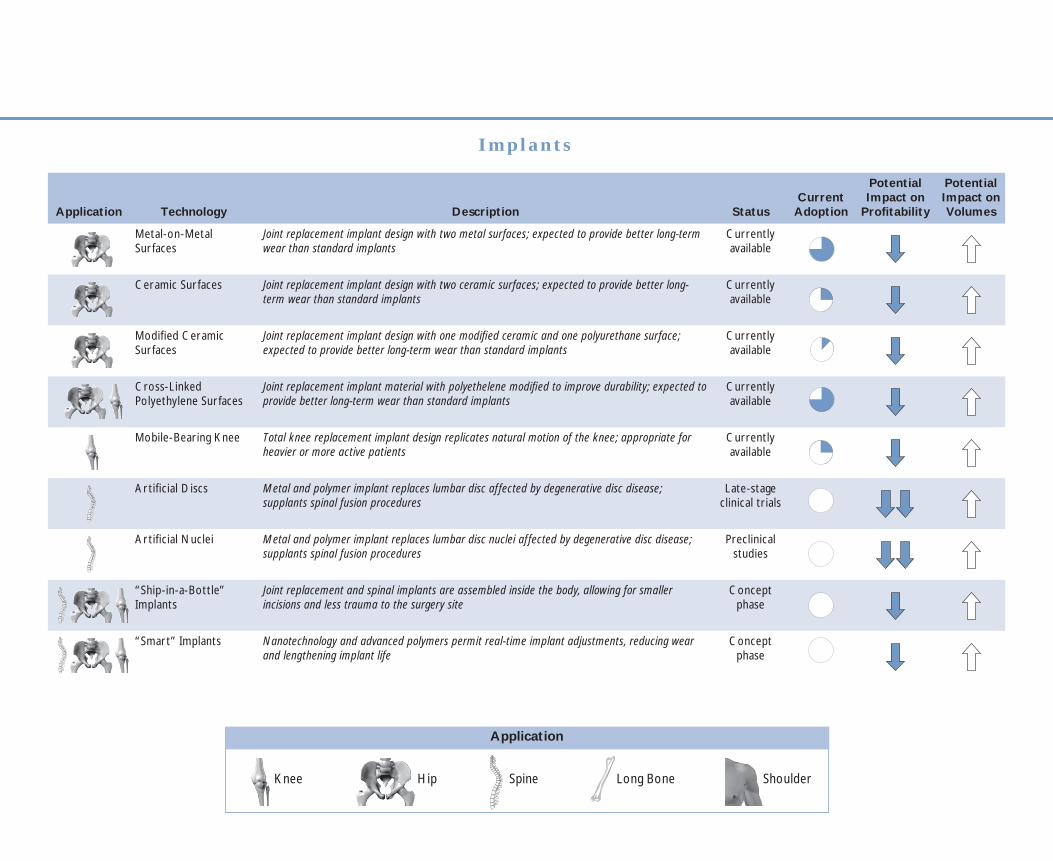
I m p l a n t s
Application Technology Description StatusCurrent
Adoption
Potential Impact on
Profi tability
Potential Impact on Volumes
Metal-on-Metal Surfaces
Joint replacement implant design with two metal surfaces; expected to provide better long-term wear than standard implants
Currently available
Ceramic Surfaces Joint replacement implant design with two ceramic surfaces; expected to provide better long-term wear than standard implants
Currently available
Modifi ed Ceramic Surfaces
Joint replacement implant design with one modifi ed ceramic and one polyurethane surface; expected to provide better long-term wear than standard implants
Currently available
Cross-Linked Polyethylene Surfaces
Joint replacement implant material with polyethelene modifi ed to improve durability; expected to provide better long-term wear than standard implants
Currently available
Mobile-Bearing Knee Total knee replacement implant design replicates natural motion of the knee; appropriate for heavier or more active patients
Currently available
Artifi cial Discs Metal and polymer implant replaces lumbar disc affected by degenerative disc disease; supplants spinal fusion procedures
Late-stage clinical trials
Artifi cial Nuclei Metal and polymer implant replaces lumbar disc nuclei affected by degenerative disc disease; supplants spinal fusion procedures
Preclinical studies
“Ship-in-a-Bottle” Implants
Joint replacement and spinal implants are assembled inside the body, allowing for smaller incisions and less trauma to the surgery site
Concept phase
“Smart” Implants Nanotechnology and advanced polymers permit real-time implant adjustments, reducing wear and lengthening implant life
Concept phase
Application
Long BoneSpine ShoulderKnee Hip

Application Technology Description StatusCurrent
Adoption
Potential Impact on
Profi tability
Potential Impact on Volumes
Autologous Growth Factors
Patient’s own blood or bone marrow is concentrated to harness body’s natural healing compounds
Currently available
Recombinant Growth Factors(Spine)
Bone morphogenic proteins, used in conjunction with a cage implant, speed healing after spinal fusion procedures
Currently available
RecombinantGrowth Factors(Long Bone)
Bone morphogenic proteins accelerate the healing process for poorly healing long-bone fractures usually associated with open fi xation
Late-stage clinical trials;
available under compassionate use program
RecombinantGrowth Factors (Cartilage)
Growth agents stimulate cartilage healing after injury; delays or prevents the onset of osteoarthritis
Animal trials
Autologous Cartilage Transplants
A sample of the patient’s knee cartilage is taken, grown in vitro, and then arthroscopically implanted; now used only in single-area cartilage injuries but hope is for use in osteoarthritis
Currently available
Tissue-Engineered Materials
Tissues—cartilage, ligaments, tendon, or even bone—grown in vitro, then surgically implanted at the affected site
In vitro studies
Embryonic Stem Cells
Stem cells are differentiated to form various musculoskeletal tissue inside the body Animal trials
Gene Therapy
Genes delivered locally to spur healing of musculoskeletal injuries, regeneration of chronic tissue damage
Animal trials
B i o l o g i c s
Adoption
0% 12.5% 25% 50% 75%

Application Technology Description StatusCurrent
Adoption
Potential Impact on
Profi tability
Potential Impact on Volumes
Image-Free Navigation Systems
Computer-powered infrared motion detectors allow surgeons to track implants and patient’s anatomy during joint replacements and spinal surgery; anatomical markers provide calibration
Currently available
Image-Guided Navigation Systems
Preoperative or intra-operative images linked to infrared-monitored implants give surgeons a “virtual” image of the patient’s anatomy during surgery
Currently available
Active Systems (Robotics)
Robots use preoperative protocols established by surgeons to perform task during surgery Clinical trials; available
internationally
C o m p u t e r - A s s i s t e d S u r g e r y
Application Technology Description StatusCurrent
Adoption
Potential Impact on
Profi tability
Potential Impact on Volumes
Viscosupplementation Hyaluronic acid injected into the knee lubricates joint to treat pain caused by osteoarthritis or injury; delays knee replacement
Currently available
Osteoporosis Prevention
Oral drug regimen prevents or delay the onset of osteoporosis; results in signifi cantly fewer fractures
Currently available
Next-Generation Pain Killers
Advanced pain medication allows for better palliation of osteoarthritis symptoms without adverse side effects
Early-stage clinical trials
Osteoarthritis Prevention
Oral pharmaceuticals systemically prevent or delay the onset of osteoarthritis; avoids need for joint replacement surgeries
Concept phase
Degenerative Disc Disease Prevention
Oral pharmaceuticals systemically prevent or delay the onset of degenerative disc disease; results in fewer spinal fusion procedures
Concept phase
M e d i c a l S o l u t i o n s
Strongly Positive Effect (>30%)
No Effect
Strongly Negative Effect (>30%)
Potential Impact
Moderately Positive Effect (8%–30%)
Moderately Negative Effect (5%–30%)

34 Future of Orthopedics
© 2004 The Advisory Board Company
35
© 2004 The Advisory Board Company
Future of Orthopedics
The New Management Ambition
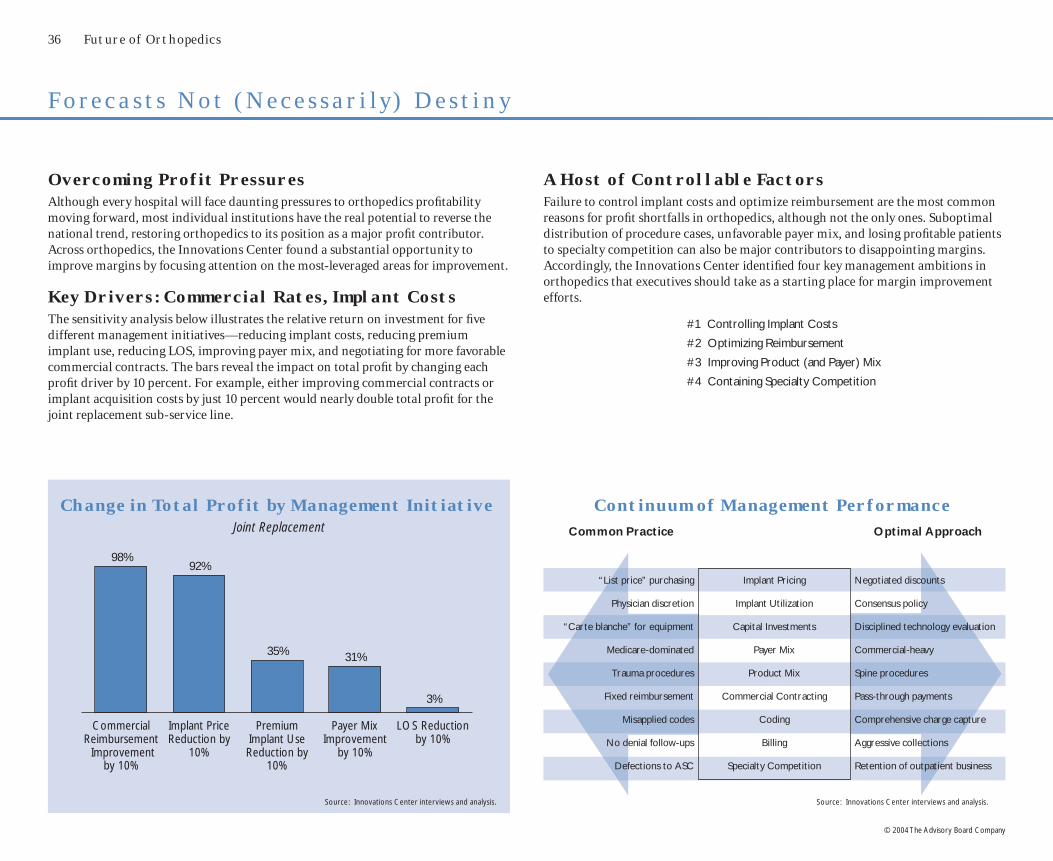
36 Future of Orthopedics
© 2004 The Advisory Board Company
Overcoming Profit PressuresAlthough every hospital will face daunting pressures to orthopedics profi tability moving forward, most individual institutions have the real potential to reverse the national trend, restoring orthopedics to its position as a major profi t contributor. Across orthopedics, the Innovations Center found a substantial opportunity to improve margins by focusing attention on the most-leveraged areas for improvement.
Key Drivers: Commercial Rates, Implant CostsThe sensitivity analysis below illustrates the relative return on investment for fi ve different management initiatives—reducing implant costs, reducing premium implant use, reducing LOS, improving payer mix, and negotiating for more favorable commercial contracts. The bars reveal the impact on total profi t by changing each profi t driver by 10 percent. For example, either improving commercial contracts or implant acquisition costs by just 10 percent would nearly double total profi t for the joint replacement sub-service line.
Continuum of Management Performance
“List price” purchasing Implant Pricing Negotiated discounts
Physician discretion Implant Utilization Consensus policy
“Carte blanche” for equipment Capital Investments Disciplined technology evaluation
Medicare-dominated Payer Mix Commercial-heavy
Trauma procedures Product Mix Spine procedures
Fixed reimbursement Commercial Contracting Pass-through payments
Misapplied codes Coding Comprehensive charge capture
No denial follow-ups Billing Aggressive collections
Defections to ASC Specialty Competition Retention of outpatient business
Common Practice Optimal Approach
A Host of Controllable FactorsFailure to control implant costs and optimize reimbursement are the most common reasons for profi t shortfalls in orthopedics, although not the only ones. Suboptimal distribution of procedure cases, unfavorable payer mix, and losing profi table patients to specialty competition can also be major contributors to disappointing margins. Accordingly, the Innovations Center identifi ed four key management ambitions in orthopedics that executives should take as a starting place for margin improvement efforts.
#1 Controlling Implant Costs
#2 Optimizing Reimbursement
#3 Improving Product (and Payer) Mix
#4 Containing Specialty Competition
F o r e c a s t s N o t ( N e c e s s a r i l y) D e s t i n y
Change in Total Profit by Management InitiativeJoint Replacement
CommercialReimbursement Improvement
by 10%
Implant PriceReduction by
10%
PremiumImplant UseReduction by
10%
Payer MixImprovement
by 10%
LOS Reductionby 10%
98%92%
35% 31%
3%
Source: Innovations Center interviews and analysis. Source: Innovations Center interviews and analysis.
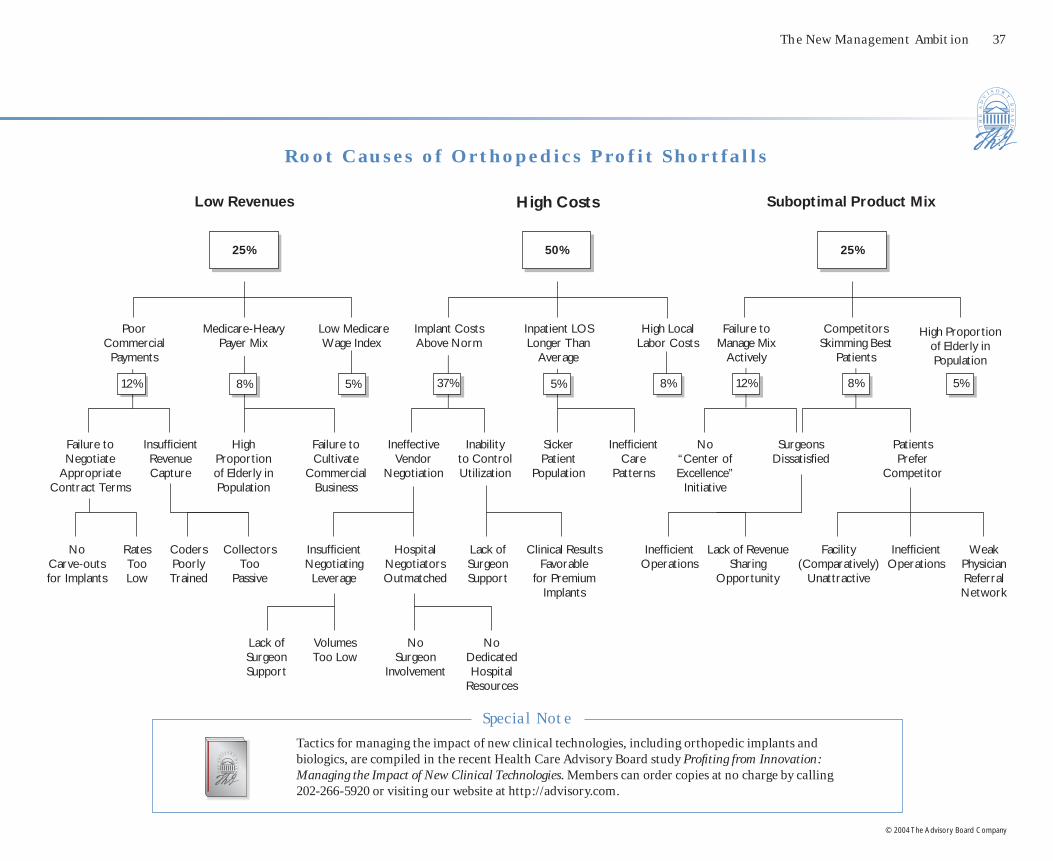
The New Management Ambition 37
© 2004 The Advisory Board Company
Low Revenues High Costs Suboptimal Product Mix
Poor Commercial
Payments
Failure to Negotiate
Appropriate Contract Terms
Medicare-Heavy Payer Mix
Implant Costs Above Norm
Inpatient LOS Longer Than
Average
Failure to Manage Mix
Actively
Competitors Skimming Best
Patients
Insuffi cient Revenue Capture
Failure to Cultivate
Commercial Business
Ineffective Vendor
Negotiation
Inability to Control Utilization
Ineffi cient Care
Patterns
No “Center of Excellence”
Initiative
Surgeons Dissatisfi ed
Patients Prefer
Competitor
No Carve-outs for Implants
Rates Too Low
Coders Poorly Trained
Collectors Too
Passive
Insuffi cient Negotiating
Leverage
Hospital Negotiators Outmatched
Lack of Surgeon Support
Clinical Results Favorable
for Premium Implants
Ineffi cient Operations
Lack of Revenue Sharing
Opportunity
Facility (Comparatively)
Unattractive
Ineffi cient Operations
Weak Physician Referral Network
Lack of Surgeon Support
No Surgeon
Involvement
No Dedicated Hospital
Resources
12% 12%8% 5% 5% 8% 8% 5%37%
25%
Low Medicare Wage Index
High Local Labor Costs
High Proportion of Elderly in Population
High Proportion of Elderly in Population
Sicker Patient
Population
Volumes Too Low
50% 25%
R o o t C a u s e s o f O r t h o p e d i c s P r o f i t S h o r t f a l l s
Special Note
Tactics for managing the impact of new clinical technologies, including orthopedic implants and biologics, are compiled in the recent Health Care Advisory Board study Profi ting from Innovation: Managing the Impact of New Clinical Technologies. Members can order copies at no charge by calling 202-266-5920 or visiting our website at http://advisory.com.

38 Future of Orthopedics
© 2004 The Advisory Board Company
StandardModel
PremiumModel
$5,307
$3,917
$7,096
$5,387
A m b i t i o n # 1 — C o n t r o l l i n g I m p l a n t C o s t s
Negotiating Discounts Is First StepThe fi rst step in managing orthopedic implant costs is to attempt to reduce the price paid for each implant. Although manufacturers publish list prices annually, most hospitals pay a lower price; negotiating for price discounts in exchange for volume or market share guarantees is an accepted industry practice. Still, a surprisingly large group of institutions simply pay list prices for implants. The reasons for this failure to negotiate are varied, but seldom insurmountable. If nothing else, hospitals currently paying list price or receiving a token reduction through a group purchasing program should investigate the possibility of negotiating discounts directly with manufacturers.
Limiting Vendors a Powerful LeverVendors are often more willing to give price discounts in exchange for guarantees of volumes or market share. In practice, this often requires hospitals to limit the number of manufacturers from which they purchase implants. This type of standardization appears to get results at the negotiating table: a survey of 61 hospital orthopedics programs showed a strong correlation between the number of vendors used and the magnitude (and direction) of implant cost changes.
Average Hip Implant Prices2002
1
2 3 4 5+
(3%)
8%9%
12%14%
Sizable Reductions PossibleHospitals have the potential to reduce their costs signifi cantly by pursuing preferred pricing from vendors. Based on manufacturers’ 2002 implant list prices and the average selling prices paid in a survey of hospitals the same year, hospitals can reasonably expect to receive a discount of 20 to 25 percent off of the manufacturers’ list. Actual discounts received depend upon a multitude of factors; individual institutions may achieve discount levels much lower or higher than the average.
50%
40%
10%
Pay List Price
Utilize Group Purchasing Discounts
Negotiate Individually
List Price
Actual Price
Signifi cant discount from list price
Hospitals Negotiating Implant Prices2002
Average Joint Implant Cost IncreaseBy Number of Vendors Used, 2002
Source: Innovations Center interviews and analysis
Source: Orthopedic Network News, Ann Arbor, Mich.
Source: Orthopedic Network News, Ann Arbor, Mich.

The New Management Ambition 39
© 2004 The Advisory Board Company
An Intimate Relationship
“[Sales representatives] see the physician as their customer, not the hospital. They look at the hospital just as a place to conduct business. The rep has a better relationship with the surgeon than the hospital does.”
Scott Crandall Senior Product Manager Novation
Also Important —Reducing Use of Premium ModelsIn the future, regulating what types of implants should be used, not just which manufacturers to buy from, will be necessary to stem the tide of implant expenses. Premium-level orthopedic implants can cost thousands of dollars more than standard models, while their benefi ts may not be appropriate for every patient. On the whole, doctors—and patients—are reluctant to use implants that may not offer the absolute best clinical outcomes. That said, many institutions have made substantial progress toward reducing implant costs by getting orthopedists to decide on appropriate use of premium implants. Even some prominent academic orthopedic departments, where early adoption of advanced technologies is encouraged, have acted to limit the use of premium-level implants to the most appropriate patients.
Participation of Surgeons Is CriticalWithout surgeon involvement and agreement, efforts to standardize implants are doomed to failure—or else to alienate the surgeons on staff. Moreover, at the negotiating table, the presence of high-volume surgeons signals hospital commitment to standardization efforts and increases the likelihood that vendors will provide some relief.
Surgeons can also be a nearly insurmountable obstacle to implant cost control efforts. A major cause of surgeons’ recalcitrance is the strong ties they have with manufacturers, and in particular with sales representatives. It is routine practice for orthopedic salespeople to be present in the operating room for surgical procedures, for instance. Several leading institutions have addressed manufacturer-surgeon entanglements head-on by instituting policies that restrict vendor access to hospital facilities.
Technology Clinical Benefi ts Additional Cost
Metal-on-metal hips Increased durability $2,500
Ceramic hips Increased durability $2,500
Oxinium kneesIncreased durability
and strength$2,000
Mobile-bearing kneesIncreased durability,
better range of motion$700
Growth factors(spine)
Faster healing $3,000–$6,000
Growth factors (fracture)
Faster healing $3,000–$6,000
Premium Implants in Orthopedics
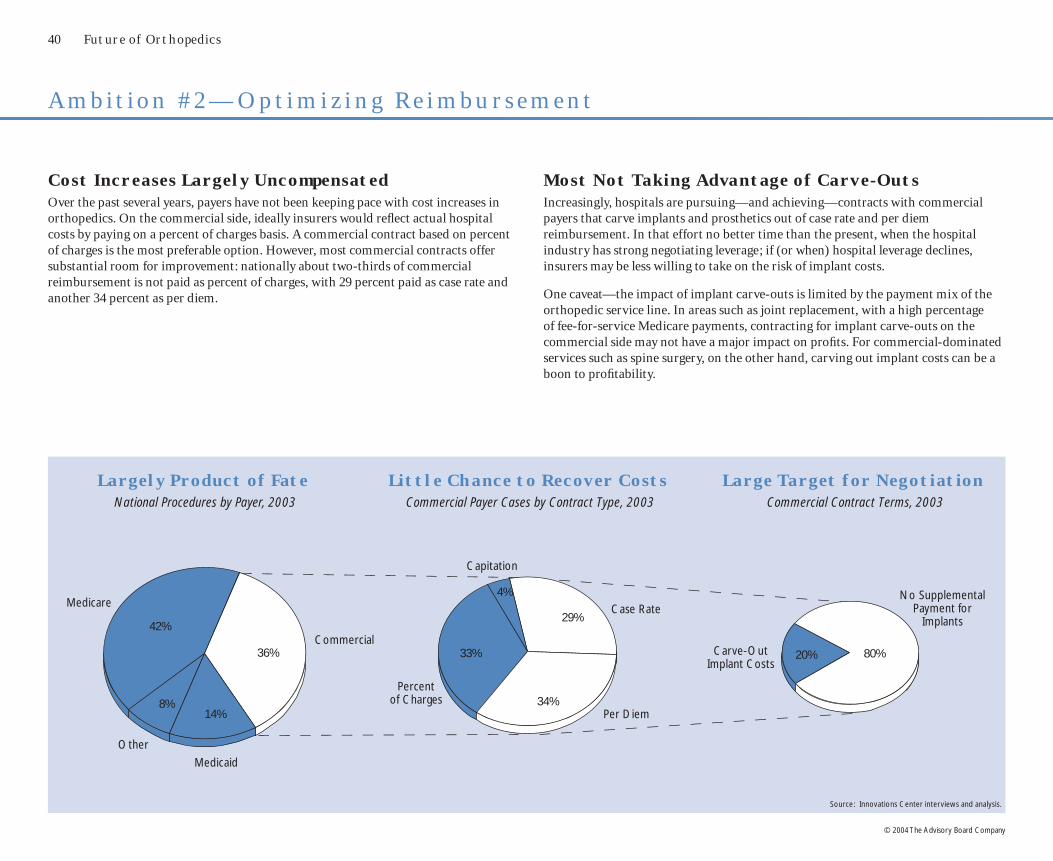
40 Future of Orthopedics
© 2004 The Advisory Board Company
A m b i t i o n # 2 — O p t i m i z i n g R e i m b u r s e m e n t
Cost Increases Largely UncompensatedOver the past several years, payers have not been keeping pace with cost increases in orthopedics. On the commercial side, ideally insurers would refl ect actual hospital costs by paying on a percent of charges basis. A commercial contract based on percent of charges is the most preferable option. However, most commercial contracts offer substantial room for improvement: nationally about two-thirds of commercial reimbursement is not paid as percent of charges, with 29 percent paid as case rate and another 34 percent as per diem.
Most Not Taking Advantage of Carve-OutsIncreasingly, hospitals are pursuing—and achieving—contracts with commercial payers that carve implants and prosthetics out of case rate and per diem reimbursement. In that effort no better time than the present, when the hospital industry has strong negotiating leverage; if (or when) hospital leverage declines, insurers may be less willing to take on the risk of implant costs.
One caveat—the impact of implant carve-outs is limited by the payment mix of the orthopedic service line. In areas such as joint replacement, with a high percentage of fee-for-service Medicare payments, contracting for implant carve-outs on the commercial side may not have a major impact on profi ts. For commercial-dominated services such as spine surgery, on the other hand, carving out implant costs can be a boon to profi tability.
14%8%
42%
36% 33%
4%
29%
34%
80%20%
Large Target for NegotiationCommercial Contract Terms, 2003
Little Chance to Recover CostsCommercial Payer Cases by Contract Type, 2003
Largely Product of FateNational Procedures by Payer, 2003
Medicaid
Commercial
Medicare
Other
Percentof Charges
Per Diem
Case Rate
Capitation
Carve-Out Implant Costs
No Supplemental Payment for
Implants
Source: Innovations Center interviews and analysis.

The New Management Ambition 41
© 2004 The Advisory Board Company
Carve-Outs Improving Commercial RevenuesUnder the terms of implant carve-out contracts, orthopedic implants are paid for on a “pass-through” basis, typically at approximately sixty percent of charges. These pass-through payments usually result in a substantial net gain in procedure profi tability. Moreover, pass-through arrangements mitigate hospitals’ risk for future implant price increases; as long as the agreement remains in place, insurers, not hospitals, will be at fi nancial risk for rising implant costs. (The same effect can be achieved by carving out the entire reimbursement for an orthopedic procedure, not just the implant costs alone, on a percent-of-charges basis.)
Reimbursement Costs
$7,500
$6,500
$4,000
$10,500
Reimbursement Costs
$7,500
$4,000$11,500
$6,500
$4,000
$10,500
Projected Impact of Implant Carve-OutsTypical Hip Replacement Case, Commercial Payer
Before Car ve -Outs
Af ter Car ve -Outs
$3,000net loss
$1,000net profi t
Carve-Out
Per Diem
Per Diem (5 days at$1,500 per day)
Implants
Other
Implants
Other
Expanding Stop-Loss for Short-Stay ProceduresNew, less-invasive techniques and innovations in implant design are simultaneously lowering length of stay and increasing costs. As a result, many procedures incur costs that far exceed per diem reimbursement levels. In per diem contracts, leading hospitals are instituting provisions triggering stop-loss terms for short-stay, high-cost procedures invasive surgery.
“If stay is three days or less and charges exceed an average of $4,000 per day, reimbursement for that stay only will be at a 40 percent discount from charges in lieu of the per diem rate.”
New Contractual Language
DRG Description LOSTotal
ChargesCharges per Day
219 Lower extreme & humer proc except hip, foot, femur age >17 w/o cc
2.7 $12,978 $4,806
224 Shoulder, elbow or forearm proc, exc major joint proc, w/o cc
1.7 $9,872 $5,929
225 Foot procedures 2.9 $12,706 $4,236
227 Soft tissue procedures w/o cc 2.2 $10,003 $4,623
229 Hand or wrist proc, except major joint proc, w/o cc
1.9 $8,652 $4,593
232 Arthroscopy 1.9 $10,362 $5,515
291 Major joint & limb reattachment procedures of upper extremity
2.8 $19,981 $7,125
498 Spinal fusion w/o cc 2.5 $22,694 $8,949
500 Back & neck procedures except spinal fusion w/o cc
1.8 $10,430 $5,695
503 Knee procedures w/o pdx of infection 2.2 $13,956 $6,389

42 Future of Orthopedics
© 2004 The Advisory Board Company
$1,045
$862
$725$624
$515 $478$419
$274
A m b i t i o n # 3 — I m p r o v i n g P r o d u c t a n d P a y e r M i x
Not All Breadwinners the SameOne lever hospitals have for improving margins is shifting the composition of their orthopedic staff. The fi nancial contribution of some sub-specialists is considerably better than others —spine surgeons, for example, earn three times more in contribution profi t for the hospital than orthopedists who heavily focus on medical cases.
Contribution Profits per DayNational Inpatient Medicare, 2001
Some Payers (Much) Better Than Others The imperative to manage payer mix derives from a simple truth—some payers reimburse at better rates than others. As a result, orthopedic programs with a favorable payer mix often report signifi cantly better fi nancial performance than those with less desirable payers. Specifi cs vary from market to market, but frequently workers’ compensation and commercial insurers pay the highest rates, followed by Medicare, with Medicaid (and of course uncompensated care) trailing behind. Data from one academic medical center in the Midwest illustrates the striking disparities between payers, with workers’ compensation paying nearly three times what Medicaid provides.
Inpatient Surgery Reimbursementas Percentage of Charges
Academic Medical Center
Medicaid Medicare HMO “A” Blue Cross WorkersComp
26%33%
45%53%
76%
‘
Spine General Ortho
(Surgical)
Hand Foot Joint Fracture Care
(Surgical)
General Ortho
(Medical)
Fracture Care
(Medical)
Source: Innovations Center Futures Database. Source: Innovations Center interviews.

The New Management Ambition 43
© 2004 The Advisory Board Company
Marketing Services to Select PatientsBeyond surgeon recruitment, a number of leading institutions have been successful at selectively growing volumes within orthopedic subspecialties through marketing initiatives. Some have had success with consumer advertising campaigns alone, but the centerpiece of targeted marketing approaches is frequently the establishment of specialized centers—joint centers, spine centers, or sports medicine centers being some of the most popular options. Specialized subspecialty programs offer clear brand defi nition for consumers, as well as providing a single point of entry for patients. Moreover, creating dedicated centers for particular procedures often spurs operational improvements, motivating surgeons and staff to streamline care protocols and redouble cost control efforts.
Fine-Tuning Payer MixExecutives often see payer mix as an attribute of the local market, rather than a controllable factor. At worst, the idea of managing payer mix can carry the connotation of failing to serve the most vulnerable members of the community—a course none could recommend in good conscience. However, individual institutions have the real potential to infl ect payer mix without compromising mission or values by actively growing volumes associated with the most profi table payers. This effort could take the form of emphasizing service offerings that strongly favors a commercial-age population, such as spine surgery; alternatively, institutions could actively reach out to patient populations—or employers—associated with more profi table reimbursement.
Representative Tactics for Shifting Payer Mix
� Workers’ Compensation Liaison
Orthopedics program hires dedicated staff member to manage relationships with state workers’ compensation program and local employers; goal is to grow volumes of workers’ comp patients
� Active Employer Outreach
Orthopedics program markets “Return to Work Program”—quick recovery protocols and advanced rehab capabilities for joint and spine surgeries—to local employers; goal is to capture disproportionate share of commercia1-insured patients
� Boomer-Focused Marketing
Hospital highlights innovative technologies, surgeons, and facilities, and aggressively markets to active Baby Boomers —featuring minimally invasive joint and back surgery, for example; goal is to maximize market share of the growing commercial-insured population
Common Orthopedic Specialty Centers
Description Multidisciplinary program for treating back and spine condition
Spine Center
Typical Services
• Spinal fusion• Discectomy• Outpatient rehabilitation• Pain management
Joint Replacement Center
Patient-focused joint program includes pre- and post-operative therapy as well as inpatient component
• Knee replacement• Hip replacement• Outpatient rehabilitation• Post-surgical evaluation
Sports Medicine Center
Description Comprehensive provider of sports medicine services; targets professional, high school, and weekend athletes
Typical Services
• Knee arthroscopy• Outpatient rehabilitation• Bracing and orthotics• Gait analysis

44 Future of Orthopedics
© 2004 The Advisory Board Company
New Outpatient Orthopedic Procedures
A m b i t i o n # 4 — C o n t a i n i n g S p e c i a l t y C o m p e t i t i o n
Outsized ASC Risk for OrthopedicsWhile non-hospital competition for outpatient business is a familiar story for most hospitals, orthopedics has risen to the forefront of outpatient competition issues in recent years. Offerings such as ophthalmology and chemotherapy have almost entirely moved from hospital outpatient facilities to ASCs and physician offi ces. While this fi rst exodus from the hospital outpatient setting is largely over, a second wave of businesses has begun to shift out of the hospital and into ASCs, in which orthopedics is on the vanguard of this new generation of hospital outpatient émigrés.
Outpatient Volume Trends1999–2001
Dec
line
in H
ospi
tal S
hare
Radiology
Orthopedics
Gastroenterology
ENT
Urology
Gynecology
Ophthalmology Chemotherapy
Total Volume Growth
10%
0%
25%0%
Note: Bubble size corresponds to total volumes.
New Technologies, Codes Are Boons for ASCsThe same innovations that originally spurred the outpatient revolution in orthopedics—minimally invasive techniques featuring endoscopes and laparoscopes—are now being refi ned for applications other than the knee, including other joints, spinal fusion, and discectomies. Many of these new applications are short-stay inpatient procedures; however, as more procedures migrate outpatient the target for competition grows ever larger. Exacerbating the situation, more CPT codes are being added to the Medicare ASC fee schedule for orthopedics than any other service line, allowing ASCs to compete for even more procedures that were once secure in the hospital outpatient setting.
• Vertebroplasty/Kyphoplasty
• Arthroscopic Rotator Cuff Repair
• Arthroscopic Ligament Reconstruction
• Unispacer Knee Implant
New ASC Codes, 2003
Dermato
logy
Oph
thalm
ology GI
Gynec
ology
ENT
Plasti
c Sur
gery
Gener
al Su
rger
yUro
logy
Orth
oped
ics
Neuro
scien
ceCard
iovas
cular
49 11 13 16 17
2531 31
46
62
Source: Innovations Center Futures Database.
Nove l ProceduresInpat ient Procedures
on the Br ink
• Unicompartmental Knee
• Spinal Fusions
• Discectomies
• Ankle Reconstruction
Source: Centers for Medicare and Medicaid Services.
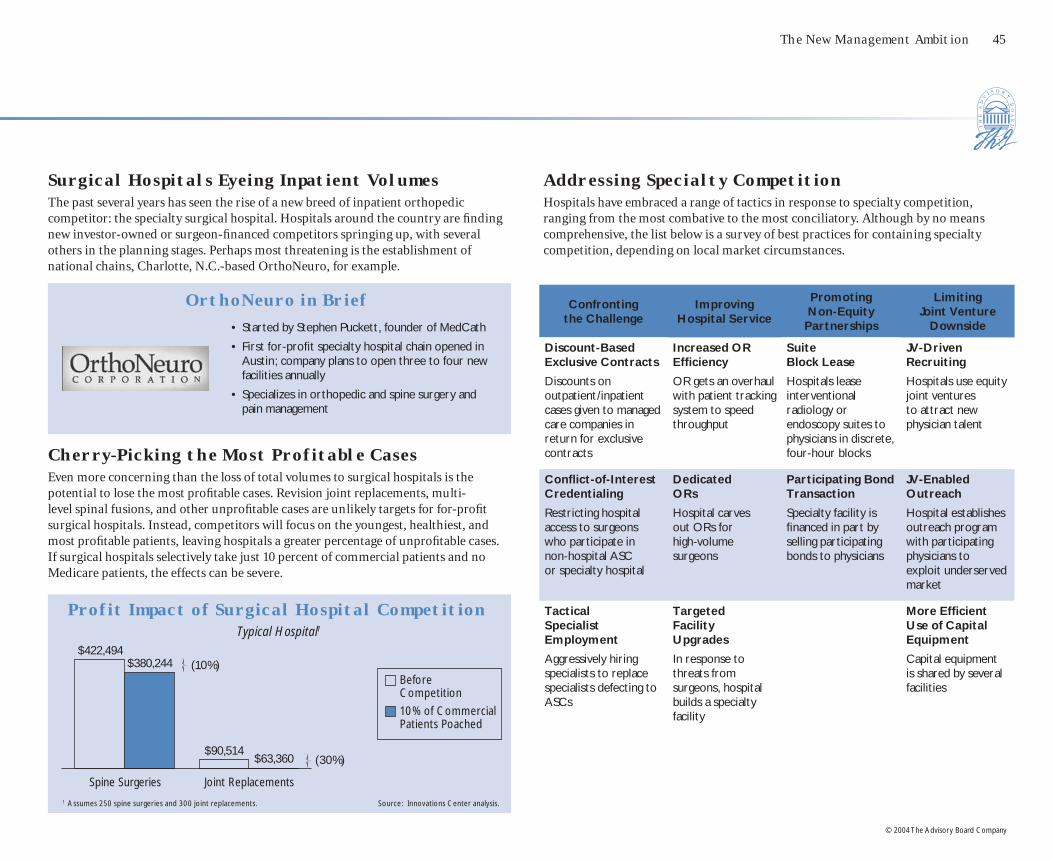
The New Management Ambition 45
© 2004 The Advisory Board Company
Surgical Hospitals Eyeing Inpatient VolumesThe past several years has seen the rise of a new breed of inpatient orthopedic competitor: the specialty surgical hospital. Hospitals around the country are fi nding new investor-owned or surgeon-fi nanced competitors springing up, with several others in the planning stages. Perhaps most threatening is the establishment of national chains, Charlotte, N.C.-based OrthoNeuro, for example.
Cherry-Picking the Most Profitable CasesEven more concerning than the loss of total volumes to surgical hospitals is the potential to lose the most profi table cases. Revision joint replacements, multi-level spinal fusions, and other unprofi table cases are unlikely targets for for-profi t surgical hospitals. Instead, competitors will focus on the youngest, healthiest, and most profi table patients, leaving hospitals a greater percentage of unprofi table cases. If surgical hospitals selectively take just 10 percent of commercial patients and no Medicare patients, the effects can be severe.
OrthoNeuro in Brief
• Started by Stephen Puckett, founder of MedCath
• First for-profi t specialty hospital chain opened in Austin; company plans to open three to four new facilities annually
• Specializes in orthopedic and spine surgery and pain management
Profit Impact of Surgical Hospital Competition Typical Hospital1
Spine Surgeries Joint Replacements
$422,494$380,244
$90,514$63,360
(10%)
(30%)
Addressing Specialty CompetitionHospitals have embraced a range of tactics in response to specialty competition, ranging from the most combative to the most conciliatory. Although by no means comprehensive, the list below is a survey of best practices for containing specialty competition, depending on local market circumstances.
Confronting the Challenge
Improving Hospital Service
Promoting Non-Equity
Partnerships
Limiting Joint Venture
Downside
Discount-Based Exclusive Contracts
Discounts on outpatient/inpatient cases given to managed care companies in return for exclusive contracts
Increased OR Effi ciency
OR gets an overhaul with patient tracking system to speed throughput
Suite Block Lease
Hospitals lease interventional radiology or endoscopy suites to physicians in discrete, four-hour blocks
JV-Driven Recruiting
Hospitals use equity joint ventures to attract new physician talent
Confl ict-of-Interest Credentialing
Restricting hospital access to surgeons who participate in non-hospital ASC or specialty hospital
Dedicated ORs
Hospital carves out ORs for high-volume surgeons
Participating Bond Transaction
Specialty facility is fi nanced in part by selling participating bonds to physicians
JV-Enabled Outreach
Hospital establishes outreach program with participating physicians toexploit underserved market
Tactical Specialist Employment
Aggressively hiring specialists to replace specialists defecting to ASCs
Targeted Facility Upgrades
In response to threats from surgeons, hospital builds a specialty facility
More Effi cient Use of Capital Equipment
Capital equipment is shared by several facilities
Source: Innovations Center analysis.1 Assumes 250 spine surgeries and 300 joint replacements.
Before Competition
10% of Commercial Patients Poached

46 Future of Orthopedics
© 2004 The Advisory Board Company
K e y C o n s i d e r a t i o n s f o r O r t h o p e d i c s S t r a t e g y i n t h e D e c a d e A h e a d
Key Attributes Key Considerations
Patient Volumes • Market share paramount: #1 or #2 in local market share key to contracting, branding leverage
• Market movers: New technology, dedicated specialty centers, physician renown, service excellence
• No volume threshold: No defi nitive evidence of volume-outcomes or volume-profi t relationships
Key Lines of Business • Top profi t drivers: Spine and sports
• Secondary keys to success: Joint replacement, hand surgery, foot and ankle surgery, pain management
Technology Investment • Mission critical: Minimally invasive surgery
• Physician recruiting/retention tool: Computer-aided surgery
• New market makers: Kyphoplasty, vertebroplasty, unicompartmental knee replacement, hip resurfacing
Facility Investment • Inpatient: Dedicated space and staff, ranging from dedicated ORs to standalone specialty hospitals
• Outpatient: Freestanding ortho ambulatory centers, with ORs, imaging, rehab, sports complex, physician offi ces
Academic Research • Top distinction: Becoming innovator in new era of biologicals—Growth factors, gene-based therapies, tissue engineering, stem cell research
Clinical Research • Clinical outcomes in minimally invasive surgery—Hip and knee replacement, non-traditional arthroscopy
• Clinical outcomes in new spine procedures—Kyphoplasty, vertebroplasty, artifi cial discs
• Future prospects: Application of biologics to clinical practice
D e f i n i n g a n O r t h o p e d i c s C e n t e r o f E x c e l l e n c e
In Search of Drivers of DifferentiationOrthopedics is regarded by many hospitals as a “bread-and-butter” service—robust volumes with patients (and referring physicians) perceiving little difference from hospital to hospital, or surgeon to surgeon. As a result, shifting market share often rests upon the ability to successfully brand and market oneself as a “center of excellence,” either as an entire service line or as key profi table niches (spine centers, sports centers, Baby Boomer joint camps). The key question here for hospital executives to ask: “What represents an orthopedics center of excellence—not just today, but fi ve and ten years from now?” Summarized below are some key attributes for consideration.
Orthopedic Center of Excellence

The New Management Ambition 47
© 2004 The Advisory Board Company
Management Ambitions Core Competencies Key Questions
Controlling Implant Costs
• Negotiating with vendors
• Standardizing physician choice
• Managing premium mix
• Do we pay below list price for the majority of implants? Who at our institution has responsibility for price negotiation and utilization review?
• Have we established guidelines for standardizing physician choice for commonly used implants?
• Do we limit the involvement of manufacturer sales representatives in real-time implant purchasing decisions (e.g., in the operating room)?
Optimizing Reimbursement
• Contracting with insurers
• Creating carve-outs, stop-loss provisions
• Perfecting revenue capture
• Have we conducted a profi tability-by-payer analysis?
• Have we maximized our contract revenues with commercial insurers for orthopedic services?
• Do we have agreements with commercial insurers to pay for implant costs on a pass-through or percent-of-charges basis?
Marketing the Program
• Attracting Baby Boomer share
• Leveraging patient consumerism with new technology
• Branding destination center through service excellence
• Do we have a market opportunity to brand our orthopedics services as a “center of excellence”?
• Have we considered dedicating (additional) resources to specialty programs (e.g., spine center, sports center, Baby Boomer joint camp)—and what is the expected return on investment?
• Are our orthopedic surgeons more academic (favoring research-oriented, high-acuity musculoskeletal institutes) or more entrepreneurial (favoring high-volume, high-effi ciency specialty surgery centers)?
Managing Physician Relations
• Understanding relative drivers of physician (dis)satisfaction—income, autonomy, operational effi ciency, dedicated space and staff, technology investment, conducive research environment
• What is the current state of our relationship with our orthopedic surgeons? Do we understand the drivers of physician (dis)satisfaction?
• Do our orthopedic surgeons participate in, or are they planning, a freestanding ambulatory surgery center? Have we considered joint venturing with, or employing, orthopedic surgeons?
• Is our market vulnerable to the entry of a specialty orthopedics hospital—is one already planned?
Managing the Service Line for Profitable GrowthWhile determining what constitutes a center of excellence may be challenging in and of itself, the next set of immediate questions—“How do we get there? How do we ensure a profi table course?”—is where the real work begins. Provided below is a summary of the key management ambitions discussed in this brief, accompanied by core competencies necessary to successfully manage the orthopedics service line in the future. In the full-length Future of Orthopedics service line report, additional diagnostic worksheets, benchmarking tools, and technology adoption report cards will help member institutions further assess their market circumstances and chart an optimal course for future orthopedics strategy.
C o r e C o m p e t e n c i e s f o r F u t u r e S u c c e s s

48
© 2004 The Advisory Board Company

health care advisory board � the advisory board companyThe Watergate � 600 New Hampshire Avenue, NW � Washington, DC 20037
Telephone: 202-266-5600 � Facsimile: 202-266-5700 � http://advisory.com
10948
Images courtesy of Corbis Images, The Bridgeman Art Library, and Photodisc.