thames tunnel – aquatic ecology - university of …...devon (otter) catchment habitat surveys....
TRANSCRIPT
i
Environment Agency
_________________________
DEVON (OTTER) CATCHMENT
HABITAT SURVEYS
_________________________
REPORT
January 2012
APEM Reference: 411790b
APEM 411790b – Scientific report to the EA
ii
CLIENT Environment Agency
ADDRESS Exminster House
Miller Way
Exminster
EX6 8AS
PROJECT No 411790b
DATE OF ISSUE January 2012
PROJECT DIRECTOR Dr David Fraser
PROJECT MANAGER Peter Dennis
REPORT AUTHOR Tommy McDermott
FIELD TEAM Peter Dennis
Thomas House
Joseph Thurgate
Laura Turnbull
Rosalind Jukes
Robert Moores
GIS Elisa Anderson
Sam Andrews
This report should be cited as: APEM (2012). Devon (Otter)
Catchment Habitat Surveys. APEM scientific report prepared for the
Environment Agency, Exminster. 40pp.
APEM LTD
FBA Aquatic Ecology Laboratories,
East Stoke Wareham,
BH20 6BB
Tel: 01929405430
Registered in England No. 2530851
Website: http://www.apemltd.co.uk

APEM 411790b – Scientific report to the EA
iii
APEM 411790b – Scientific report to the EA
iv
Contents
Contents
1 INTRODUCTION ................................................................................................................... 1
1.1 BACKGROUND......................................................................................................................................... 1 1.2 OBJECTIVES ............................................................................................................................................ 1
2 CATCHMENT LOCATION. ................................................................................................. 2
3 METHODOLOGY .................................................................................................................. 3
3.1 HABITAT WALKOVER ............................................................................................................................. 3 3.2 SEDIMENT SOURCES ................................................................................................................................ 5 3.3 ANALYSIS ............................................................................................................................................... 7
4 FIELD WALKOVER SURVEY RESULTS ......................................................................... 9
4.1 OTTER CATCHMENT OVERVIEW ............................................................................................................. 9 4.2 OTTER LOWER WATERBODY ................................................................................................................ 11
4.2.1 Main Stem ........................................................................................................... 11
4.2.2 Lower Otter Tributaries. ..................................................................................... 13 4.3 MID OTTER WATERBODY. .................................................................................................................... 14
4.3.1 Main stem............................................................................................................ 14 4.3.2 Tributaries ........................................................................................................... 16
4.4 UPPER OTTER WATERBODY. ................................................................................................................. 16 4.5 RIVER WOLF. ........................................................................................................................................ 18
4.5.1 Main stem............................................................................................................ 18
4.5.2 Tributaries. .......................................................................................................... 20 4.6 RIVER LOVE WATERBODY .................................................................................................................... 20
4.6.1 Main stem............................................................................................................ 20
4.6.2 Tributaries. .......................................................................................................... 22 4.7 DIVERSITY INDICES. .............................................................................................................................. 23 4.8 ASSOCIATION OF WALKOVER FEATURES AND CATCHMENT SECTIONS. .................................................. 24
5 DISCUSSION ........................................................................................................................ 30
6 CONCLUSIONS .................................................................................................................... 33
7 REFERENCES. ..................................................................................................................... 33
8 APPENDICES ....................................................................................................................... 35
APPENDIX A: WALKOVER OUTPUT FEATURES. .................................................................................................. 35
1 INTRODUCTION
1.1 Background
The River Otter rises in the Blackdown Hills on the Devon and Somerset border and flows in a
southerly direction through east Devon to the coast at Budleigh Salterton. The Otter Valley is
predominantly a rural area, supporting a large number of cattle, dairy and sheep farms. There are
also a number of abstraction boreholes in the aquifers underlying the Otter catchment, located
around the middle and lower reaches of the catchment. Much of the valley lies within the east
Devon Area of Outstanding Natural Beauty. The tidal estuary of the River Otter is a Site of
Special Scientific Interest (SSSI), designated for the wide range of saltmarsh communities it
supports and the abundance and diversity of breeding and overwintering bird species it supports.
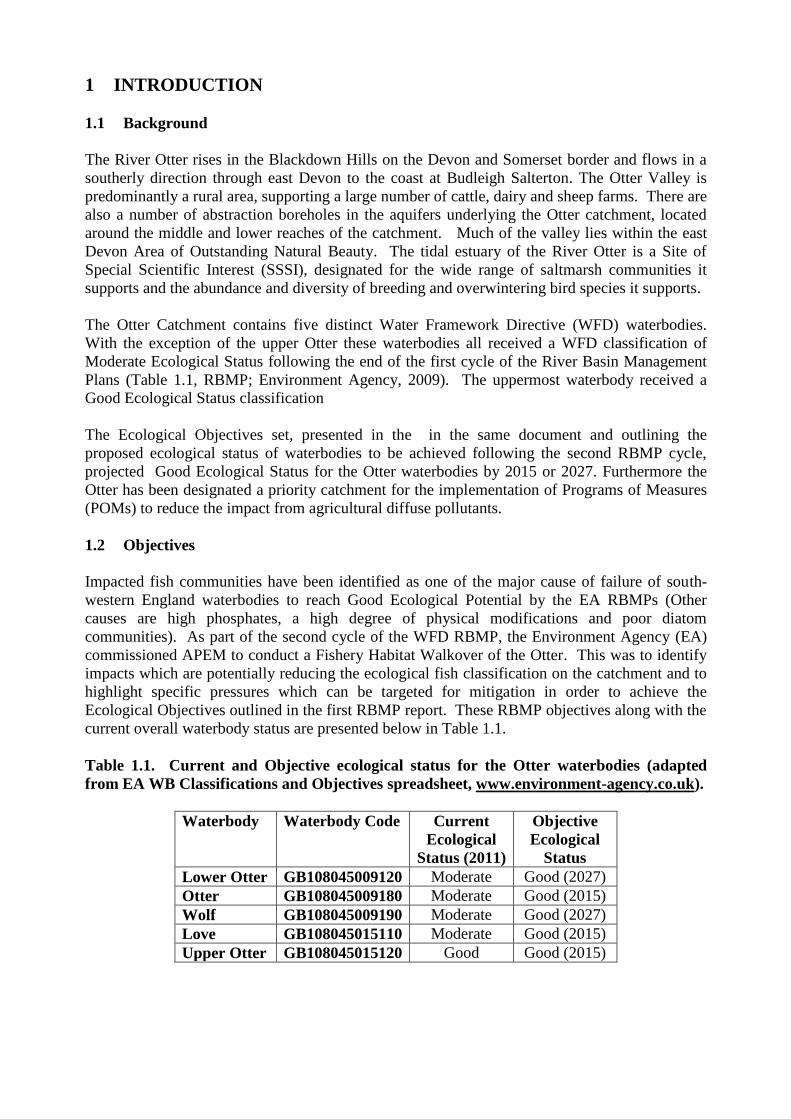
The Otter Catchment contains five distinct Water Framework Directive (WFD) waterbodies.
With the exception of the upper Otter these waterbodies all received a WFD classification of
Moderate Ecological Status following the end of the first cycle of the River Basin Management
Plans (Table 1.1, RBMP; Environment Agency, 2009). The uppermost waterbody received a
Good Ecological Status classification
The Ecological Objectives set, presented in the in the same document and outlining the
proposed ecological status of waterbodies to be achieved following the second RBMP cycle,
projected Good Ecological Status for the Otter waterbodies by 2015 or 2027. Furthermore the
Otter has been designated a priority catchment for the implementation of Programs of Measures
(POMs) to reduce the impact from agricultural diffuse pollutants.
1.2 Objectives
Impacted fish communities have been identified as one of the major cause of failure of south-
western England waterbodies to reach Good Ecological Potential by the EA RBMPs (Other
causes are high phosphates, a high degree of physical modifications and poor diatom
communities). As part of the second cycle of the WFD RBMP, the Environment Agency (EA)
commissioned APEM to conduct a Fishery Habitat Walkover of the Otter. This was to identify
impacts which are potentially reducing the ecological fish classification on the catchment and to
highlight specific pressures which can be targeted for mitigation in order to achieve the
Ecological Objectives outlined in the first RBMP report. These RBMP objectives along with the
current overall waterbody status are presented below in Table 1.1.
Table 1.1. Current and Objective ecological status for the Otter waterbodies (adapted
from EA WB Classifications and Objectives spreadsheet, www.environment-agency.co.uk).
Waterbody Waterbody Code Current
Ecological
Status (2011)
Objective
Ecological
Status
Lower Otter GB108045009120 Moderate Good (2027)
Otter GB108045009180 Moderate Good (2015)
Wolf GB108045009190 Moderate Good (2027)
Love GB108045015110 Moderate Good (2015)
Upper Otter GB108045015120 Good Good (2015)

APEM 411790b – Scientific report to the EA
2
2 CATCHMENT LOCATION.
A map of the River Otter with the extent of the relevant waterbodies is shown in Figure 2.1
below.
Figure 2.1. The River Otter.
APEM 411790b – Scientific report to the EA
3
3 METHODOLOGY
3.1 Habitat Walkover
The methodology for the walkover survey followed that outlined in the EA’s Fisheries Technical
Manual 4 “Restoration of Riverine Salmon Habitats” (Hendry & Cragg-Hine 1997). The field
mapping technique is based upon hand annotation of high-resolution map (OS 1 km tiles) at a
scale of 1:10,000. The river outline and salient geographic location points are selected from a
digital map and printed onto water resistant paper (roughly 300-500m of river length per A3
sheet). These maps offer a high level of detail, enabling very accurate mapping of in-river habitat
characteristics.
The habitat features noted along the stretch of the river are drawn directly onto the map, with the
boundaries of the different habitat classifications being drawn to represent their actual position
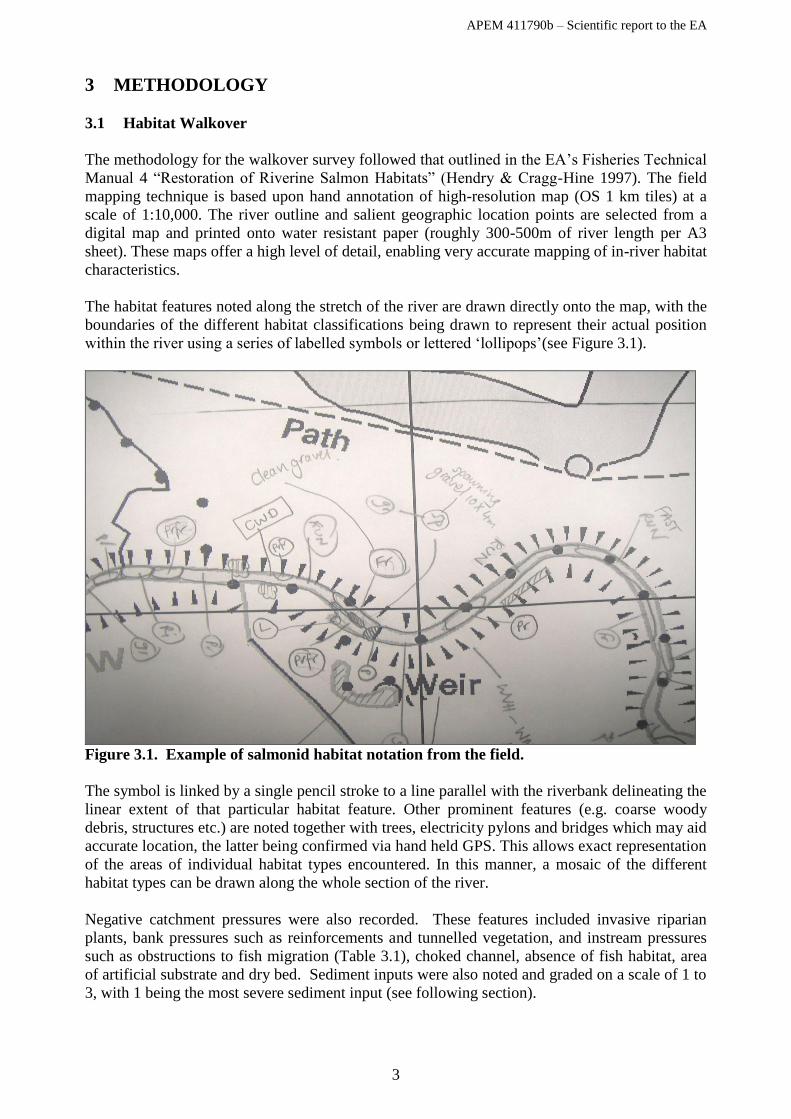
within the river using a series of labelled symbols or lettered ‘lollipops’(see Figure 3.1).
Figure 3.1. Example of salmonid habitat notation from the field.
The symbol is linked by a single pencil stroke to a line parallel with the riverbank delineating the
linear extent of that particular habitat feature. Other prominent features (e.g. coarse woody
debris, structures etc.) are noted together with trees, electricity pylons and bridges which may aid
accurate location, the latter being confirmed via hand held GPS. This allows exact representation
of the areas of individual habitat types encountered. In this manner, a mosaic of the different
habitat types can be drawn along the whole section of the river.
Negative catchment pressures were also recorded. These features included invasive riparian
plants, bank pressures such as reinforcements and tunnelled vegetation, and instream pressures
such as obstructions to fish migration (Table 3.1), choked channel, absence of fish habitat, area
of artificial substrate and dry bed. Sediment inputs were also noted and graded on a scale of 1 to
3, with 1 being the most severe sediment input (see following section).

APEM 411790b – Scientific report to the EA
4
Figure 3.2. APEM field scientist recording information during walkover.
Table 3.1. Classification of instream obstructions.
Class Definition
G1 Barrier impassable regardless of flow
G2 Barrier passable with spate flow
G3 Barrier impassable under Q90 flow
On return to the laboratory these data were transcribed into ARCview GIS for visual
representation as well as facilitating detailed spatial analysis and quantification of habitat types.
These digital data were manipulated to calculate the total area of different habitat types along the
entire survey reach.
The principal instream physical habitat variables that determine suitability for juvenile salmonids
are: water depth, water velocity, streambed substratum and cover (Heggenes 1990). The
preferred spawning site is the transitional area between pool and riffle where the flow is
accelerating and the depth decreasing. Gravels of suitable coarseness are also required with
interstices, the voids between gravel particles, cleaned by current or upwelling (Petersen 1978,
Bjorn and Reiser 1991 in Hendry and Cragg-Hine 1997).
Salmon fry and parr occupy shallow, fast-flowing water, with a moderately coarse substrate with
cover (Symons and Heland 1978, Bagliniere and Champigneulle 1986). Deep or slow moving
water, particularly when associated with a sand or silt substrate does not support resident
juvenile salmonids (Wankowski and Thorpe 1979, Bagliniere and Champigneulle 1986).
Suitable cover for juveniles includes areas of deep water, surface turbulence, loose substrate,
large rocks and other submerged obstructions, undercut banks, overhanging vegetation, woody
APEM 411790b – Scientific report to the EA
5
debris lodged in the channel and aquatic vegetation (Heggenes 1990, Bjorn and Reiser 1991,
Haury et al., 1995).
The relative position of habitat types is also of importance. For instance, the proximity of
juvenile habitat to spawning gravels may be significant to their utilisation. In addition, adults
will require holding pools immediately downstream of spawning gravels in which they can
congregate prior to spawning.
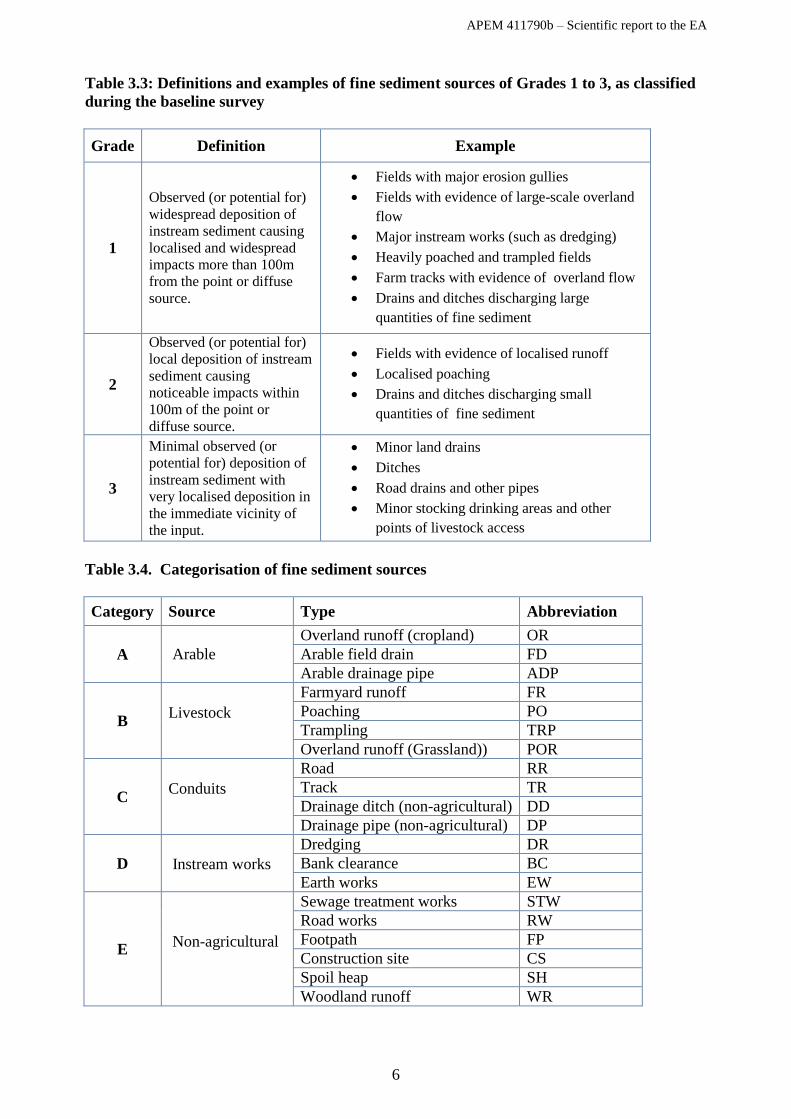
Table 3.2 provides a definition of each of the key functional salmonid habitat categories used in
the survey and is taken from Hendry and Cragg-Hine (1997). In addition, other water flow
classification types recorded included cascade and run. Although this methodology is primarily
intended for identifying and mapping salmonid habitat types, it can also be useful in describing
habitats used by other in stream biota such as macrophytes and macroinvertebrates.
Table 3.2 Habitat classification system
Habitat type Description
Spawning gravel
Ideally stable but not compacted, with a mean grain size 25 mm or
less for trout, but up to 80 mm for salmon. ‘Fines’ (< 2 mm grain
size) to be less than 20% by weight. Water 17-76cm deep and 25-90
cm/s.
Fry (0+) habitat Shallow, < 20 cm deep, fast flowing (> 30 cm/s), with surface
turbulence and a gravel and cobble substrate.
Parr (>1+) habitat 20 - 30 cm deep, fast flowing (>30 cm/s), surface turbulent, with
gravel / cobble / boulder substrate.
Riffles Shallow (< 30 Cm Deep), fast flowing (> 50 Cm/S), surface
turbulent, gravel / cobble / boulder substrate.
Glides
= or > 30 Cm deep, moderate velocity in range 10-30 cm/sec,
surface smooth and unbroken, relatively even substrate of cobbles
with finer material.
Pools = or > 40 cm deep, slow flowing (< 10 cm/s), surface unbroken,
substrate with a high proportion of sand and silt.
3.2 Sediment sources
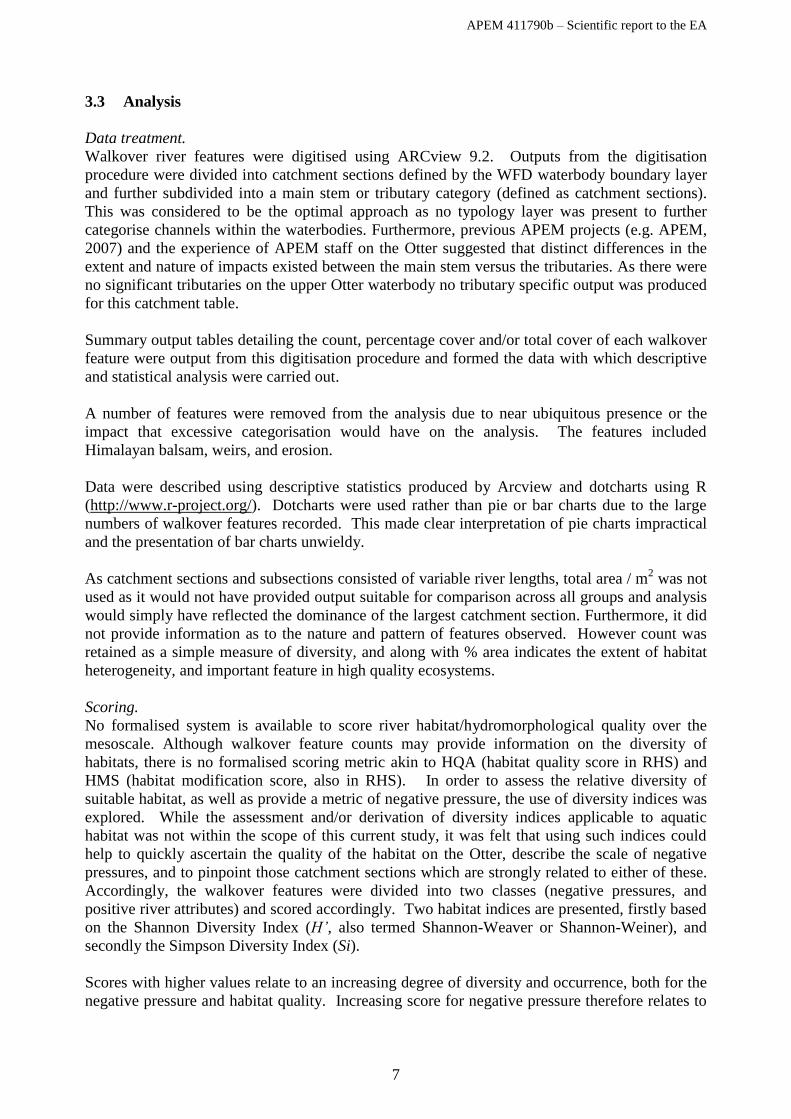
Point source sediment inputs were classified on a scale of Grade 1 to Grade 3 (see Table 3.3)
(N.B. this grading system is not to be confused with the EA Common Incident Classification
System (CICS)). A field handbook was provided to each field worker, which clearly defined the
different grades of sediment source using text and photographic examples.
In addition to the primary categorisation of the perceived threat posed by fine sediment sources,
the origin of each input was also recorded during the baseline survey. This facilitated GIS
analysis of the spatial and numerical distribution of each of the Grade 1 sources. The origin of
each source was recorded as shown in Table 3.4
APEM 411790b – Scientific report to the EA
6
Table 3.3: Definitions and examples of fine sediment sources of Grades 1 to 3, as classified
during the baseline survey
Grade Definition Example
1
Observed (or potential for)
widespread deposition of
instream sediment causing
localised and widespread
impacts more than 100m
from the point or diffuse
source.
Fields with major erosion gullies
Fields with evidence of large-scale overland
flow
Major instream works (such as dredging)
Heavily poached and trampled fields
Farm tracks with evidence of overland flow
Drains and ditches discharging large
quantities of fine sediment
2
Observed (or potential for)
local deposition of instream
sediment causing
noticeable impacts within
100m of the point or
diffuse source.
Fields with evidence of localised runoff
Localised poaching
Drains and ditches discharging small
quantities of fine sediment
3
Minimal observed (or
potential for) deposition of
instream sediment with
very localised deposition in
the immediate vicinity of
the input.
Minor land drains
Ditches
Road drains and other pipes
Minor stocking drinking areas and other
points of livestock access
Table 3.4. Categorisation of fine sediment sources
Category Source Type Abbreviation
A
Arable
Overland runoff (cropland) OR
Arable field drain FD
Arable drainage pipe ADP
B
Livestock
Farmyard runoff FR
Poaching PO
Trampling TRP
Overland runoff (Grassland)) POR
C
Conduits
Road RR
Track TR
Drainage ditch (non-agricultural) DD
Drainage pipe (non-agricultural) DP
D Instream works
Dredging DR
Bank clearance BC
Earth works EW
E Non-agricultural
Sewage treatment works STW
Road works RW
Footpath FP
Construction site CS
Spoil heap SH
Woodland runoff WR
APEM 411790b – Scientific report to the EA
7
3.3 Analysis
Data treatment.
Walkover river features were digitised using ARCview 9.2. Outputs from the digitisation
procedure were divided into catchment sections defined by the WFD waterbody boundary layer
and further subdivided into a main stem or tributary category (defined as catchment sections).
This was considered to be the optimal approach as no typology layer was present to further
categorise channels within the waterbodies. Furthermore, previous APEM projects (e.g. APEM,
2007) and the experience of APEM staff on the Otter suggested that distinct differences in the
extent and nature of impacts existed between the main stem versus the tributaries. As there were
no significant tributaries on the upper Otter waterbody no tributary specific output was produced
for this catchment table.
Summary output tables detailing the count, percentage cover and/or total cover of each walkover
feature were output from this digitisation procedure and formed the data with which descriptive
and statistical analysis were carried out.
A number of features were removed from the analysis due to near ubiquitous presence or the
impact that excessive categorisation would have on the analysis. The features included
Himalayan balsam, weirs, and erosion.
Data were described using descriptive statistics produced by Arcview and dotcharts using R
(http://www.r-project.org/). Dotcharts were used rather than pie or bar charts due to the large
numbers of walkover features recorded. This made clear interpretation of pie charts impractical
and the presentation of bar charts unwieldy.
As catchment sections and subsections consisted of variable river lengths, total area / m2 was not
used as it would not have provided output suitable for comparison across all groups and analysis
would simply have reflected the dominance of the largest catchment section. Furthermore, it did
not provide information as to the nature and pattern of features observed. However count was
retained as a simple measure of diversity, and along with % area indicates the extent of habitat
heterogeneity, and important feature in high quality ecosystems.
Scoring.
No formalised system is available to score river habitat/hydromorphological quality over the
mesoscale. Although walkover feature counts may provide information on the diversity of
habitats, there is no formalised scoring metric akin to HQA (habitat quality score in RHS) and
HMS (habitat modification score, also in RHS). In order to assess the relative diversity of
suitable habitat, as well as provide a metric of negative pressure, the use of diversity indices was
explored. While the assessment and/or derivation of diversity indices applicable to aquatic
habitat was not within the scope of this current study, it was felt that using such indices could
help to quickly ascertain the quality of the habitat on the Otter, describe the scale of negative
pressures, and to pinpoint those catchment sections which are strongly related to either of these.
Accordingly, the walkover features were divided into two classes (negative pressures, and
positive river attributes) and scored accordingly. Two habitat indices are presented, firstly based
on the Shannon Diversity Index (H’, also termed Shannon-Weaver or Shannon-Weiner), and
secondly the Simpson Diversity Index (Si).
Scores with higher values relate to an increasing degree of diversity and occurrence, both for the
negative pressure and habitat quality. Increasing score for negative pressure therefore relates to
APEM 411790b – Scientific report to the EA
8
an increasing number of features such as tunnelled vegetation, obstructions and reinforcement.
However, increasing habitat score indicate a more natural channel and riparian zone.
If it had been possible to classify river sections by hydromorphological typology, Si would be
more relevant as it is not weighted by evenness (for example, if an even distributions of flow
type were recorded in a Cascade-Step-Pool river type, one would assume the presence of
pressure as cascade and fast riffle should dominate). However, as this classification was not
possible, both metrics are potentially relevant to this study and the scoring of river habitat at
larger scales.
Spatial comparison of walkover features and association with catchment sections.
An ordination multivariate approach, Principal Component Analysis (PCA), was used to
investigate the inter-relationships between walkover features and the spatial association of
walkover features with the different sections of the otter catchment. This method reduces
multiple walkover features into a small number of axes with sites arrayed according to their
similarity (sites with coordinates close to each other being more similar). Scores for each
ordination axis reflect the location of each section along gradients defined by the input features
that explain most of the among-section variance. Axis values are essentially derived variables
and axes are orthogonal (or independent) of each other, allowing interpretation of the
relationships of the attached walkover features. Each feature has an axis score reflecting the
magnitude of the relationship with the derived axis and the direction is indicated by the positivity
or negativity of the score. Therefore, one can characterise spatial components (in this case the
waterbody) through their relationship to physical features (habitat characteristics and pressures)
allowing for prioritisation of the pressures which dominate each waterbody.
To conduct PCA, walkover features were first transformed (cube root transformation for counts,
arcsine transformation for %area) to improve the linearity of the relationships between variables,
thereby making associations more detectable. Secondly, each feature was scaled to 1 by the
maximum feature value to allow both percentage area and counts to be analysed together, and to
control for variable river lengths. PCA was carried out using the ADE-4 package in R.
The variation explained by each axis is determined by the eigenvalue. Although a number of
axes are produced via each analysis, only those with an eigenvalue > 1 are considered significant
enough to be retained. The percentage variation of an axis is the product of the eigenvalue for
that given axis divided by the sum of all eigenvalues (times 100).
APEM 411790b – Scientific report to the EA
9
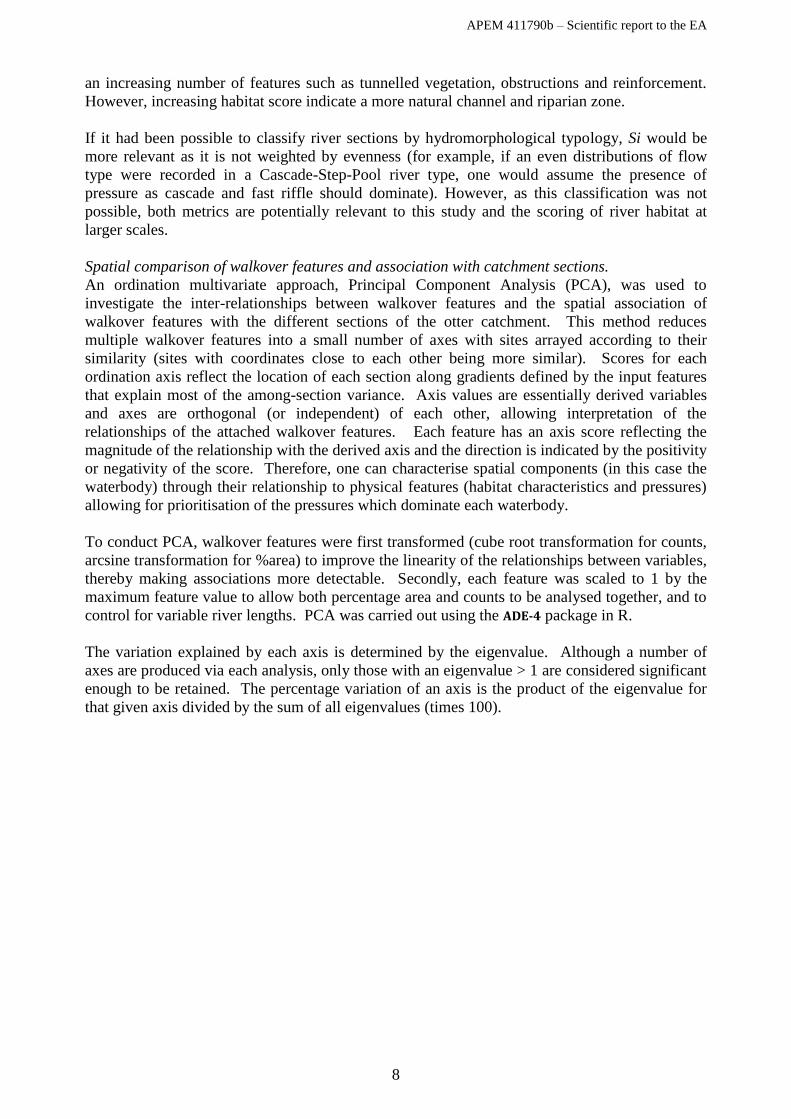
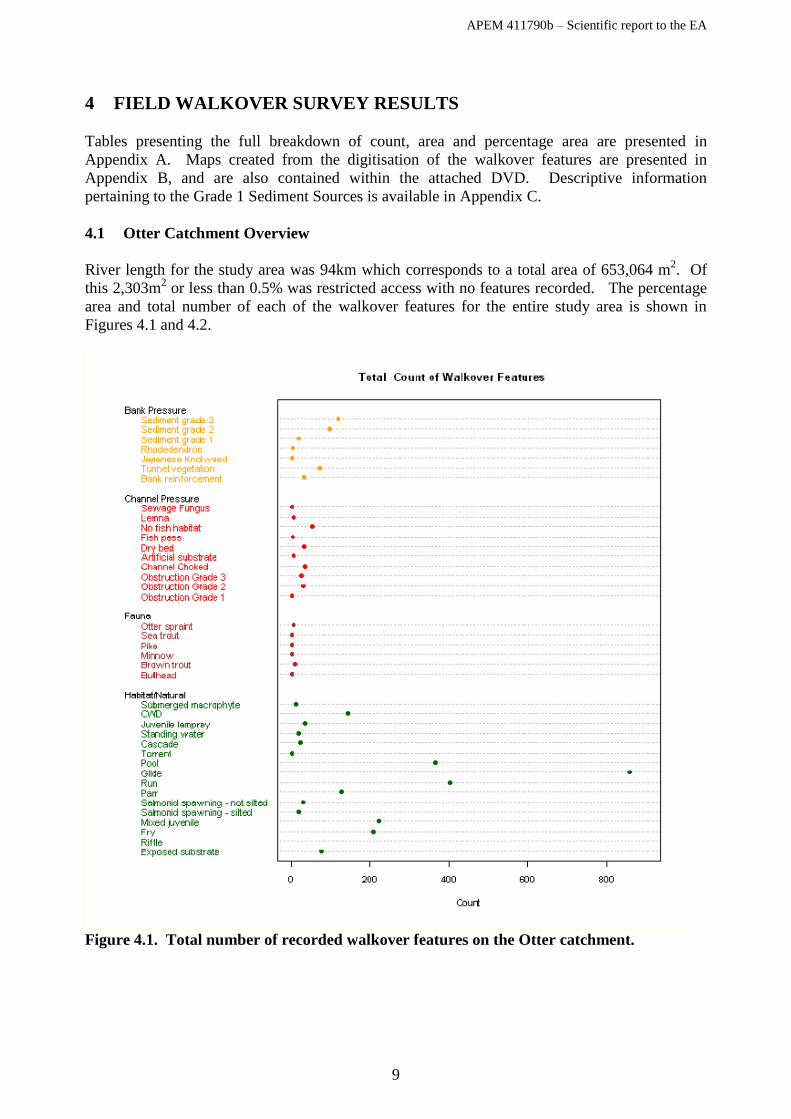
4 FIELD WALKOVER SURVEY RESULTS
Tables presenting the full breakdown of count, area and percentage area are presented in
Appendix A. Maps created from the digitisation of the walkover features are presented in
Appendix B, and are also contained within the attached DVD. Descriptive information
pertaining to the Grade 1 Sediment Sources is available in Appendix C.
4.1 Otter Catchment Overview
River length for the study area was 94km which corresponds to a total area of 653,064 m2. Of
this 2,303m2 or less than 0.5% was restricted access with no features recorded. The percentage
area and total number of each of the walkover features for the entire study area is shown in
Figures 4.1 and 4.2.
Figure 4.1. Total number of recorded walkover features on the Otter catchment.
APEM 411790b – Scientific report to the EA
10
Figure 4.2. Percentage area of recorded Walkover Features on the Otter catchment.
Negative Catchment pressures.
A range of negative catchment scale pressures were recorded on the Otter. These were grouped
into the Bank pressure and Channel Pressure categories in Figures 4.1 and 4.2.
237 sediment sources were identified in the Otter catchment, of which 15 were classified as a
Grade 1 source. Other bank pressures included invasive plants, a specific problem on the
catchment.
Himalayan balsam (Impatiens glandilifera) was so prevalent it was not recorded and simply
noted as a catchment scale pressure. Furthermore, as it was noted that dieback had already begun
it was assumed that the full extent could not be accurately characterised. However, it was noted
that the main stem was much more heavily impacted than the tributaries. Other invasive plants
recorded were Japanese knotweed (Fallopia japonica), Rhododendron spp. and Lemna spp.
Although not observed at particularly high levels, their presence significantly increases the risk
of further colonisation resulting from bankside disturbance. There were also a total of 33
instances of bank reinforcement with an average length of 42 metres. This reinforcement was
likely to be associated with a range of hydromorphological alterations including bridges, channel
and/or bank realignment and other features associated with habitat degradation and reductions in
biotic diversity. There were 5 counts of artificial substrate (733m2) which was likely due to
artificial bed armouring (for weirs and obstructions) and bridge aprons. Dry bed accounted for
2.8% of the channel area and occurred at over 30 locations.
APEM 411790b – Scientific report to the EA
11
There were a total of 59 in-channel obstructions, broken down into two Grade 1, thirty one
Grade 2 and twenty six Grade 3 obstructions. Despite the number of obstructions only three fish
passes were recorded. A total area of 35,641m2 (5% of total catchment area) was recorded as
being unsuitable habitat for fish due to poor flows. Furthermore, tunnel vegetation was noted
over 3,880m2 of river (71 instances), and 5,236m
2 of channel area was choked with vegetation
(35 instances). Sewage fungus was also recorded at a single location.
Habitat features/natural features.
A total of 7 different flow types were recorded and are listed in order of dominance; Glide (41%
of total catchment area), riffle (15%), run (8.9%), pool (4.8%), standing water (1%), cascade
(0.3%) and torrent (<0.1%). A total of 75 areas of exposed substrate, corresponding to features
such as side bars, point-bar, mid-channel bars, were noted. Further natural habitat features
included 143 cases of Coarse Woody Debris (CWD) and twelve counts of submerged linear
vegetation.
Salmonid specific habitat accounted for just over 15% of the channel area (this includes 0.5% of
silted spawning area which has the potential to be cleaned and reactivated when flows peak over
Q95 levels). Mixed juvenile habitat was the most common salmonid habitat (9%), followed by
fry (3.3%), parr (2.5%) and spawning habitat (< 1%). Juvenile lamprey specific habitat
accounted less than 1% of total catchment area.
These results are presented in the Habitat/Natural category in Figures 4.1 and 4.2.
Fauna.
Direct observations of fauna were made during the survey. Although this may provide some
indication of the diversity of aquatic vertebrates on the Otter catchment, they should not be
considered in any way representative of the biotic community structure on the Otter as these
observations were incidental to the main purpose of the survey.
A total of 7 otter spraints were recorded. 12 brown trout were noted (including one sea trout),
while minnow, pike and bullhead were also recorded. These Figures are presented in the fauna
category in Figures 4.1 and 4.2.
4.2 Otter Lower Waterbody
4.2.1 Main Stem
Total channel area classified as Lower Otter (main stem) was 334,762.3m2. This was the single
largest survey section and accounted for over 50% of the total river area surveyed. The
abundance and % area of features recorded during the walkover survey of the lower Otter
waterbody (main stem) are presented below in Figures 4.3 and 4.4.
Negative pressures.
A total of 41 sediment sources were recorded on the lower Otter (two Grade 1, seventeen Grade
2 and twenty two Grade 3). There were also 18 recorded cases of bank reinforcement, one
occurrence of tunnelled channel and two recorded instances of F. japonica.
Eighteen obstructions were recorded, although Grade 1 obstructions were not present in the
lower Otter. Thirteen Grade 2 obstructions were present and five Grade 3. Despite the lack of
Grade 1 obstructions, all three fish passes recorded during the study occurred in the lower Otter.
There was also one instance of dry river bed.
APEM 411790b – Scientific report to the EA
12
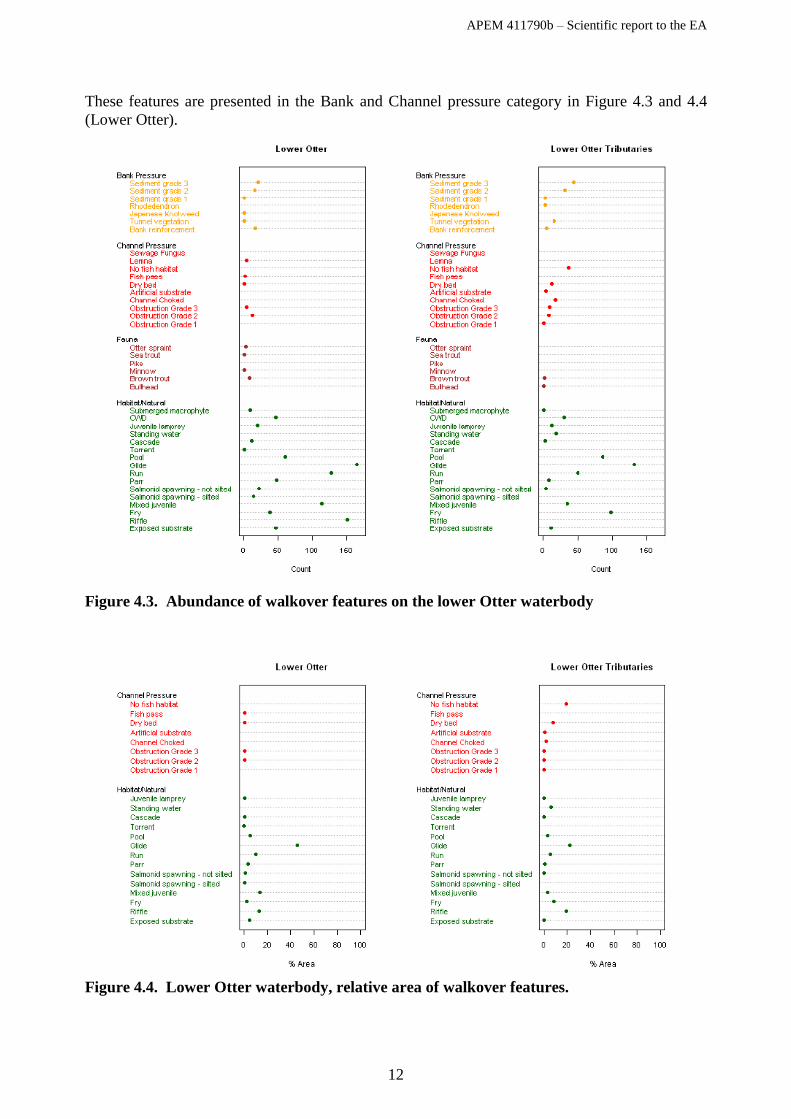
These features are presented in the Bank and Channel pressure category in Figure 4.3 and 4.4
(Lower Otter).
Figure 4.3. Abundance of walkover features on the lower Otter waterbody
Figure 4.4. Lower Otter waterbody, relative area of walkover features.
APEM 411790b – Scientific report to the EA
13
Habitat features/natural features.
Six of a possible seven flow categories were recorded on the lower Otter (main stem). Glide was
the most common accounting for 46% of the channel flow type and was recorded on 165
separate occasions. Riffle was the next most common by area 12.8%, (151 records), followed by
run 9.6%, (128 records), pool 5.2 %,(61 records), cascade (0.5%, 12 records) and torrent < 0.1%,
(1 record). No standing water was recorded.
All categories of salmonid habitat were present on the lower Otter (main stem). Salmon
spawning area accounted for 1.4% of the total channel (38 records). Fry habitat occurred 39
occasions and was 2.3% of channel area, while mixed juvenile habitat was much more abundant,
occurring at 114 separate locations and accounting for 13.2% of the lower Otter (main stem)
channel. Parr habitat was not as abundant and only accounted for 3.5% of channel area (48
counts). These features are presented in Figures 4.3 and 4.4.
Fauna.
Four out of a catchment total of seven otter spraints were recorded on the lower Otter (main
stem), and brown trout and minnow were also recorded.
4.2.2 Lower Otter Tributaries.
Total channel area classified as lower Otter (tributaries) was 106,204m2 and accounted for over
16% of the total river area surveyed. Total channel area of the tributaries was a third of the
lower Otter main stem. The abundance and % area of features recorded during the walkover
survey of the lower Otter waterbody (main stem) are presented below in Figures 4.5 and 4.6.
Negative pressures.
A total of 78 sediment sources were recorded on the Lower Otter (tributaries) (three Grade 1,
thirty one Grade 2 and forty four Grade 3). There were also five recorded cases of bank
reinforcement, 16 occurrences of tunnelled channel and three recorded instances of
Rhododendron spp.
18 obstructions were recorded, incorporating one Grade 1, eight Grade 2 and nine Grade 3. No
fish passes were present. Areas of No Fish Habitat (NFH, areas without sufficient flow) were
common, accounting for almost 20% of the total channel area in the lower Otter tributaries and
occurring at 39 locations. The channel was choked by vegetation at 18 separate locations,
accounting for 2% of the total channel area, and four occurrences of artificial substrate totalled
0.6% of the channel bed.
These features are presented in the Bank and Channel pressure category in Figure 4.3 and 4.4
(lower Otter Tributaries).
Habitat features/natural features.
Flow diversity on the lower Otter tributaries appeared high based on the number of occurrences
of each flow type and the presence of six of a possible seven flow categories. Glide was the still
most common by area accounting for 22% the channel flow type (132 records) but riffle was the
most abundant in terms of recorded instances 18.9% of area (218 records,). Standing water
accounted for 6.1% of channel area (19 records), run 5.3% (50 records), pool 2.9% (86 records)
and cascade 0.2% (3 records). No torrent was recorded.
APEM 411790b – Scientific report to the EA
14
No functional salmon spawning area was recorded in the lower Otter tributaries. Non-
functioning (silted) spawning occurred at four locations, however it only accounted for 0.2% of
channel area. Fry habitat was relatively much higher in the tributaries than in the main stem
(8.4%, 98 locations) while mixed juvenile 3.3%, (35 records) and parr 0.4%, (8 records) were
very much lower. 12 separate areas of suitable lamprey habitat was also recorded, accounting
for 0.1% of channel area.
Fauna.
Only two vertebrate species were noted on the tributaries (brown trout and bullhead); however in
reality this may bear no similarity to the results obtained from any dedicated faunal survey.
4.3 Mid Otter Waterbody.
4.3.1 Main stem
Total channel area classified as mid Otter (main stem) was 51,115.5m2, which equates to 7.8% of
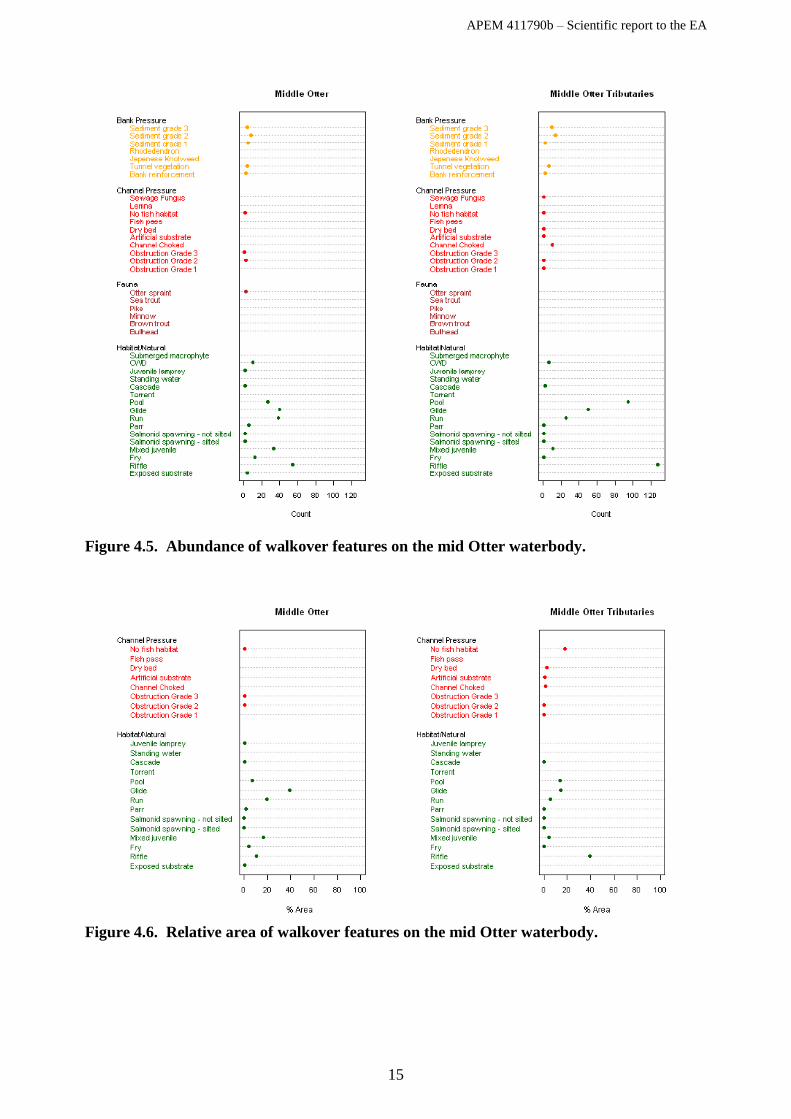
the total channel are of the Otter catchment. The abundance and % area of features recorded
during the walkover survey of the mid Otter waterbody (main stem, and tributaries) are presented
below in Figures 4.5 and 4.6.
Negative Pressures.
A total of 17 sediment sources were recorded on the lower Otter (five Grade 1, eight Grade 2 and
four Grade 3). There were also three recorded cases of bank reinforcement and four occurrences
of tunnel vegetation.
Four obstructions were recorded, although Grade 1 obstructions were not present . Three Grade 2
obstructions were present and 1 Grade was also recorded. The only remaining negative pressure
recorded on the mid Otter was 2 areas of NFH accounting for 5% of the channel area.
Habitat features/natural features.
Four flow types were recorded on the mid Otter and, as with the lower Otter, glide was the most
common in terms of area 39%, (40 records). However riffle was the most abundant in terms of
occurrences 10.7% area, (55 records). Run accounted for 19.5% of channel area (39 records),
pool 6.8% (27 records), and cascade 0.6% (39 records). No torrent or standing water was
recorded.
Mixed juvenile habit was the most abundant salmonid habitat on the mid Otter (main stem)
(16.4%, 33 records), while fry (4%, 13 records), parr (1.3%, 6 records) and spawning substrate
(silted and un-silted) accounted for less than 1% of total channel area (2 records each).
CWD was found in ten locations along the reach, while submerged linear macrophytes were not
recorded. Juvenile lamprey habitat accounted for 0.2% of the channel area (2 records).
Fauna.
Three otter spraints were recorded in the mid Otter, and this reach represented the furthest
upstream extent of obvious otter presence (however, day couches and slides were not recorded
and this was not a dedicated otter survey). No other vertebrate species was recorded as being
present.
APEM 411790b – Scientific report to the EA
15
Figure 4.5. Abundance of walkover features on the mid Otter waterbody.
Figure 4.6. Relative area of walkover features on the mid Otter waterbody.
APEM 411790b – Scientific report to the EA
16
4.3.2 Tributaries
Total channel area was 30,850m2, which equates to 4.7% of the total channel area of the Otter
catchment. The abundance and % area of features recorded during the walkover survey of the
mid Otter waterbody (main stem, and tributaries) are presented in Figures 4.5 and 4.6.
Negative Pressures.
A total of 25 sediment sources were recorded on the mid Otter (two Grade 1, fourteen Grade 2
and nine Grade 3). There were also two recorded cases of bank reinforcement and six
occurrences of tunnelled channel.
Only two obstructions were recorded, although one of these was a Grade 1 with the other
recorded as Grade 2. There was a high number (10) of sections of choked channel accounting
for 1% of total channel area. A single occurrence each of artificial substrate (0.4%) and dry river
bed (2.3%) were recorded, and the mid Otter tributaries contained the only observation of
sewage fungus, however its extent was not recorded.
Habitat features/natural features.
Riffle dominated the flow types, both in terms of area (39%) and number of records (127).
Glide accounted for 14.2% of channel area (50 records), pool 13.9% (94 records), run (5.7%, 25
counts) and cascade 0.3% (3 records). No torrent or standing water was recorded.
Fauna.
No fauna were recorded on the mid Otter tributaries.
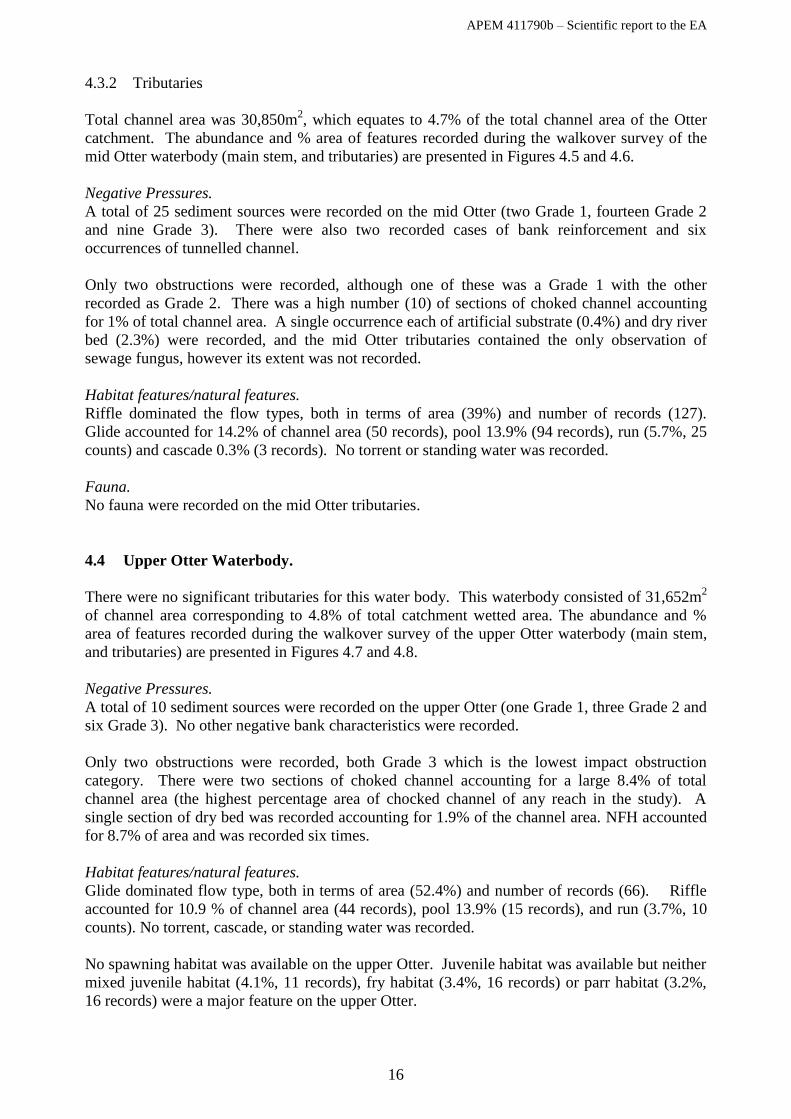
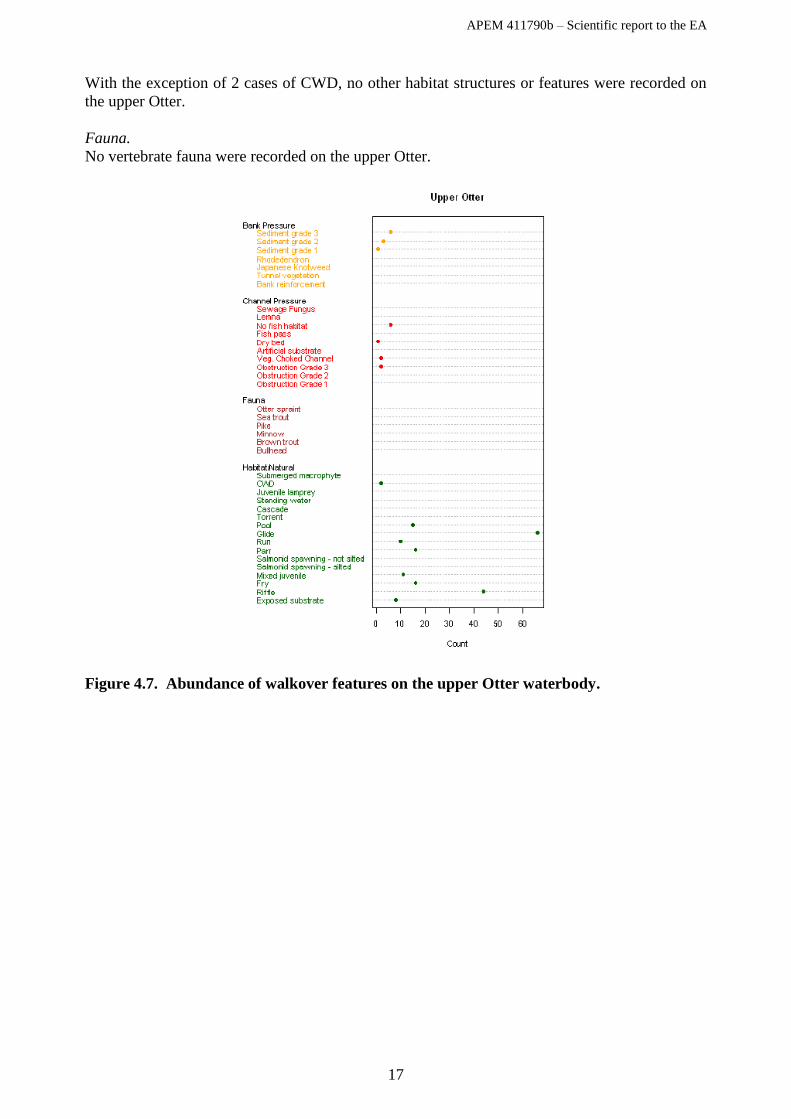
4.4 Upper Otter Waterbody.
There were no significant tributaries for this water body. This waterbody consisted of 31,652m2
of channel area corresponding to 4.8% of total catchment wetted area. The abundance and %
area of features recorded during the walkover survey of the upper Otter waterbody (main stem,
and tributaries) are presented in Figures 4.7 and 4.8.
Negative Pressures.
A total of 10 sediment sources were recorded on the upper Otter (one Grade 1, three Grade 2 and
six Grade 3). No other negative bank characteristics were recorded.
Only two obstructions were recorded, both Grade 3 which is the lowest impact obstruction
category. There were two sections of choked channel accounting for a large 8.4% of total
channel area (the highest percentage area of chocked channel of any reach in the study). A
single section of dry bed was recorded accounting for 1.9% of the channel area. NFH accounted
for 8.7% of area and was recorded six times.
Habitat features/natural features.
Glide dominated flow type, both in terms of area (52.4%) and number of records (66). Riffle
accounted for 10.9 % of channel area (44 records), pool 13.9% (15 records), and run (3.7%, 10
counts). No torrent, cascade, or standing water was recorded.
No spawning habitat was available on the upper Otter. Juvenile habitat was available but neither
mixed juvenile habitat (4.1%, 11 records), fry habitat (3.4%, 16 records) or parr habitat (3.2%,
16 records) were a major feature on the upper Otter.
APEM 411790b – Scientific report to the EA
17
With the exception of 2 cases of CWD, no other habitat structures or features were recorded on
the upper Otter.
Fauna.
No vertebrate fauna were recorded on the upper Otter.
Figure 4.7. Abundance of walkover features on the upper Otter waterbody.
APEM 411790b – Scientific report to the EA
18
Figure 4.8. Relative area of walkover features on the upper Otter waterbody.
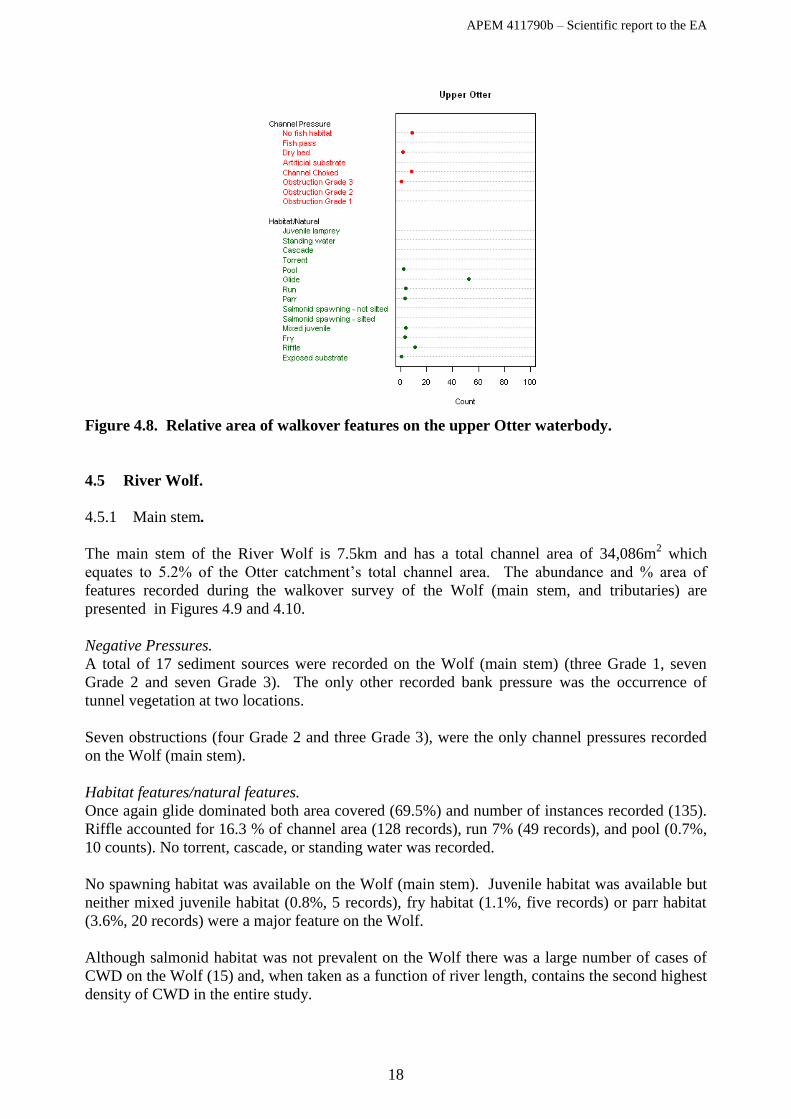
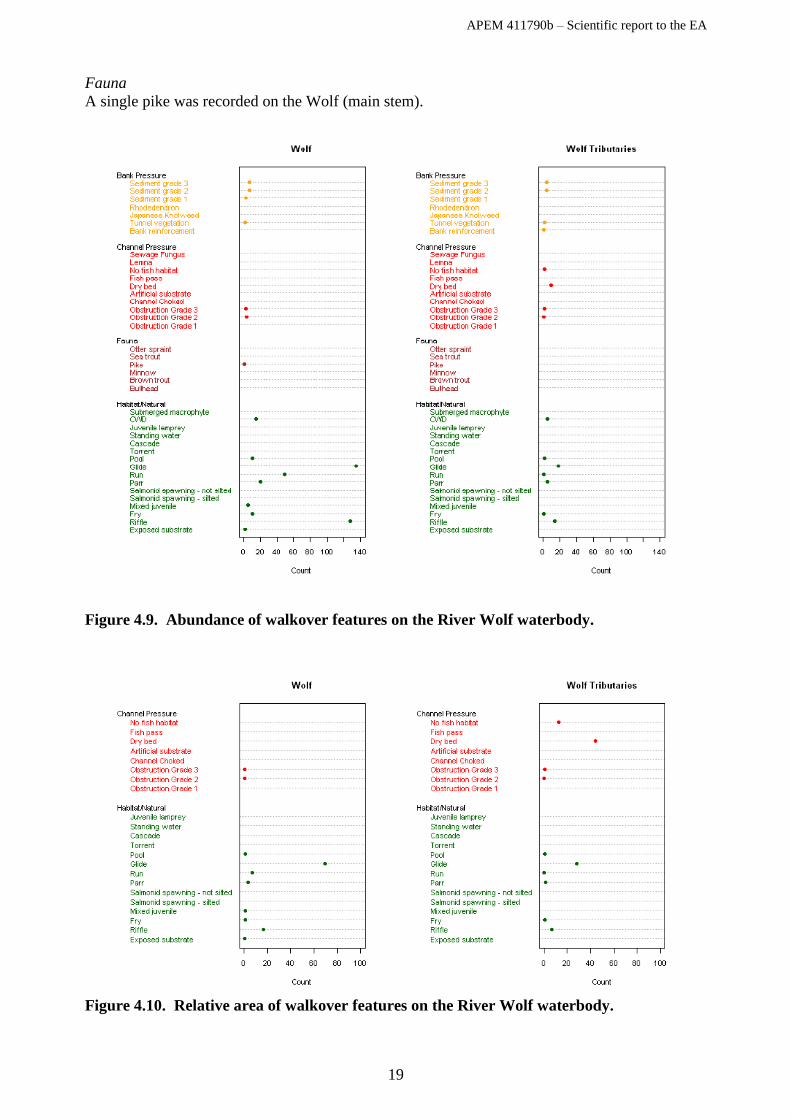
4.5 River Wolf.
4.5.1 Main stem.
The main stem of the River Wolf is 7.5km and has a total channel area of 34,086m2 which
equates to 5.2% of the Otter catchment’s total channel area. The abundance and % area of
features recorded during the walkover survey of the Wolf (main stem, and tributaries) are
presented in Figures 4.9 and 4.10.
Negative Pressures.
A total of 17 sediment sources were recorded on the Wolf (main stem) (three Grade 1, seven
Grade 2 and seven Grade 3). The only other recorded bank pressure was the occurrence of
tunnel vegetation at two locations.
Seven obstructions (four Grade 2 and three Grade 3), were the only channel pressures recorded
on the Wolf (main stem).
Habitat features/natural features.
Once again glide dominated both area covered (69.5%) and number of instances recorded (135).
Riffle accounted for 16.3 % of channel area (128 records), run 7% (49 records), and pool (0.7%,
10 counts). No torrent, cascade, or standing water was recorded.
No spawning habitat was available on the Wolf (main stem). Juvenile habitat was available but
neither mixed juvenile habitat (0.8%, 5 records), fry habitat (1.1%, five records) or parr habitat
(3.6%, 20 records) were a major feature on the Wolf.
Although salmonid habitat was not prevalent on the Wolf there was a large number of cases of
CWD on the Wolf (15) and, when taken as a function of river length, contains the second highest
density of CWD in the entire study.
APEM 411790b – Scientific report to the EA
19
Fauna
A single pike was recorded on the Wolf (main stem).
Figure 4.9. Abundance of walkover features on the River Wolf waterbody.
Figure 4.10. Relative area of walkover features on the River Wolf waterbody.
APEM 411790b – Scientific report to the EA
20
4.5.2 Tributaries.
The tributaries of the River Wolf were 3.2km in length and have a total channel area of 8,957m2,
which equates to 1.4% of the Otter catchment’s total channel area. The abundance and % area of
features recorded during the survey of the Wolf tributaries are presented in Figures 4.9 and 4.10.
Negative Pressures.
A total of eight sediment sources were recorded on the Wolf (four Grade 2 and four Grade 3).
One instance of bank reinforcement and two instances of tunnel vegetation were also recorded.
In terms of in-channel pressures recorded by the walkover, a total of three obstructions were
recorded (one Grade 2 and two Grade 3), although none was classified as the most severe Grade
1. There were also nine cases recorded of dry river bed, accounting for a substantial 44% of total
channel area of the Wolf tributaries. Two sections of channel were recorded as unsuitable for
fish (NFH), accounting for 12.6% of channel area.
Habitat features/natural features.
Four flow types were recorded on the Wolf tributaries. In order of descending relative area they
are: glide 27.8%, (18 records), riffle 6.4%, (14 records), run 0.2%, (one record), and pool 0.5%,
(two records). No instances of torrent, cascade, or standing water were recorded.
Salmonid habitat on the Wolf tributaries was particularly limited, and accounted for a 1.9% of
river area, (six locations). The only habitat recorded was fry and parr habitat.
Fauna.
There was no evidence of vertebrate communities noted on the Wolf tributaries.
4.6 River Love Waterbody
4.6.1 Main stem
The main stem of the River Love is 9km in length and has a total channel area of 41,546m2
which equates to 6.4% of the Otter catchment’s total channel area. The abundance and
percentage area of features recorded during the walkover survey of the River Love (main stem,
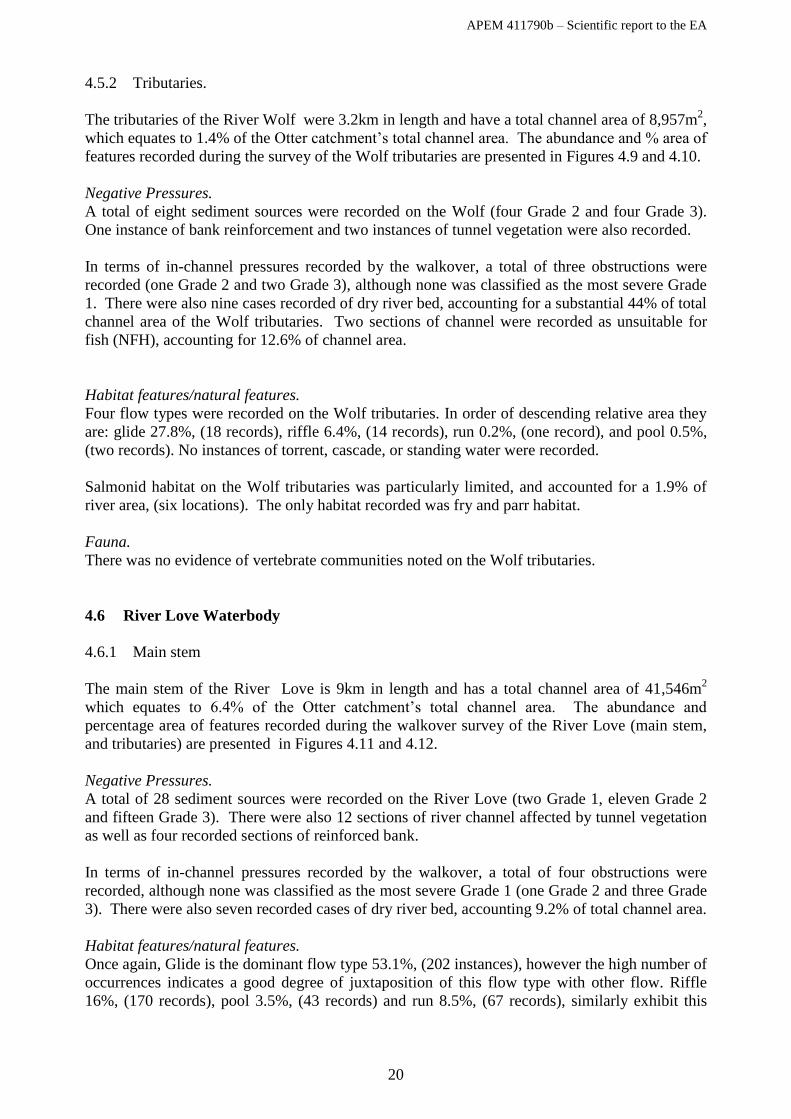
and tributaries) are presented in Figures 4.11 and 4.12.
Negative Pressures.
A total of 28 sediment sources were recorded on the River Love (two Grade 1, eleven Grade 2
and fifteen Grade 3). There were also 12 sections of river channel affected by tunnel vegetation
as well as four recorded sections of reinforced bank.
In terms of in-channel pressures recorded by the walkover, a total of four obstructions were
recorded, although none was classified as the most severe Grade 1 (one Grade 2 and three Grade
3). There were also seven recorded cases of dry river bed, accounting 9.2% of total channel area.
Habitat features/natural features.
Once again, Glide is the dominant flow type 53.1%, (202 instances), however the high number of
occurrences indicates a good degree of juxtaposition of this flow type with other flow. Riffle
16%, (170 records), pool 3.5%, (43 records) and run 8.5%, (67 records), similarly exhibit this
APEM 411790b – Scientific report to the EA
21
highly dispersed pattern of occurrence. Cascade was also recorded (0.1%, 3 records). No
instances of torrent, cascade, or standing water were recorded.
Although salmonid spawning habitat was recorded on the Love it was categorised as non-
functioning (silted). Functional habitats were present for other salmonid stages such as fry 3%,
(27 records) and parr 3 %, (24 records). Mixed juvenile habitat also accounted for 1.8 % of
channel area (11 records).
15 records of CWD were recorded and one instance of submerged linear macrophytes was
recorded
Figure 4.11. Abundance of walkover features on the River Love waterbody.
APEM 411790b – Scientific report to the EA
22
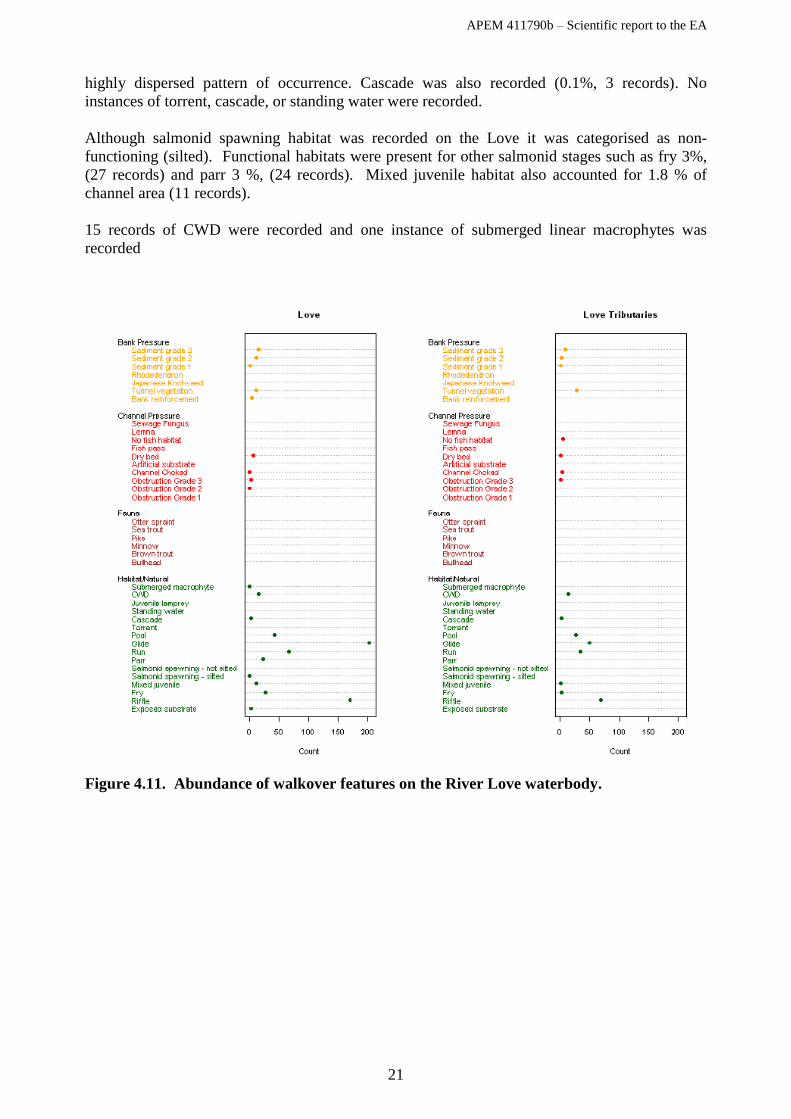
Figure 4.12. Relative area of walkover features on the River Love waterbody
4.6.2 Tributaries.
The total river length incorporated into the river Love tributaries was 5.1km and has a total
channel area of 13,896m2 which equates to 2.1% of the Otter catchment’s total channel area.
The abundance and percentage area of features recorded during the walkover survey of the River
Love tributaries are presented in Figures 4.11 and 4.12.
Negative Pressures.
A total of 13 sediment sources were recorded on the Love tributaries (one Grade 1, three Grade
2, and nine Grade 3). There were also 28 sections of river channel affected by tunnel vegetation
which was the highest occurrence of this pressure on any water body in the study.
In terms of in-channel pressures recorded by the walkover only a single Grade 3 obstruction was
recorded, which is the least severe category of obstruction. However, there were four recorded
cases of tunnel vegetation, a single observation of dry channel (7.8% by area) and five counts of
areas unsuitable for fish (NFH), accounting for 37% by area.
Habitat features/natural features.
In an exception to the general trend riffle dominated the Love tributaries and accounted for
18.3% of channel area (69 records). This was followed by glide 17.9%, (49 records), run 12.8%,
(34 records), pool 5.1%, (27 records) and cascade 0.1%, (2 records).
CWD was present at high densities (13 instances) based on the CWD per km ratio.
Although salmonid spawning habitat was recorded on the Love it was categorised as non-
functioning (silted). Functional habitats were present for other salmonid stages such as fry (3%,
(27 records) and parr 3 %, (24 records). Mixed juvenile habitat also accounted for 1.8 % of
channel area (11 records).
APEM 411790b – Scientific report to the EA
23
Fauna
No vertebrate species were noted.
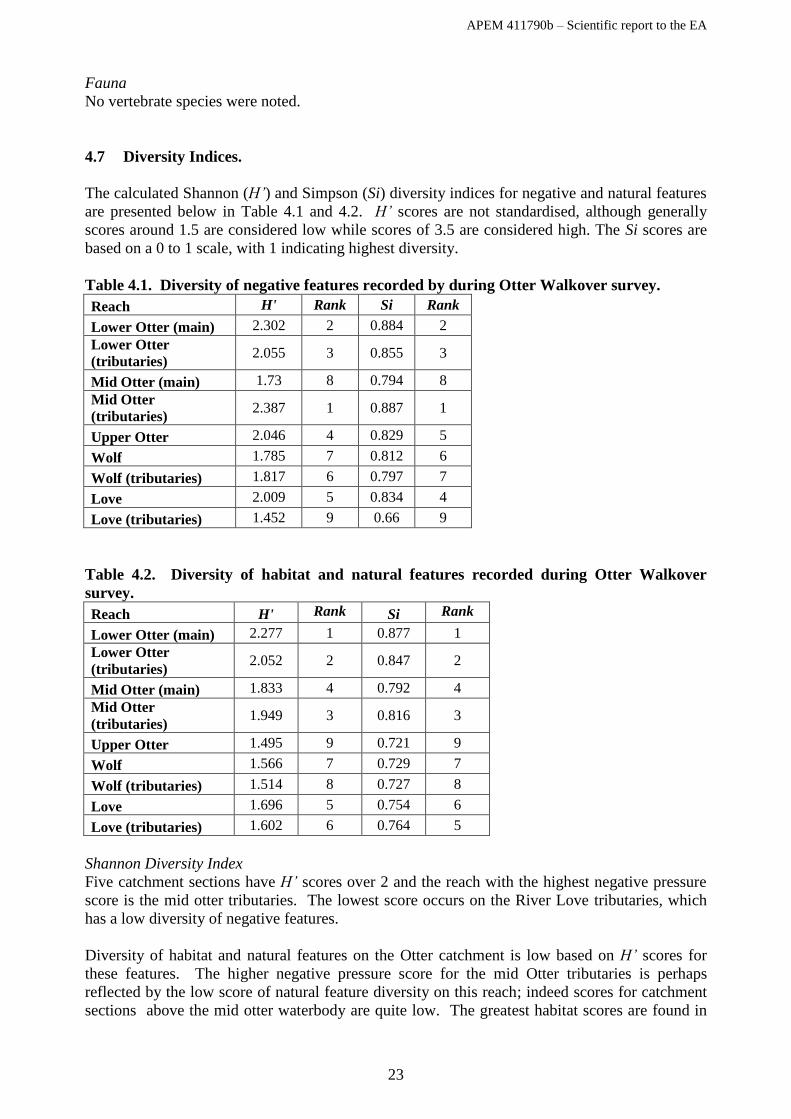
4.7 Diversity Indices.
The calculated Shannon (H’) and Simpson (Si) diversity indices for negative and natural features
are presented below in Table 4.1 and 4.2. H’ scores are not standardised, although generally
scores around 1.5 are considered low while scores of 3.5 are considered high. The Si scores are
based on a 0 to 1 scale, with 1 indicating highest diversity.
Table 4.1. Diversity of negative features recorded by during Otter Walkover survey.
Reach H' Rank Si Rank
Lower Otter (main) 2.302 2 0.884 2
Lower Otter
(tributaries) 2.055 3 0.855 3
Mid Otter (main) 1.73 8 0.794 8
Mid Otter
(tributaries) 2.387 1 0.887 1
Upper Otter 2.046 4 0.829 5
Wolf 1.785 7 0.812 6
Wolf (tributaries) 1.817 6 0.797 7
Love 2.009 5 0.834 4
Love (tributaries) 1.452 9 0.66 9
Table 4.2. Diversity of habitat and natural features recorded during Otter Walkover
survey.
Reach H' Rank Si Rank
Lower Otter (main) 2.277 1 0.877 1
Lower Otter
(tributaries) 2.052 2 0.847 2
Mid Otter (main) 1.833 4 0.792 4
Mid Otter
(tributaries) 1.949 3 0.816 3
Upper Otter 1.495 9 0.721 9
Wolf 1.566 7 0.729 7
Wolf (tributaries) 1.514 8 0.727 8
Love 1.696 5 0.754 6
Love (tributaries) 1.602 6 0.764 5
Shannon Diversity Index
Five catchment sections have H’ scores over 2 and the reach with the highest negative pressure
score is the mid otter tributaries. The lowest score occurs on the River Love tributaries, which
has a low diversity of negative features.
Diversity of habitat and natural features on the Otter catchment is low based on H’ scores for
these features. The higher negative pressure score for the mid Otter tributaries is perhaps
reflected by the low score of natural feature diversity on this reach; indeed scores for catchment
sections above the mid otter waterbody are quite low. The greatest habitat scores are found in
APEM 411790b – Scientific report to the EA
24
the lower river catchment sections, although these could not be considered particularly diverse
either.
Simpson Diversity Index
Si scores demonstrate a broadly similar pattern to the H’ scores, although some differences do
occur (Table 4.1).
As with the negative features, the pattern habitat/natural feature diversity is broadly similar using
Si. There was only one difference with the Love tributaries having a slightly higher score than
the main reach of the Love when Si is used.
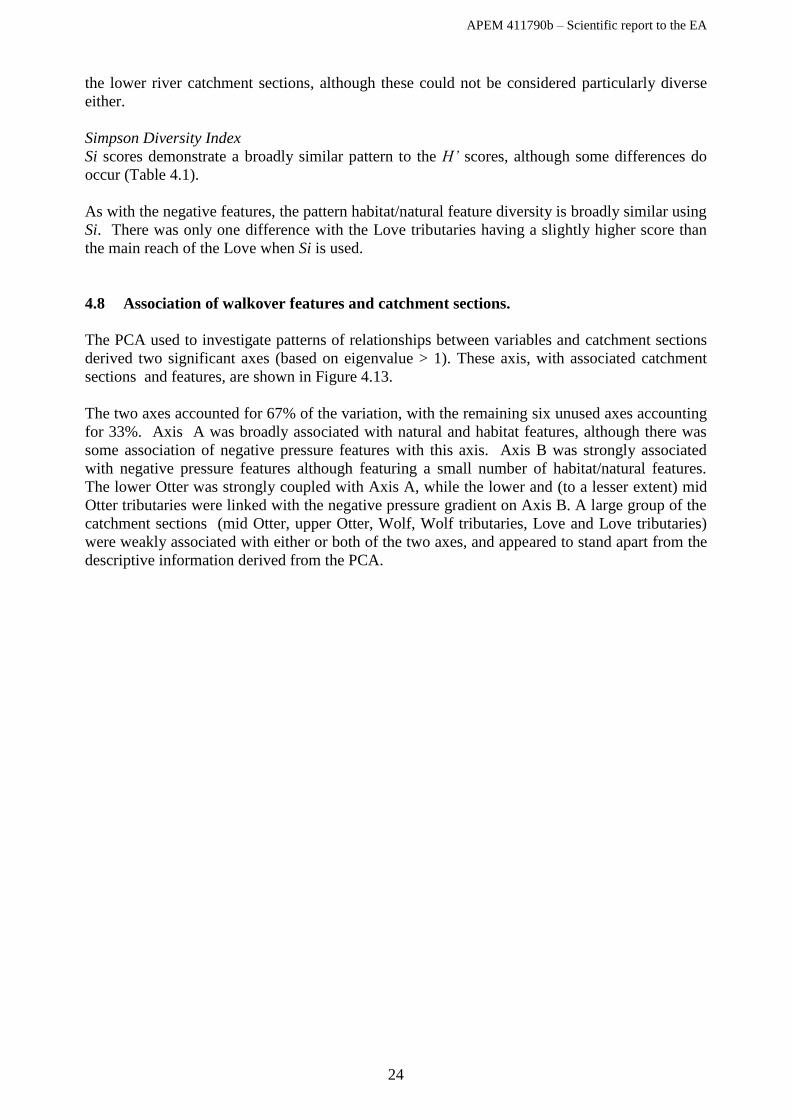
4.8 Association of walkover features and catchment sections.
The PCA used to investigate patterns of relationships between variables and catchment sections
derived two significant axes (based on eigenvalue > 1). These axis, with associated catchment
sections and features, are shown in Figure 4.13.
The two axes accounted for 67% of the variation, with the remaining six unused axes accounting
for 33%. Axis A was broadly associated with natural and habitat features, although there was
some association of negative pressure features with this axis. Axis B was strongly associated
with negative pressure features although featuring a small number of habitat/natural features.
The lower Otter was strongly coupled with Axis A, while the lower and (to a lesser extent) mid
Otter tributaries were linked with the negative pressure gradient on Axis B. A large group of the
catchment sections (mid Otter, upper Otter, Wolf, Wolf tributaries, Love and Love tributaries)
were weakly associated with either or both of the two axes, and appeared to stand apart from the
descriptive information derived from the PCA.
APEM 411790b – Scientific report to the EA
25
Figure 4.13. PCA scatterplot showing the association of walkover features and catchment
sections. Potential feature/catchment section groupings are also highlighted and
numbered. The feature codes used are shown in Table 4.3 and 4.4, while Axis scores are
shown in Tables 4.5 – 4.10 (walkover features). Features suffixed with “.1” refer to counts;
“.3” suffix refers to %area.
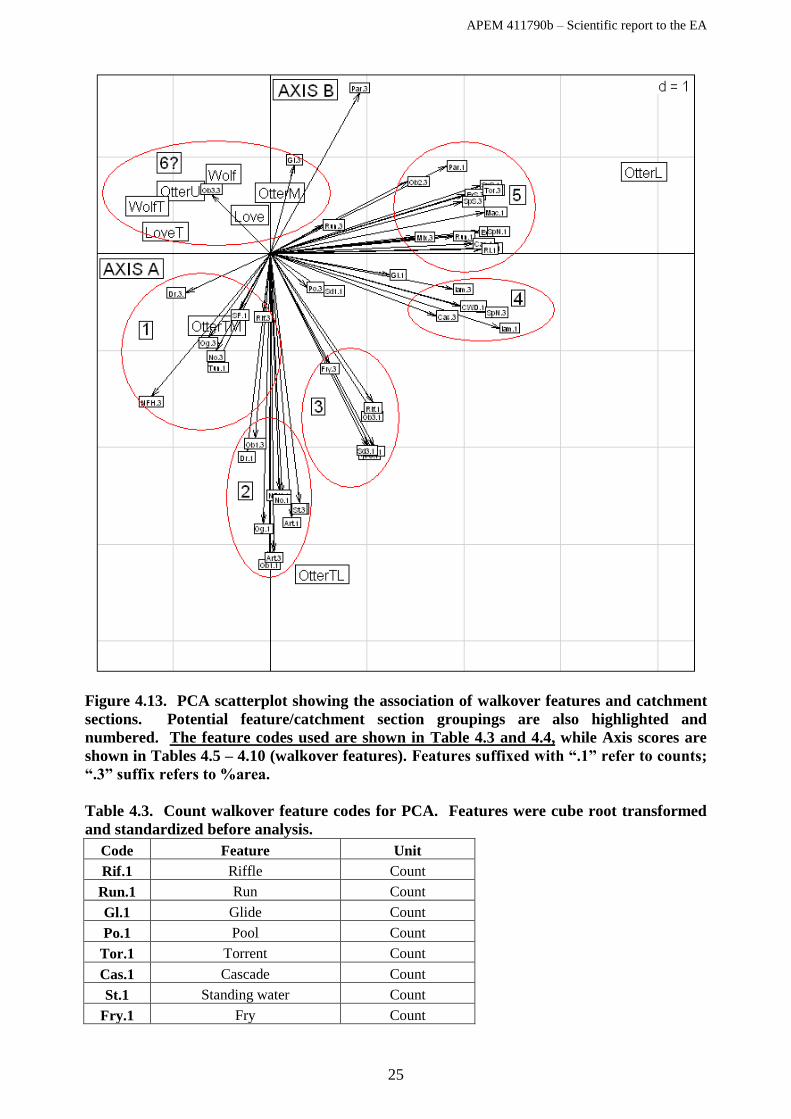
Table 4.3. Count walkover feature codes for PCA. Features were cube root transformed
and standardized before analysis.
Code Feature Unit
Rif.1 Riffle Count
Run.1 Run Count
Gl.1 Glide Count
Po.1 Pool Count
Tor.1 Torrent Count
Cas.1 Cascade Count
St.1 Standing water Count
Fry.1 Fry Count
APEM 411790b – Scientific report to the EA
26
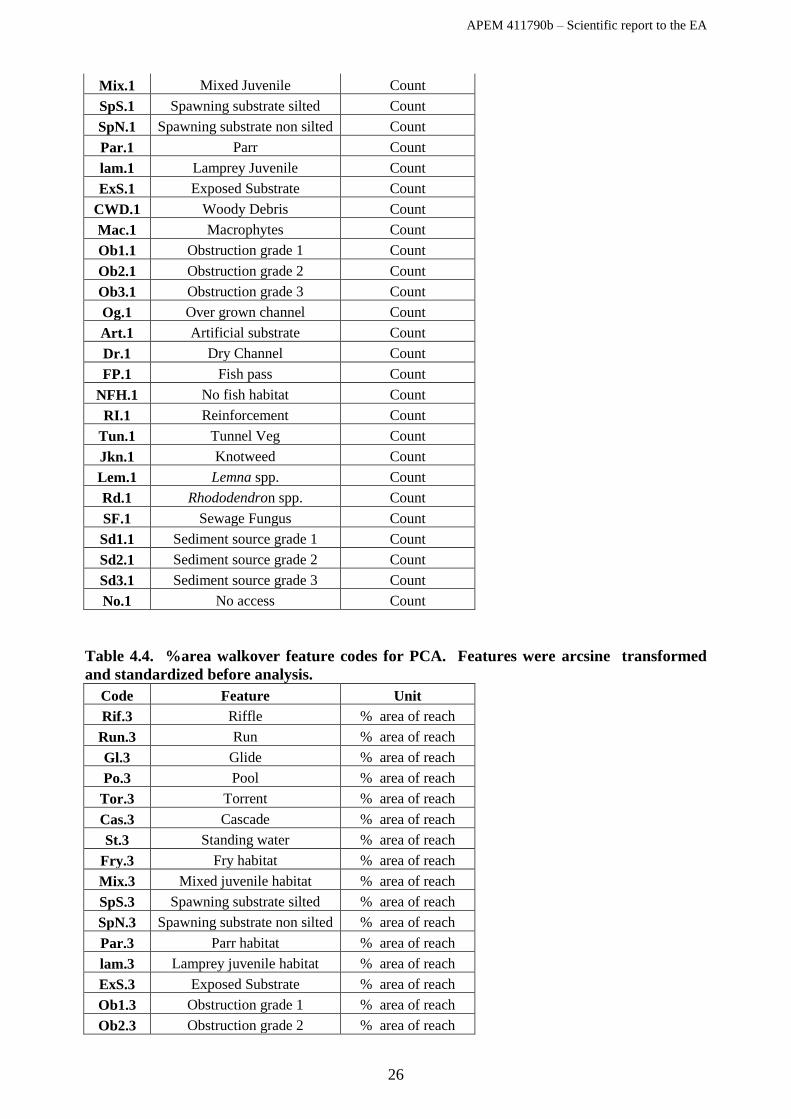
Mix.1 Mixed Juvenile Count
SpS.1 Spawning substrate silted Count
SpN.1 Spawning substrate non silted Count
Par.1 Parr Count
lam.1 Lamprey Juvenile Count
ExS.1 Exposed Substrate Count
CWD.1 Woody Debris Count
Mac.1 Macrophytes Count
Ob1.1 Obstruction grade 1 Count
Ob2.1 Obstruction grade 2 Count
Ob3.1 Obstruction grade 3 Count
Og.1 Over grown channel Count
Art.1 Artificial substrate Count
Dr.1 Dry Channel Count
FP.1 Fish pass Count
NFH.1 No fish habitat Count
RI.1 Reinforcement Count
Tun.1 Tunnel Veg Count
Jkn.1 Knotweed Count
Lem.1 Lemna spp. Count
Rd.1 Rhododendron spp. Count
SF.1 Sewage Fungus Count
Sd1.1 Sediment source grade 1 Count
Sd2.1 Sediment source grade 2 Count
Sd3.1 Sediment source grade 3 Count
No.1 No access Count
Table 4.4. %area walkover feature codes for PCA. Features were arcsine transformed
and standardized before analysis.
Code Feature Unit
Rif.3 Riffle % area of reach
Run.3 Run % area of reach
Gl.3 Glide % area of reach
Po.3 Pool % area of reach
Tor.3 Torrent % area of reach
Cas.3 Cascade % area of reach
St.3 Standing water % area of reach
Fry.3 Fry habitat % area of reach
Mix.3 Mixed juvenile habitat % area of reach
SpS.3 Spawning substrate silted % area of reach
SpN.3 Spawning substrate non silted % area of reach
Par.3 Parr habitat % area of reach
lam.3 Lamprey juvenile habitat % area of reach
ExS.3 Exposed Substrate % area of reach
Ob1.3 Obstruction grade 1 % area of reach
Ob2.3 Obstruction grade 2 % area of reach
APEM 411790b – Scientific report to the EA
27
Ob3.3 Obstruction grade 3 % area of reach
Og.3 Over grown channel % area of reach
Art.3 Artificial substrate % area of reach
Dr.3. Dry channel % area of reach
FP.3 Fish pass % area of reach
NFH.3 No fish habitat % area of reach
No.3 No access % area of reach
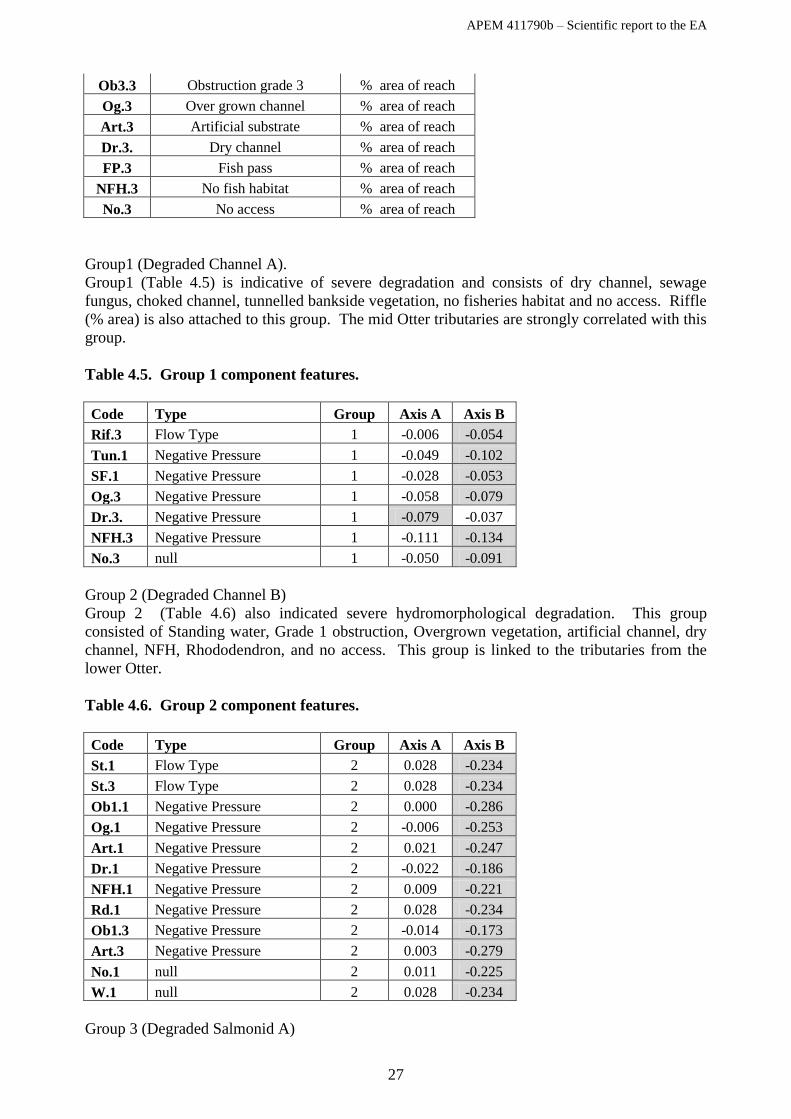
Group1 (Degraded Channel A).
Group1 (Table 4.5) is indicative of severe degradation and consists of dry channel, sewage
fungus, choked channel, tunnelled bankside vegetation, no fisheries habitat and no access. Riffle
(% area) is also attached to this group. The mid Otter tributaries are strongly correlated with this
group.
Table 4.5. Group 1 component features.
Code Type Group Axis A Axis B
Rif.3 Flow Type 1 -0.006 -0.054
Tun.1 Negative Pressure 1 -0.049 -0.102
SF.1 Negative Pressure 1 -0.028 -0.053
Og.3 Negative Pressure 1 -0.058 -0.079
Dr.3. Negative Pressure 1 -0.079 -0.037
NFH.3 Negative Pressure 1 -0.111 -0.134
No.3 null 1 -0.050 -0.091
Group 2 (Degraded Channel B)
Group 2 (Table 4.6) also indicated severe hydromorphological degradation. This group
consisted of Standing water, Grade 1 obstruction, Overgrown vegetation, artificial channel, dry
channel, NFH, Rhododendron, and no access. This group is linked to the tributaries from the
lower Otter.
Table 4.6. Group 2 component features.
Code Type Group Axis A Axis B
St.1 Flow Type 2 0.028 -0.234
St.3 Flow Type 2 0.028 -0.234
Ob1.1 Negative Pressure 2 0.000 -0.286
Og.1 Negative Pressure 2 -0.006 -0.253
Art.1 Negative Pressure 2 0.021 -0.247
Dr.1 Negative Pressure 2 -0.022 -0.186
NFH.1 Negative Pressure 2 0.009 -0.221
Rd.1 Negative Pressure 2 0.028 -0.234
Ob1.3 Negative Pressure 2 -0.014 -0.173
Art.3 Negative Pressure 2 0.003 -0.279
No.1 null 2 0.011 -0.225
W.1 null 2 0.028 -0.234
Group 3 (Degraded Salmonid A)
APEM 411790b – Scientific report to the EA
28
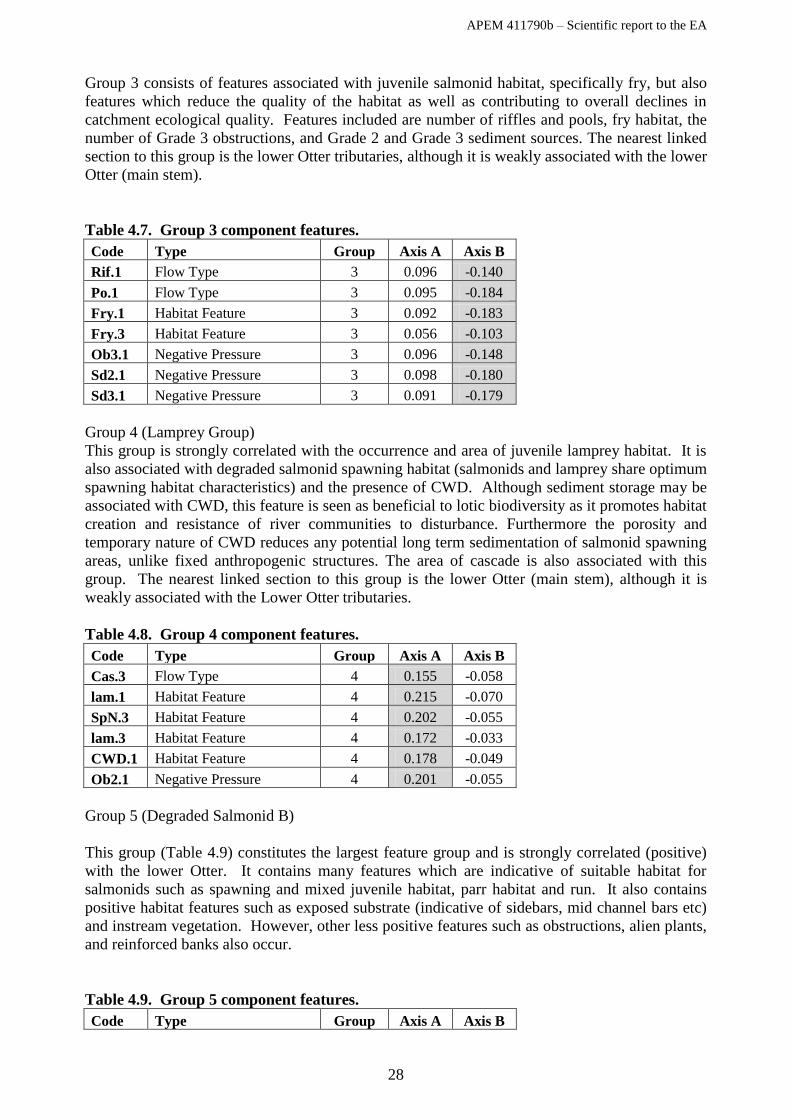
Group 3 consists of features associated with juvenile salmonid habitat, specifically fry, but also
features which reduce the quality of the habitat as well as contributing to overall declines in
catchment ecological quality. Features included are number of riffles and pools, fry habitat, the
number of Grade 3 obstructions, and Grade 2 and Grade 3 sediment sources. The nearest linked
section to this group is the lower Otter tributaries, although it is weakly associated with the lower
Otter (main stem).
Table 4.7. Group 3 component features.
Code Type Group Axis A Axis B
Rif.1 Flow Type 3 0.096 -0.140
Po.1 Flow Type 3 0.095 -0.184
Fry.1 Habitat Feature 3 0.092 -0.183
Fry.3 Habitat Feature 3 0.056 -0.103
Ob3.1 Negative Pressure 3 0.096 -0.148
Sd2.1 Negative Pressure 3 0.098 -0.180
Sd3.1 Negative Pressure 3 0.091 -0.179
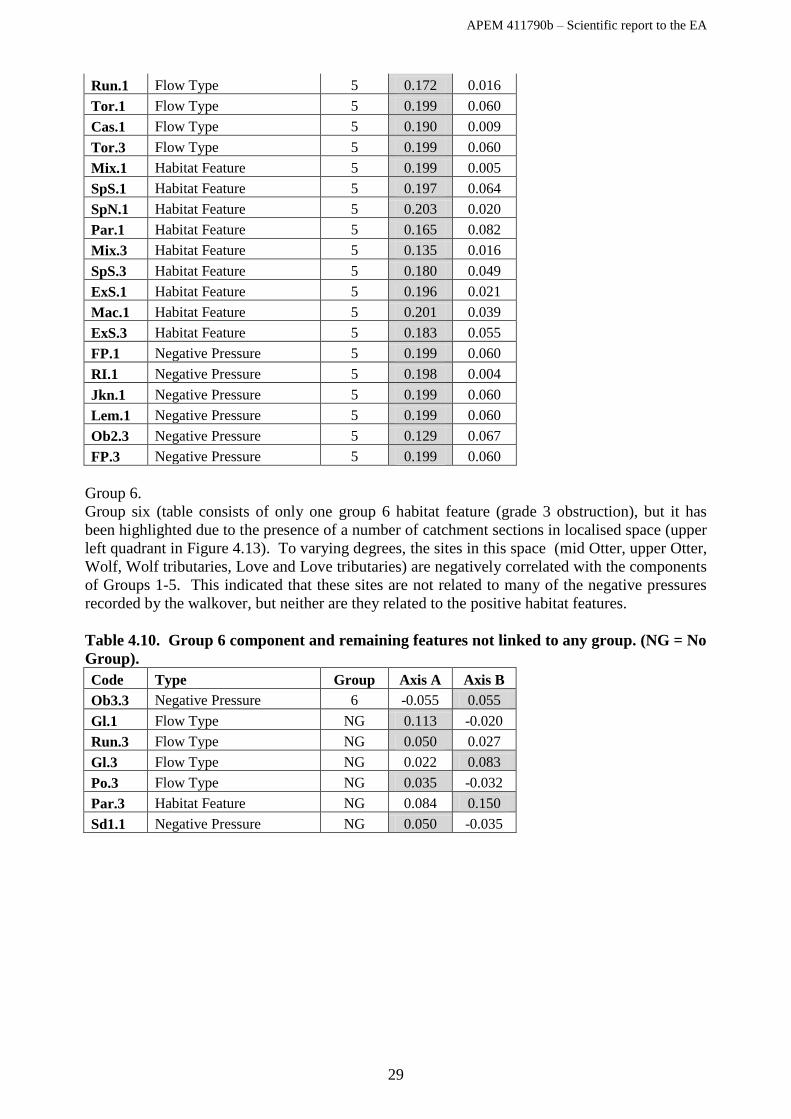
Group 4 (Lamprey Group)
This group is strongly correlated with the occurrence and area of juvenile lamprey habitat. It is
also associated with degraded salmonid spawning habitat (salmonids and lamprey share optimum
spawning habitat characteristics) and the presence of CWD. Although sediment storage may be
associated with CWD, this feature is seen as beneficial to lotic biodiversity as it promotes habitat
creation and resistance of river communities to disturbance. Furthermore the porosity and
temporary nature of CWD reduces any potential long term sedimentation of salmonid spawning
areas, unlike fixed anthropogenic structures. The area of cascade is also associated with this
group. The nearest linked section to this group is the lower Otter (main stem), although it is
weakly associated with the Lower Otter tributaries.
Table 4.8. Group 4 component features.
Code Type Group Axis A Axis B
Cas.3 Flow Type 4 0.155 -0.058
lam.1 Habitat Feature 4 0.215 -0.070
SpN.3 Habitat Feature 4 0.202 -0.055
lam.3 Habitat Feature 4 0.172 -0.033
CWD.1 Habitat Feature 4 0.178 -0.049
Ob2.1 Negative Pressure 4 0.201 -0.055
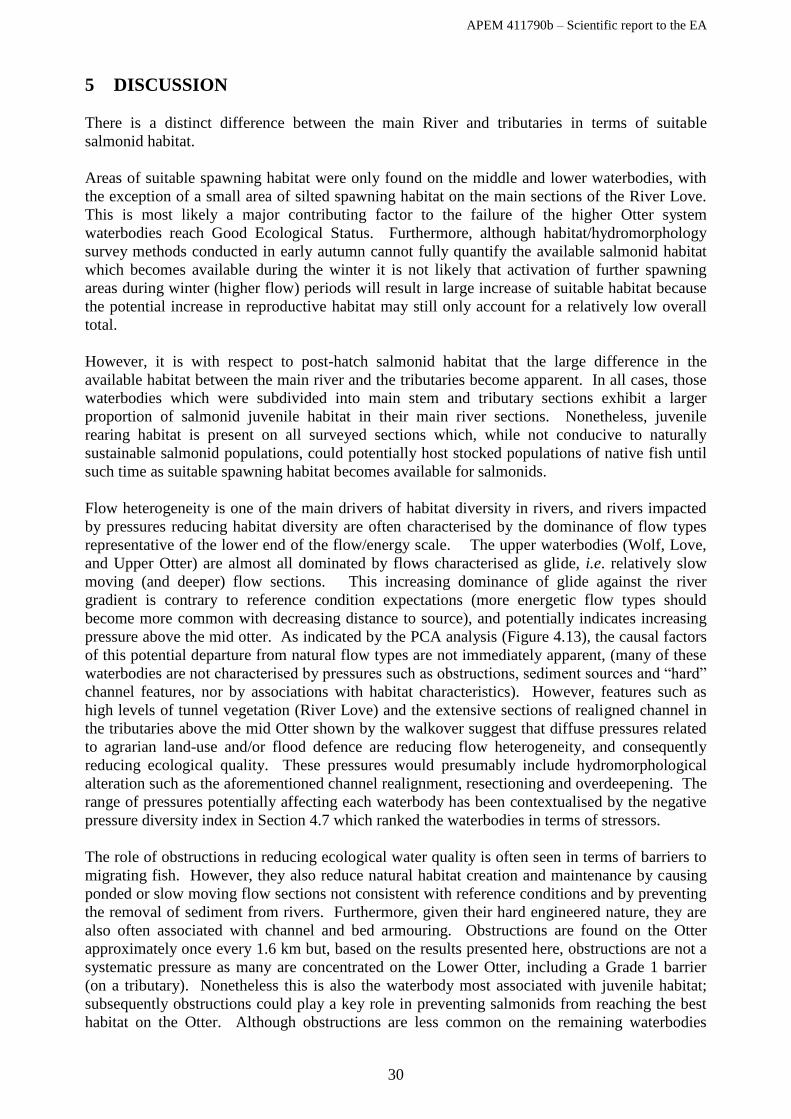
Group 5 (Degraded Salmonid B)
This group (Table 4.9) constitutes the largest feature group and is strongly correlated (positive)
with the lower Otter. It contains many features which are indicative of suitable habitat for
salmonids such as spawning and mixed juvenile habitat, parr habitat and run. It also contains
positive habitat features such as exposed substrate (indicative of sidebars, mid channel bars etc)
and instream vegetation. However, other less positive features such as obstructions, alien plants,
and reinforced banks also occur.
Table 4.9. Group 5 component features.
Code Type Group Axis A Axis B
APEM 411790b – Scientific report to the EA
29
Run.1 Flow Type 5 0.172 0.016
Tor.1 Flow Type 5 0.199 0.060
Cas.1 Flow Type 5 0.190 0.009
Tor.3 Flow Type 5 0.199 0.060
Mix.1 Habitat Feature 5 0.199 0.005
SpS.1 Habitat Feature 5 0.197 0.064
SpN.1 Habitat Feature 5 0.203 0.020
Par.1 Habitat Feature 5 0.165 0.082
Mix.3 Habitat Feature 5 0.135 0.016
SpS.3 Habitat Feature 5 0.180 0.049
ExS.1 Habitat Feature 5 0.196 0.021
Mac.1 Habitat Feature 5 0.201 0.039
ExS.3 Habitat Feature 5 0.183 0.055
FP.1 Negative Pressure 5 0.199 0.060
RI.1 Negative Pressure 5 0.198 0.004
Jkn.1 Negative Pressure 5 0.199 0.060
Lem.1 Negative Pressure 5 0.199 0.060
Ob2.3 Negative Pressure 5 0.129 0.067
FP.3 Negative Pressure 5 0.199 0.060
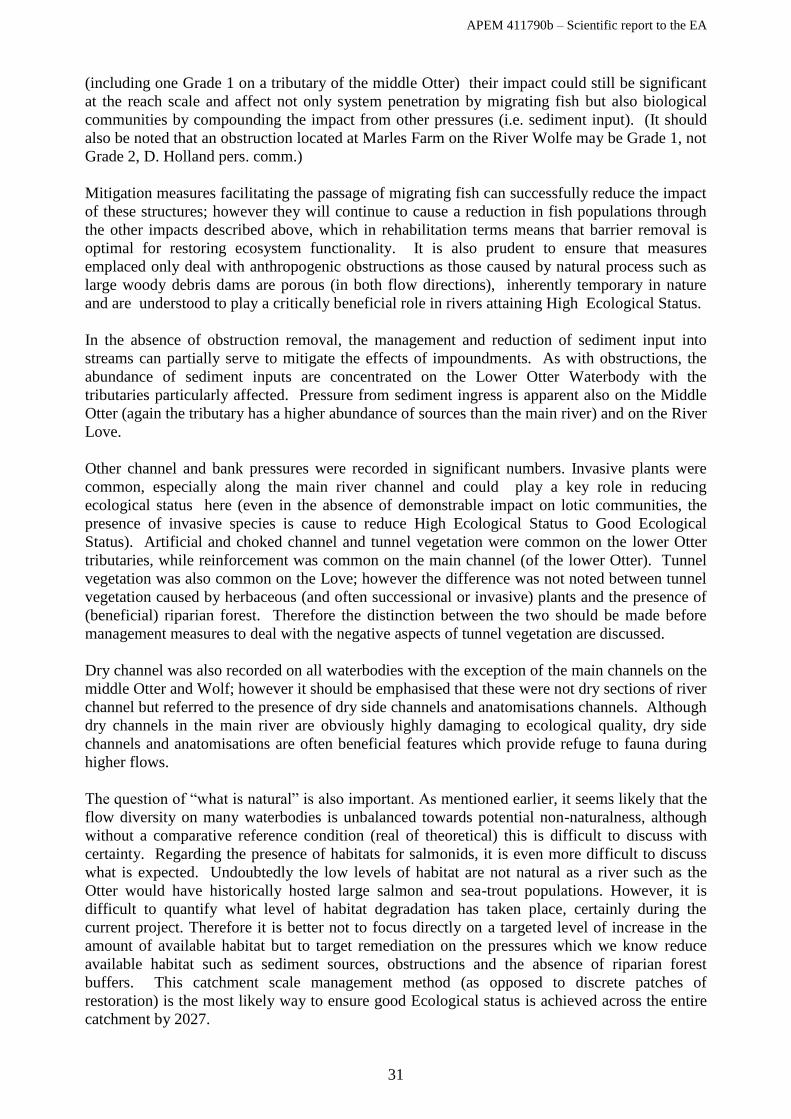
Group 6.
Group six (table consists of only one group 6 habitat feature (grade 3 obstruction), but it has
been highlighted due to the presence of a number of catchment sections in localised space (upper
left quadrant in Figure 4.13). To varying degrees, the sites in this space (mid Otter, upper Otter,
Wolf, Wolf tributaries, Love and Love tributaries) are negatively correlated with the components
of Groups 1-5. This indicated that these sites are not related to many of the negative pressures
recorded by the walkover, but neither are they related to the positive habitat features.
Table 4.10. Group 6 component and remaining features not linked to any group. (NG = No
Group).
Code Type Group Axis A Axis B
Ob3.3 Negative Pressure 6 -0.055 0.055
Gl.1 Flow Type NG 0.113 -0.020
Run.3 Flow Type NG 0.050 0.027
Gl.3 Flow Type NG 0.022 0.083
Po.3 Flow Type NG 0.035 -0.032
Par.3 Habitat Feature NG 0.084 0.150
Sd1.1 Negative Pressure NG 0.050 -0.035
APEM 411790b – Scientific report to the EA
30
5 DISCUSSION
There is a distinct difference between the main River and tributaries in terms of suitable
salmonid habitat.
Areas of suitable spawning habitat were only found on the middle and lower waterbodies, with
the exception of a small area of silted spawning habitat on the main sections of the River Love.
This is most likely a major contributing factor to the failure of the higher Otter system
waterbodies reach Good Ecological Status. Furthermore, although habitat/hydromorphology
survey methods conducted in early autumn cannot fully quantify the available salmonid habitat
which becomes available during the winter it is not likely that activation of further spawning
areas during winter (higher flow) periods will result in large increase of suitable habitat because
the potential increase in reproductive habitat may still only account for a relatively low overall
total.
However, it is with respect to post-hatch salmonid habitat that the large difference in the
available habitat between the main river and the tributaries become apparent. In all cases, those
waterbodies which were subdivided into main stem and tributary sections exhibit a larger
proportion of salmonid juvenile habitat in their main river sections. Nonetheless, juvenile
rearing habitat is present on all surveyed sections which, while not conducive to naturally
sustainable salmonid populations, could potentially host stocked populations of native fish until
such time as suitable spawning habitat becomes available for salmonids.
Flow heterogeneity is one of the main drivers of habitat diversity in rivers, and rivers impacted
by pressures reducing habitat diversity are often characterised by the dominance of flow types
representative of the lower end of the flow/energy scale. The upper waterbodies (Wolf, Love,
and Upper Otter) are almost all dominated by flows characterised as glide, i.e. relatively slow
moving (and deeper) flow sections. This increasing dominance of glide against the river
gradient is contrary to reference condition expectations (more energetic flow types should
become more common with decreasing distance to source), and potentially indicates increasing
pressure above the mid otter. As indicated by the PCA analysis (Figure 4.13), the causal factors
of this potential departure from natural flow types are not immediately apparent, (many of these
waterbodies are not characterised by pressures such as obstructions, sediment sources and “hard”
channel features, nor by associations with habitat characteristics). However, features such as
high levels of tunnel vegetation (River Love) and the extensive sections of realigned channel in
the tributaries above the mid Otter shown by the walkover suggest that diffuse pressures related
to agrarian land-use and/or flood defence are reducing flow heterogeneity, and consequently
reducing ecological quality. These pressures would presumably include hydromorphological
alteration such as the aforementioned channel realignment, resectioning and overdeepening. The
range of pressures potentially affecting each waterbody has been contextualised by the negative
pressure diversity index in Section 4.7 which ranked the waterbodies in terms of stressors.
The role of obstructions in reducing ecological water quality is often seen in terms of barriers to
migrating fish. However, they also reduce natural habitat creation and maintenance by causing
ponded or slow moving flow sections not consistent with reference conditions and by preventing
the removal of sediment from rivers. Furthermore, given their hard engineered nature, they are
also often associated with channel and bed armouring. Obstructions are found on the Otter
approximately once every 1.6 km but, based on the results presented here, obstructions are not a
systematic pressure as many are concentrated on the Lower Otter, including a Grade 1 barrier
(on a tributary). Nonetheless this is also the waterbody most associated with juvenile habitat;
subsequently obstructions could play a key role in preventing salmonids from reaching the best
habitat on the Otter. Although obstructions are less common on the remaining waterbodies
APEM 411790b – Scientific report to the EA
31
(including one Grade 1 on a tributary of the middle Otter) their impact could still be significant
at the reach scale and affect not only system penetration by migrating fish but also biological
communities by compounding the impact from other pressures (i.e. sediment input). (It should
also be noted that an obstruction located at Marles Farm on the River Wolfe may be Grade 1, not
Grade 2, D. Holland pers. comm.)
Mitigation measures facilitating the passage of migrating fish can successfully reduce the impact
of these structures; however they will continue to cause a reduction in fish populations through
the other impacts described above, which in rehabilitation terms means that barrier removal is
optimal for restoring ecosystem functionality. It is also prudent to ensure that measures
emplaced only deal with anthropogenic obstructions as those caused by natural process such as
large woody debris dams are porous (in both flow directions), inherently temporary in nature
and are understood to play a critically beneficial role in rivers attaining High Ecological Status.
In the absence of obstruction removal, the management and reduction of sediment input into
streams can partially serve to mitigate the effects of impoundments. As with obstructions, the
abundance of sediment inputs are concentrated on the Lower Otter Waterbody with the
tributaries particularly affected. Pressure from sediment ingress is apparent also on the Middle
Otter (again the tributary has a higher abundance of sources than the main river) and on the River
Love.
Other channel and bank pressures were recorded in significant numbers. Invasive plants were
common, especially along the main river channel and could play a key role in reducing
ecological status here (even in the absence of demonstrable impact on lotic communities, the
presence of invasive species is cause to reduce High Ecological Status to Good Ecological
Status). Artificial and choked channel and tunnel vegetation were common on the lower Otter
tributaries, while reinforcement was common on the main channel (of the lower Otter). Tunnel
vegetation was also common on the Love; however the difference was not noted between tunnel
vegetation caused by herbaceous (and often successional or invasive) plants and the presence of
(beneficial) riparian forest. Therefore the distinction between the two should be made before
management measures to deal with the negative aspects of tunnel vegetation are discussed.
Dry channel was also recorded on all waterbodies with the exception of the main channels on the
middle Otter and Wolf; however it should be emphasised that these were not dry sections of river
channel but referred to the presence of dry side channels and anatomisations channels. Although
dry channels in the main river are obviously highly damaging to ecological quality, dry side
channels and anatomisations are often beneficial features which provide refuge to fauna during
higher flows.
The question of “what is natural” is also important. As mentioned earlier, it seems likely that the
flow diversity on many waterbodies is unbalanced towards potential non-naturalness, although
without a comparative reference condition (real of theoretical) this is difficult to discuss with
certainty. Regarding the presence of habitats for salmonids, it is even more difficult to discuss
what is expected. Undoubtedly the low levels of habitat are not natural as a river such as the
Otter would have historically hosted large salmon and sea-trout populations. However, it is
difficult to quantify what level of habitat degradation has taken place, certainly during the
current project. Therefore it is better not to focus directly on a targeted level of increase in the
amount of available habitat but to target remediation on the pressures which we know reduce
available habitat such as sediment sources, obstructions and the absence of riparian forest
buffers. This catchment scale management method (as opposed to discrete patches of
restoration) is the most likely way to ensure good Ecological status is achieved across the entire
catchment by 2027.
APEM 411790b – Scientific report to the EA
32
Diversity Indices.
The use of H’ and Si to score aquatic habitat features and negative pressures appear to be a novel
aspect to this study. While often used for species diversity, these indices are rarely used to
describe habitat heterogeneity, and this is undoubtedly the first time they have been used to
apply a metric score to APEM’s habitat walkover. However, as they do appear to reflect results
from other analysis (namely PCA) and the diversity patterns obvious from the dotcharts, we
suggest that their use has been broadly successful. Shannon scores (when standardised from 0 –
1 against a theoretical maximum of 3.5) were much lower than Simpson scores.
Evenness is a major component of the Shannon index, with increasing evenness resulting in
increasing score, but, river typologies are often characterised by dominant flows and substrates
etc. Therefore, evenness could be indicative of pressure. Simpson, on the other hand, gives
greater weight to dominance within a framework of higher scores for higher diversity so it would
be more suitable for characterising habitat features at the river typology scale. However, as this
study was unable to make the distinction between river types, either score is acceptable.
The negative pressure scores present a valid picture of the relative scale of ecological
degradation between the catchment sections. In RHS, a 500m scale habitat hydromorphology
classification tool, it is commonly accepted that metric scores for anthropogenic alteration can be
compared across all river types. Therefore, our use of the Si and H’ metric scores to compare
catchment sections with regard to pressure is justified.
Habitat quality scores in RHS however are not comparable as habitat features change with the
river gradient, especially with regard to flows and flow-derived processes. Therefore it could be
argued that comparing the H’ and Si habitat quality metrics between waterbodies is not relevant
for this category (and it may explain why the Upper Otter, the only waterbody with Good
Ecological Status, had such a low habitat diversity score). However, as the catchment groupings
are based at the waterbody level, it may be that the larger scales make comparison more relevant.
In future, should a typology classification become available then it would allow APEM to
compare scores within river types in different waterbodies, allowing for a much higher degree of
resolution to identify good quality streams requiring protection, as well as identify those reaches
which will require considerable effort if Good Ecological Status is to be achieved. This has
direct implications for the implementation of the second phase of the RBMP.
Principal Component Analyses.
The PCA matches waterbodies with the habitat features through their shared association with
derived variables or axes. It provides an output which characterises sites by the features most
associated with that waterbody, and allows for prioritisation of the negative features affecting
waterbodies.
The PCA highlights the concentration of habitat characteristics and negative catchment pressures
on the Lower Otter. The lower Otter (main stem) is most strongly associated with reinforced
bank, obstructions and invasive plants, and mitigation measures should be focused towards these
pressures accordingly. The lower Otter tributaries are strongly characterised by the single Grade
1 obstruction, and also standing water, choked and artificial channel. The mid Otter tributaries
are associated with overgrown (choked) channel and tunnel vegetation. Associations between
surveyed features and the remaining survey sections are weak, and as mentioned earlier highlight
the likely presence of other land-use related pressures which are not within the method for the
APEM 411790b – Scientific report to the EA
33
walkover. The presence of sediment pressures is not particularly associated with any one
waterbody; however this is due to the ubiquitous nature of this pressure on the Otter and its
tributaries and for the purposes of prioritisation should be considered a systematic pressure.
6 CONCLUSIONS
A table outlining the main pressures potentially impacting the population success of important
fish species on the Otter is presented below. This table is only representative of the pressures
surveyed by the Walkover method. Pressures are in order of importance.
Waterbody Pressure(s)
Otter Lower Waterbody Barriers, sediment, invasive plants, physical
modifications
Otter Lower Waterbody
tributaries Barriers, sediment, choked channel, NFH
Mid Otter Waterbody Poor flow heterogeneity
Mid Otter Waterbody tributaries Sediment, barriers
Upper Otter Waterbody Poor flow heterogeneity, poor fish habitat
River Wolf Waterbody Poor flow heterogeneity, barrier, poor fish habitat
River Wolf Waterbody tributaries Poor flow heterogeneity, poor fish habitat
River Love Waterbody Sediment, Poor flow heterogeneity
River Love Waterbody tributaries Poor fish habitat, tunnel vegetation.
7 REFERENCES. Baglinere, J.L. and Chamigneulle, A. (1986). Population Estimates of Juvenile Atlantic salmon (Salmo
salar) as indices of Smolt Production in the Scorff River, Brittany France. Journal of Fish Biology, 29,
467-482.
Bjorn, T.C. and Reiser, D.W. (1991). Habitat requirements of salmonids in streams. In Influences of
forest management on salmonid fishes and their habitats, (ed. W.R. Meehan), Bethseda, American
Fisheries Society.
Environment Agency. (2009). River Basin Management Plan, South West River Basin District.
Environment Agency, Exeter.
Haury, J., Bagliniere, J.L. and Maisse, G. (1995). Analysis of spatial and temporal organisation in a
salmonid brook in relation to physical factors and macrophytic vegetation. Hydrobiologia, 300/301, 269-
277.
Heggenes, J. (1990). Habitat utilisation and preferences in juvenile Atlantic salmon (Salmo salar) in
Streams. Regulated Rivers Research and Management, 5, 341-354.
Hendry K. & Cragg-Hine D. (1997). Restoration of Riverine Salmon Habitats; A Guidance Manual.
Fisheries Technical Manual 4, R & D: Technical Report W144, Environment Agency, Bristol.
APEM 411790b – Scientific report to the EA
34
Peterson, R.H. (1978). Physical characteristics of spawning salmon gravel in some New Brunswick
streams. Fisheries and Marine Service Technical Report, 785. St Andrews, Canada: Fisheries and
Environment.
Symons, P. and Heland, M. (1978). Stream Habitats and Behavioural Interactions of Underyearling and
Yearling Atlantic Salmon (Salmo salar). Journal of the Fisheries Research Board Canada, 35, 175–183.
Wankowski, J.W.J. and Thorpe, J.E. (1979). Spatial Distribution and Feeding in Atlantic salmon (Salmo
salar) Juveniles. Journal of Fish Biology, 14, 239-242
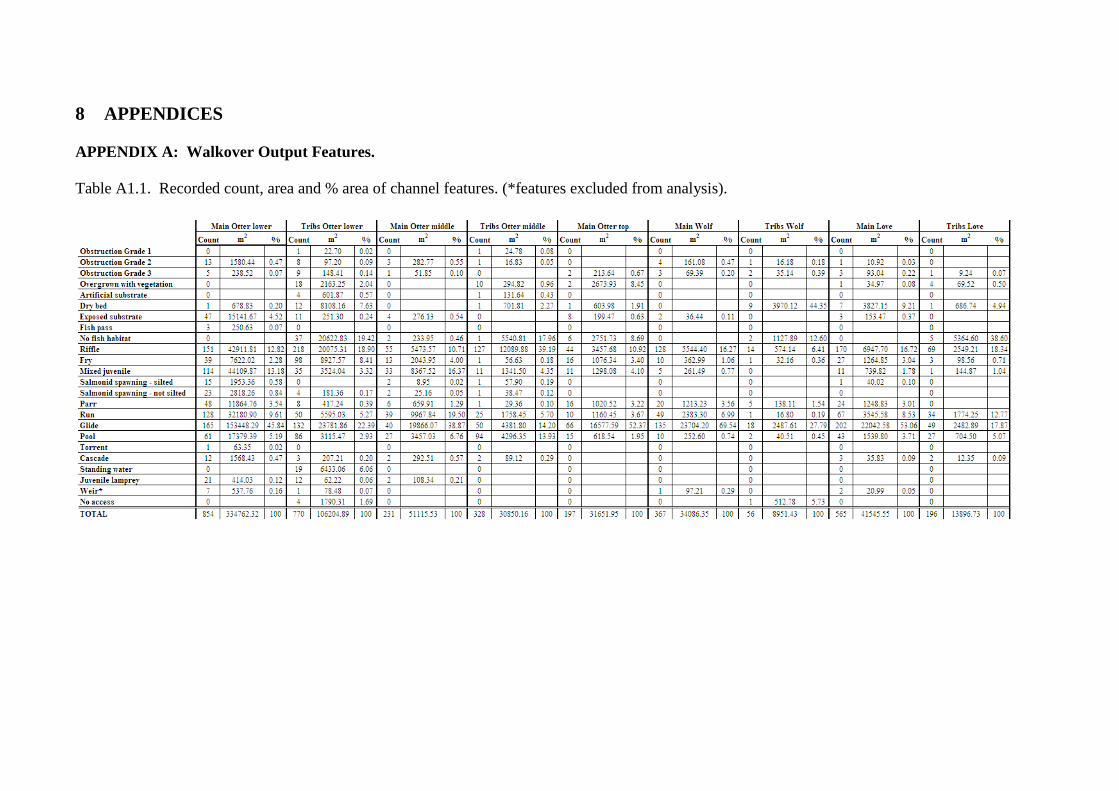
8 APPENDICES
APPENDIX A: Walkover Output Features.
Table A1.1. Recorded count, area and % area of channel features. (*features excluded from analysis).
APEM 411790b – Scientific report to the EA
36
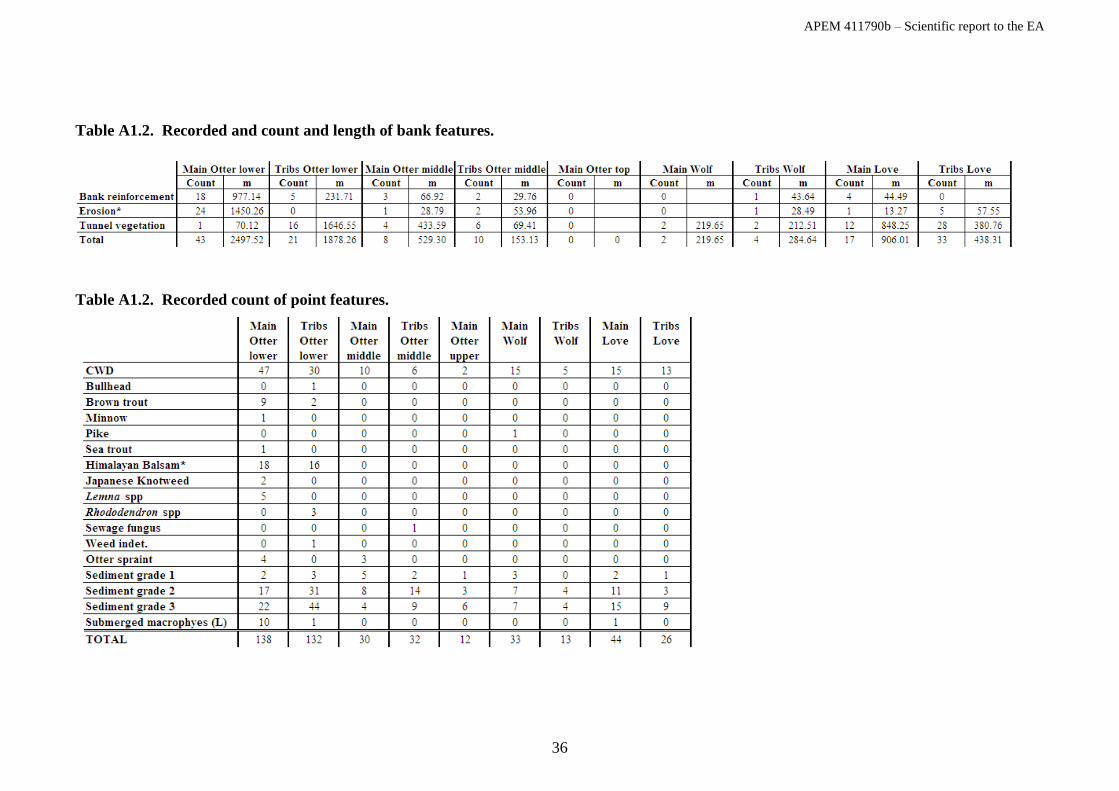
Table A1.2. Recorded and count and length of bank features.
Table A1.2. Recorded count of point features.