telenor – fourth quarter 2006 · for or otherwise acquire securities in any company within the...
TRANSCRIPT

Telenor – Fourth Quarter 2006

The following presentations are being made only to, and is only directed at, persons to whom such presentationmay lawfully be communicated (“relevant persons”). Any person who is not a relevant person should not act or rely on these presentations or any of its contents. Information in the following presentations relating to the priceat which relevant investments have been bought or sold in the past or the yield on such investments cannot be relied upon as a guide to the future performance of such investments. This presentation does not constitute an offering of securities or otherwise constitute an invitation or inducement to any person to underwrite, subscribefor or otherwise acquire securities in any company within the Telenor Group. The release, publication or distribution of this presentation in certain jurisdictions may be restricted by law, and therefore persons in suchjurisdictions into which this presentation is released, published or distributed should inform themselves about, and observe, such restrictions. The presentation contain statements regarding the future in connection withTelenor's growth initiatives, profit figures, outlook, strategies and objectives. All statements regarding the futureare subject to inherent risks and uncertainties, and many factors can lead to actual profits and developmentsdeviating substantially from what has been expressed or implied in such statements. These factors include therisk factors relating to Telenor's activities described in Telenor's 2005 Annual Report on Form 20-F filed with theSecurities and Exchange Commission in the USA under the headings “Cautionary Statement Regarding Forward-Looking Statements” and “Risk Factors” (available at www.telenor.com/ir/).
There are litigation and arbitration proceedings pending in New York involving Kyivstar's shareholders relating to Kyivstar's shareholders agreement. Further proceedings have recently been brought in Ukrainian courts by Storm LLC (43.5% shareholder in Kyivstar) and a related party challenging the authority of the company to appoint auditors. An injunction from Krasnolutsk City Court of Lugansk Region has been issued that, among other things, purports to prohibit Kyivstar's management from providing financial information to Kyivstar's international auditors, the company’s shareholders, including Telenor, from using financial information already provided by Kyivstar and Kyivstar and Telenor's auditors from carrying out any audit work in relation to Kyivstar's year-end IFRS financial statements. Telenor is contesting these actions. As a result of not having the ability to obtain relevant financial information from Kyivstar, the information contained in Telenor's fourth quarter results relating to Kyivstar is based on estimated figures. Actual results could differ from these estimates.
Disclaimer

Group OverviewJon Fredrik Baksaas
President and CEO

• Revenue growth of 37%
• EBITDA margin improved from 35% to 36%
• Significantly improved operating cash flow
• The underlying growth to continue in 2007
Revenues (NOKbn)/EBITDA %91.1
66.6
36 %35 %
2005 2006
32.7
23.3
16.4 19.0
2005 2006
EBITDA CAPEX
2006
An Outstanding Year

• Revenue growth of 30%
• 10 million new mobile subscriptions
• EBITDA margin of 33%
• Improved operating cash flow
Revenues (NOKm)/EBITDA %
18 860
24 535
33.4 %34.9 %
Q4 05 Q4 06
6 576
8 194
6 436 6 095
Q4 05 Q4 06
EBITDA CAPEX
Q4 2006
Strong Growth with Reduced Margin

• Active migration to cheaper low churn subscriptions
• Increased loyalty through closed user group offerings
Focusing on Customer Retention
Norway - Mobile

Price Reductions Offset by Increased MoU
Norway - Mobile
184
205
199196
186186
1.51.71.71.61.71.7
Q3 05 Q4 05 Q1 06 Q2 06 Q3 06 Q4 06
MoU and APPM (NOK)
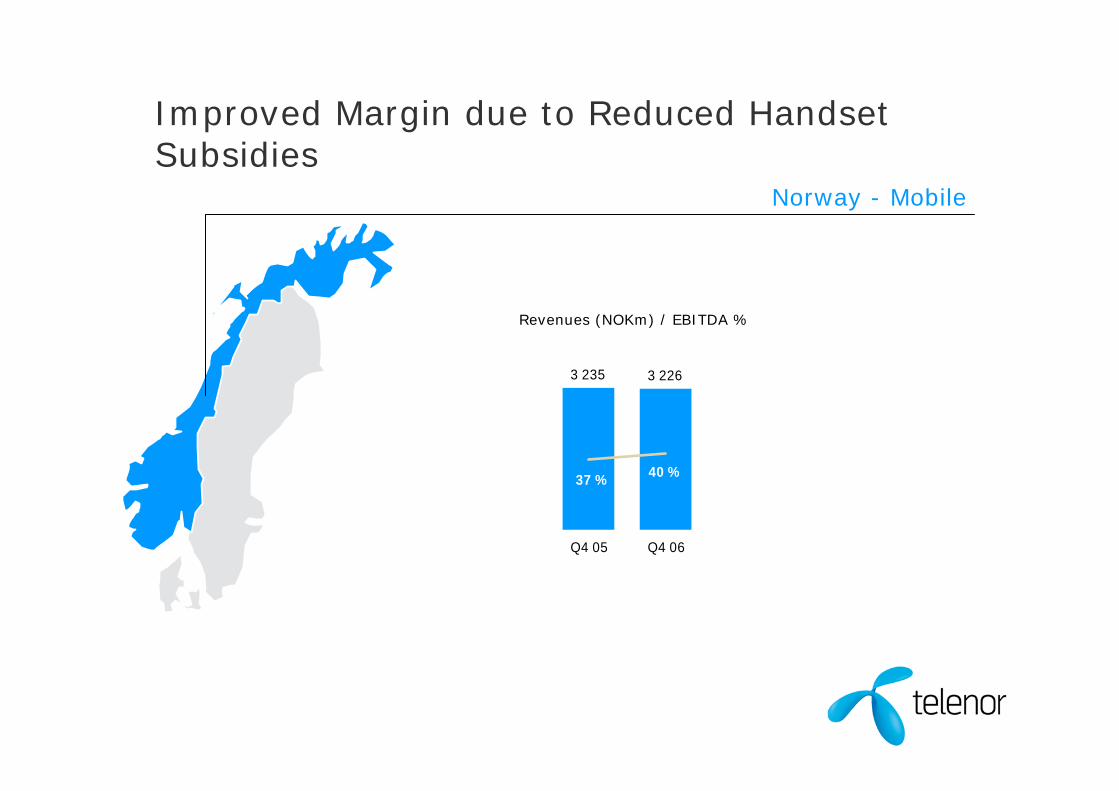
Improved Margin due to Reduced Handset Subsidies
Norway - Mobile
3 235 3 226
37 % 40 %
Q4 05 Q4 06
Revenues (NOKm) / EBITDA %
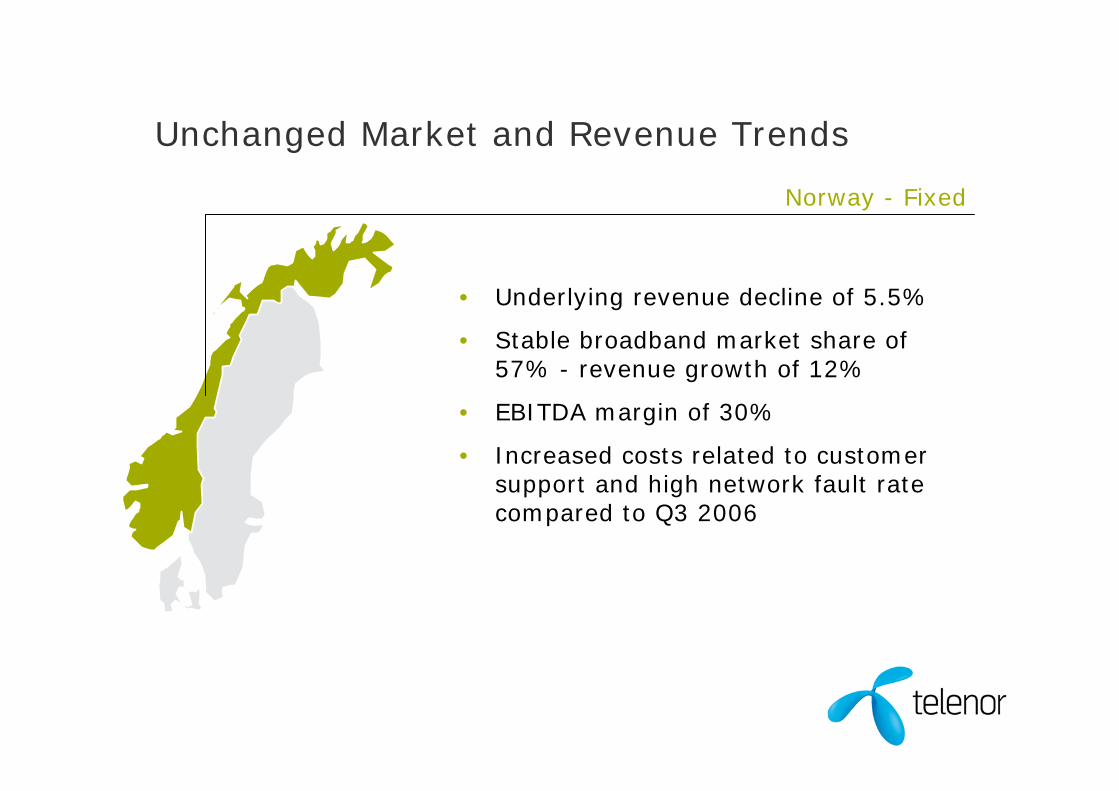
Unchanged Market and Revenue Trends
Norway - Fixed
• Underlying revenue decline of 5.5%
• Stable broadband market share of 57% - revenue growth of 12%
• EBITDA margin of 30%
• Increased costs related to customer support and high network fault rate compared to Q3 2006

Maintaining Cost Reduction Ambitions
Norway - Fixed
1 9101 781
34 12
6575
35
Q4 05 One-offitems
Sales andCustomerSupport
Productand IS
Operationand
delivery
Other Q4 06
(NOKm)
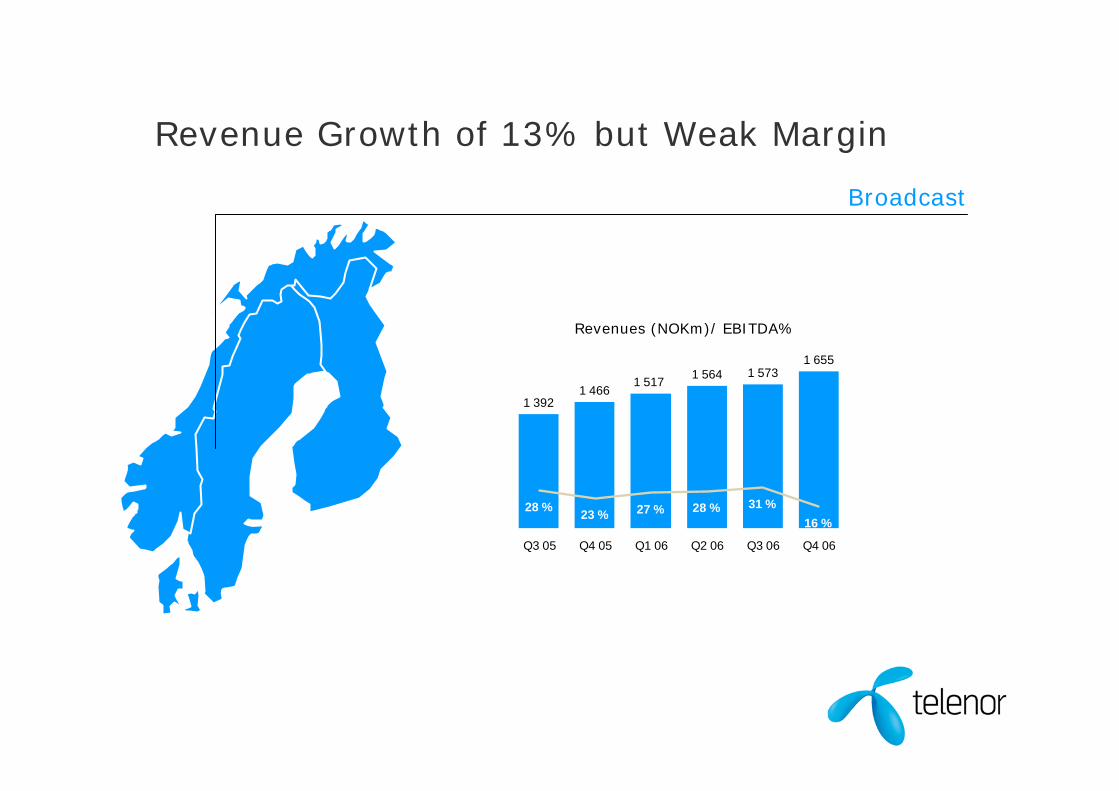
Broadcast
1 3921 466
1 517 1 564 1 5731 655
28 % 23 % 27 % 28 % 31 %16 %
Q3 05 Q4 05 Q1 06 Q2 06 Q3 06 Q4 06
Revenues (NOKm)/ EBITDA%
Revenue Growth of 13% but Weak Margin

Taking the Leading Position on HDTV
Broadcast
• First mover on HDTV with exclusive content
• Negotiation of content rights with effect from January 2006
– Premier League for three seasons
– UEFA EURO 2008
• Free installation and high decoder subsidies
• Replacement of satellite in H2 2007

With referance to disclaimer – Telenor estimates
SIM Penetration Above 100%
Ukraine - Kyivstar
50
1620
23
3033
3640
104 %
85 %
64 % 69 %
49 %34 %
41 %
76 %
Q105 Q205 Q305 Q405 Q1 06 Q2 06 Q3 06 Q4 06
Total Market Subscriptions (million)/Penetration%

Christmas Campaigns BoostSubscription Growth
Ukraine - Kyivstar
21.5
17.7
13.9
10.9
6.34.9
Q3 04 Q4 04 Q3 05 Q4 05 Q3 06 Q4 06
+1.4
+3.0
+3.8
Subscription growth (million)
With referance to disclaimer – Telenor estimates

Increased Price Competition
Ukraine - Kyivstar
95
123 127
95103 108
0.320.37
0.770.60
0.49 0.45
Q3 04 Q4 04 Q3 05 Q4 05 Q3 06 Q4 06
0%
-22% -8% -14%
+5%
+3%
QoQ Growth in MoU
Change in Average Price Per Minute (Local Currency)
With referance to disclaimer – Telenor estimates
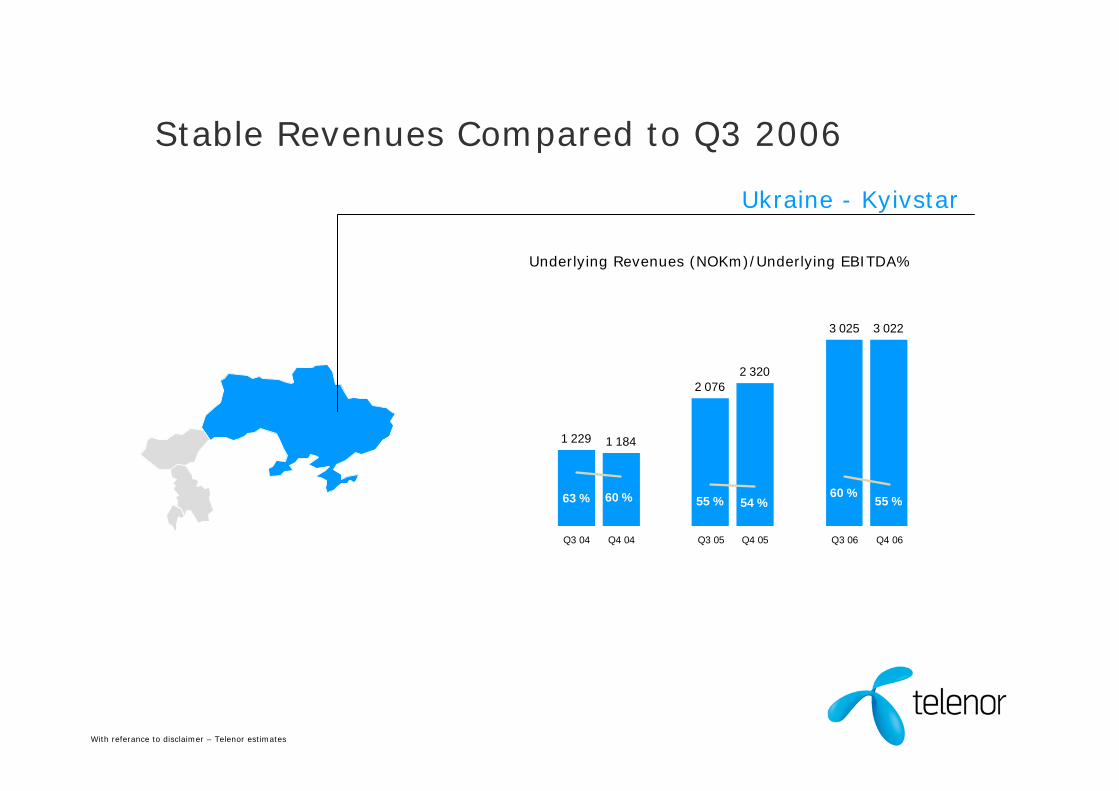
Stable Revenues Compared to Q3 2006
Ukraine - Kyivstar
1 229 1 184
2 0762 320
3 025 3 022
55 % 54 %60 % 55 %60 %63 %
Q3 04 Q4 04 Q3 05 Q4 05 Q3 06 Q4 06
Underlying Revenues (NOKm)/Underlying EBITDA%
With referance to disclaimer – Telenor estimates

Building Position for Future Revenue Growth
Ukraine - Kyivstar
1 229 1 184 1163
1 643
2 076
2 320
Q3 04 Q4 04 Q1 05 Q2 05 Q3 05 Q4 05
Underlying Revenues (NOKm)
With referance to disclaimer – Telenor estimates
2 329
2 580
3 0223 025
Q1 06 Q2 06 Q3 06 Q4 06

Interconnection implemented
Thailand - DTAC
Malaysia - DiGi
Well managed pre paid registration process

Telenor PakistanTore Johnsen
CEO Telenor Pakistan

• Passed 7 million subscriptions – netadds of 2.1 million in Q4
• Taking almost 50% of net adds in December
• Increased official market share to 14%
• Revenue growth of 46% in localcurrency compared to Q306
• ARPU of USD 4.5
Telenor Pakistan
Increasing Market Share and ARPUTelenor Pakistan
Increasing Market Share and ARPU
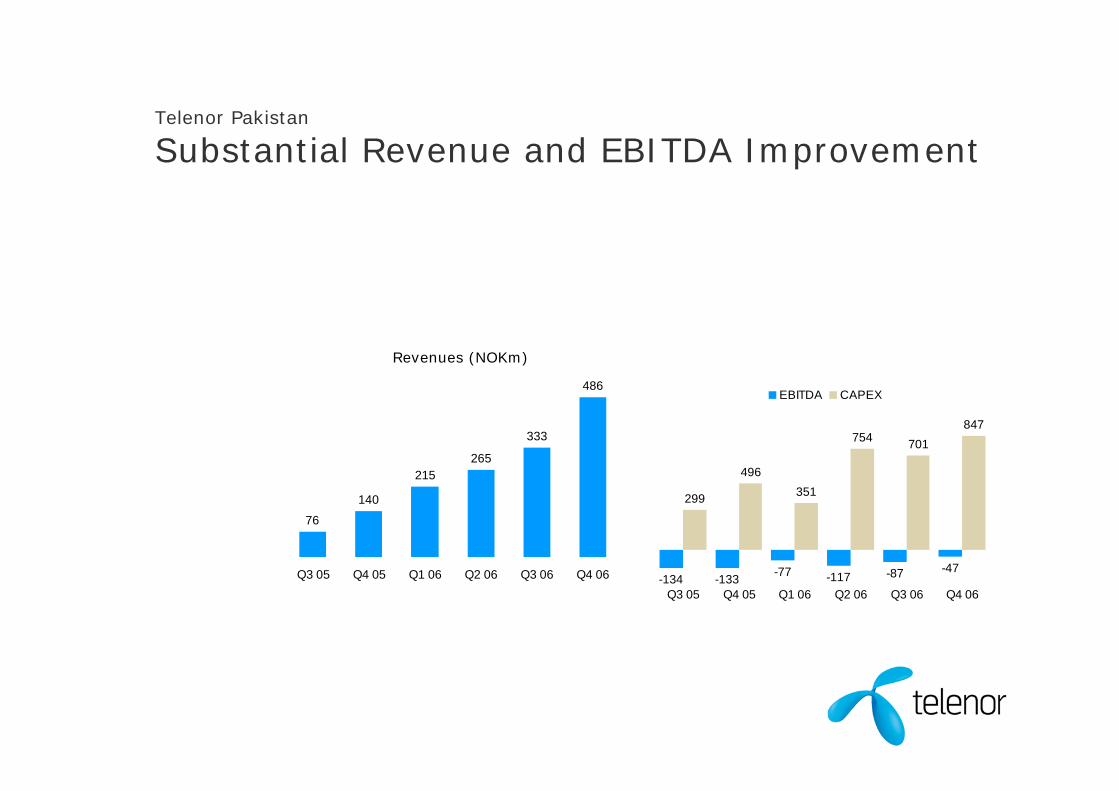
76
140
215265
333
486
Q3 05 Q4 05 Q1 06 Q2 06 Q3 06 Q4 06
Revenues (NOKm)
-134 -133 -77 -117 -87 -47
299
496351
754 701847
Q3 05 Q4 05 Q1 06 Q2 06 Q3 06 Q4 06
EBITDA CAPEX
Telenor Pakistan
Substantial Revenue and EBITDA ImprovementTelenor Pakistan
Substantial Revenue and EBITDA Improvement
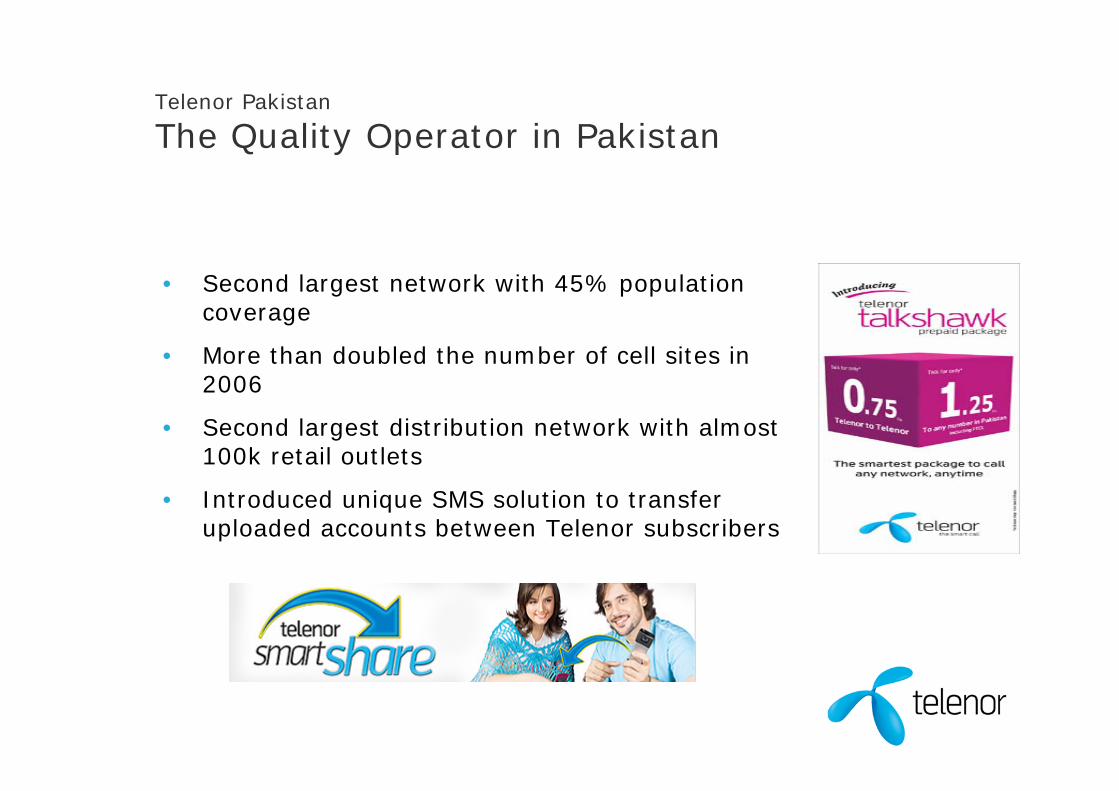
• Second largest network with 45% population coverage
• More than doubled the number of cell sites in 2006
• Second largest distribution network with almost 100k retail outlets
• Introduced unique SMS solution to transfer uploaded accounts between Telenor subscribers
Telenor Pakistan
The Quality Operator in PakistanTelenor Pakistan
The Quality Operator in Pakistan
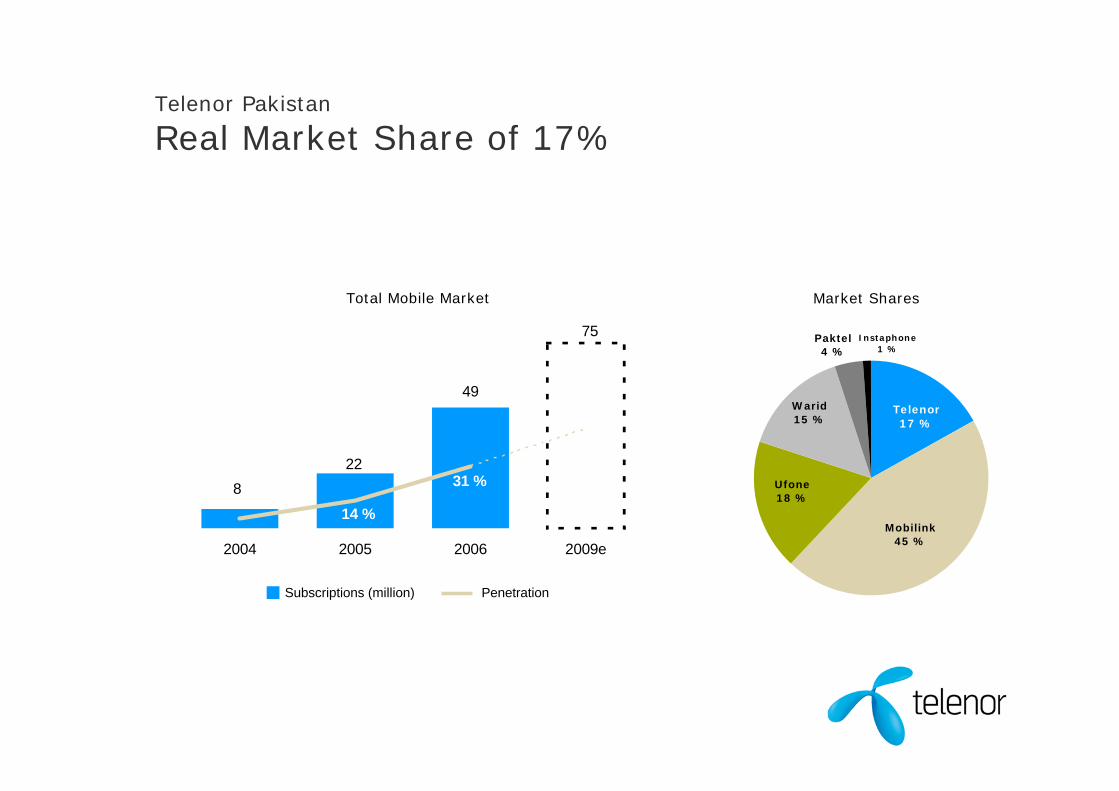
Instaphone1 %
Warid15 %
Paktel4 %
Ufone18 %
Mobilink45 %
Telenor17 %
Market Shares
Telenor Pakistan
Real Market Share of 17%
75
49
228
14 %
31 %
2004 2005 2006 2009e
Subscriptions (million) Penetration
Total Mobile Market
GrameenphoneErik Aas
CEO Grameenphone
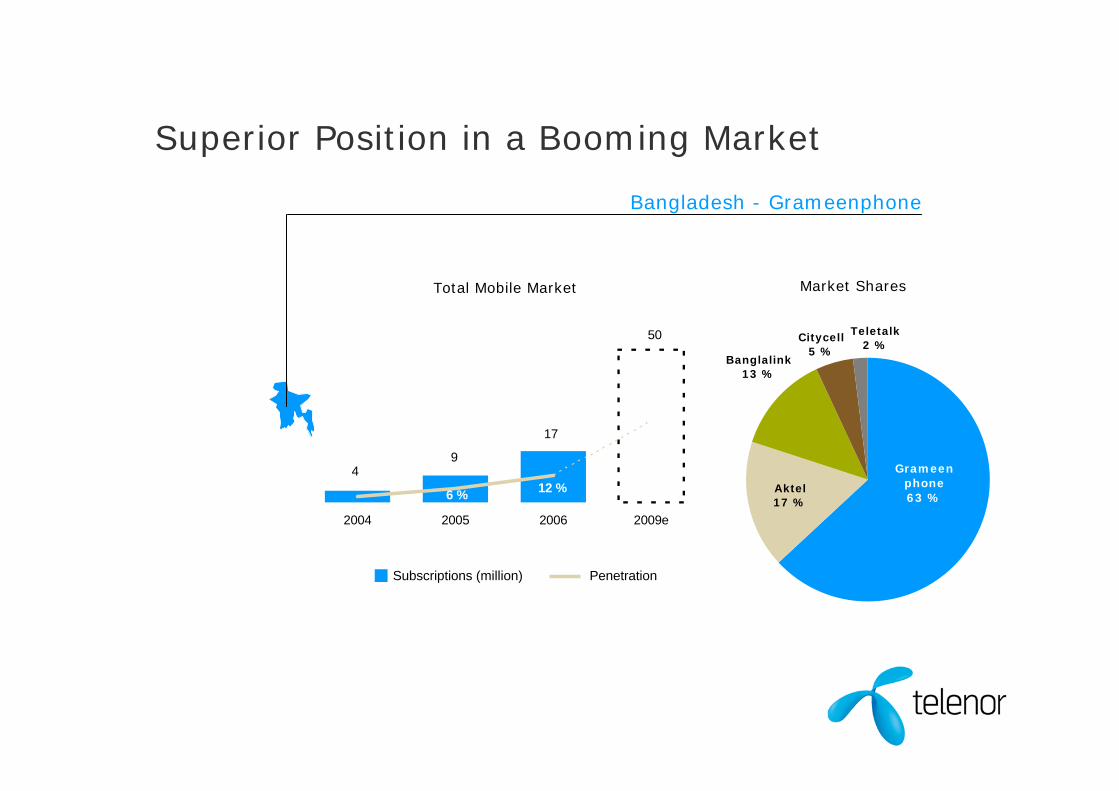
Citycell5 %
Teletalk2 %
Banglalink13 %
Aktel17 %
Grameenphone63 %
Market Shares
Superior Position in a Booming Market
Bangladesh - Grameenphone
50
17
94
6 % 12 %
2004 2005 2006 2009e
Total Mobile Market
Subscriptions (million) Penetration

Grameenphone
Passing 11 Million Subscriptions
775850
955 9971 133
1 229
57 % 54 %69 %
49 %57 % 59 %
Q3 05 Q4 05 Q1 06 Q2 06 Q3 06 Q4 06
Revenues (NOKm)/EBITDA%
441 455
659
488
645724
590
1 153
389
516435
683
Q3 05 Q4 05 Q1 06 Q2 06 Q3 06 Q4 06
EBITDA CAPEX
• Subscription growth of 1.4 mill in Q4
• Revenue growth of 57% in local currency
• Underlying EBITDA margin of 52%
• SIM tax of BDT 800 declared illegal – still pending in court

250 241
214213196
223
1.792.102.312.63
2.21
2.92
Q3 05 Q4 05 Q1 06 Q2 06 Q3 06 Q4 06
Grameenphone
Increased Competition
• Offerings in the market with flat tariff schemes below BDT 2
• Migration from multi-user to privately owned subscriptions
431449492516
552
651
Q3 05 Q4 05 Q1 06 Q2 06 Q3 06 Q4 06
MoU and APPM (BDT)
ARPU (BDT)

FinancialsTrond Westlie
CFO

(NOKm)
Q4 2006
Reported P&L
Q4 06 Q4 05 2006 2005
Revenues 24 535 18 860 91 077 66 566
EBITDA 8 194 6 576 32 687 23 302
EBIT 3 980 2 875 17 708 11 438
Profit before Taxes 5 902 2 636 21 528 12 319
Net Income 6 184 1 695 15 899 7 646
EPS (NOK) 3.68 1.00 9.43 4.47

24 53518 860
Q4 0
5
Mobile
Sw
eden
DTAC
Kyiv
star
Tele
nor S
erb
ia
Gra
meenphone
Tele
nor
Pakista
n
DiG
i
Oth
er
Q4 0
6
30%
8.3%5.1%
3.4% 2.9% 2.0%1.8% 1.3%
5.3%
Q4 2006
Revenue Development
(NOKm)

6 576
8 194
635302 350
269 205 192
335
Q4 0
5
Mobile
Sw
eden
Kyivsta
r
DTAC
Gra
meenphone
Tele
nor S
erb
ia
DiG
i
Oth
er
Q4 0
6
Q4 2006
EBITDA Development
6 2246 576
7 749 7 814
8 9308 194
37 % 35 % 36 % 36 % 38 %33 %
Q3 05 Q4 05 Q1 06 Q2 06 Q3 06 Q4 06
EBITDA (NOKm)/EBITDA%Change in EBITDA (NOKm)

43.247.3
5.8
0.2 0.5 1.4
8.2
End Q3 06 CAPEX Paid Other Disposals Taxes EBITDA End Q4 06
(NOKbn)
Q4 2006
Net Debt to LTM EBITDA of 1.3
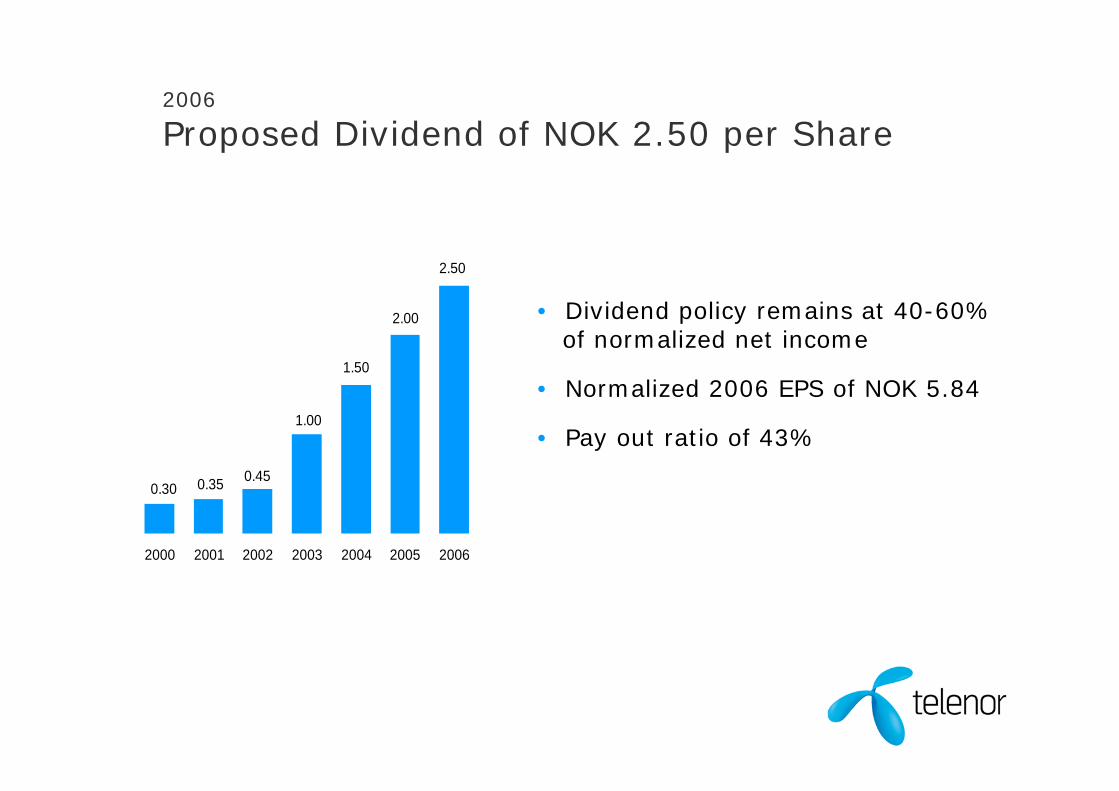
2006
Proposed Dividend of NOK 2.50 per Share
0.30 0.35 0.45
1.00
1.50
2.00
2.50
2000 2001 2002 2003 2004 2005 2006
• Dividend policy remains at 40-60%of normalized net income
• Normalized 2006 EPS of NOK 5.84
• Pay out ratio of 43%
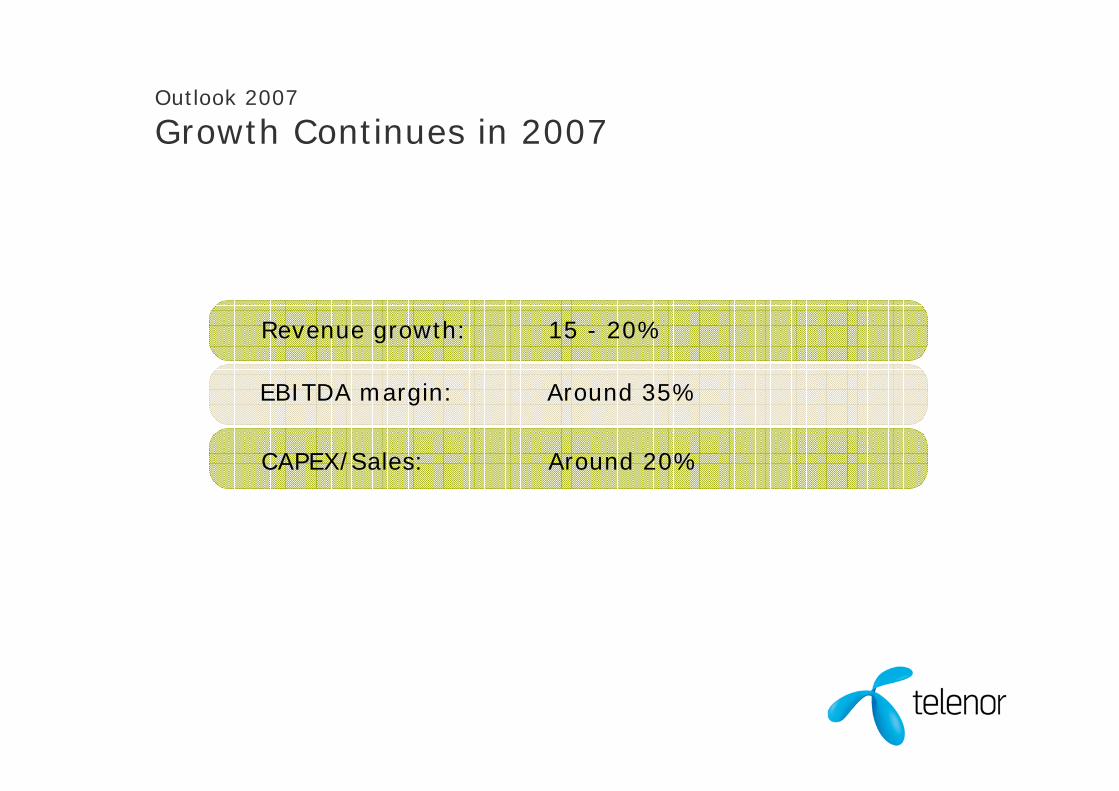
Outlook 2007
Growth Continues in 2007
Revenue growth: 15 - 20%
CAPEX/Sales: Around 20%
EBITDA margin: Around 35%
Telenor – Fourth Quarter 2006

Telenor – Fourth Quarter 2006Appendix

3 121 3 235 3 1053 458
3 273 3 226
39 % 37 %43 % 42 % 44 % 40 %
Q3 05 Q4 05 Q1 06 Q2 06 Q3 06 Q4 06
Mobile Norway
Focusing on Customer Retention Revenues (NOKm)/ EBITDA%
1 218 1 1861 323 1 365
1 513
220
461
129 143 220 272
1 293
Q3 05 Q4 05 Q1 06 Q2 06 Q3 06 Q4 06
EBITDA CAPEX
• Active migration to cheaper low churn subscriptions
• Increased loyalty through community pricing
• Price reductions offset by increased MoU
• Stable revenues and improved EBITDA

• Revenue growth mainly driven by increased number of subscriptions
– 56k net adds in Q4
– 113k net adds in 2006
• Market share adjusted to 24%
• EBITDA margin from 23% to 26%
Sonofon
Revenue Growth of 7% in Local Currency
1 356 1 334 1 3531 473
1 3471 428
23 % 23 % 23 % 23 %27 % 26 %
Q3 05 Q4 05 Q1 06 Q2 06 Q3 06 Q4 06
Revenues (NOKm)/EBITDA%
307 308 305 307390 378
137
757
109170 168
251
Q3 05 Q4 05 Q1 06 Q2 06 Q3 06 Q4 06
EBITDA CAPEX

68 48
1 3011 430
1 550 1 617
13 %17 %
24 %20 %
Q3 05 Q4 05 Q1 06 Q2 06 Q3 06 Q4 06
Mobile Sweden
Successful First YearRevenues (NOKm)/EBITDA%
170241
371326
135 137 112
224
-309
-139
Q3 05 Q4 05 Q1 06 Q2 06 Q3 06 Q4 06
Reported EBITDA CAPEX
• Launched Glocalnet as a low price mobile brand
• Market share stable at 17%
• 25k net adds in Q4
• Continued focus on cost reductions

Kyivstar
Christmas Campaigns Boost SubscriptionGrowth
2 0762 390 2 329
2 580
3 025 3 022
55 % 57 %61 % 62 % 60 %
55 %
Q3 05 Q4 05 Q1 06 Q2 06 Q3 06 Q4 06
Revenues (NOKm)/EBITDA%
1 359
1 8271 661
1 106
890 830992
1 148
1 4321 596
1 039
770
Q3 05 Q4 05 Q1 06 Q2 06 Q3 06 Q4 06
EBITDA CAPEX
• Subscriptions passed 22 million
– Net adds of 3.8 million in Q4
• Revenue growth of 31% in local currency
• APPM reduced by 14% in Q4
• EBITDA margin decreased due to high sales and marketing activities
With referance to disclaimer – Telenor estimates

• 172k net adds in Q4
• Revenue growth of 4% in local currency
• Underlying margin of 33%
• Improved operating cash flow in 2006 to NOK 1.6 billion
Pannon
Improved Market Share to 34%
1 583 1 5651 413 1 427 1 464
1 647
41 %34 %
38 % 40 % 40 %31 %
Q3 05 Q4 05 Q1 06 Q2 06 Q3 06 Q4 06
Revenues (NOKm)/EBITDA%
650534 540 567 581
517
150261
71
235168 145
Q3 05 Q4 05 Q1 06 Q2 06 Q3 06 Q4 06
EBITDA CAPEX

• Brand Awareness of 90%
• Market share of 41%
• 180k net adds in Q4
• Established a solid distribution network
• EBITDA margin reduced due to high marketing and sales activities
• Third GSM license awarded
Telenor Serbia
Successful Rebranding
175
551
59 %37 %
Q3 06 Q4 06
Revenues (NOKm)/EBITDA%
103
206
49
114
Q3 06 Q4 06
EBITDA CAPEX
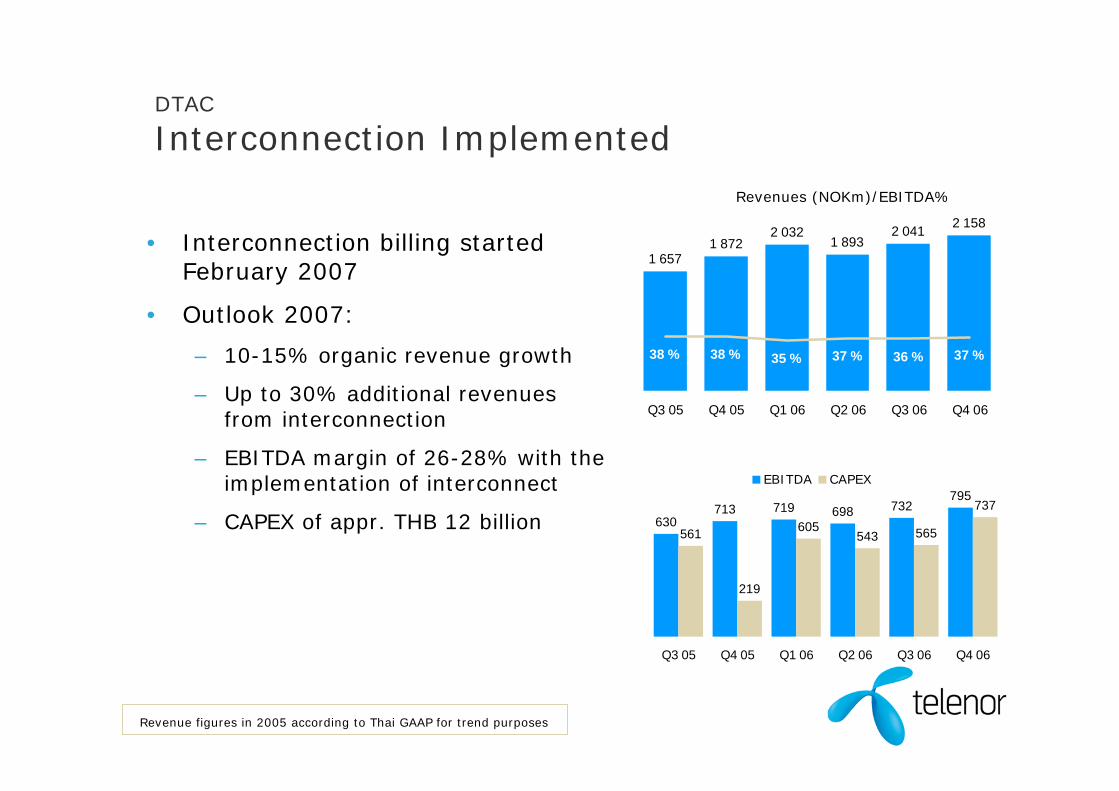
• Interconnection billing startedFebruary 2007
• Outlook 2007:
– 10-15% organic revenue growth
– Up to 30% additional revenues from interconnection
– EBITDA margin of 26-28% with the implementation of interconnect
– CAPEX of appr. THB 12 billion
DTAC
Interconnection Implemented
Revenue figures in 2005 according to Thai GAAP for trend purposes
Revenues (NOKm)/EBITDA%
630713 719 698 732
795
561
219
605543 565
737
Q3 05 Q4 05 Q1 06 Q2 06 Q3 06 Q4 06
EBITDA CAPEX
1 6571 872
2 0321 893
2 041 2 158
38 % 38 % 35 % 37 % 36 % 37 %
Q3 05 Q4 05 Q1 06 Q2 06 Q3 06 Q4 06

• 500k subscriptions churned due to mandatory prepaid registration
• Market penetration adjusted from 82% to 73%
• Revenue growth of 17% in local currency
• Underlying EBITDA margin of 46%
• Outlook 2007:
– Revenue growth: High single digit
– EBITDA margin: Mid 40's
– CAPEX: In line with 2006
DiGi
Well Managed Prepaid Registration Process
1 2851 452
1 546 1 544 1 5841 699
44 % 44 % 45 % 45 % 46 % 48 %
Q3 05 Q4 05 Q1 06 Q2 06 Q3 06 Q4 06
Revenues (NOKm)/EBITDA%
560632
700 700 721824
310
574
226 199
371
513
Q3 05 Q4 05 Q1 06 Q2 06 Q3 06 Q4 06
EBITDA CAPEX

Grameenphone
Passing 11 Million Subscriptions
775850
955 9971 133
1 229
57 % 54 %69 %
49 %57 % 59 %
Q3 05 Q4 05 Q1 06 Q2 06 Q3 06 Q4 06
Revenues (NOKm)/EBITDA%
441 455
659
488
645724
590
1 153
389
516435
683
Q3 05 Q4 05 Q1 06 Q2 06 Q3 06 Q4 06
EBITDA CAPEX
• Subscription growth of 1.4 million in Q4
• Revenue growth of 57% in local currency
• Underlying EBITDA margin of 52%
• SIM tax of BDT 800 declared illegal –still pending in court

• Passed 7 million subscriptions – netadds of 2.1 million in Q4
• Taking almost 50% of net adds in December
• Increased official market share to 14%
• Revenue growth of 46% in localcurrency compared to Q306
• ARPU of USD 4.5
76
140
215265
333
486
Q3 05 Q4 05 Q1 06 Q2 06 Q3 06 Q4 06
-134 -133 -77 -117 -87 -47
299
496351
754 701847
Q3 05 Q4 05 Q1 06 Q2 06 Q3 06 Q4 06
EBITDA CAPEX
Revenues (NOKm)
Telenor Pakistan
Increasing Market Share and ARPUTelenor Pakistan
Increasing Market Share and ARPU
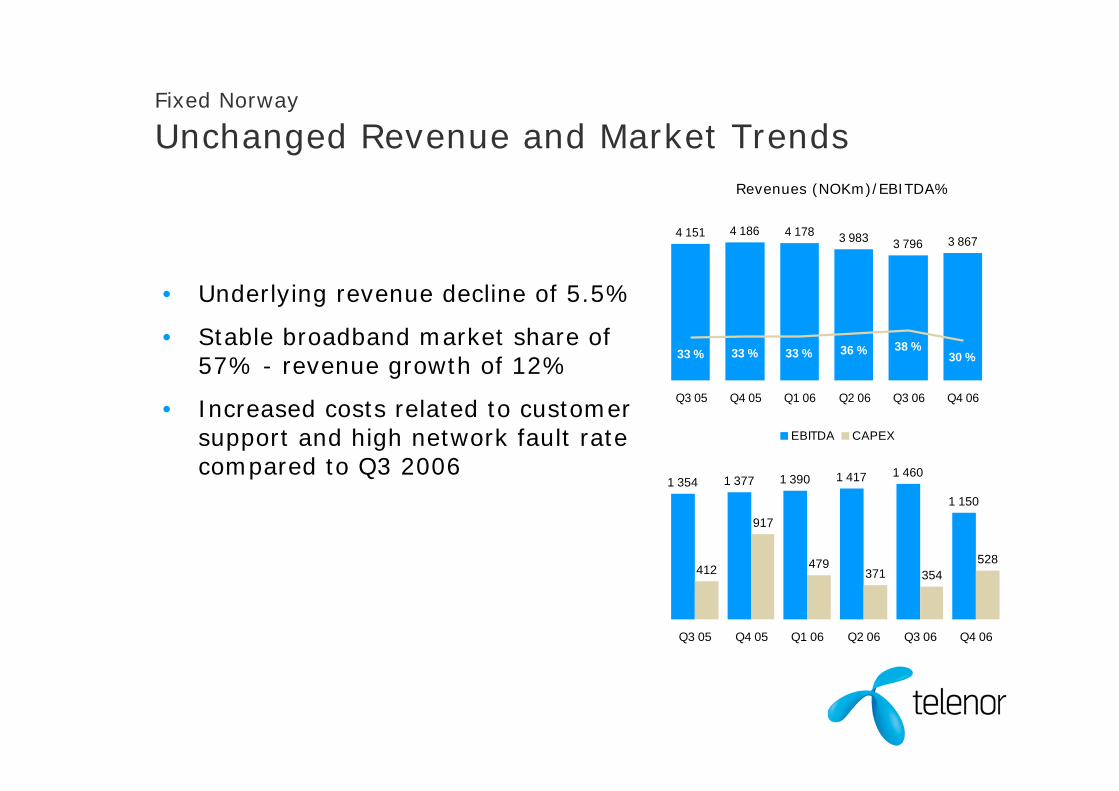
Fixed Norway
Unchanged Revenue and Market Trends
• Underlying revenue decline of 5.5%
• Stable broadband market share of 57% - revenue growth of 12%
• Increased costs related to customer support and high network fault rate compared to Q3 2006
4 151 4 186 4 178 3 983 3 796 3 867
33 % 33 % 33 % 36 % 38 %30 %
Q3 05 Q4 05 Q1 06 Q2 06 Q3 06 Q4 06
1 354 1 377 1 390 1 417 1 460
412
917
479371 354
528
1 150
Q3 05 Q4 05 Q1 06 Q2 06 Q3 06 Q4 06
EBITDA CAPEX
Revenues (NOKm)/EBITDA%

Fixed Sweden
Continued Strong Competition
31
183
109 100128
63
142
255
83
230
155
114
Q3 05 Q4 05 Q1 06 Q2 06 Q3 06 Q4 06
EBITDA CAPEX
Revenues (NOKm) / EBITDA %
• Strong competition with reduced broadband prices
• Broadband net adds of 27k in Q4 to 575k
• VoIP net adds of 14k in Q4 to 161k
• Underlying EBITDA margin of 14%
• Acquired Spray for SEK 172 million in January 2007
654 676727
866 857926
5 % 7 %
27 %
15 % 15 %12 %
Q3 05 Q4 05 Q1 06 Q2 06 Q3 06 Q4 06

Fixed Denmark
Revenue Growth of 31% in Local Currency
• Increased broadband market share to 17%
• 10k net adds broadband subscriptions to 174k in Q4
• VoIP net adds of 11k subscriptions to 63k in Q4
Revenues (NOKm) / EBITDA %
48 4955
59 61 62
40
57 55
42
5260
Q3 05 Q4 05 Q1 06 Q2 06 Q3 06 Q4 06
EBITDA CAPEX
142164
174 181199
219
34 % 30 % 32 % 33 % 31 % 28 %
Q3 05 Q4 05 Q1 06 Q2 06 Q3 06 Q4 06

Broadcast
Taking the Leading Position on HDTV
• First mover on HDTV with exclusive content
• Negotiation of content rights with effect from January 2006
– Premier League for three seasons
– UEFA EURO 2008
• Free installation and high decoder subsidies
• Replacement of satellite in H2 2007
1 3921 466
1 517 1 564 15731 655
28 % 23 % 27 % 28 % 31 %16 %
Q3 05 Q4 05 Q1 06 Q2 06 Q3 06 Q4 06
Revenues (NOKm)/ EBITDA%
394
331
408437
485
260
116 13392 106
157
260
Q3 05 Q4 05 Q1 06 Q2 06 Q3 06 Q4 06
EBITDA CAPEX
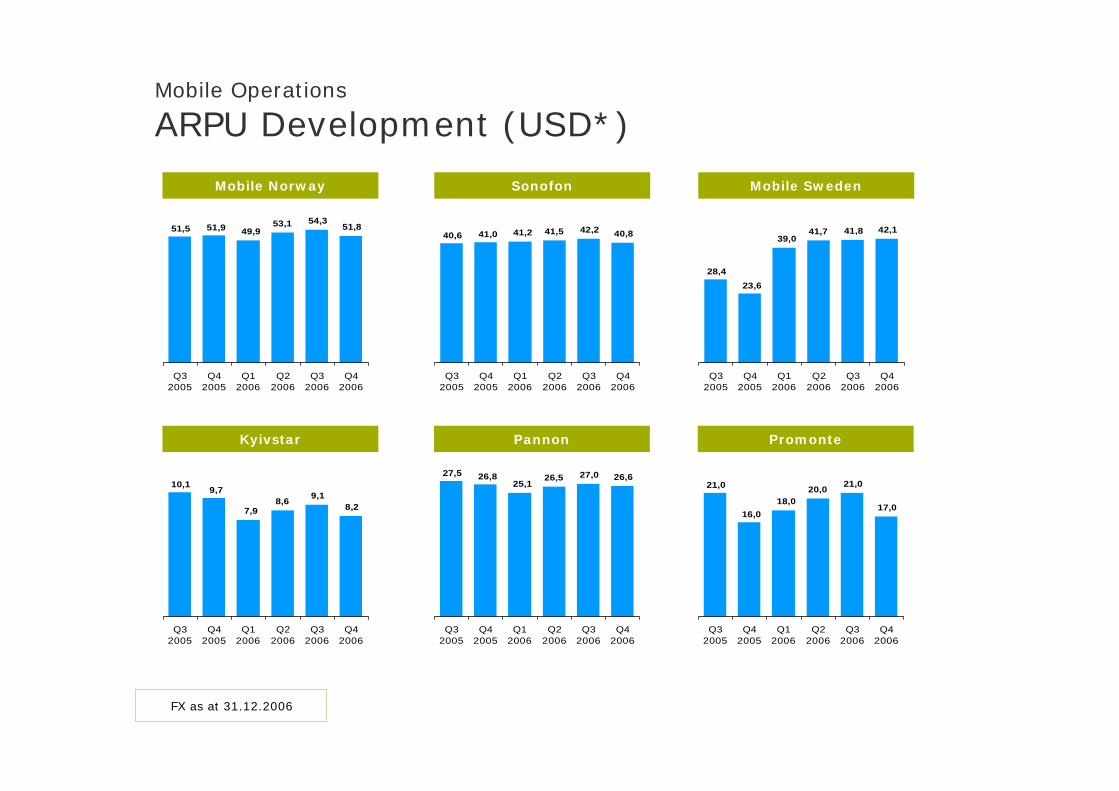
42,141,841,739,0
23,628,4
Q32005
Q42005
Q12006
Q22006
Q32006
Q42006
Mobile Sweden
Mobile Operations
ARPU Development (USD*)
17,0
21,020,018,0
16,0
21,0
Q32005
Q42005
Q12006
Q22006
Q32006
Q42006
Promonte
26,627,026,525,1
26,827,5
Q32005
Q42005
Q12006
Q22006
Q32006
Q42006
Pannon
8,29,18,6
7,9
9,710,1
Q32005
Q42005
Q12006
Q22006
Q32006
Q42006
Kyivstar
40,842,241,541,241,040,6
Q32005
Q42005
Q12006
Q22006
Q32006
Q42006
Sonofon
51,854,353,1
49,951,951,5
Q32005
Q42005
Q12006
Q22006
Q32006
Q42006
Mobile Norway
FX as at 31.12.2006

15,514,915,315,316,416,4
Q32005
Q42005
Q12006
Q22006
Q32006
Q42006
DiGi
Mobile Operations
ARPU Development (USD*)
9,49,810,1
11,411,411,6
Q32005
Q42005
Q12006
Q22006
Q32006
Q42006
DTAC
4,54,34,84,7
4,5
3,7
Q32005
Q42005
Q12006
Q22006
Q32006
Q42006
Telenor Pakistan
6,26,57,17,5
8,0
9,4
Q32005
Q42005
Q12006
Q22006
Q32006
Q42006
Grameenphone
FX as at 31.12.2006

Mobile Norway Mobile SwedenSonofon
PromontePannonKyivstar
195
205
183
200
209
203
0,22 0,21 0,21 0,20 0,21 0,20
Q32005
Q42005
Q12006
Q22006
Q32006
Q42006
184
205
186 186
196 199
0,28 0,28 0,27 0,27 0,270,25
Q32005
Q42005
Q12006
Q22006
Q32006
Q42006
149
160
145143
159157
0,19 0,18 0,18 0,17 0,17 0,17
Q32005
Q42005
Q12006
Q22006
Q32006
Q42006
129
195
144160
185 184
0,20 0,180,24 0,23 0,23 0,22
Q32005
Q42005
Q12006
Q22006
Q32006
Q42006
MoU APPM (USD)
Mobile Operations
MoU/APPM Development
108
127
103110
118 123
0,10 0,09 0,07 0,07 0,070,06
Q32005
Q42005
Q12006
Q22006
Q32006
Q42006
92105109 104
121 120
0,19 0,17 0,17 0,17 0,17 0,17
Q32005
Q42005
Q12006
Q22006
Q32006
Q42006

250 241223
196213 214
0,040,03
0,04 0,03 0,030,03
Q32005
Q42005
Q12006
Q22006
Q32006
Q42006
Grameenphone Telenor Pakistan DiGi
DTAC
295
231
327 314 329
0,050,04 0,03 0,03 0,03
Q42005
Q12006
Q22006
Q32006
Q42006
131 132
93
136146
123
0,04 0,03 0,03 0,03 0,04 0,03
Q32005
Q42005
Q12006
Q22006
Q32006
Q42006
169 173175162 163 162
0,09 0,10 0,09 0,09 0,09 0,09
Q32005
Q42005
Q12006
Q22006
Q32006
Q42006
MoU APPM (USD)
Mobile Operations
MoU/APPM Development
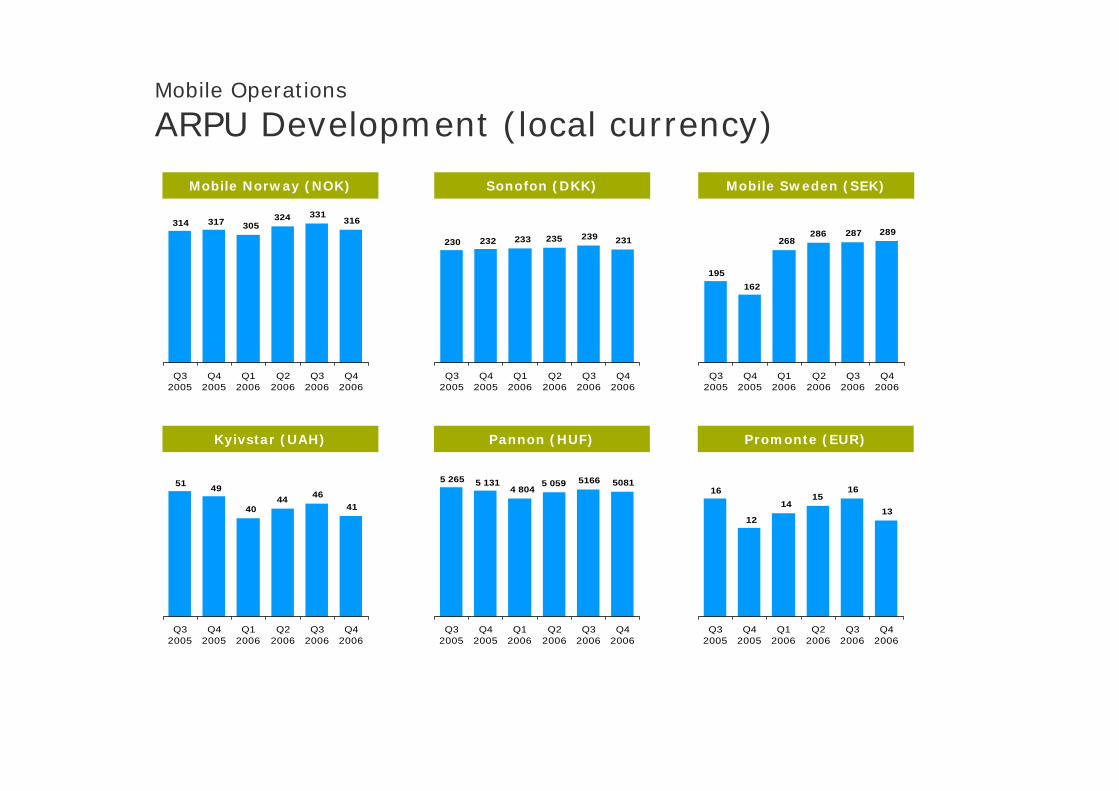
289287286268
162195
Q32005
Q42005
Q12006
Q22006
Q32006
Q42006
Mobile Sweden (SEK)
Mobile Operations
ARPU Development (local currency)
13
1615
14
12
16
Q32005
Q42005
Q12006
Q22006
Q32006
Q42006
Promonte (EUR)
508151665 0594 804
5 1315 265
Q32005
Q42005
Q12006
Q22006
Q32006
Q42006
Pannon (HUF)
414644
40
4951
Q32005
Q42005
Q12006
Q22006
Q32006
Q42006
Kyivstar (UAH)
231239235233232230
Q32005
Q42005
Q12006
Q22006
Q32006
Q42006
Sonofon (DKK)
314 317 305324 331
316
Q32005
Q42005
Q12006
Q22006
Q32006
Q42006
Mobile Norway (NOK)

555354545858
Q32005
Q42005
Q12006
Q22006
Q32006
Q42006
DiGi (MYR)
Mobile Operations
ARPU Development (local currency)
335348357405405
Q42005
Q12006
Q22006
Q32006
Q42006
DTAC (THB)
271263290284
271
226
Q32005
Q42005
Q12006
Q22006
Q32006
Q42006
Telenor Pakistan (PKR)
431449492516
552
651
Q32005
Q42005
Q12006
Q22006
Q32006
Q42006
Grameenphone (BDT)

Mobile Norway Mobile SwedenSonofon
PromontePannonKyivstar
195
205
183
200
209
203
1,26 1,19 1,17 1,12 1,18 1,13
Q32005
Q42005
Q12006
Q22006
Q32006
Q42006
184
205
186 186
196 199
1,69 1,72 1,63 1,65 1,671,54
Q32005
Q42005
Q12006
Q22006
Q32006
Q42006
149
160
145143
159157
36,3133,89 33,59 31,82 32,90
31,76
Q32005
Q42005
Q12006
Q22006
Q32006
Q42006
129
195
144160
185 184
1,35 1,261,68 1,55 1,56 1,48
Q32005
Q42005
Q12006
Q22006
Q32006
Q42006
MoU APPM (Local currency)
Mobile Operations
MoU/APPM Development
108
127
103110
118 123
0,490,45
0,36 0,37 0,370,32
Q32005
Q42005
Q12006
Q22006
Q32006
Q42006
92105109 104
121 120
0,150,13 0,13 0,13 0,13 0,13
Q32005
Q42005
Q12006
Q22006
Q32006
Q42006
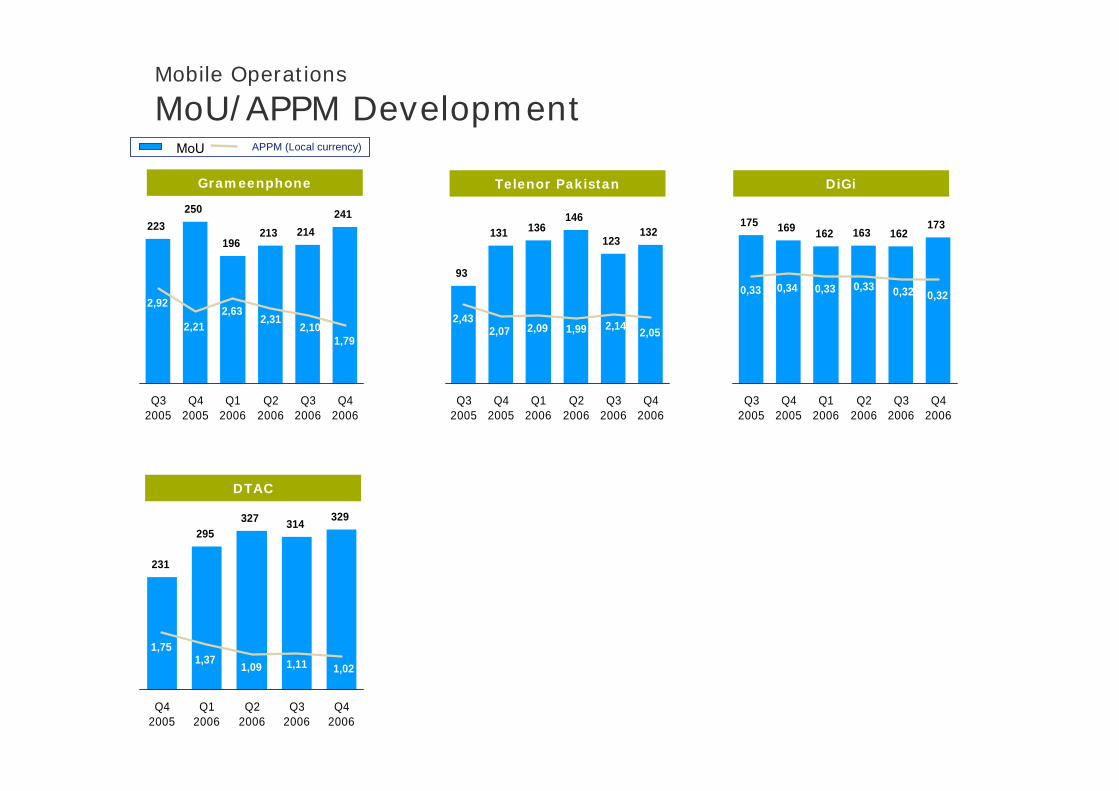
250 241223
196213 214
2,92
2,212,63
2,312,10
1,79
Q32005
Q42005
Q12006
Q22006
Q32006
Q42006
Grameenphone Telenor Pakistan DiGi
DTAC
295
231
327 314 329
1,751,37 1,09 1,11 1,02
Q42005
Q12006
Q22006
Q32006
Q42006
131 132
93
136146
123
2,432,07 2,09 1,99 2,14 2,05
Q32005
Q42005
Q12006
Q22006
Q32006
Q42006
169 173175162 163 162
0,33 0,34 0,33 0,33 0,32 0,32
Q32005
Q42005
Q12006
Q22006
Q32006
Q42006
MoU APPM (Local currency)
Mobile Operations
MoU/APPM Development

Net Interest-bearing Debt in Partly Owned Subsidiaries
4491 9391 75651.5%EDB Business Partner
74962446462.0%Grameenphone
2 146214-5956.5%Kyivstar
6 2565 6626 60173.2%DTAC
-1 581-1 472-1 00961.0%DiGi
(NOKm) Q4 2006 Q3 2006 Q4 2005
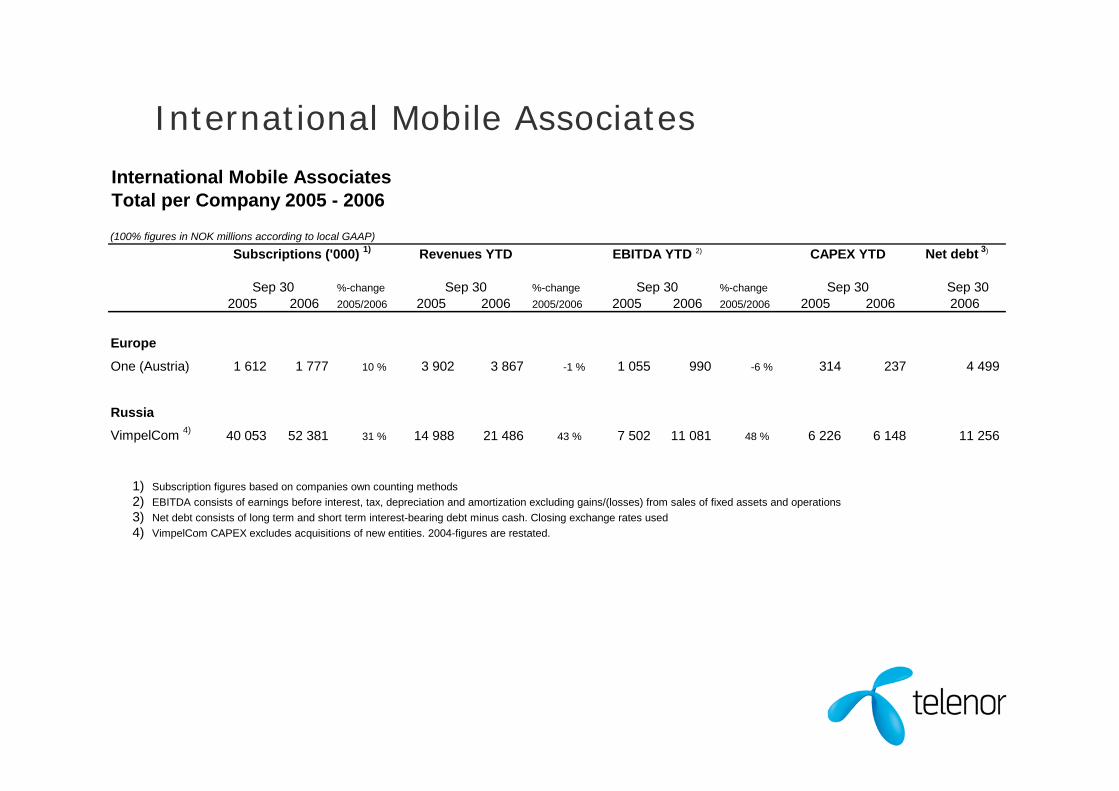
International Mobile Associates
International Mobile AssociatesTotal per Company 2005 - 2006
(100% figures in NOK millions according to local GAAP)
Net debt 3)
%-change %-change %-change2005 2006 2005/2006 2005 2006 2005/2006 2005 2006 2005/2006 2005 2006 2006
Europe
One (Austria) 1 612 1 777 10 % 3 902 3 867 -1 % 1 055 990 -6 % 314 237 4 499
RussiaVimpelCom 4) 40 053 52 381 31 % 14 988 21 486 43 % 7 502 11 081 48 % 6 226 6 148 11 256
1) Subscription figures based on companies own counting methods2) EBITDA consists of earnings before interest, tax, depreciation and amortization excluding gains/(losses) from sales of fixed assets and operations3) Net debt consists of long term and short term interest-bearing debt minus cash. Closing exchange rates used4) VimpelCom CAPEX excludes acquisitions of new entities. 2004-figures are restated.
Sep 30Sep 30 Sep 30 Sep 30
Subscriptions ('000) 1) CAPEX YTD
Sep 30
Revenues YTD EBITDA YTD 2)