systematic review of brachytherapy & proton …...systematic review of brachytherapy &...
TRANSCRIPT
Systematic Review of Brachytherapy & Proton Beam Therapy for Low-Risk
Prostate Cancer: Preliminary Findings
May 28, 2008
Dan Ollendorf, MPH, ARMChief Review Officer
2
Systematic Review Objectives
To compare the potential clinical benefits of brachytherapy and proton beam therapy relative to standard radiation therapy (IMRT) among low-risk prostate cancer patients
Biochemical recurrenceDisease-specific and overall survival
To compare the potential harms of such therapiesGastrointestinalGenitourinarySexual
3
Review ScopePatients with low-risk disease (D’Amico criteria):
Stage T1-T2aGleason score ≤6PSA ≤10 ng/mL
Treatments of interest:Low-dose-rate brachytherapy (with I125 or Pd103 isotopes)Proton beam therapyIMRT (referent standard)Active surveillance (to support economic modeling)
4
Major ExclusionsTreatment variants:
High-dose-rate brachytherapy, LDR brachytherapy with adjuvant external beam radiation (where feasible)Proton “boost” therapy
Study types:Without identifiable low-risk subgroup or preponderance of low-risk participantsSample size <50, or outcomes reported in <50 patientsNon-English language
5
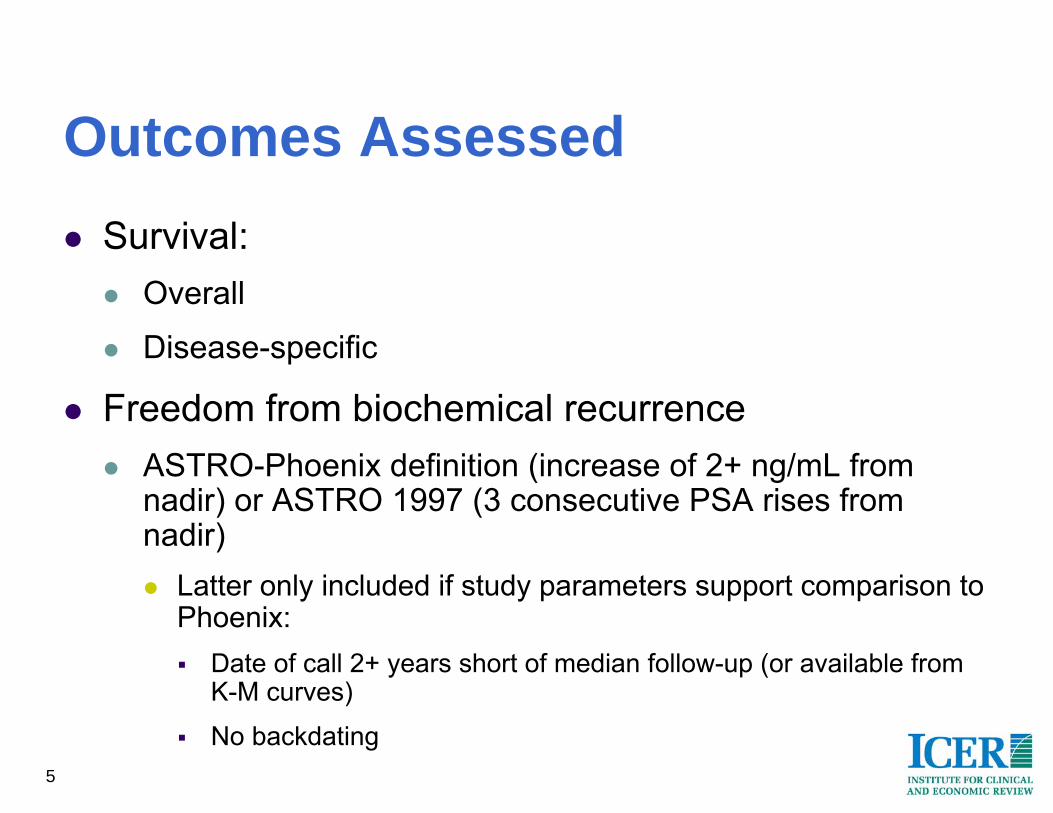
Outcomes AssessedSurvival:
Overall
Disease-specific
Freedom from biochemical recurrenceASTRO-Phoenix definition (increase of 2+ ng/mL from nadir) or ASTRO 1997 (3 consecutive PSA rises from nadir)
Latter only included if study parameters support comparison to Phoenix:
Date of call 2+ years short of median follow-up (or available from K-M curves)
No backdating
6
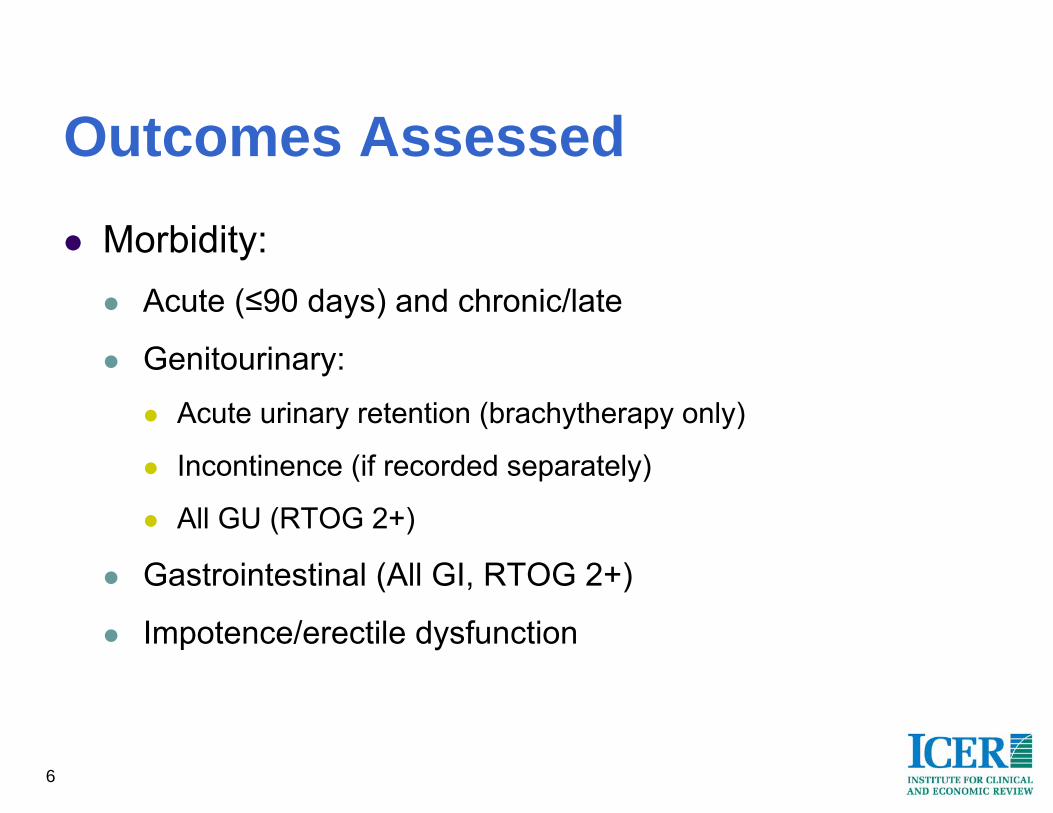
Outcomes AssessedMorbidity:
Acute (≤90 days) and chronic/late
Genitourinary:Acute urinary retention (brachytherapy only)
Incontinence (if recorded separately)
All GU (RTOG 2+)
Gastrointestinal (All GI, RTOG 2+)
Impotence/erectile dysfunction
7
DARE/Cochrane; n=31
MEDLINE; n=1,995
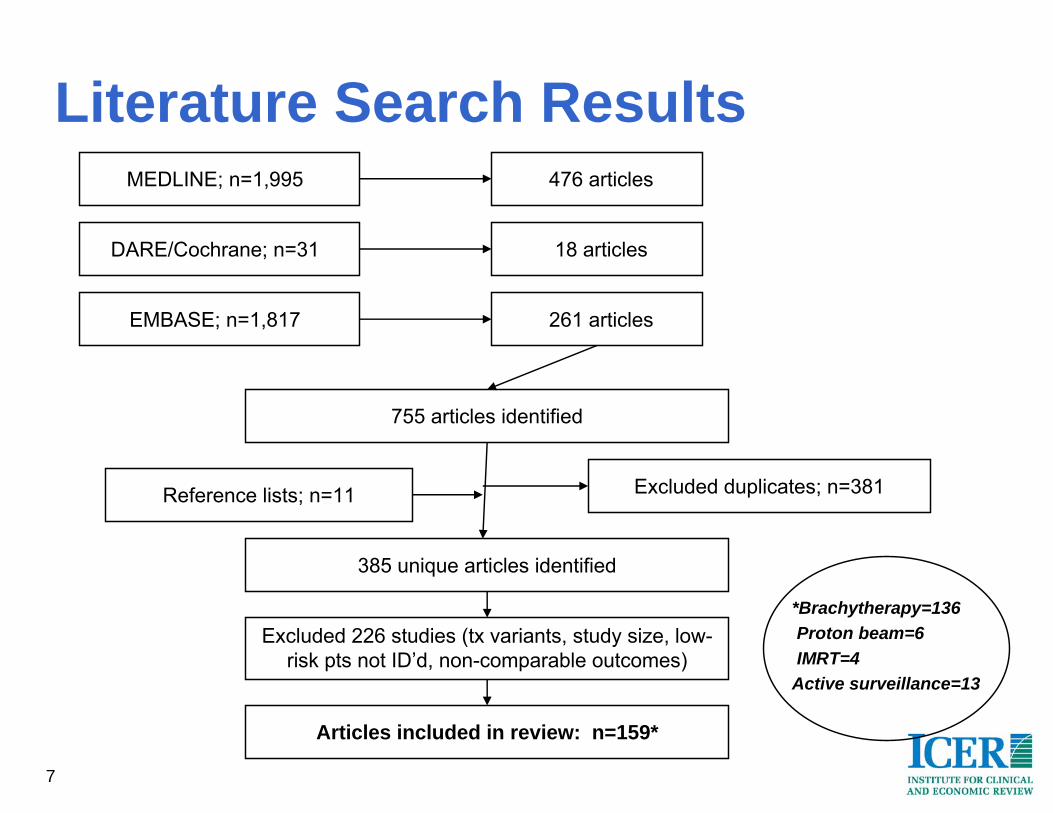
Literature Search Results
EMBASE; n=1,817
476 articles
18 articles
261 articles
755 articles identified
Reference lists; n=11 Excluded duplicates; n=381
385 unique articles identified
Excluded 226 studies (tx variants, study size, low-risk pts not ID’d, non-comparable outcomes)
Articles included in review: n=159*
*Brachytherapy=136Proton beam=6IMRT=4
Active surveillance=13
8
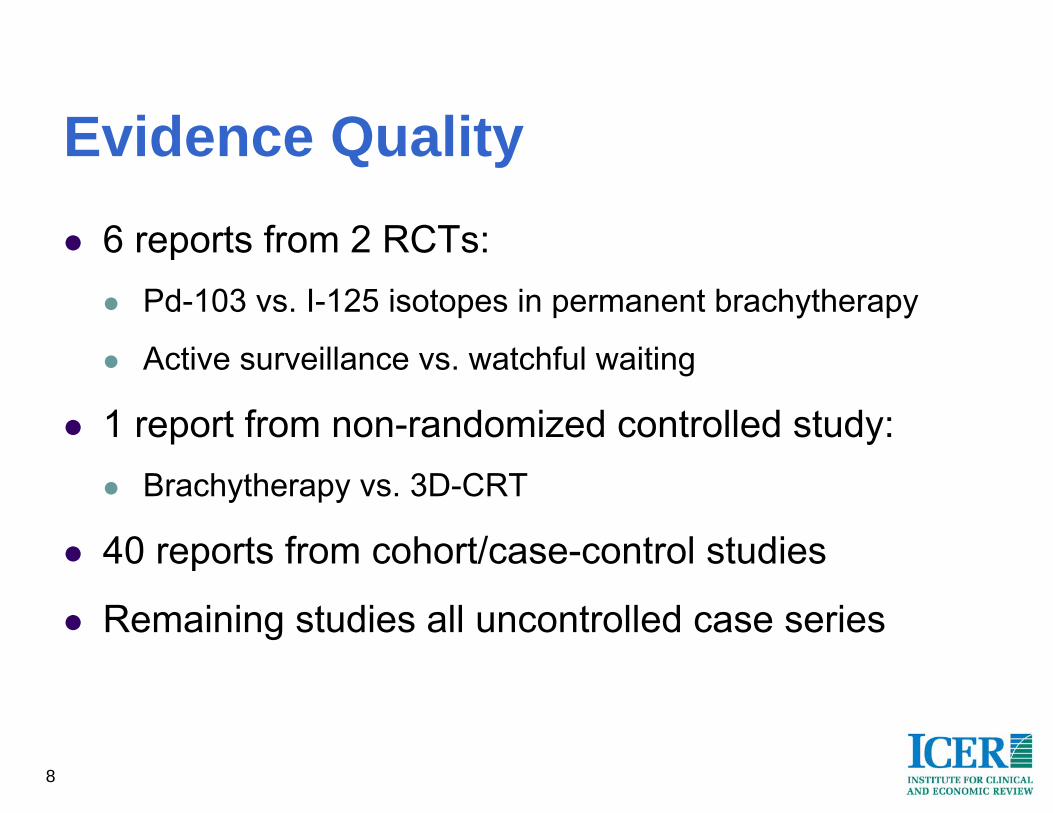
Evidence Quality6 reports from 2 RCTs:
Pd-103 vs. I-125 isotopes in permanent brachytherapy
Active surveillance vs. watchful waiting
1 report from non-randomized controlled study:Brachytherapy vs. 3D-CRT
40 reports from cohort/case-control studies
Remaining studies all uncontrolled case series
9
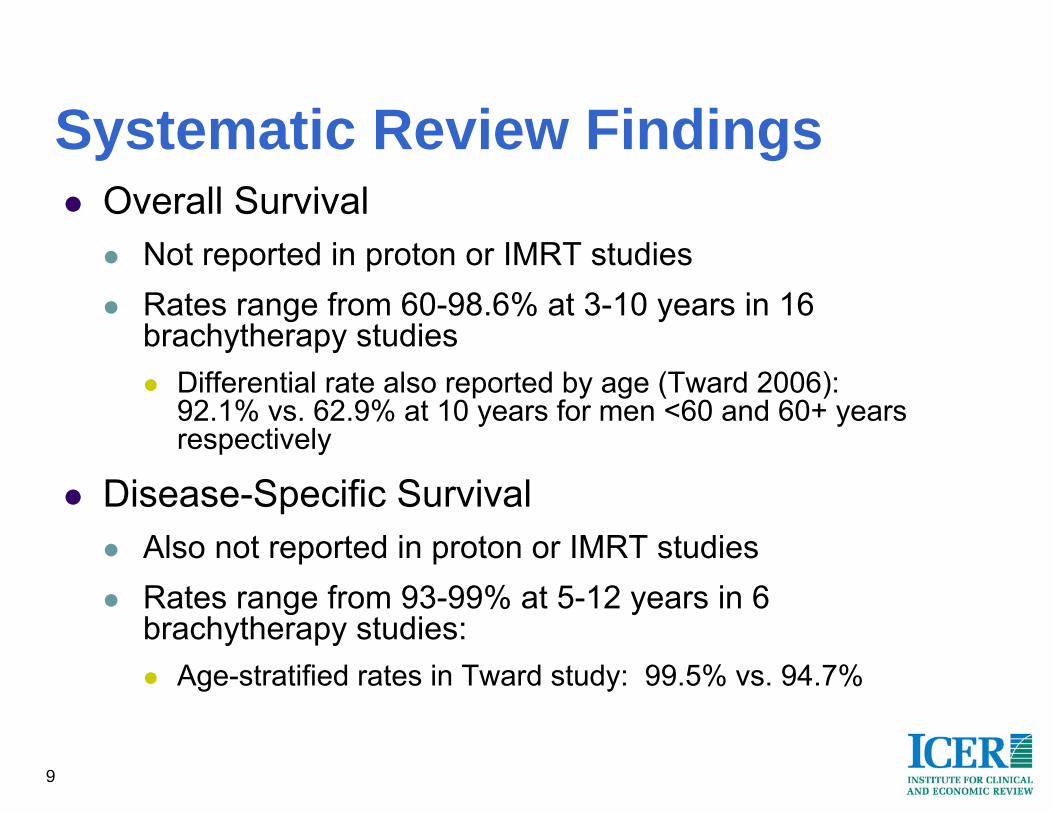
Systematic Review FindingsOverall Survival
Not reported in proton or IMRT studiesRates range from 60-98.6% at 3-10 years in 16 brachytherapy studies
Differential rate also reported by age (Tward 2006): 92.1% vs. 62.9% at 10 years for men <60 and 60+ years respectively
Disease-Specific SurvivalAlso not reported in proton or IMRT studiesRates range from 93-99% at 5-12 years in 6 brachytherapy studies:
Age-stratified rates in Tward study: 99.5% vs. 94.7%
10
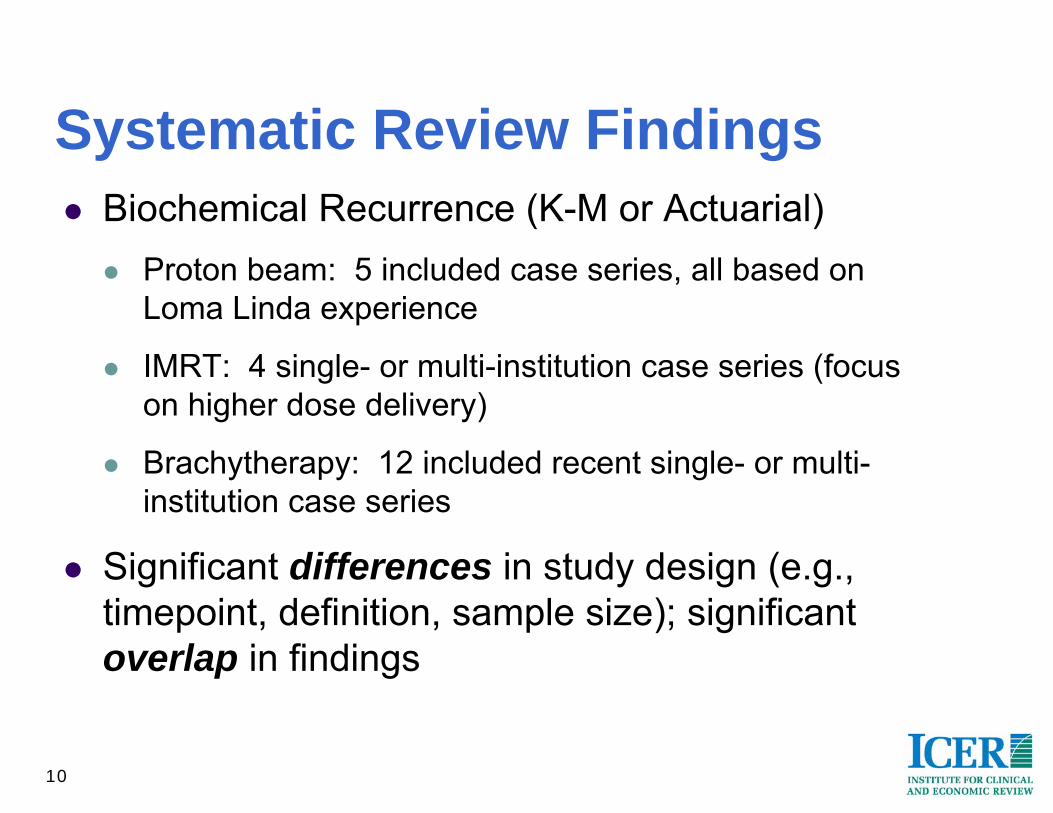
Systematic Review FindingsBiochemical Recurrence (K-M or Actuarial)
Proton beam: 5 included case series, all based on Loma Linda experience
IMRT: 4 single- or multi-institution case series (focus on higher dose delivery)
Brachytherapy: 12 included recent single- or multi-institution case series
Significant differences in study design (e.g., timepoint, definition, sample size); significant overlap in findings
11
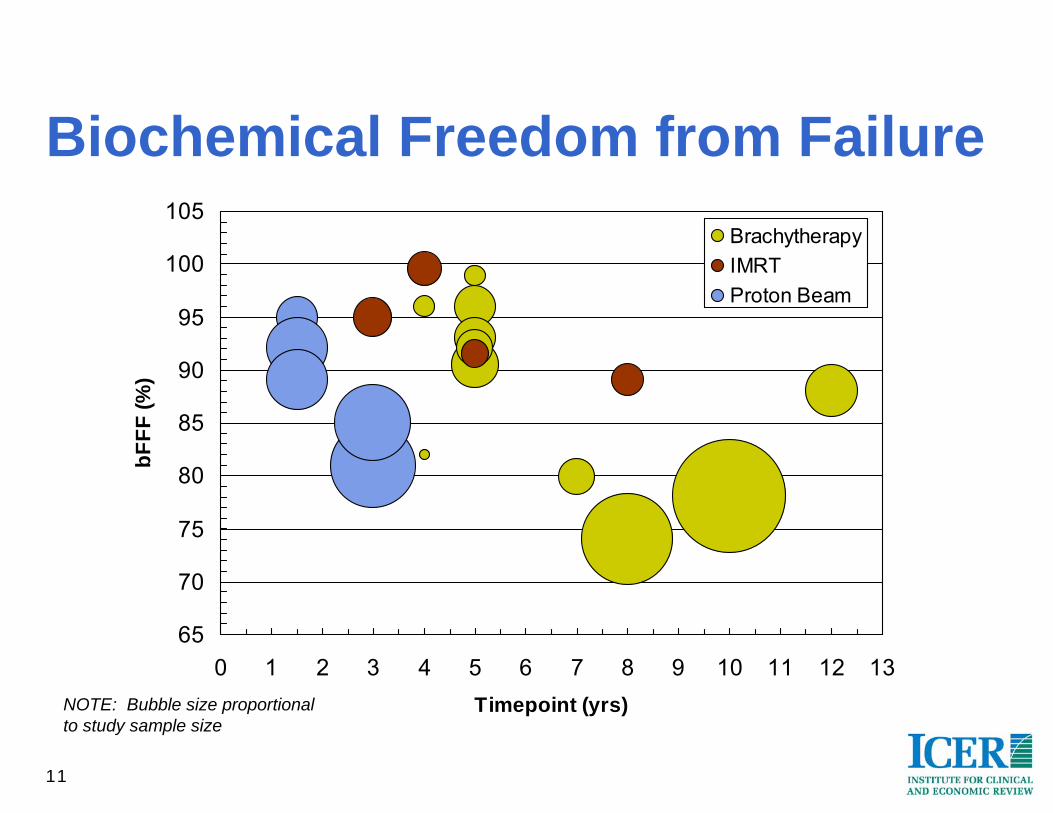
Biochemical Freedom from Failure
65
70
75
80
85
90
95
100
105
0 1 2 3 4 5 6 7 8 9 10 11 12 13Timepoint (yrs)
bFFF
(%)
BrachytherapyIMRTProton Beam
NOTE: Bubble size proportional to study sample size
12
bFFF measures complicated by study heterogeneity:
Variable biochemical failure definitions
Definition of low-risk populations
Detail in reporting of adjuvant treatment received (e.g., external beam, adjuvant hormonotherapy)
Population demographics
Biochemical Freedom from Failure

13
HarmsGenitourinary
Incontinence only reported separately in brachytherapy studies (n=15)
Pooled rates similar regardless of whether RTOG grading used (1.6% vs. 1.8% respectively)
Acute urinary retention reported in 8 brachytherapy studies:
Rates similar (pooled: 13.3%; range: 12.1%-17.0%) across studies, with exception of 2 Israeli studies (1.7%-3.3%, excluded from pooled rate above)
Design/population issues in excluded studies?

14
All GUAcute Symptoms
Proton beam: 3 studies, no acute rates reported
IMRT: 4 studies, n=1,241, pooled rate 27.7% (range: 6.9%-49.0%)
Brachytherapy: 9 studies, n=1,859, pooled rate 39.1% (range: 9.7%-64.8%)

15
All GULate Symptoms
Proton beam: 3 studies, n=1,828, pooled rate 5.4% (range: 5.0%-5.7%)
Additional study (Slater 2004) excluded because RTOG 3+ threshold employed
IMRT: 5 studies, n=2,183, pooled rate 13.3% (range: 3.5%-28.3%)
Brachytherapy: 11 studies, n=1,936, pooled rate 14.6% (range: 0.0%-40.3%)
16
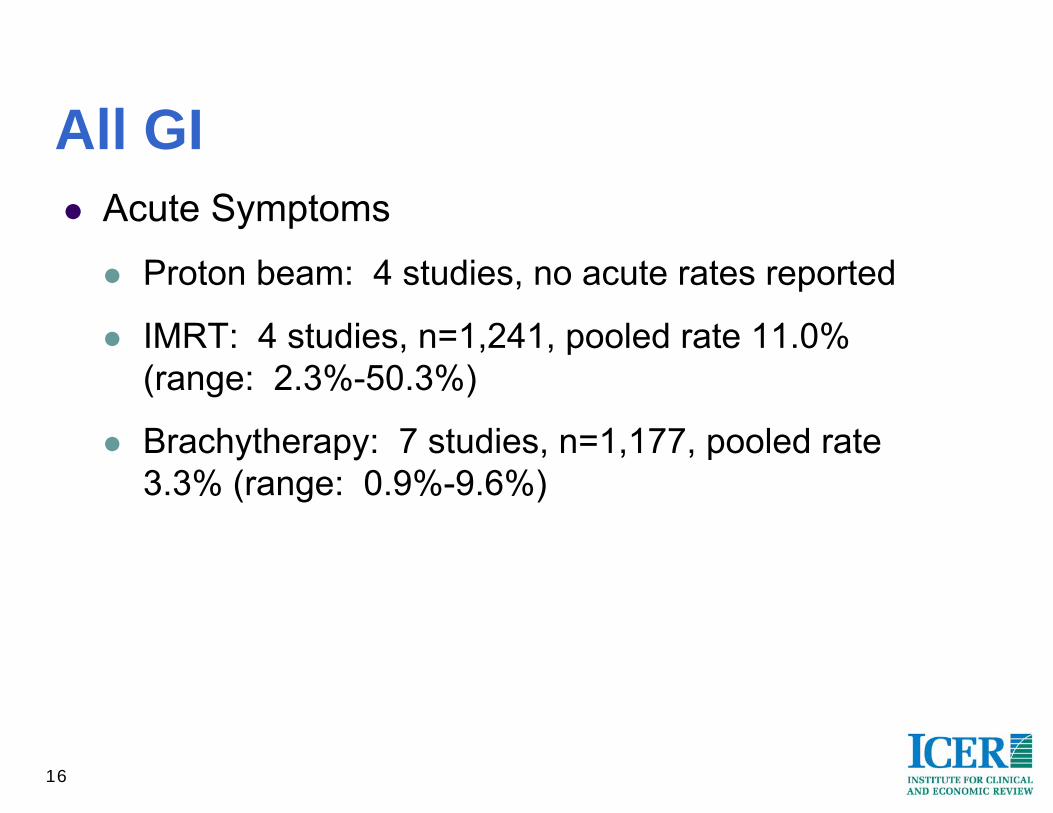
All GIAcute Symptoms
Proton beam: 4 studies, no acute rates reported
IMRT: 4 studies, n=1,241, pooled rate 11.0% (range: 2.3%-50.3%)
Brachytherapy: 7 studies, n=1,177, pooled rate 3.3% (range: 0.9%-9.6%)

17
All GILate Symptoms
Proton beam: 3 studies, n=1,828, pooled rate 13.5% (range: 3.4%-26.0%)
IMRT: 7 studies, n=2,779, pooled rate 5.8% (range: 1.6%-24.1%)
Brachytherapy: 16 studies, n=3,455, pooled rate 5.0% (range: 0.0%-12.8%)

18
ED/ImpotenceLimited (IMRT: 48%-49%) or no (proton beam) reporting for certain treatments
Reported in 15 brachytherapy studies; baseline potency known in 7
Pooled results:Overall (n=9901): 17.2% (range: 5.3%-45.0%)
Known prior potency (n=1389): 33.8% (range: 14.3%-43.0%)
Best guess from AS literature suggests 17% incremental increase in ED during surveillance
19
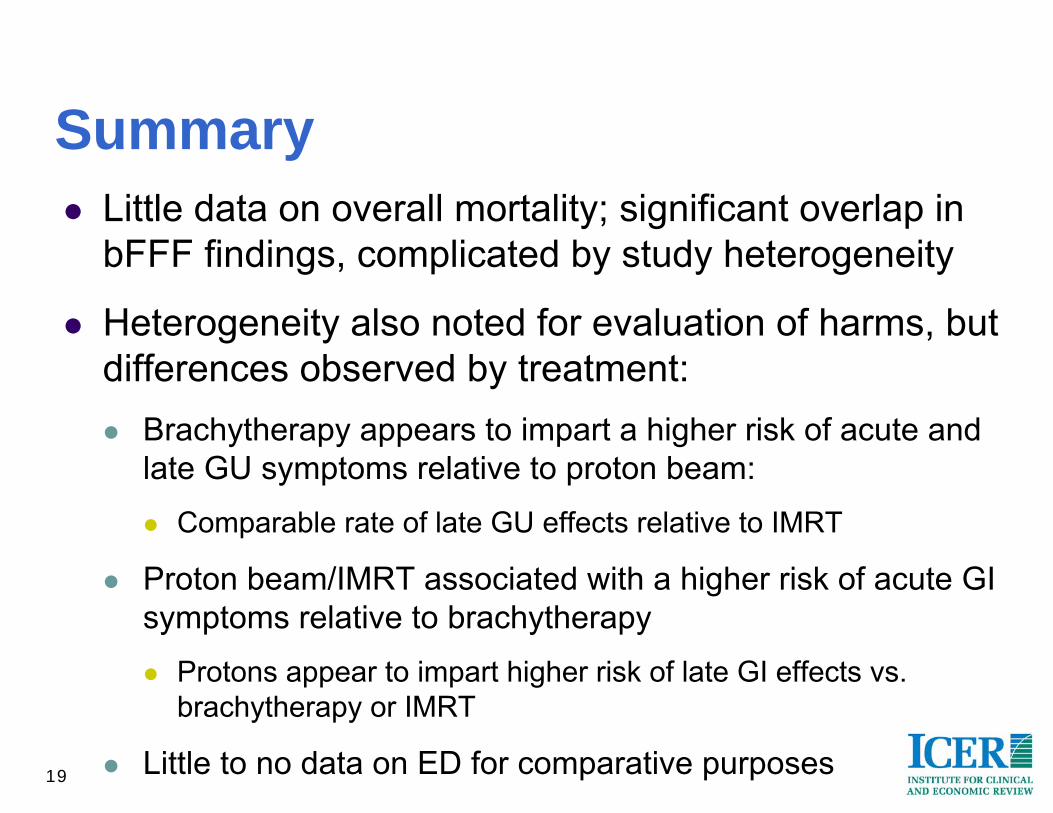
SummaryLittle data on overall mortality; significant overlap in bFFF findings, complicated by study heterogeneity
Heterogeneity also noted for evaluation of harms, but differences observed by treatment:
Brachytherapy appears to impart a higher risk of acute and late GU symptoms relative to proton beam:
Comparable rate of late GU effects relative to IMRT
Proton beam/IMRT associated with a higher risk of acute GI symptoms relative to brachytherapy
Protons appear to impart higher risk of late GI effects vs. brachytherapy or IMRT
Little to no data on ED for comparative purposes

20
Key Questions/Next StepsGiven heterogeneity issues with measures of bFFF, what cautions would you recommend in our reporting?Is the entire body of evidence on brachytherapy appropriate to include, or are there appropriate limits to impose?Focus of attention for modeling currently on long-term morbidity:
Are there short-term effects of particular interest, and for which treatments?
Should we consider a net increase in ED relative to AS (e.g., 15-20%) for all treatments of interest?
21
Appendix: Evidence Tables
22
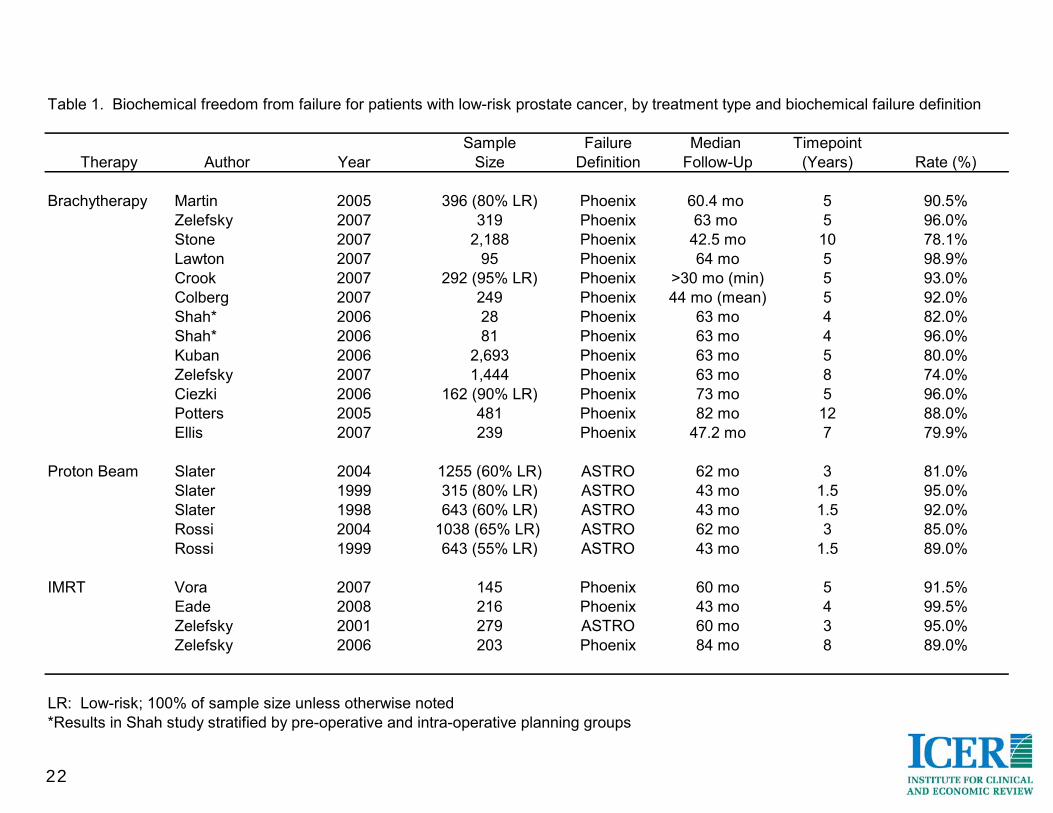
Table 1. Biochemical freedom from failure for patients with low-risk prostate cancer, by treatment type and biochemical failure definition
Sample Failure Median TimepointTherapy Author Year Size Definition Follow-Up (Years) Rate (%)
Brachytherapy Martin 2005 396 (80% LR) Phoenix 60.4 mo 5 90.5%Zelefsky 2007 319 Phoenix 63 mo 5 96.0%Stone 2007 2,188 Phoenix 42.5 mo 10 78.1%Lawton 2007 95 Phoenix 64 mo 5 98.9%Crook 2007 292 (95% LR) Phoenix >30 mo (min) 5 93.0%Colberg 2007 249 Phoenix 44 mo (mean) 5 92.0%Shah* 2006 28 Phoenix 63 mo 4 82.0%Shah* 2006 81 Phoenix 63 mo 4 96.0%Kuban 2006 2,693 Phoenix 63 mo 5 80.0%Zelefsky 2007 1,444 Phoenix 63 mo 8 74.0%Ciezki 2006 162 (90% LR) Phoenix 73 mo 5 96.0%Potters 2005 481 Phoenix 82 mo 12 88.0%Ellis 2007 239 Phoenix 47.2 mo 7 79.9%
Proton Beam Slater 2004 1255 (60% LR) ASTRO 62 mo 3 81.0%Slater 1999 315 (80% LR) ASTRO 43 mo 1.5 95.0%Slater 1998 643 (60% LR) ASTRO 43 mo 1.5 92.0%Rossi 2004 1038 (65% LR) ASTRO 62 mo 3 85.0%Rossi 1999 643 (55% LR) ASTRO 43 mo 1.5 89.0%
IMRT Vora 2007 145 Phoenix 60 mo 5 91.5%Eade 2008 216 Phoenix 43 mo 4 99.5%Zelefsky 2001 279 ASTRO 60 mo 3 95.0%Zelefsky 2006 203 Phoenix 84 mo 8 89.0%
LR: Low-risk; 100% of sample size unless otherwise noted*Results in Shah study stratified by pre-operative and intra-operative planning groups
23
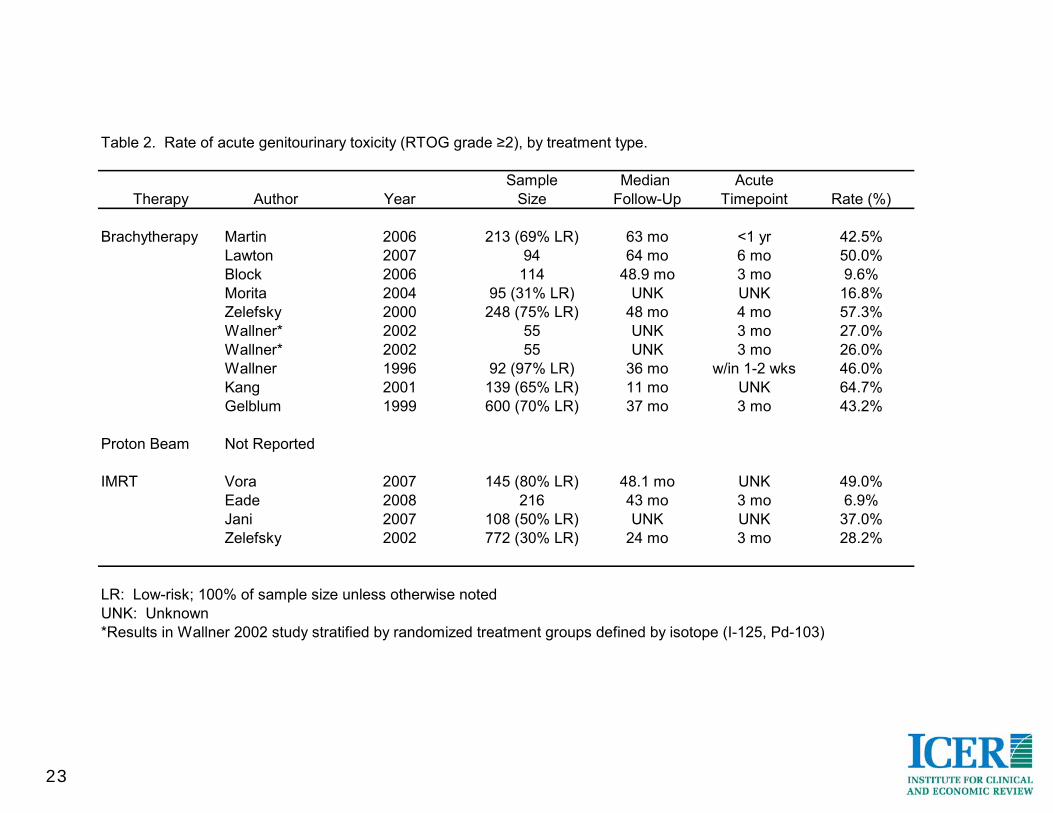
Table 2. Rate of acute genitourinary toxicity (RTOG grade ≥2), by treatment type.
Sample Median AcuteTherapy Author Year Size Follow-Up Timepoint Rate (%)
Brachytherapy Martin 2006 213 (69% LR) 63 mo <1 yr 42.5%Lawton 2007 94 64 mo 6 mo 50.0%Block 2006 114 48.9 mo 3 mo 9.6%Morita 2004 95 (31% LR) UNK UNK 16.8%Zelefsky 2000 248 (75% LR) 48 mo 4 mo 57.3%Wallner* 2002 55 UNK 3 mo 27.0%Wallner* 2002 55 UNK 3 mo 26.0%Wallner 1996 92 (97% LR) 36 mo w/in 1-2 wks 46.0%Kang 2001 139 (65% LR) 11 mo UNK 64.7%Gelblum 1999 600 (70% LR) 37 mo 3 mo 43.2%
Proton Beam Not Reported
IMRT Vora 2007 145 (80% LR) 48.1 mo UNK 49.0%Eade 2008 216 43 mo 3 mo 6.9%Jani 2007 108 (50% LR) UNK UNK 37.0%Zelefsky 2002 772 (30% LR) 24 mo 3 mo 28.2%
LR: Low-risk; 100% of sample size unless otherwise notedUNK: Unknown*Results in Wallner 2002 study stratified by randomized treatment groups defined by isotope (I-125, Pd-103)
24
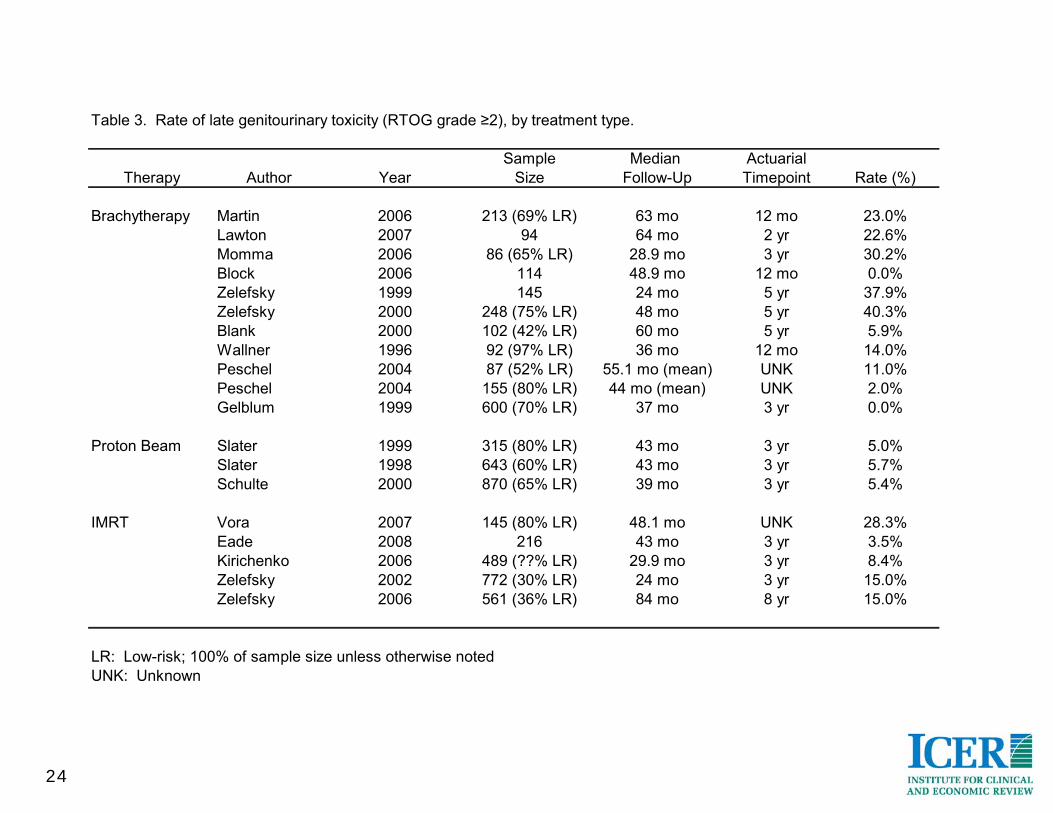
Table 3. Rate of late genitourinary toxicity (RTOG grade ≥2), by treatment type.
Sample Median ActuarialTherapy Author Year Size Follow-Up Timepoint Rate (%)
Brachytherapy Martin 2006 213 (69% LR) 63 mo 12 mo 23.0%Lawton 2007 94 64 mo 2 yr 22.6%Momma 2006 86 (65% LR) 28.9 mo 3 yr 30.2%Block 2006 114 48.9 mo 12 mo 0.0%Zelefsky 1999 145 24 mo 5 yr 37.9%Zelefsky 2000 248 (75% LR) 48 mo 5 yr 40.3%Blank 2000 102 (42% LR) 60 mo 5 yr 5.9%Wallner 1996 92 (97% LR) 36 mo 12 mo 14.0%Peschel 2004 87 (52% LR) 55.1 mo (mean) UNK 11.0%Peschel 2004 155 (80% LR) 44 mo (mean) UNK 2.0%Gelblum 1999 600 (70% LR) 37 mo 3 yr 0.0%
Proton Beam Slater 1999 315 (80% LR) 43 mo 3 yr 5.0%Slater 1998 643 (60% LR) 43 mo 3 yr 5.7%Schulte 2000 870 (65% LR) 39 mo 3 yr 5.4%
IMRT Vora 2007 145 (80% LR) 48.1 mo UNK 28.3%Eade 2008 216 43 mo 3 yr 3.5%Kirichenko 2006 489 (??% LR) 29.9 mo 3 yr 8.4%Zelefsky 2002 772 (30% LR) 24 mo 3 yr 15.0%Zelefsky 2006 561 (36% LR) 84 mo 8 yr 15.0%
LR: Low-risk; 100% of sample size unless otherwise notedUNK: Unknown

25
Table 4. Rate of acute gastrointestinal toxicity (RTOG grade ≥2), by treatment type.
Sample Median AcuteTherapy Author Year Size Follow-Up Timepoint Rate (%)
Brachytherapy Martin 2006 213 (69% LR) 63 mo <6 mo 0.9%Zelefsky 2007 367 (87% LR) 60 mo < 1 yr 3.8%Lawton 2007 94 64 mo 6 mo 9.6%Zelefsky 1999 145 24 mo 3 mo 0.0%Zelefsky 2000 248 (75% LR) 48 mo 4 mo 5.6%Wallner* 2002 55 UNK 3 mo 0.0%Wallner* 2002 55 UNK 3 mo 0.0%
Proton Beam Not Reported
IMRT Vora 2007 145 (80% LR) 48.1 mo UNK 50.3%Eade 2008 216 43 mo <3 mo 2.3%Jani 2007 108 (50% LR) UNK UNK 21.3%Zelefsky 2002 772 (30% LR) 24 mo 3 mo 4.5%
LR: Low-risk; 100% of sample size unless otherwise notedUNK: Unknown*Results in Wallner 2002 study stratified by randomized treatment groups defined by isotope (I-125, Pd-103)

26
Table 5. Rate of late gastrointestinal toxicity (RTOG grade ≥2), by treatment type.
Sample Median ActuarialTherapy Author Year Size Follow-Up Timepoint Rate (%)
Brachytherapy Martin 2006 213 (69% LR) 63 mo >6 mo 0.0%Zelefsky 2007 367 (87% LR) 60 mo >12 mo 8.7%Lawton 2007 94 64 mo 2 yr 5.3%Momma 2006 86 (65% LR) 28.9 mo med 3 yr 12.8%Zelefsky 1999 145 24 mo 5 yr 11.0%Zelefsky 2000 248 (75% LR) 48 mo 5 yr 9.0%Blasko 2000 403 (80% LR) 58 mo UNK 2.0%Blank 2000 102 (42% LR) 60 mo 5 yr 3.9%Wallner* 2002 55 UNK UNK 1.0%Wallner* 2002 55 UNK UNK 1.0%Peschel 2004 87 (52% LR) 55.1 mo (mean) 5 yr 4.0%Peschel 2004 155 (80% LR) 44 mo (mean) 5 yr 2.0%Vargas 2005 161 (92% LR) 40 mo UNK 0.6%Ohashi 2007 227 (70% LR) 22 mo UNK 4.8%Gelblum 2000 685 (48% LR) 48 mo 4 yr 6.9%Stone 1995 71 (85% LR) 24 mo (mean) 2 yr 4.2%Koutrovelis 2000 301 (80% LR) 26 mo UNK 1.0%
Proton Beam Slater 1999 315 (80% LR) 43 mo 3 yr 26.0%Slater 1998 643 (60% LR) 43 mo 3 yr 21.0%Schulte 2000 870 (65% LR) 39 mo 3 yr 3.4%
IMRT Fonteyne 2007 241 42 mo 3 yr 12.0%Vora 2007 145 (80% LR) 48.1 mo UNK 24.1%Eade 2008 216 43 mo 3 yr 2.4%Kirichenko 2006 489 (??% LR) 29.9 mo 3 yr 6.2%Jani 2007 355 (50% LR) UNK UNK 6.0%Zelefsky 2002 772 (30% LR) 24 mo 3 yr 4.0%Zelefsky 2006 561 (36% LR) 84 mo 8 yr 1.6%
LR: Low-risk; 100% of sample size unless otherwise notedUNK: Unknown*Results in Wallner 2002 study stratified by randomized treatment groups defined by isotope (I-125, Pd-103)

Economic Model of Multiple Radiation Therapy Treatments for Low-Risk
Prostate Cancer: Overview
June 4, 2008
Julia Hayes, M.D.Pamela McMahon, Ph.D.
2
ICER Model: OverviewMarkov cohort model
One year cycle length
Patient populationLow-risk disease (D’Amico criteria)
Gleason <6, PSA<10, stage <T2a
Base case: 65 year old manLimited analyses will be conducted for 55 year old man, varying selected age-specific risks
3
ICER Model: OverviewMultiple treatment strategies evaluated
Initial treatment at diagnosisBrachytherapy
Proton beam therapy
IMRT (common referent standard)
Active surveillanceTreated upon clinical progression
Treated based on patient decision without progression
4
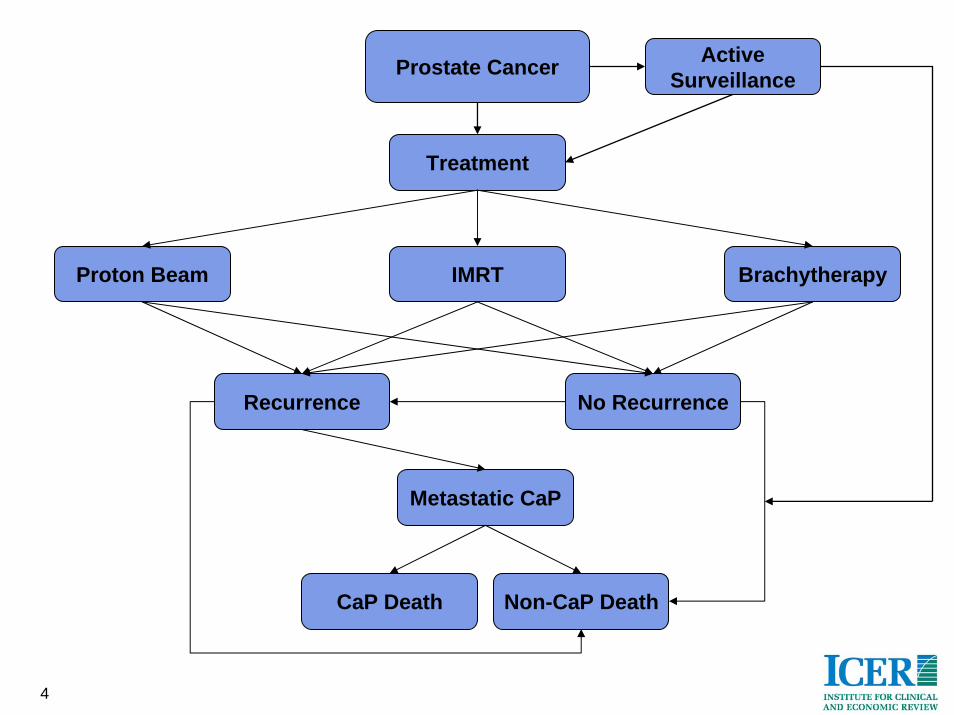
BrachytherapyProton Beam IMRT
Recurrence No Recurrence
Non-CaP DeathCaP Death
Treatment
Metastatic CaP
Prostate Cancer ActiveSurveillance
5
ICER Model: OverviewHealth states will reflect presence or absence of treatment-related complications
Short- and long-term complications of all 3 treatments
Acute urinary retention with brachytherapy
Utilities will be assigned to each health state
Major cost categories will include:Treatment-related (incl. management of complications)
Treatment-unrelated (e.g., annual medical costs, costs of terminal care)
6
ICER Model: OverviewPrimary Outcomes
Life ExpectancyOverall mortality, prostate cancer-specific mortality
Quality adjusted life expectancy
Cost-effectiveness ($/QALY)
Secondary OutcomesBiochemical freedom from failure
Cost per complication averted
7
Model Assumptions:Disease Course
No men die of prostate cancer within 3 years of diagnosis
All men who recur after definitive therapy will recur biochemically (BCR)
Probability of progressing from BCR to metastatic disease same for all low-risk patients regardless of treatment
Men die of prostate cancer only after the development of metastatic disease
The probability of progressing from metastatic disease to death is the same regardless of treatment
8
Model Assumptions: Disease Course
Active surveillance (AS)Progression on AS is defined as
Increase in Gleason score orRapid PSA rise
No patients progress to metastatic disease while on ASPatients who progress are treated with IMRT plus 6 months of androgen deprivation therapy (ADT)3 additional strategies for non-progressing patients who choose to be treated (1 each for brachytherapy, proton beam therapy, and IMRT respectively)Patients who choose to be treated have same disease outcomes as those treated at diagnosis
9
Model Assumptions: Complications of Treatment/Disease
All complications will be treated
The occurrence of any complication is independent of the occurrence of a second complication

10
Model Assumptions:Complications of Treatment
Long-term treatment complicationsErectile dysfunction (ED)
Genitourinary (e.g., incontinence)
Gastrointestinal (e.g., proctitis)
Occur at least 90 days after treatment
All long-term complications will have occurred by 24 months after treatment
All patients treated with 6 months ADT/IMRT will have ED during the year of treatment
11
Model Assumptions:Complications of Treatment
Short-term complicationsGenitourinary
Gastrointestinal
Acute urinary retention (for brachytherapy only)All occur within 90 days of treatment
Secondary malignancy after radiation (any tx):Patients will receive associated disutility

12
Model Assumptions: Complications of Disease
Active surveillance (AS) ED
Incontinence
Occur beginning two years after placement on AS
13
ICER Model: UtilitiesUtility for each health state remains constant for life, with 2 exceptions:
Short-term complication utilities will be applied to first year only and will be adjusted to be proportionate to 3-month duration
ED from ADT therapy assumed to persist for year in which treatment given only
Disutility for secondary malignancy will differ between brachytherapy and other forms of radiation
Will be subject to sensitivity analyses as well
14
Categories of CostAnnual medical care costs (unrelated)
Terminal care costsProstate cancer vs. other cause
Direct medical costsOutpatient surveillance
Outpatient treatments
Patient out of pocket costs
Patient time costs (e.g., time-in-therapy)
15
Direct Medical CostsOutpatient surveillance
Active surveillance
Post-treatment surveillance
Outpatient treatmentsInitial treatments
Management of treatment-related complications
Patient copayments, coinsurance, and deductibles
16
Base CasePerspective = “payer plus”
Costs from CMS, RedBook + patient time + out-of-pocketSensitivity analyses will focus on payer-only perspective
Time horizon = lifetimeDiscounting = 3% annually
Constant 2007 US $CPI adjusted, +/-medical care component
For each CPT:RVU*annual units*national conversion factor
17
Omitted CostsCaregiver time
Costs incurred by all patients prior to entering modelDiagnosis, staging of prostate cancer
Non-health care resource use costsAdd a constant to each year of life; little variation in survival across treatments
Amortization costs (e.g., for proton-beam facility)