system iot based soil monitoring and automatic irrigation
TRANSCRIPT

Page 1/47
IOT Based Soil Monitoring and Automatic IrrigationSystemMohammad Shamiur Rahman Al Nahian ( [email protected] )
RUET: Rajshahi University of Engineering and Technology https://orcid.org/0000-0003-1036-4927Arnab Piush Biswas
RUET: Rajshahi University of Engineering and TechnologyDr. J. C. Tsou
China University of TechnologyDr. Md. Hamidur Rahman
Department of Livestock
Research Article
Keywords: IOT, WSN, Automatic Control, Automation in agriculture, Arduino, NodeMCU, ESP8266
Posted Date: June 2nd, 2021
DOI: https://doi.org/10.21203/rs.3.rs-435834/v1
License: This work is licensed under a Creative Commons Attribution 4.0 International License. Read Full License

Page 2/47
AbstractTo serve the humanity nowadays technology is playing a wonderful role and a man’s basic and primaryneed is food indeed. It can be said that about more than 85% of people of Bangladesh are directly,indirectly depended on agriculture. Proper irrigation by water pump cannot be maintained due to frequentpower outages, unavailability of grid lines in remote areas and scarcity/cost of fuel to run pumps. Tomake the sustainable irrigation system and �eld monitoring system for getting better crops growth aswell as best production, this IOT based Automatic irrigation system is proposed. In this system IOT andWSN are used to control and monitor the irrigation system. IOT is used to obtain stored data monitoringand real time monitoring of various contents of soil. WSN is used to make a fully wireless system tomake a user-friendly system to cultivate and irrigate water properly to the �eld. Different kinds of sensorsare used. This report presents a fully automated drip irrigation system which is controlled and monitoredby using “Thinkspeak Cloud Server”. Temperature and the humidity content of the soil are frequentlymonitored. The system informs user about any abnormal conditions like less moisture content andtemperature rise, even concentration of water by sending noti�cations through the wireless module.
IntroductionIt is widely known that the resources of water are decreasing all over the world. On the other hand, rapidurbanization, population growth, industries and agriculture expansion increase the demand for freshwater. In the agriculture based countries including Bangladesh, for irrigation purpose water is used morethan any other purpose, and the production rate can be decreased if any kind of hampering happened inwater supply. The improvement of water usage e�ciency without decreasing yield can be done bymaintaining water management strategies & up-to-date technologies. It has become crying need for theagro-based countries to take more e�cient technology in the �eld of agriculture to create bettermanagement of water resources. Digital Bangladesh concept that has led to tremendous growth in digitalinformation storage, retrieval and communication. Now a day the concept of Internet of Things (IOT) hasmade human life more comfortable. Everyone is referring this system of inter-related computing devices,objects, things, animals, people, etc. Without human involvement the system is able sharing informationover a network. The idea of IoT has been blooming since decades. For water savings function it has beenproved that Wireless sensor network (WSN) system is very much helpful for irrigation management. WSNis the system which is a mesh of network of sensor nodes which are connected each other and the nodesdirectly collect data from the environment and provide real time data to the �rm which is very muchhelpful for the farmers. Both as a data collection device and as a decision-making tool for real timemonitoring this system can be used. The farmers are aware of water shortage or over watering maydamage the yield. They need to understand when and how much amount of water is needed for speci�ccrops. Most farmers have little knowledge of their farm and they are unaware of the methods ofimproving their productivity of agricultural practices. All these con�icts make it necessary to think ofresolving support systems for agriculture. In order to overcome this problem, IoT based Wireless SensorNetwork (WSN) for agriculture monitoring controls are applied. The internet/any kind of information
Page 3/47
sharing communication without cable connection between computers and other electronic devices can bedone by Wireless Sensor Network (WSN) technology. A tremendous achievement has been found inagriculture environment with the help of Sensor Network System. It is said that in the 21st century, themost important technology is the WSN. WSN is a full package of a number of low-power, low-cost,multipurpose sensor nodes for a short and long distance wireless communication. Different networktopologies and multichip communication is allowed by WSN. The effort and the complication can be cutdown by WSN for monitoring environment. As a result of it the cost of water and labor can be reduced.Temperature, humidity, and soil moisture percentage and many more measurements can be remote bythis technology. It seems that wireless outcomes are much better than the wired-based systems. Withinthis framework, IOT based wireless sensor network is a promising technology for irrigation managementand soil monitoring by using soil conditions and actual weather on the basis of temperature and humidityof the area. A network of small devices which collect and process real time information from the �elds inwhich they are deployed. The use of this technique makes the irrigation system & soil monitoring systemindependent of human intervention in terms of precise quanti�cation, location and time of irrigation, andthus the establishment of an automatic irrigation system and soil monitoring system that is known as thesmart irrigation and soil monitoring system for this reason. The purpose is to present several e�cientirrigation systems and soil monitoring systems using IoT based wireless sensor networks, which canimprove water use e�ciency and also gives the correct condition of the soil by determining the timing ofirrigation in an era of increasingly limited and costly water supplies. The second section can deal with theirrigation strategy that can be followed by an overview of smart irrigation by using wireless sensornetworks. The arti�cial implementation of water in the �eld is known as irrigation. Irrigation comes inmany forms. Many kind of e�cient water supplying technology is replacing rapidly the old ones andapplying it to the soil. Depending on how water is distributed throughout the �eld there are many differenttypes of irrigation systems,
In this report a system has been developed to solve the problem of real time monitoring and stored datamonitoring to investigate the soil condition at any time to take decision what types of crops should begrown and what should be done with the soil to get better and best production of the crops and alsomakes the whole system wirelessly automatic control over mobile phone which can reduce the cost of thelabor as well the effort of a farmer.
Objectives
1. To develop an IOT based automatic irrigation system having a low-cost equipment.
2. To monitor moisture contents at different conditions
3. To improve the system by using Mobile Phone App
4. To improve the system by using WSN (Wireless Sensor Network)
Scope and Limitations
The scope of this project is

Page 4/47
1. Monitoring of soil moisture content
2. Automatic Control system.
3. Real time monitoring of soil
4. Mobile based control system.
5. IOT Based platform
Limitations of this project is
1. The system can only be used via internet connection.
2. The system can be used with the help of batteries on the �eld where AC current is not available
System OverviewFigure 3.1 shows our proposed system. Our proposed system consists of 3 Nodes. Node 1 Consist ofArduino+Soil Sensor+NRF24L01 Module. Node 2 is consist of Arduino+NRF24L01+DHT11Sensor+ESP8266 WiFi Module. Node 3 is consist of NodeMCU and Relay Module.
Figure 3.2 shows our working system. This diagram indicates how our 3 nodes are interconnected witheach node.
So on the basis of our proposed system & working system, according to �gure 3.1 & �gure 3.2 we can seethat there are 3 nodes in our system. In Node 1, capacitive soil moisture sensor. Arduino Uno & nRF24L01module are mounted with each other. Arduino Uno collects the soil moisture data & sending datawirelessly in node 2. In node 2 Arduino Uno, nRF24L01, DHT11 Sensor, ESP8266 Wi-Fi module is mountedwith each other. The node 2 receives data from node 1 and collects the temperature & humidity data fromDHT11 & sending all the data in Thingspeak cloud server with the help of internet connection. Where allthe data get stored for lifetime and it can be monitored at any time and we termed it as stored datamonitoring. The Node 3 which is mounted with NodeMcu and relay module collects the data from theThingspeak server and send wirelessly via Internet connection to a mobile app named Blynk which can bemonitored in real time and the fact is called real time monitoring. The mounted relay can turn on or turnof the pump automatically as it is programmed. The pump can also be turned on or off by using themobile app.
Thingspeak cloud server is an open server where any kind of data is stored by which all the system canbe monitored. Figure 3.4 is showing how the data are plotted in the server and how it is storing all thedata for monitoring.
Node 1: Node 1 is mounted with Capacitive Soil Moisture Sensor, nRF24L01 & Arduino Uno.
Capacitive Soil Moisture Sensor: The Sensor senses the data from soil.
Arduino Uno: The moisture data of soil is processed by Arduino Uno.

Page 5/47
nRF24L01: It’s a wireless module. The processed data are sent wirelessly to node 2 by nRF24L01.
Node 2: Node 2 is mounted with Arduino Uno, nRF24L01, DHT11 & ESP8266 Wi-Fi module.
nRF24L01: This module receives the data which is sent by the node 1 and gives it to the arduino.
DHT11: This module collects the data of temperature and humidity and gives it to the arduino.
Arduiono Uno: It processes all the data.
ESP8266 Wi-Fi module: This module sends all the processed data to the thingspeak server via internetconnection.
Node 3: It is mounted with Node MCU & Relay.
Node MCU: It receives the data from Thinkspeak Cloud Server and processes data and send them to themobile app for real time monitoring and also gives command to the relay module.
Relay Module: This module can turn on or turn off the DC pump by the command of the Nodemcu.
Methods and tools used
Table 3.1 is showing the speci�cation of our System. Which components we used here and how does itoperates.
Table 3.1: Speci�cation of a System
Item Speci�cation
Arduino Uno ATmega328P – 8 bit AVR family microcontroller, Operating Voltage 6-20V, DCCurrent on I/O Pin – 40ma.
NodeMcu ESP-8266 32-bit, Operating Voltage- 3.3V, Input Voltage- 4-10V, Flash memory- 4MB/64 KB
DevelopmentPlatform
IA-32, x86-64, ARM.
Language Used Arduino C++
Codedevelopment
Arduino Softwere
Table 3.1 describes the speci�cation of our system. In our system, we use Arduino Uno as our mothercontroller. We use Arduino C++ as our operating language and Arduino software is used for codedevelopment.
Experimental Setup

Page 6/47
IOT (internet of Things) part: Data are sent from Node 1 to Node 2. Node 2 receives the data & transfersthe
data to Thingspeak cloud server through internet. These data are received by Node 3 via internet. This isreal time data monitoring. WSN (Wireless Sensor Network) Part: Data is sent from node 1 to node 2wirelessly. NRF4L01 is mounted with it
Automatic/Manual Control Of the Pump through Mobile App(Blynk): The pump can be turned on orturned off automatically. The pump also can operate manually by using mobile.
3.5 Sensing System
Capacitive soil moisture sensor senses soil moisture data of soil. The sensor is mounted in node 1. InNode 1, there is an Arduino Uno & NRF24L01 module which sends data wirelessly to Node 2.
The Capacitive Soil Moisture Sensor Has Three Pins
1. 5V VCC Pin.
2. GND Pin.
3. Analog Reading.
The 5V Vcc pin of the Sensor in connected with the Arduino from which the Sensor gets power to run theprocess. The Analog pin of the Sensor is connected with the A1 pin of the Arduino and the GND pin isconnected with GND pin. When the Sensor is power up by 5V VCC then the Arduino gets the Sensor valuethrough the pin A1 from the Analog Reading pin of the Sensor.
Circuit diagrams
Node 1 is mounted with capacitive soil moisture sensor, Arduino Uno & NRF24L01 wi� module. There are3 pins in capacitive soil moisture sensor which are directly connected with Arduino Uno. The pins ofNRF24L01 are connected with Arduino Uno. So, the pins are connected to each other like this.

Page 7/47
NRF24L01 ⟶ Arduino Uno
Pin CE ⟶ Pin 7
Pin CSN ⟶ Pin 8
Pin SCK ⟶ Pin 13
Pin MISO ⟶ Pin 12
Pin MOSI ⟶ Pin 11
Pin VCC ⟶ Pin 3.3V
Pin GND ⟶ Pin GND
Soil Moisture Sensor ⟶ Arduino Uno
Pin VCC ⟶ Pin 5V
Pin GND ⟶ Pin GND
Pin Analog Reading ⟶ Pin A1
Node 2 is mounted with DHT11 sensor, Arduino Uno, NRF24L01 wi� module and ESP8266Wi� Module.So, the pins are connected to each other like this.

Page 8/47
NRF24L01 ⟶ Arduino UNO
Pin CE ⟶ Pin 7
Pin CSN ⟶ Pin 8
Pin SCK ⟶ Pin 13
Pin MISO ⟶ Pin 12
Pin MOSI ⟶ Pin 11
Pin VCC ⟶ Pin 3.3V
Pin GND ⟶ Pin GND
DHT11 Sensor ⟶ Arduino UNO
Pin VCC ⟶ Pin 5V
Pin GND Pin GND
Pin DATA ⟶ Pin 4
ESP8266 WiFi Module ⟶ Arduino UNO
Pin RXD Pin 3
Pin TXD ⟶ Pin 2
Pin VCC ⟶ Pin 3.3V
Pin GND ⟶ Pin GND
Pin CH_PD ⟶ Pin 3.3V
Node 3 is mounted with NodeMCU and Relay module. So, the pins are connected to each other like this.
Relay Module ⟶ NodeMCU
Pin EN ⟶ Pin D8
Pin VCC ⟶ Pin Vin
Pin GND ⟶ Pin GND
Figure 3.18 indicates the circuit diagram for Node 3 which is mounted with Nodemcu & Relay module.There are 38 pins in Nodemcu & 6 pins for Relay module.
Controlling System design
Algorithms and Flow chart

Page 9/47
Algorithm
(Soil Moisture Sensor+ Arduino+ nrf24L01 Module)
Start
Read the value of the Soil Moisture Sensor
Processes the Value on Arduino
Send the Value Through nrf24L01 Wirelessly
(nrf24L01 Module+ Arduino+ ESP8266 Wi� Module+ DHT11 sensor)
Start
Receive the value Through nrf24L01 Module from the soil moisture Sensor node
Read the values of Temperature and Humidity from the DHT11 Sensor
Processes the values on Arduino
Send all Values to the Thingspeak Server Through ESP8266 Wi� Module
(Nodemcu+ Relay Module+ Mobile App)
Start
Read the values From the Thingspeak Server Through Nodemcu
Processes the values on Nodemcu
Send the values on Mobile App (Blynk)
Taking Decision to turn the motor automatically on/off or Manually on/off.
If The value of soil moisture is less than 60% the pump will automatically be turned on
If the value of soil moisture is greater than 80% the pump will automatically be turned off
The pump can be turned on/off through mobile app(Blynk) between the value 61% to 79%
Stop
Working Principle of controlling System
Three major parts are involved here,
1. IOT (internet of Things) part: Data are sent from node 1 to Node 2. Node 2 receives the data &transfers the data to Thingspeak cloud server through internet. These data are received by node 3 viainternet. This is real time data monitoring.
2. WSN (Wireless Sensor Network) Part: Data is sent from node 1 to node 2 wirelessly.nRF4L01 ismounted with it.
3. Automatic/Manual Control Of the Pump through Mobile App(Blynk): The pump can be turned on orturned off automatically. The pump also can operate manually by using mobile.

Page 10/47
3.8 Cost Estimation
For Node 1
Node 1 is mounted with 1 unit Arduino Uno, 1 unit nrf24L01 & 1 unit capacitive soil moisture sensor. Totalcost 850 tk.
Table 3.2: Cost Estimation for Node 1
Sl.No
Item Name Speci�cation No. ofUnit
Unit Cost(TK)
Total Cost(TK)
1 Arduino UNO ATMEGA-328 1 350 850
2 Nrf24L01 single chip2.4GHz
1 200
3 Capacitive Soil MoistureSensor
PH2.54-3P 1 300
For Node 2
Node 2 is mounted with 1 unit Arduino Uno, 1 unit nrf24L01 , 1 unit DHT11 & 1 unit ESP8266 Wi� module.Total cost 900 tk.
Table 3.3: Cost Estimation for Node 2
Sl.No
Item Name Speci�cation No. OfUnit
Unit Cost(TK)
Total Cost(TK)
1 Arduino UNO ATMEGA-328 1 350 900
2 Nrf24L01 Single Chip 2.4GHz 1 200
3 DHT11 Sensor 150 1 150
4 ESP8266 Wi�Module
32-bit microcontroller with IEEE802.11 b/g/n WiFi
1 200
For Node 3
Node 3 is mounted with 1 unit Nodemcu & 1 unit Relay module. Total cost 500 tk.
Table 3.4: Cost Estimation for Node 3

Page 11/47
Sl. No Item Name Speci�cation No. of Unit Unit Cost(TK) Total Cost(TK)
1 NodeMcu ESP-8266 32-bit 1 400 500
2 Relay Module 5V switch 1 100
Experimental DataWe have collected over 5000 data stored in the Thingspeak server which was collected in the indoor andoutdoor situation at the format of excel
From the above data we come to an point on some different issues like when the values of humidity,temperature, soil moisture got changed. So on the basis of this we have made some data tables whichhas been given bellow.
Some Speci�c values of Temperature, Humidity & Soil Moisture Percentage from the 5000 data on May23 have been given bellow:
Table 4.1
Date and Time Temperature Humidity Soil Moisture Percentage
2020-05-23 04:45:00 26.88 84 88
2020-05-23 05:00:00 26.88 85 89
2020-05-23 05:15:00 28.35 85 89
2020-05-23 05:30:00 28.35 85 89
2020-05-23 05:45:00 28.84 85 89
2020-05-23 06:00:00 27.86 85 89
2020-05-23 06:15:00 27.37 86 90
2020-05-23 06:30:00 27.86 86 90
2020-05-23 06:45:00 26.88 86 90
2020-05-23 07:00:00 28.35 85 89
2020-05-23 07:15:00 27.37 83 89
Some Speci�c values of Temperature, Humidity & Soil Moisture Percentage from the 5000 data on June03 have been given bellow:
Table 4.2

Page 12/47
Date and Time Temperature Humidity Soil Moisture Percentage
2020-06-03 04:45:00 28.84 83 77
2020-06-03 05:00:00 28.35 84 78
2020-06-03 05:15:00 28.84 84 78
2020-06-03 05:30:00 28.35 84 78
2020-06-03 05:45:00 28.84 84 78
2020-06-03 06:00:00 28.84 85 79
2020-06-03 06:15:00 28.84 85 79
2020-06-03 06:30:00 28.84 85 79
2020-06-03 06:45:00 29.33 85 79
2020-06-03 07:00:00 28.84 84 78
2020-06-03 07:15:00 28.84 84 78
2020-06-03 07:30:00 30.3 82 78
Some Speci�c values of Temperature, Humidity & Soil Moisture Percentage from the 5000 data on June23 have been given bellow:
Table 4.3

Page 13/47
Date and Time Temperature Humidity Soil Moisture Percentage
2020-06-23 04:45:00 29.33 81 82
2020-06-23 05:00:00 29.33 82 83
2020-06-23 05:15:00 26.39 82 83
2020-06-23 05:30:00 28.84 82 83
2020-06-23 05:45:00 24.93 82 83
2020-06-23 06:00:00 29.33 83 84
2020-06-23 06:15:00 29.33 83 84
2020-06-23 06:30:00 29.33 83 84
2020-06-23 06:45:00 29.33 83 84
2020-06-23 07:00:00 28.84 82 83
2020-06-23 07:15:00 29.33 82 83
2020-06-23 07:30:00 28.84 80 82
Some Speci�c values of Temperature, Humidity & Soil Moisture Percentage from the 5000 data on July04 have been given bellow:
Table 4.4

Page 14/47
Date and Time Temperature Humidity Soil Moisture Percentage
2020-07-04 04:45:00 29.33 76 83
2020-07-04 05:00:00 29.81 77 84
2020-07-04 05:15:00 29.81 77 84
2020-07-04 05:30:00 29.33 77 84
2020-07-04 05:45:00 29.81 77 84
2020-07-04 06:00:00 29.33 78 85
2020-07-04 06:15:00 29.81 78 85
2020-07-04 06:30:00 29.81 78 85
2020-07-04 06:45:00 29.81 78 85
2020-07-04 07:00:00 29.33 76 84
2020-07-04 07:15:00 29.33 76 84
2020-07-04 07:30:00 29.81 76 83
So by observing all the table values from different days but the time was from 5am to 7am, we foundthat at the time of this the values of humidity and soil moisture got increased every day.
Some Speci�c values of Temperature, Humidity & Soil Moisture Percentage from the 5000 data on May28 have been given bellow:
Table 4.5

Page 15/47
Date and Time Temperature Humidity Soil Moisture Percentage
2020-05-28 07:30:00 28.35 84 82
2020-05-28 07:45:00 29.33 84 81
2020-05-28 08:00:00 29.33 87 82
2020-05-28 08:15:00 28.35 88 82
2020-05-28 08:30:00 28.84 88 83
2020-05-28 08:45:00 28.84 88 83
2020-05-28 09:00:00 28.35 89 84
2020-05-28 09:15:00 28.84 89 84
2020-05-28 09:30:00 27.86 88 83
2020-05-28 09:45:00 29.33 87 83
2020-05-28 10:00:00 27.86 87 83
2020-05-28 10:15:00 28.84 84 81
2020-05-28 10:30:00 29.33 84 81
2020-05-28 10:45:00 32.75 83 80
2020-05-28 11:00:00 29.81 83 80
2020-05-28 11:15:00 29.33 83 79
2020-05-28 11:30:00 28.84 83 79
Some Speci�c values of Temperature, Humidity & Soil Moisture Percentage from the 5000 data on June12 have been given bellow:
Table 4.6

Page 16/47
Date and Time Temperature Humidity Soil Moisture Percentage
2020-06-12 14:30:00 28.84 80 85
2020-06-12 14:45:00 27.86 80 84
2020-06-12 15:00:00 28.84 85 86
2020-06-12 15:15:00 28.84 85 86
2020-06-12 15:30:00 28.84 85 85
2020-06-12 15:45:00 28.84 82 84
2020-06-12 16:00:00 28.84 79 84
2020-06-12 16:15:00 28.84 80 84
2020-06-12 16:30:00 28.84 80 84
2020-06-12 16:45:00 28.84 80 84
Some Speci�c values of Temperature, Humidity & Soil Moisture Percentage from the 5000 data on June25 have been given bellow
Table 4.7
Date and Time Temperature Humidity Soil Moisture Percentage
2020-06-25 10:30:00 29.33 82 77
2020-06-25 10:45:00 29.33 82 77
2020-06-25 11:00:00 27.86 87 80
2020-06-25 11:15:00 28.84 87 80
2020-06-25 11:30:00 28.35 86 79
2020-06-25 11:45:00 29.33 82 77
2020-06-25 12:00:00 28.84 81 76
2020-06-25 12:15:00 28.84 81 75
2020-06-25 12:30:00 28.35 81 75
2020-06-25 12:45:00 28.84 81 75
Some Speci�c values of Temperature, Humidity & Soil Moisture Percentage from the 5000 data on July01 have been given bellow:
Table 4.8

Page 17/47
Date and Time Temperature Humidity Soil Moisture Percenatge
2020-07-01 17:45:00 29.33 75 92
2020-07-01 18:00:00 29.33 82 94
2020-07-01 18:15:00 27.86 85 95
2020-07-01 18:30:00 29.33 85 95
2020-07-01 18:45:00 29.33 85 95
2020-07-01 19:00:00 30.3 84 94
2020-07-01 19:15:00 28.84 83 93
2020-07-01 19:30:00 29.81 77 91
2020-07-01 19:45:00 29.81 75 91
2020-07-01 20:00:00 29.33 75 90
2020-07-01 20:15:00 29.81 76 90
2020-07-01 20:30:00 29.81 76 90
2020-07-01 20:45:00 28.84 76 90
Some Speci�c values of Temperature, Humidity & Soil Moisture Percentage from the 5000 data on July10 have been given bellow:
Table 4.9

Page 18/47
Date and Time Temperature Humidity Soil Moisture Percentage
2020-07-10 09:30:00 29.81 79 78
2020-07-10 09:45:00 29.33 79 78
2020-07-10 10:00:00 29.81 85 80
2020-07-10 10:15:00 29.81 85 80
2020-07-10 10:30:00 29.33 85 80
2020-07-10 10:45:00 29.33 85 80
2020-07-10 11:00:00 29.81 84 78
2020-07-10 11:15:00 29.81 84 78
2020-07-10 11:30:00 29.33 83 77
2020-07-10 11:45:00 29.81 82 76
2020-07-10 12:00:00 29.81 79 75
2020-07-10 12:15:00 29.33 79 74
2020-07-10 12:30:00 29.81 79 74
2020-07-10 12:45:00 28.35 79 74
Some Speci�c values of Temperature, Humidity & Soil Moisture Percentage from the 5000 data on July16 have been given bellow:
Table 4.10

Page 19/47
Date and Time Temperature Humidity Soil Moisture Percentage
2020-07-16 13:30:00 30.3 77 75
2020-07-16 13:45:00 30.79 77 75
2020-07-16 14:00:00 29.33 85 80
2020-07-16 14:15:00 30.3 85 80
2020-07-16 14:30:00 30.3 85 80
2020-07-16 14:45:00 28.84 80 77
2020-07-16 15:00:00 30.3 78 73
2020-07-16 15:15:00 30.3 78 73
2020-07-16 15:30:00 30.3 78 73
2020-07-16 15:45:00 29.81 78 73
So, from this section all the values of the data were from the rainy day, and the rain came for a certaintime and the data is of that certain time. So, from the tables e found that at the time of raining thehumidity and the soil moisture percentage increased.
ResultsOn the basis of the over 5000 data which was collected both on indoor and outdoor sides, we found thatthe values of the humidity and the soil moisture was decreasing
so fast in the outdoor side than the indoor side. It was taking so much time to decrease the humidity andsoil moisture value in the indoor side.
Figure 4.3 represents the graphical view of the values of Table 4.1.
Figure 4.4 represents the graphical view of the values of Table 4.2
Figure 4.5 represents the graphical view of the values of Table 4.3
Figure 4.6 represents the graphical view of the values of Table 4.4
So from all the graphs which is based on the data of table 4.1, table 4.2, table 4.3 and table 4.4 we getthat the humidity and the soil moisture percentage was increased in the morning of 5AM-7AM. That ismean the humidity and the soil moisture percentage always increase in the morning.
Figure 4.7 represents the graphical view of the values of Table 4.5
Figure 4.8 represents the graphical view of the values of Table 4.6

Page 20/47
Figure 4.9 represents the graphical view of the values of Table 4.7
Figure 4.10 represents the graphical view of the values of Table 4.8
Figure 4.11 represents the graphical view of the values of Table 4.9
Figure 4.12 represents the graphical view of the values of Table 4.10
So from all the graphs which is based on the data of table5, table6, table7,table8 table9 and table10 weget that the humidity and the soil moisture percentage was increased in the rainy days. That is mean thehumidity and the soil moisture percentage always increase in the rainy time.
After determining the boundaries of a given area, a soil moisture sampling plan should be developed. Theinitial sampling should be performed in a small grid; however, it is important to maintain a minimum oftwenty sampling points per acre for a good soil moisture characterization, covering the entire area[16],Subsequent soil moisture sampling can be conducted using a grid-based system.
DiscussionDuring the time of our experiment we had faced some di�culties collecting data. The moisture contentwas suddenly �uctuated with the drastic change of outdoor & indoor temperature. For this scenario, theresome error happened at the time of taking our moisture content. But after doing some calibration Wecould successfully complete our experiment.
ConclusionThe main achievement of our thesis is to build a system of real time monitoring and stored datamonitoring of the soil condition during irrigation. As ours have an agriculturally based economy we haveto be fully focused on maximum productivity. So, water wastage and soil monitoring during irrigation hasto be done at a satisfactory rate so that maximum production can be ensured. The main objective of ourthesis is to design a fully automated drip irrigation system and real time soil monitoring, stored datamonitoring using IOT & WSN. The system provides an e�cient monitoring of moisture, humidity andtemperature content of soil. The data collected by the system can be used for further analysis purpose.
Improvements for the Future
This project can be extended in future studies in order to improve the system in various aspects such as
This project can be used vastly in the rural areas of Bangladesh if Bangladesh agricultural ministry givesquality emphasize on this project. Then it would be made possible for the agricultural o�cers to monitorthe farms without going to the lands. For this the farmers will be so much bene�tted & at the same timeproduction rate can be increased.

Page 21/47
Online based warning system was not able to generate an alarm warning for insects. But it is very muchneeded thing to detect the insects for further decision making for the betterment of crop growth andanother thing can be added in this research project and it is detection and distinguish the depredatinginsect sounds from other environmental sounds. For recognizing deficiencies, pests, diseases, and otherdetrimental agents in the vineyards an image processing method that can be added to the system.
Luminosity is a key factor of brightness analysis for estimating light radiation on plants can be appliedfor determining the sugar concentration, controlling the amount of sunlight received by the vines, anddetermining the optimum time for harvesting more accurately and timely. By utilizing luminosity sensorsit can be measured that how much light radiation are falling to the crops or how it should be planted forbetter growth.
Declarations1. Funding
Not Applicable.
2. Competing interest:
Not Applicable.
3. Code Availbility:
Arduino Program �les
Program for Node 1 (Arduino+ Soil Moisture+ nrf24L01)
#include <SPI.h>
#include <nRF24L01.h>
#include <RF24.h>
RF24 radio(7,8);
int sensor = A1;
int sensorvalue;
int percentage;
const byte address[6] = "00001";
void setup() {

Page 22/47
radio.begin();
radio.openWritingPipe(address);
radio.setPALevel(RF24_PA_MIN);
radio.stopListening();
pinMode(sensor, INPUT);
}
void loop() {
sensorvalue = analogRead(sensor);
percentage = map(sensorvalue,860,436,0,100);
radio.write(&percentage, sizeof(percentage));
}
Program for Node 2 (Arduino+ nrf24L01+ DHT11+ ESP8266 Wi� module)
#include <SoftwareSerial.h>
SoftwareSerial espSerial = SoftwareSerial(2,3); // arduino RX pin=2 arduino TX pin=3 connect the arduinoRX pin to esp8266 module TX pin - connect the arduino TX pin to esp8266 module RX pin
#include <SimpleDHT.h>
#include <ESP8266_Lib.h>
#include <SPI.h>
#include <nRF24L01.h>
#include <RF24.h>
RF24 radio(7,8);// ce cns//
const byte address[6] = "00001";
int value;
int pinDHT11 = 4;
SimpleDHT11 dht11(pinDHT11);

Page 23/47
String apiKey = "310ACMEQ7T9YN80T";
// replace with your channel's thingspeak WRITE API key
String ssid="Nahu55"; // Wi� network SSID
String password ="123456789"; // Wi� network password
#de�ne ESP8266_BAUD 9600
ESP8266 wi�(&espSerial);
boolean DEBUG=true;
//========================================================================
showResponce
void showResponse(int waitTime){
long t=millis();
char c;
while (t+waitTime>millis()){
if (espSerial.available()){
c=espSerial.read();
if (DEBUG) Serial.print(c);
}
}
}
//========================================================================
boolean thingSpeakWrite(�oat value1, �oat value2,�oat value3){
String cmd = "AT+CIPSTART=\"TCP\",\""; // TCP connection
cmd += "184.106.153.149"; // api.thingspeak.com

Page 24/47
cmd += "\",80";
espSerial.println(cmd);
if (DEBUG) Serial.println(cmd);
if(espSerial.�nd("Error")){
if (DEBUG) Serial.println("AT+CIPSTART error");
return false;
}
String getStr = "GET /update?api_key="; // prepare GET string
getStr += apiKey;
getStr +="&�eld1=";
getStr += String(value1);
getStr +="&�eld2=";
getStr += String(value2);
getStr +="&�eld3=";
getStr += String(value3);
// ...
getStr += "\r\n\r\n\r\n";
// send data length
cmd = "AT+CIPSEND=";
cmd += String(getStr.length());
espSerial.println(cmd);
if (DEBUG) Serial.println(cmd);
delay(100);
if(espSerial.�nd(">")){

Page 25/47
espSerial.print(getStr);
if (DEBUG) Serial.print(getStr);
}
else{
espSerial.println("AT+CIPCLOSE");
// alert user
if (DEBUG) Serial.println("AT+CIPCLOSE");
return false;
}
return true;
}
//================================================================================setup
void setup() {
DEBUG=true; // enable debug serial
Serial.begin(9600);
radio.begin();
radio.openReadingPipe(0, address);
radio.setPALevel(RF24_PA_MIN);
radio.startListening();
//pinMode(Temp_pin, INPUT);
pinMode(pinDHT11, INPUT);
//pinMode(Relay_Pin, OUTPUT);
espSerial.begin(9600); // enable software serial
// Your esp8266 module's speed is probably at 115200.
Page 26/47
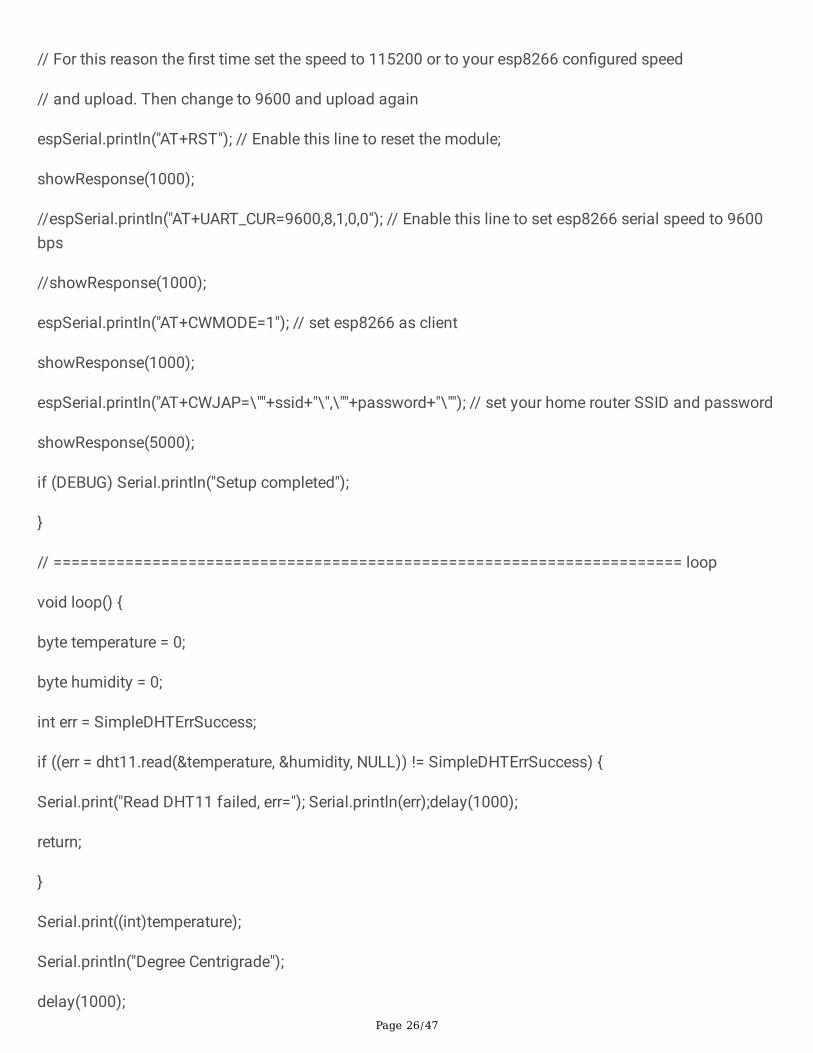
// For this reason the �rst time set the speed to 115200 or to your esp8266 con�gured speed
// and upload. Then change to 9600 and upload again
espSerial.println("AT+RST"); // Enable this line to reset the module;
showResponse(1000);
//espSerial.println("AT+UART_CUR=9600,8,1,0,0"); // Enable this line to set esp8266 serial speed to 9600bps
//showResponse(1000);
espSerial.println("AT+CWMODE=1"); // set esp8266 as client
showResponse(1000);
espSerial.println("AT+CWJAP=\""+ssid+"\",\""+password+"\""); // set your home router SSID and password
showResponse(5000);
if (DEBUG) Serial.println("Setup completed");
}
// ====================================================================== loop
void loop() {
byte temperature = 0;
byte humidity = 0;
int err = SimpleDHTErrSuccess;
if ((err = dht11.read(&temperature, &humidity, NULL)) != SimpleDHTErrSuccess) {
Serial.print("Read DHT11 failed, err="); Serial.println(err);delay(1000);
return;
}
Serial.print((int)temperature);
Serial.println("Degree Centrigrade");
delay(1000);
Page 27/47
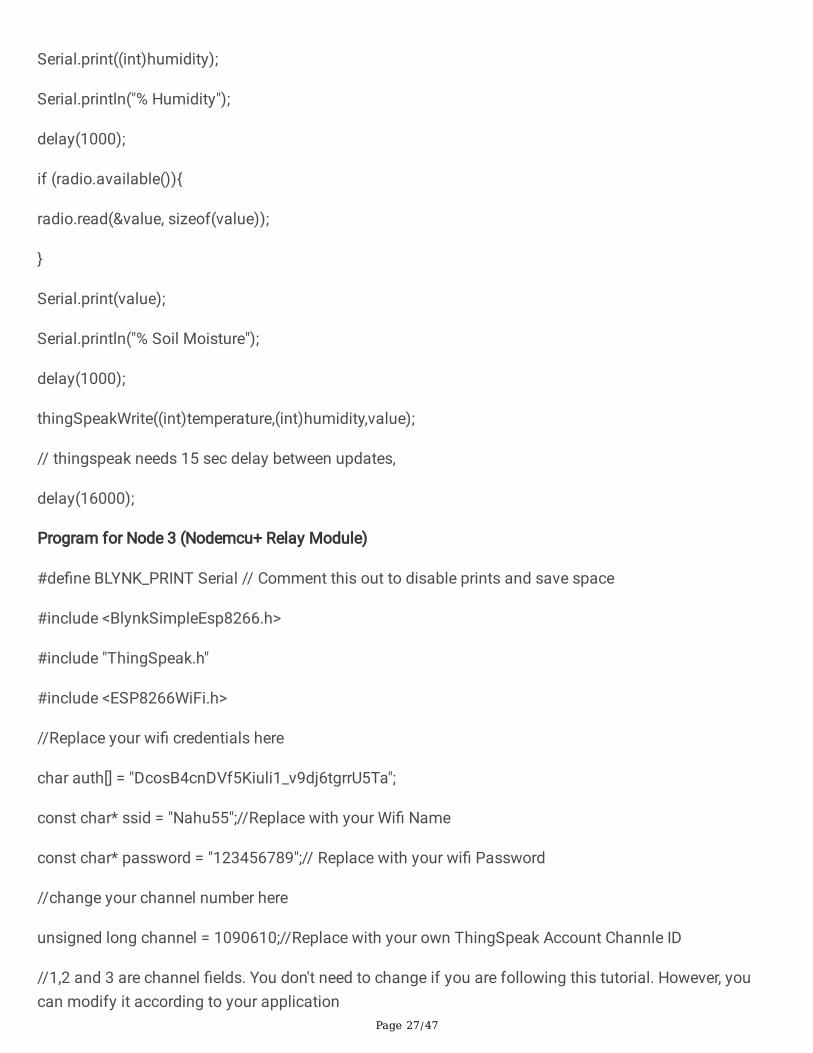
Serial.print((int)humidity);
Serial.println("% Humidity");
delay(1000);
if (radio.available()){
radio.read(&value, sizeof(value));
}
Serial.print(value);
Serial.println("% Soil Moisture");
delay(1000);
thingSpeakWrite((int)temperature,(int)humidity,value);
// thingspeak needs 15 sec delay between updates,
delay(16000);
Program for Node 3 (Nodemcu+ Relay Module)
#de�ne BLYNK_PRINT Serial // Comment this out to disable prints and save space
#include <BlynkSimpleEsp8266.h>
#include "ThingSpeak.h"
#include <ESP8266WiFi.h>
//Replace your wi� credentials here
char auth[] = "DcosB4cnDVf5Kiuli1_v9dj6tgrrU5Ta";
const char* ssid = "Nahu55";//Replace with your Wi� Name
const char* password = "123456789";// Replace with your wi� Password
//change your channel number here
unsigned long channel = 1090610;//Replace with your own ThingSpeak Account Channle ID
//1,2 and 3 are channel �elds. You don't need to change if you are following this tutorial. However, youcan modify it according to your application

Page 28/47
unsigned int Temperature = 1;
unsigned int Humidity = 2;
unsigned int Soil = 3;
unsigned int Relay = 4;
WiFiClient client;
void setup() {
Serial.begin(9600);
delay(100);
pinMode(D8, OUTPUT);
//digitalWrite(D0, 0);
Blynk.begin(auth, ssid, password);
// We start by connecting to a WiFi network
Serial.println();
Serial.println();
Serial.print("Connecting to ");
Serial.println(ssid);
WiFi.begin(ssid, password);
while (WiFi.status() != WL_CONNECTED) {
delay(500);
Serial.print(".");
}
Serial.println("");
Serial.println("WiFi connected");
Serial.println("IP address: ");

Page 29/47
Serial.println(WiFi.localIP());
Serial.print("Netmask: ");
Serial.println(WiFi.subnetMask());
Serial.print("Gateway: ");
Serial.println(WiFi.gatewayIP());
ThingSpeak.begin(client);
}
void loop() {
//get the last data of the �elds
int Temperature_1 = ThingSpeak.readFloatField(channel, Temperature);
int Humidity_2 = ThingSpeak.readFloatField(channel, Humidity);
int Soil_3 = ThingSpeak.readFloatField(channel, Soil);
int Relay_4 = ThingSpeak.readFloatField(channel, Relay);
if(Soil_3 <= 60){
digitalWrite(D8, 1);
Serial.println("Motor Is On");
}
else if(Soil_3 >= 90){
digitalWrite(D8, 0);
Serial.println("Motor is Off");
}
Serial.println ("Temperature:");
Serial.println(Temperature_1);
Serial.println("Humidity:");

Page 30/47
Serial.println(Humidity_2);
Serial.println ("Soil Moisture Percentage");
Serial.println(Soil_3);
Serial.println("Relay situation");
Serial.println(Relay_4);
delay(2000);
Blynk.virtualWrite(V1, Temperature_1);
Blynk.virtualWrite(V2, Humidity_2);
Blynk.virtualWrite(V3, Soil_3);
Blynk.run();
4. Author’s Contribution:
In this Paper, The �rst Author, Mohammad Shamiur Rahman Al Nahian did the main things of the project.All the wiring, coding, testing, ,circuit desiging and �nally data collection all the job have been done byhim. The second Author, Arnab Piush Biswas works as research assistant with the �rst author. Duringdata collection there was some problem and also having some coding problem, there the second authorhad some contribution. During circuit designing the second author had some electrical issue solved.
5. Acknowledgement:
All the praises and the supreme thanks belong to Allah, “Lord of All the Worlds, Most Bene�cent and Ever-Merciful”.
The authors wish to express their sincerest appreciation and heartiest gratitude to their supervisor, Prof.Dr. Md. Rokunuzzaman, for his valuable advice, guidance and assistance during the completion of thisthesis. Without his advice and support, it would not be possible for us to prepare this report. We wish tothank some senior brothers and sisters of our department who helped us in preparing the report. We alsowant to mention some of our classmates who also have contributions to our report. In preparing of thisreport, we have got help from others as they wished to remain anonymous. We owe them with allgratitude.
Authors also like to thank the head of the department Prof. Dr. Mhia Md Zaglul Shahadat
and honorable professors of the Department for their valuable suggestion. We would be thankful if thisreport comes to any bene�t of our teacher as well as any other students of our department.

Page 31/47
References1. Goap, Amarendra, Sharma, Deepak, Shukla, A. K., Rama Krishna, C., “An IoT based smart irrigation
management system using Machine learning and open source technologies”, Computers andElectronics in Agriculture, vol.155, pp. 41-49, September, 2018
2. Nawandar, Neha K., Satpute, Vishal R., “IoT based low cost and intelligent module for smart irrigationsystem”, Computers and Electronics in Agriculture, vol.162, pp. 979-990, May, 2019.
3. Karimi, Navab Arabhosseini, Akbar Karimi, Mortaza Kianmehr, Mohammad Hossein., “Web-basedmonitoring system using Wireless Sensor Networks for traditional vineyards and grape dryingbuildings”, Computers and Electronics in Agriculture, vol.144, pp. 269-283, September, 2016
4. Moreno-Moreno, Carlos D. Brox-Jiménez, María Gersnoviez-Milla, Andrés A. Márquez-Moyano,Mariano Ortiz-López, Manuel A. Quiles-Latorre, Francisco J., “Wireless Sensor Network forSustainable Agriculture”, Proceedings, vol.2, pp. 1302, 2018
5. Difallah, Wafa Benahmed, Khelifa Draoui, Belkacem Bounaama, Fateh., “Implementing wirelesssensor networks for smart irrigation”, Taiwan Water Conservancy, vol.65, pp. 44-54, 2018
�. A Di Nisio, T. Di Noia, C. Guamieri Calo Carducci, M Spardavecchia., “Design of a Low CostMultipurpose Wireless Sensor Network”
7. Zulki�i, C. Z. Noor, N. N., “Wireless sensor network and internet of things (IoT) solution in agriculture”,Pertanika Journal of Science and Technology, vol.25, pp. 91-100, 2018
�. Roy, Priyo Nath Armin, Maniza Kamruzzaman, S. M. Hoque, Md Emdadul., “A Supervisory Control ofHome Appliances using Internet of Things”, 2nd International Conference on Electrical, Computer andCommunication Engineering, ECCE, 2019
9. Ahmed, Hanady S. Ali, Abduladheem Abdulkareem., “Smart intensive care unit desgin based onwireless sensor network and internet of things”, Al-Sadiq International Conference onMultidisciplinary in IT and Communication Techniques Science and Applications, AIC-MITCSA 2016,pp. 41-49,2018
10. Kiani, Farzad Seyyedabbasi, Amir., “Wireless sensor network and Internet of Things in precisionagriculture”, International Journal of Advanced Computer Science and Applications, vol.9, pp. 99-103,2018
11. Sureephong, Pradorn Wiangnak, Patcharapong Wicha, Santichai., “The comparison of soil sensorsfor integrated creation of IOT-based Wetting front detector (WFD) with an e�cient irrigation systemto support precision farming”, 2nd Joint International Conference on Digital Arts, Media andTechnology 2017: Digital Economy for Sustainable Growth, ICDAMT 2017, pp. 132-135,2017
12. Zhang, Peng Zhang, Qian Liu, Fusheng Li, Junqing Cao, Ning
13. Song, Changqing., “The Construction of the Integration of Water and Fertilizer Smart Water SavingIrrigation System Based on Big Data”, Proceedings - 2017 IEEE International Conference onComputational Science and Engineering and IEEE/IFIP International Conference on Embedded andUbiquitous Computing, CSE and EUC 2017, vol.2, pp. 392-397, 2017

Page 32/47
14. Wang, Jiamin Wang, MIlin Zheng, Kai Huang, Xin., “Model Checking nRF24L01-Based Internet ofThings Systems”, Proceedings - 9th International Conference on Information Technology in Medicineand Education, ITME 2018, pp. 867-871, 2018
15. Wang, Yanping Chi, Zongtao., “System of wireless temperature and humidity monitoring based onArduino Uno platform”, Proceedings - 2016 6th International Conference on Instrumentation andMeasurement, Computer, Communication and Control, IMCCC 2016,pp. 770-773, 2016
1�. Raut, R. Varma, H. Mulla, C. Pawar, Vijaya Rahul., “Soil Monitoring, Fertigation, and Irrigation SystemUsing IoT for Agricultural Application”, Lecture Notes in Networks and Systems, vol.19, pp. 67-73,2018
17. Zotarelli, Lincoln, Dukes, Michael D., Paranhos, Marcelo, “Minimum Number of Soil Moisture Sensorsfor Monitoring and Irrigation Purposes”, Edis, vol.2013, pp. 2-5, 2013.
Figures

Page 33/47
Figure 1
Proposed Model

Page 34/47
Figure 2
Working System

Page 35/47
Figure 3
Mobile App (Blynk).

Page 36/47
Figure 4
Thingspeak Cloud Server.

Page 37/47
Figure 5
System Architecture

Page 38/47
Figure 6
Experimental Setup
Figure 7
Sensing system Capacitive Soil Moisture Sensor.

Page 39/47
Figure 8
Circuit diagram of Node 1(Arduino+ nrf24L01+ Soil Moisture Sensor)
Figure 9
Circuit Diagram of Node 2(NRF24L01+ Arduino Uno+ DHT11+ ESP8266)

Page 40/47
Figure 10
Circuit Diagram of Node 3(Nodemcu+ Relay Module)

Page 41/47
Figure 11
Flow Chart of the System

Page 42/47
Figure 12
Collected Data.
Figure 13
Graph of the indoor and outdoor position on the basis 0f over 5000 data

Page 43/47
Figure 14
Graph of the data of Table 4.1
Figure 15
Graph of the data of Table 4.2

Page 44/47
Figure 16
Graph of the data of Table 4.3
Figure 17
Graph of the data of Table 4.4

Page 45/47
Figure 18
Graph of the data of Table 4.5
Figure 19
Graph of the data of table 4.6
Figure 20
Graph of the data of Table 4.7

Page 46/47
Figure 21
Graph of the data of Table 4.8
Figure 22
Graph of the data of Table 4.9

Page 47/47
Figure 23
Graph of the data of Table 4.10