system for comparing images allison deal april 27, 2004
TRANSCRIPT

System for Comparing Images
Allison DealApril 27, 2004

Problem The human eye can determine
similarities among images easily, but they cannot do this for large numbers of pictures.
Humans can miss subtle patterns among images.
It can be hard to find trends among images without looking through most or all of them.

Specific Problem Analyze Chinese art images from
three different time periods and 23 different artists.
Find similarities among artists paintings, color choices, and styles.
Uncover any hidden structures in the paintings, that only the computer can find.
Goal
Design a system that uses automated computations to compare images.
This system can be put to use by people interested in learning about artists’ painting styles.

Overview
Create models for each picture. Compute the distances between
all pairs of pictures. Use Multi-Dimensional Scaling for visualization purposes.
Analyze the data.
Mixture Models for Colors
Use K-means to determine the main colors of each image. Algorithm converges once distances
are within a certain small threshold. (1.0e-4)
Each pixel of the image is assigned to a specific cluster based on its color similarity.

Mixture Models for Colors Determine the background color and
remove it from the analysis because it does not provide useful information.
Use K-means results to compute mean and covariance vectors and weights for each cluster of each picture.
f(x) = N i=1 ai (x | i , i)

Mixture Models for Colors
The EM algorithm would have been more accurate in this context because of its accuracy, but K-means is faster for computational purposes.
Mixture Models for Colors
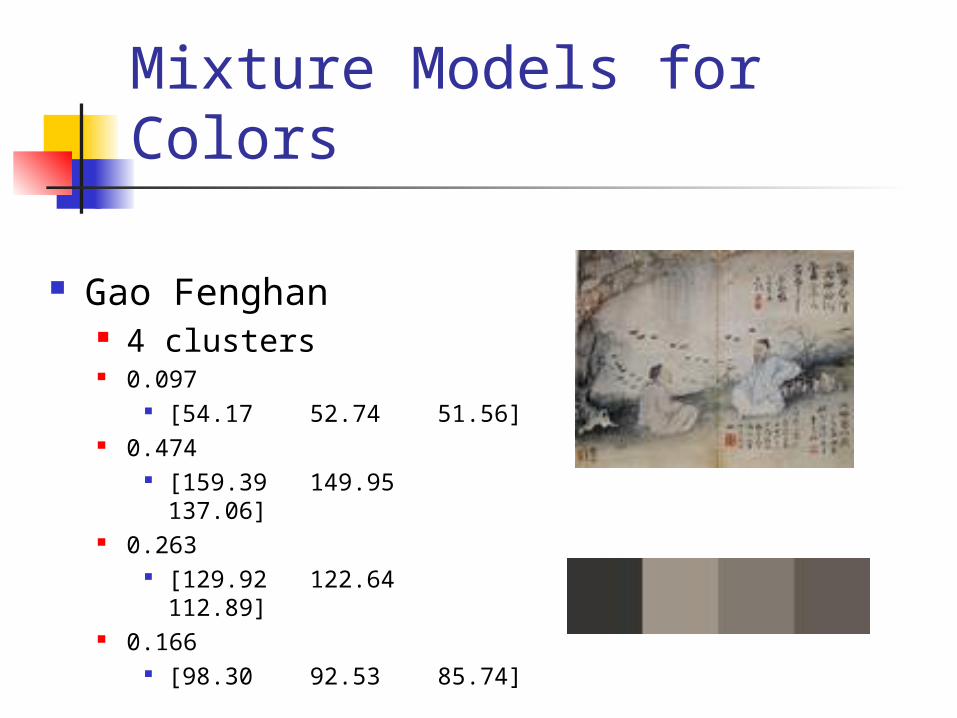
Gao Fenghan 4 clusters 0.097
[54.17 52.74 51.56] 0.474
[159.39 149.95 137.06] 0.263
[129.92 122.64 112.89] 0.166
[98.30 92.53 85.74]

Mixture Models for Colors
Chen Hongshou 2 clusters 0.295
[106.37 82.09 45.32] 0.705
[138.05 109.24 59.16]
Mixture Models for Colors
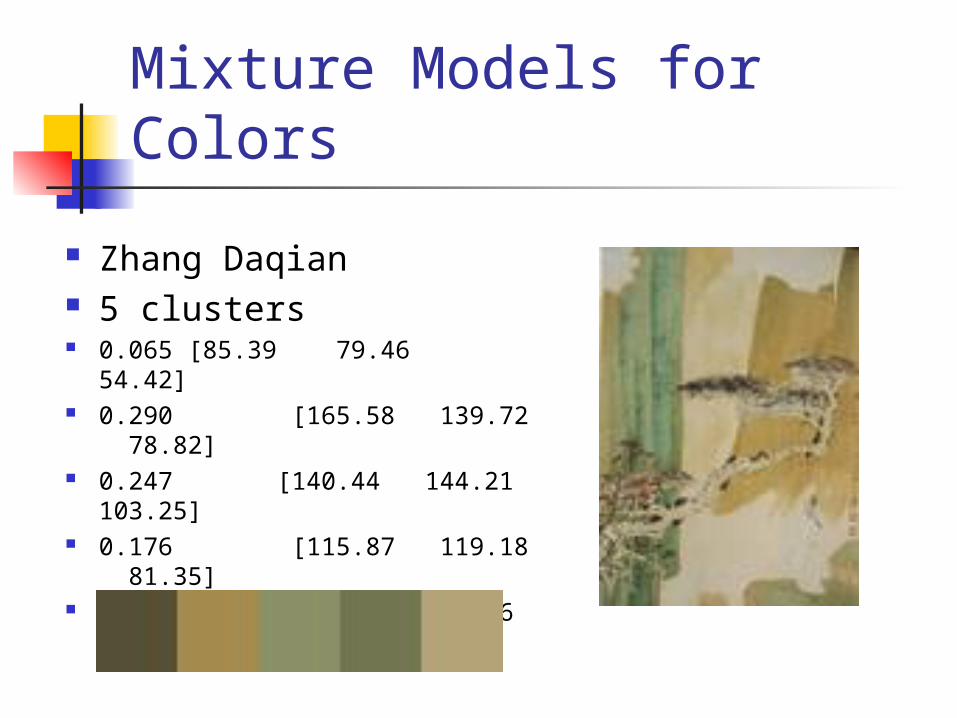
Zhang Daqian 5 clusters 0.065 [85.39 79.46 54.42] 0.290 [165.58 139.72
78.82] 0.247 [140.44 144.21
103.25] 0.176 [115.87 119.18
81.35] 0.222 [181.11 164.36
120.64]
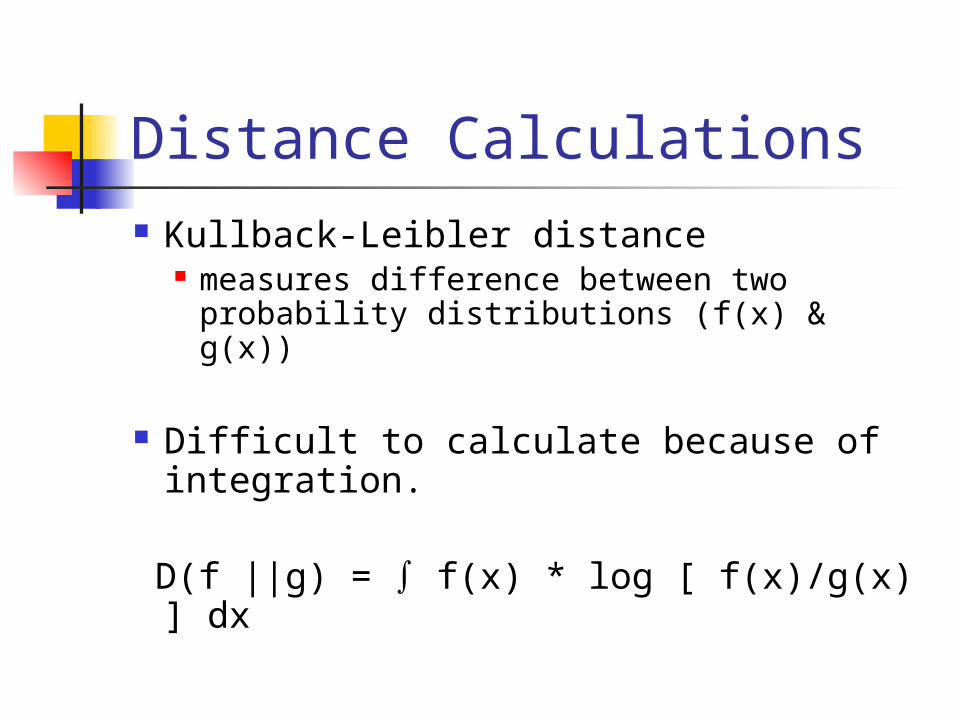
Distance Calculations Kullback-Leibler distance
measures difference between two probability distributions (f(x) & g(x))
Difficult to calculate because of integration.
D(f ||g) = f(x) * log [ f(x)/g(x) ] dx

Distance Calculations Use Monte-Carlo Method instead
generate random samples from a distribution defined by f(x), g(x)
Use altered calculation of Kullback-Leibler Distance.
D(f ||g) 1/n * log [ f(xj)/ g(xj) ]
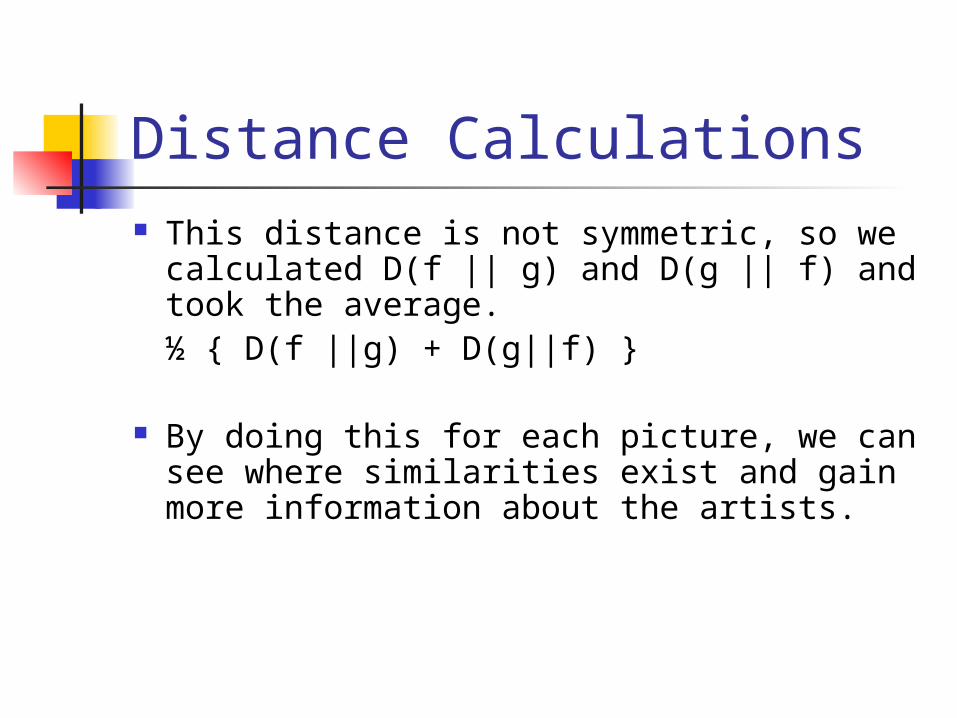
Distance Calculations This distance is not symmetric, so we
calculated D(f || g) and D(g || f) and took the average.
½ { D(f ||g) + D(g||f) }
By doing this for each picture, we can see where similarities exist and gain more information about the artists.

Multi-Dimensional Scaling
To visualize the result, we can use Multi-Dimensional Scaling and embed the information into a vector space.
Dr. Li is working more on this part of our project.
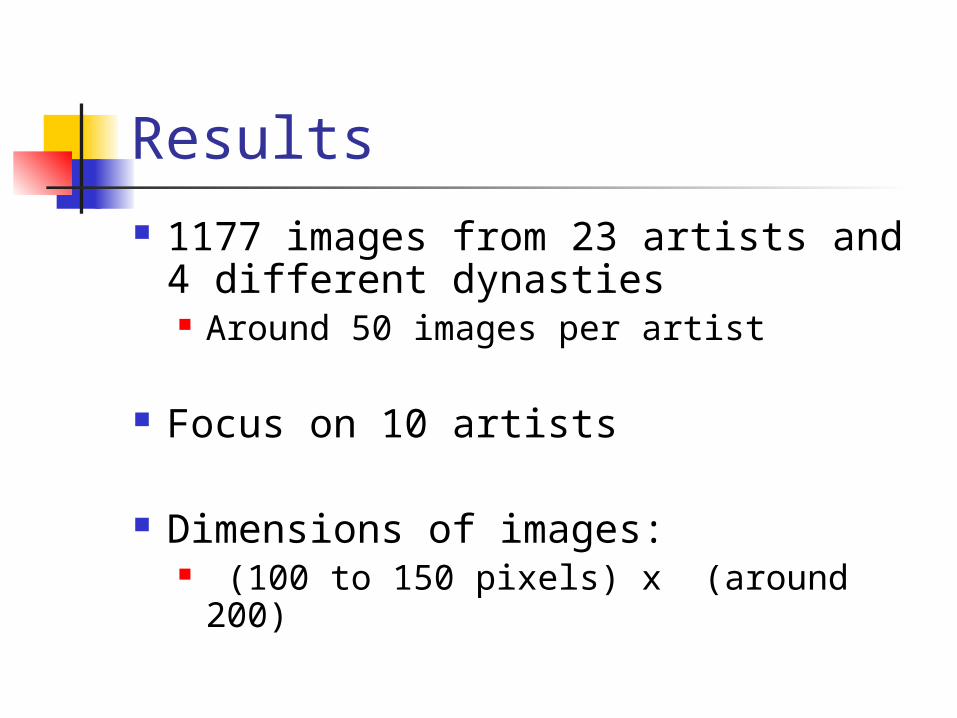
Results 1177 images from 23 artists and 4
different dynasties Around 50 images per artist
Focus on 10 artists
Dimensions of images: (100 to 150 pixels) x (around 200)

Results(1) Jin Nong: two-16, three-15, four-11, five-3(2) Shen Zhou: three-20, four-18, five-8(3) Gao Fenghan: two-2, three-8, four-23, five-10, six-4(4) Chen Hongshou:one-1, two-17, three-20, four-6, five-2(5) Qi Baishi: two-2, three-19, four-14, five-15, six-10, seven-2, eight-2(6) Zhang Daqian: two-1, three-4, four-16, five-39, six-24, seven-11,
eight-1(7) Chou Ying: two-4, three-10, four-7, five-5, six-5, seven-2, eight-1,
nine-4, ten-2(8) Dong Qichang: two-4, three-23, four-15, five-3, six-1(9) Huang Shen: two-5, three-14, four-11, five-6(10) Yun Shouping: two-1, three-10, four-19, five-6, six-7, eight-1, ten-2
(# of clusters - number of pictures with this many clusters)
Results
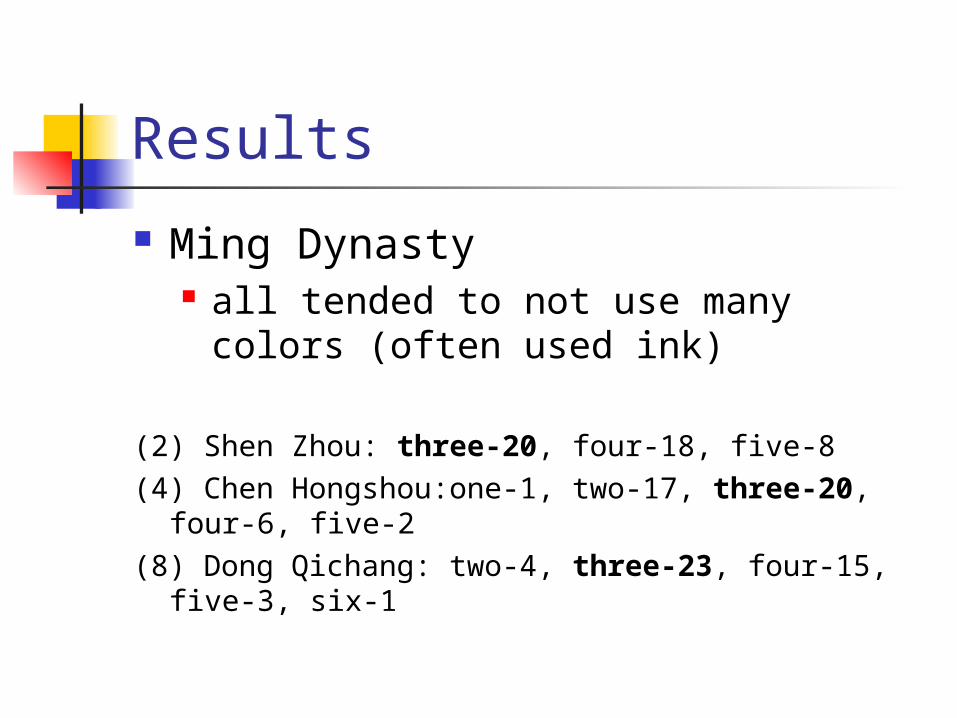
Ming Dynasty all tended to not use many colors
(often used ink)
(2) Shen Zhou: three-20, four-18, five-8(4) Chen Hongshou:one-1, two-17, three-20, four-6,
five-2(8) Dong Qichang: two-4, three-23, four-15, five-3,
six-1

Results Qing Dynasty
artists began to use more colors
(1) Jin Nong: two-16, three-15, four-11, five-3(3) Gao Fenghan: two-2, three-8, four-23, five-10,
six-4 (7) Chou Ying: two-4, three-10, four-7, five-5, six-
5, seven-2, eight-1, nine-4, ten-2(9) Huang Shen: two-5, three-14, four-11, five-6(10) Yun Shouping: two-1, three-10, four-19, five-
6, six-7, eight-1, ten-2

Results
After the Qing Dynasty more variation and more colors being
used
(5) Qi Baishi: two-2, three-19, four-14, five-15, six-10, seven-2, eight-2
(6) Zhang Daqian: two-1, three-4, four-16, five-39, six-24, seven-11, eight-1

Results
Artist Number Mean Variation (1) Jin Nong 45 3.000 0.953 (2) Shen Zhou 46 3.739 0.743 (3) Gao Fenghan 47 4.128 0.947 (4) Chen Hongshou 46 2.804 0.859 (5) Qi Baishi 64 4.406 1.388 (6) Zhang Daqian 96 5.229 1.090 (7) Chou Ying 40 4.975 2.370 (8) Dong Qichang 46 3.435 0.834 (9) Huang Shen 36 3.500 0.941 (10) Yun Shouping 45 4.522 1.656 Number= number of pictures, Mean=mean number of clusters,
Variation= variation in number of clusters
Results Zhang Daqian used the most colors, but
his variation was not that great compared to other artists.
Chou Ying had the greatest amount of variation and the second highest mean.
Many of the other artists tended not to vary much from painting to painting; they have a style and stick with it.

Summary
We can learn about artists’ styles without looking through all of their paintings by using automated computations.

Future Work
Instead of using the RGB colorspace, it might be better to use an LUV colorspace.
The LUV colorspace is easier for the human eye to perceive.