swagata dutta influência da alteração da trajectória de
TRANSCRIPT

Universidade de Aveiro
2011
Departamento de Engenharia Cerâmica e do Vidro
Swagata Dutta Influência da alteração da trajectória de deformação no comportamento mecânico do Mg
Influence of the strain path change on the mechanical behavior of Mg

Universidade de Aveiro
2011
Departamento de Engenharia Cerâmica e do Vidro
Swagata Dutta
Influência da alteração da trajectória de deformação no comportamento mecânico do Mg Influence of the strain path change on the mechanical behavior of Mg
Dissertação apresentada à Universidade de Aveiro para cumprimento dos requisitos necessários à obtenção do grau de Mestre em Ciência dos Materiais, realizada sob a orientação científica do Doutor Joaquim Manuel Vieira Professor Catedrático do Departamento de Engenharia Cerâmica e do Vidro da Universidade de Aveiro e do Doutor Augusto Luís Barros Lopes, Professor Auxiliar do Departamento de Engenharia Cerâmica e do Vidro da Universidade de Aveiro. Dissertation presented to University of Aveiro for the requirement of partial fulfillment of the Masters of Science degree in materials science under supervision of Doctor. Joaquim Manuel Vieira, Full Professor in the Department of Ceramic and Glass Engineering of the University of Aveiro and Doctor. Augusto Luís Barros Lopes, Auxiliary Professor in the Department of Ceramic and Glass Engineering of the University of Aveiro.

o júri
Presidente Arguente Orientador Co-orientador
Prof. Dr. Maria Margarida Tavares Lopes de Almeida, Professora Auxiliar da Universidade de Aveiro Prof. Dr. Manuel Fernado Gonçalves Vieira, Professor Associado da Faculdade de Engenharia da Universidade do Porto
Prof. Dr. Joaquim Manuel Vieira, Professor Catedrático da Universidade de Aveiro Prof. Dr. Augusto Luís Barros Lopes, Professor Auxiliar da Universidade de Aveiro

acknowlegments
I am very thankful to my supervisor Prof. Dr. Joaquim Manuel Vieira and co-supervisor Prof. Dr. Augusto Luis Barros Lopes for their guidance and support from the initial to the final stage which enabled me to develop an understanding of the subject and writing the thesis. I would like to extend my gratitude to Prof. Dr.-Ing. Joachim Albrecht for his time in co-supervising my work and his guidance under Erasmus Mundus in Materials Science program. I am also very grateful to Prof. Drª Gabriela Tamara Vincze for her assistance during all mechanical experiments and useful advice and helpful suggestions in processing the obtained mechanical results. The free access to granted by Prof. Dr. Abel Dias dos Santos to the Instron 4208 Universal testing machine of INEGI, University of Oporto, is grateful acknowledged I would like to thank the EMMS consortium for the unforgettable program and the European Commission for the scholarship. I would like to thank to acknowledge of RNME – Pole University of Aveiro (FCT Project RED/1509/RME/2005) for instrument use, scientific and technical assistance.

palavras-chave
Liga de magnésio AZ31, anisotropia plástica, microestrutura de deslocações, textura cristalográfica, modelo visco-plástico auto-consistente.
resumo
Neste trabalho foi investigado o efeito da alteração da trajectória de deformação no comportamento mecânico da liga de magnésio AZ31 através de ensaios sequenciais de tracção uniaxial realizados à temperatura ambiente. A pré-deformação foi realizada na direcção de laminagem inicial da chapa (RD) até um valor de deformação plástica igual a 0,07. Das amostras pré-deformadas, foram cortados provetes a 0º, 15º, 30º, 45º, 60º, 75º e 90º de RD que foram submetidos a recarga em tracção uniaxial. A influência da microestrutura de deslocações e da textura cristalográfica desenvolvidas durante a deformação plástica no comportamento do material durante a pré-deformação e a recarga foi analisada através observações por microscopia electrónica de transmissão, difracção de raios x e simulações numéricas utilizando o modelo policristalino viscoplástico auto-consistente. Os resultados obtidos mostraram que a liga AZ31 apresentava um comportamento mecânico durante a recarga fortemente anisotrópico, caracterizado por uma diminuição da tensão de escoamento com o ângulo entre as duas trajectórias de deformação. De acordo com os cálculos realizados, este comportamento está associado a uma diminuição do valor médio do factor de Taylor devido ao desenvolvimento de uma textura
cristalográfica do tipo (0001) durante a pré-deformação.

keywords
Magnesium alloy AZ31, plastic anisotropy, dislocation structure,crystallographic texture, viscoplastic self-consistente model.
abstract
In this work, the effect of the strain path change on the mechanical behavior of magnesium alloy AZ31 was investigated by sequential uniaxial tensile tests performed at room temperature. The pre-strain was carried out up to a value of 0.07 in the rolling direction (RD) of the sheet. From the pre-deformed samples, specimens at 0º, 15º, 30º, 45º, 60º, 75º and 90º from the RD were cut and reload in uniaxial tensile test. The influence of the dislocation microstructure and the crystallographic texture developed during the plastic deformation on the mechanical behavior of the material during the prestrain and reloading was analyzed by transmission electron microscopy, x-ray diffraction and numerical simulations using the polycrystalline viscoplastic self-consistent model. The results showed that the AZ31 alloy presented a strong mechanical anisotropic behavior during reloading, characterized by a decrease of the flow stress with the angle between the two deformation paths. According to the calculations, this behavior is associated with a decrease of the average Taylor
factor due to the development of a (0001) type crystallographic
texture during the pre-strain.

Influence of the strain path change on the mechanical behavior of Mg alloys 2011
i
Contents
1 Introduction ................................................................................................................................ 1
2 Literature review ........................................................................................................................ 3
2.1 Magnesium and its alloys ................................................................................................... 3
2.1.1 Wrought Mg alloys ..................................................................................................... 7
2.2 Plastic Deformation of Metals ............................................................................................ 9
2.2.1 Plastic deformation mechanisms ................................................................................ 9
2.2.2 Polycrystalline models of plastic deformation ......................................................... 14
2.2.3 Crystallographic Texture .......................................................................................... 18
2.2.4 Plastic anisotropy ..................................................................................................... 23
3 Experimental Setup and Procedures ......................................................................................... 30
3.1 Material ............................................................................................................................ 30
3.2 Mechanical Testing .......................................................................................................... 31
3.3 Microscopic Observations ................................................................................................ 33
3.3.1 Optical Microscopy (OM) ........................................................................................ 33
3.3.2 Transmission Electron Microscopy (TEM) .............................................................. 33
3.4 Crystallographic texture analysis ..................................................................................... 34
4 Results and Discusion .............................................................................................................. 36
4.1 Initial Material .................................................................................................................. 36
4.2 Material after pre-deformation ......................................................................................... 47
5 Conclusions .............................................................................................................................. 57
6 Proposals for further study ....................................................................................................... 60
Bibliography ..................................................................................................................................... 61
Appendices ....................................................................................................................................... 67

Influence of the strain path change on the mechanical behavior of Mg alloys 2011
ii
List of Tables
Table 2.1 - Some physical property exhibition of Mg, Al and Fe ...................................................... 4
Table 2.2 - Important wrought magnesium alloys and their applications .......................................... 8
Table 2.3 - Slip in Mg materials ....................................................................................................... 13
Table 3.1 - Typical composition of AZ31 alloy ............................................................................... 30
Table 4.1 - Yield stress (σo), maximum stress (σmax), uniform strain (εu), R-value, , and R of the
initial material tested in three different directions ............................................................................ 37
Table 4.2 - Normalized critical resolved shear stress (CRSS) of the slip systems used in the VPSC
calculations (Proust, 2009) ............................................................................................................... 43
Table 4.3 - Activity of the slip systems computed by VPSC code for the three analyzed directions
.......................................................................................................................................................... 47
Table 4.4 - Yield stress (σo), maximum stress (σmax), uniform strain (εu), R-value, and ΔR of the
pre-deformed material reloaded in different directions .................................................................... 48
Table 4.5 - Activity of the slip systems computed by VPSC code for samples reloaded at 0o, 15
o
and 30o. ............................................................................................................................................. 55
Table 4.6 - Activity of the slip systems computed by VPSC code for samples reloaded at 45o and
60o. ................................................................................................................................................... 55
Table 4.7 - Activity of the slip systems computed by VPSC code for samples reloaded at 75o and
90o. ................................................................................................................................................... 56

Influence of the strain path change on the mechanical behavior of Mg alloys 2011
iii
List of Figures
Figure 2.1 - Mg-Al phase diagram .................................................................................................... 4
Figure 2.2 - Classification of Mg alloys ............................................................................................. 5
Figure 2.3 - Component requirement of vehicles .............................................................................. 6
Figure 2.4 -The relation between the fuel consumption and vehicle mass of automobiles ................ 6
Figure 2.5 - Principal fields of magnesium application ..................................................................... 7
Figure 2.6 - Slip in a single crystal ..................................................................................................... 9
Figure 2.7 - Mechanical twinning and crystal deformation ............................................................. 10
Figure 2.8 - TEM dislocation microstructure of a) one and b) two families of parallel dislocation
walls, c) equiaxial dislocation cells ................................................................................................. 11
Figure 2.9 - Slip systems in HCP materials ..................................................................................... 13
Figure 2.10 - Tensile and compression twinning ............................................................................ 14
Figure 2.11 - Taylor model prediction of the deformed grain [Schematic] a) Initial Condition, b)
after deformation .............................................................................................................................. 16
Figure 2.12 - Definition of crystal axis (a, b, c) and macroscopic specimen axis (X, Y, Z) ............ 18
Figure 2.13 - Euler’s angle definition of Bunge showing the rotation sequence from a) to d) ........ 19
Figure 2.14 - Crystallographic texture representation in Euler’s space a) three-dimensional
representation; b) two-dimensional representation of sections with constant values of υ2 .............. 20
Figure 2.15 - Simulated rolling texture in HCP metals with c/a ratio: (a) approximately equal to
1.633; (b) >1.633; and (c) <1.633 .................................................................................................... 21
Figure 2.16 - Some important ideal pole figures of HCP metals .................................................... 22
Figure 2.17 - Pole figures: (a) (0 0 0 2) and (b) (1 0 1 0) of the as-rolledmaterial, and (0 0 0 2) of
the material (c) compressed to 6% along the RD and (d) tensioned to 6% along the ND .............. 23
Figure 2.18 - Definition of Strain Direction ..................................................................................... 24
Figure 2.19 - Forming limit Diagram: A pure shear, B uniaxial tension, C plain strain, D stretch
forming, E equibiaxial strain ............................................................................................................ 25

Influence of the strain path change on the mechanical behavior of Mg alloys 2011
iv
Figure 2.20 - Flow curves during tensile test at different orientations from extruded direction of
Mg bar .............................................................................................................................................. 26
Figure 2.21 - Stress - Strain curve showing the consequences of reloading after a pre-deformation
comparing with the initial monotonic test ........................................................................................ 27
Figure 2.22 - Effect of pre-deformation value on the homogeneous plastic deformation in mild steel
deformed in second orthogonal trajectories ..................................................................................... 28
Figure 3.1 - AZ31 alloy used for pre-straining ................................................................................ 31
Figure 3.2 - Uniaxial Tensile Specimens( ASTM 10 mm width samples) ...................................... 32
Figure 3.3 - Sample orientations with respect to the different directions ........................................ 32
Figure 3.4 - Shimadzu Autograph machine, Mechanical Engineering Department, Univ. of Aveiro
.......................................................................................................................................................... 33
Figure 3.5 - Texture measurement using Philips X’ pert diffractometer equipped with texture
goniometer........................................................................................................................................ 34
Figure 4.1 - Tensile true stress - true Strain curves of the as-received AZ31 alloy tested at 0o, 45
o
and 90o from RD .............................................................................................................................. 36
Figure 4.2 - Microstructural observations by optical microscopy of the material after tensile test up
to a strain value ε 0.14 at (a) 0o, (b) 45
o, (c) 90
o. ......................................................................... 38
Figure 4.3 - TEM image of the as-received material ....................................................................... 39
Figure 4.4 - TEM image of the typical dislocation microstructure developed in the AZ31 after
tensile test up to maximum uniform strain. ...................................................................................... 40
Figure 4.5 - Experimental (a) {0001}, pole figures for the as-received material. RD - rolling
direction, TD - transverse direction. ................................................................................................. 41
Figure 4.6 - Experimental (a) {0001}, pole figures for the material after tensile test up to the
maximum uniform strain at 0o. RD - rolling direction, TA - tensile axis, TD – transverse direction.
.......................................................................................................................................................... 41
Figure 4.7 - Experimental (a) {0001}, pole figures for the material after tensile test up to the
maximum uniform strain at 45o. RD - rolling direction, TA - tensile axis. ...................................... 42
Figure 4.8 - Experimental (a) {0001}, pole figures for the material after tensile test up to the
maximum uniform strain at 90o. RD - rolling direction, TA - tensile axis. ...................................... 42

Influence of the strain path change on the mechanical behavior of Mg alloys 2011
v
Figure 4.9 - Simulated (using VPSC code) (a) {0001}, pole figures for the material after
tensile test up to the maximum uniform strain at 0o. RD - rolling direction, TA - tensile axis, TD –
transverse direction. ......................................................................................................................... 44
Figure 4.10 - Simulated (using VPSC code) (a) {0001}, pole figures for the material after
tensile test up to the maximum uniform strain at 0o. RD - rolling direction, TA - tensile axis. ....... 44
Figure 4.11 - Simulated (using VPSC code) (a) {0001}, pole figures for the material after
tensile test up to the maximum uniform strain at 0o. RD - rolling direction, TA - tensile axis. ....... 45
Figure 4.12 - Taylor factor - strain curves predicted by the VPSC model for initial material
deformed in tensile test in three different test directions. ................................................................ 45
Figure 4.13 - Tensile true stress (σ) - true strain (ε) curves at 0o, 15
o, 30
o, 45
o, 60
o, 75
o and 90
o of
AZ31 after pre-deformation up to 0.07. The curve for as-received material is also presented. ....... 48
Figure 4.14 - Evolution of α parameter with the reloading angle for (a) isotropic (R =1) and (b)
anisotropic (R = 2.2) material deformed in tensile-tensile test. ....................................................... 49
Figure 4.15 - TEM image of the typical dislocation microstructure developed in the AZ31 after
reloading up to maximum uniform strain. ........................................................................................ 50
Figure 4.16 - Experimental (a) {0001}, pole figures for the material after reloading at 0o. RD -
rolling direction, TA1 - tensile axis for the 1st path, TA – Tensile axis for the 2
nd path TD –
transverse direction. ......................................................................................................................... 51
Figure 4.17 - Experimental (a) {0001}, pole figures for the material after reloading at 45o.
TA1 - tensile axis for the 1st path, TA2 – Tensile axis for the 2
nd path TD. ...................................... 52
Figure 4.18 - Experimental (a) {0001}, pole for the material after reloading at 90o. RD -
rolling direction, TA - tensile axis, TD – transverse direction. ........................................................ 52
Figure 4.19 – Simulated (using VPSC) (a) {0001}, pole figures for the material after
reloading at 0o. TA1 - tensile axis for the 1
st path, TA – Tensile axis for the 2
nd path TD – transverse
direction............................................................................................................................................ 53
Figure 4.20 - Simulated (a) {0001}, pole figures for the material after reloading at 45o. TA1 -
tensile axis for the 1st path, TA2 – Tensile axis for the 2
nd path TD. ................................................ 53
Figure 4.21 - Simulated (a) {0001}, pole for the material after reloading at 90o. RD - rolling
direction, TA - tensile axis, TD – transverse direction. ................................................................... 54
Figure 4.22 - The <M> - εeq curves after reloading at different test directions predicted by the
VPSC model in the strain imposed condition .................................................................................. 54

Influence of the strain path change on the mechanical behavior of Mg alloys 2011
vi
Symbols and Abbreviations
b - Burger Vector;
E – Average strain (self-consistent model);
l, l0 – Final and initial length;
LH - Hill’s constraint tensor;
m – Schimd’s factor;
<M> - Average Taylor factor;
R – Anisotropic Coefficient/ Lankford Parameter;
& ΔR – Normal anisotropic coefficient & planar anisotropic coefficient;
t, t0 – Final and initial thickness;
w, w0 – Final and initial width;
Wint – Internal plastic work;
α – Parameter characterizing the change in the strain path amplitude;
α´ – Average interaction intensity between dislocations;
γ – Shear strain;
ε – True strain;
ε11 – True strain in length direction;
ε22 – True strain in width direction;
ε33 – True strain in thickness direction;
εp – Tensor of prestrain;
εr – Tensor of reloading;
– Reciprocal strain rate sensitivity coefficient;
– Reloading angle;
–Angle between directions of applied stress and slip direction;
– Shear modulus;
– Dislocation density;

Influence of the strain path change on the mechanical behavior of Mg alloys 2011
vii
σ – True stress;
σo – Yield stress;
σmax – Maximum stress;
– Average stress (self-consistent model);
τo – Friction stress for dislocation movement;
c – Critical resolved shear stress;
τs – Magnitude of shear stress in the slip systems;
– Angle between directions of applied stress and normal to the slip plane;
ϕ1,Φ, ϕ2– Euler’s angles (definition of Bunge);
ASTM – American Society for Testing and Materials;
CRSS – Critically resolved shear stress;
HB – Brinell hardness;
HCP – Hexagonal closed packed;
ND – Normal direction;
RD – Rolling direction;
SEM – Scanning electron microscopy;
TA – Tensile axis ;
TD – Transverse direction ;
TEM – Trasmission electron microscopy ;
VPSC – Visco-plastic self-consistent model

Influence of the strain path change on the mechanical behavior of Mg alloys 2011
1
1 Introduction
Lightweight materials have an increased importance in many industrial technologies,
ranging from automobile, aerospace, building, sports and medical devices. Due to its good
properties, such as low density and high specific strength, magnesium alloys are in the last
years emerging as a strong candidate to replace other heavier materials like, for example,
steel and even aluminium.
Most of the industrial metals forming processes involve a complex deformation history,
during which the material is subjected to successive strain paths that may vary
considerably in their orientation. These changes in strain path have a relevant effect on the
mechanical behavior of metals. Macroscopically the effect of a prestrain becomes
manifested by a change of work hardening rate as, for example, an increased reloading
yield stress, temporary hardening and/or softening that can lead to premature failure. For
that, investigation on the effect of change of strain path on the mechanical behavior of the
Mg alloys is of vital importance.
The plastic deformation and mechanical behavior of Mg and its alloys are found to be
dependent on various factors i.e. the orientation of the grains (crystallographic texture), the
deformation conditions (i.e. the temperature, strain rate, strain path) (Mohd Ruzi, 2009).
However, previous studies on wrought Mg alloys were concentrated on the effect of
temperature and strain rate upon the mechanical behavior (Mohd Ruzi, 2009). On the other
hand, research on the effect of change of strain path on the mechanical behavior of material
was found to be less investigated.
Hence, the present study aims at to the determination of the influence of change of strain
path on the mechanical behavior at room temperature of a Mg alloy. The evolution of
dislocation structure and the crystallographic texture and its contribution to the observed
behavior was also under concern.
The present thesis is organized in the following way:
In the chapter 2 a bibliographic review is presented, where the main properties and
applications of magnesium alloys are given to. This chapter also covers the main aspects of

Influence of the strain path change on the mechanical behavior of Mg alloys 2011
2
plastic deformation, crystal texture and their influence on the mechanical properties of
metals.
Chapter 3 describes the initial material, experimental work and used techniques for the
material characterization.
The chapter 4 describes the results and their discussion.
The conclusions and proposals for future work are presented in short chapters 5 and 6,
respectively.

Influence of the strain path change on the mechanical behavior of Mg alloys 2011
3
2 Literature review
2.1 Magnesium and its alloys
Magnesium is the seventh most abundant element in the Earth’s crust where it comprises
about 2% per mass. It is one of the lightest metals that are currently used as structural
metallic materials. During many years Mg was used mostly in its compound forms and it
was very recent undertaking to use Mg and its alloys in structural applications. Important
physical properties of Mg are compared with the properties of other structural metals in
Table 2.1. It can be seen that Mg has substantially lower density than Al and Fe. The
values of hardness and tensile strength of Mg are higher than those of Al but the ductility is
lower. The reduced ductility of Mg was (and still is) a major problem that limited the
industrial applications of this metal and its alloys. Indeed, it is well known that
polycrystalline pure Mg and Mg alloys exhibit low ductility and formability at room
temperature. This behavior is due to hexagonal closed packed structure of this material and
the limited number of operative slip systems at room temperature (Choi S. D., 2009)
(Wang Y. H., 2003) (Engler, 2010).
In most of industrial applications, the magnesium is used in alloyed form. In fact, alloying
is one of the most important way to improve strength, creep resistance, heat resistance etc.
of the material. For instance, alloying Mg with Al provides solid solution strengthening.
Contemporarily, Al is the most used alloying element in Mg and if given in amounts above
6% provides age hardening by the formation of the Mg17Al12 phase (fig. 2.1). Addition of
Zn helps to improve castability and corrosion resistance of Mg alloys.
Magnesium alloys are classified according to the way they have been processed. Cast (die
& sand) and wrought are the typical end products of different processing routes of Mg and
its alloys (fig. 2.2). Each of the processing routes has been tailored to give emphasis on an
individual property. As a result, several different alloys exhibiting different properties have
been developed over the years. The commercially most used Mg alloys include the AZ
series (Mg-Al-Zn), AM series (Mg-Al-Mn), AE series (Mg-Al-RE), EZ series (Mg-RE-Zn)
ZK series (Mg-Zn-Zr) and WE series (Mg-RE-Zr) (Cahn, 1999).

Influence of the strain path change on the mechanical behavior of Mg alloys 2011
4
Table 2.1 - Some physical property exhibited by Mg, Al and Fe (Watarai, 2005)
Metal
Specific
gravity
(g/cm3)
Melting
point (oC)
Boiling
point (oC)
Latent
heat of
melting
(J/cm3)
Specific
heat
(J/cm3.K)
Coefficient of
thermal
expansion
×106 (K-1)
Tensile
strength
(MPa)
Elongation
(%)
Hardness
HB
Mg 1.74 650 1110 640 1.84 25.5 98 5 30
Al 2.74 660 2486 1088 2.43 23.9 88 45 23
Fe 7.86 1535 2754 213 3.68 11.7 265 45 67
Figure 2.1 - Mg-Al phase diagram (Wei, 2006)

Influence of the strain path change on the mechanical behavior of Mg alloys 2011
5
Figure 2.2 - Classification of Mg alloys (Avedesian, 1999)
Mg and its alloys are mainly used in marine, electronics, aerospace and automotive
industries (Mordike, 2001). In these last industries there are several important requirements
that influence the selection of the material, such as safety, weight, mechanical properties
etc. (fig. 2.3). Global trends to produce light weight, environmentally friendly, safer and
cheaper vehicles are more of recent demand (Friedrich H. S., 2001) (Alan, 2003)
(Schumann, 2003) which has led the way to enormous prospective of Mg and its alloys.
Nowadays, the largest automobile manufacturers are trying to reduce the vehicle weight in
order to significantly decrease energy consumption (Cole, 2007) (Gerald, 2003). Since the
vehicle weight is directly related to the fuel economy as well as CO2 emission (fig. 2.4),
reducing it has been a major issue.
Influence of the strain path change on the mechanical behavior of Mg alloys 2011
6
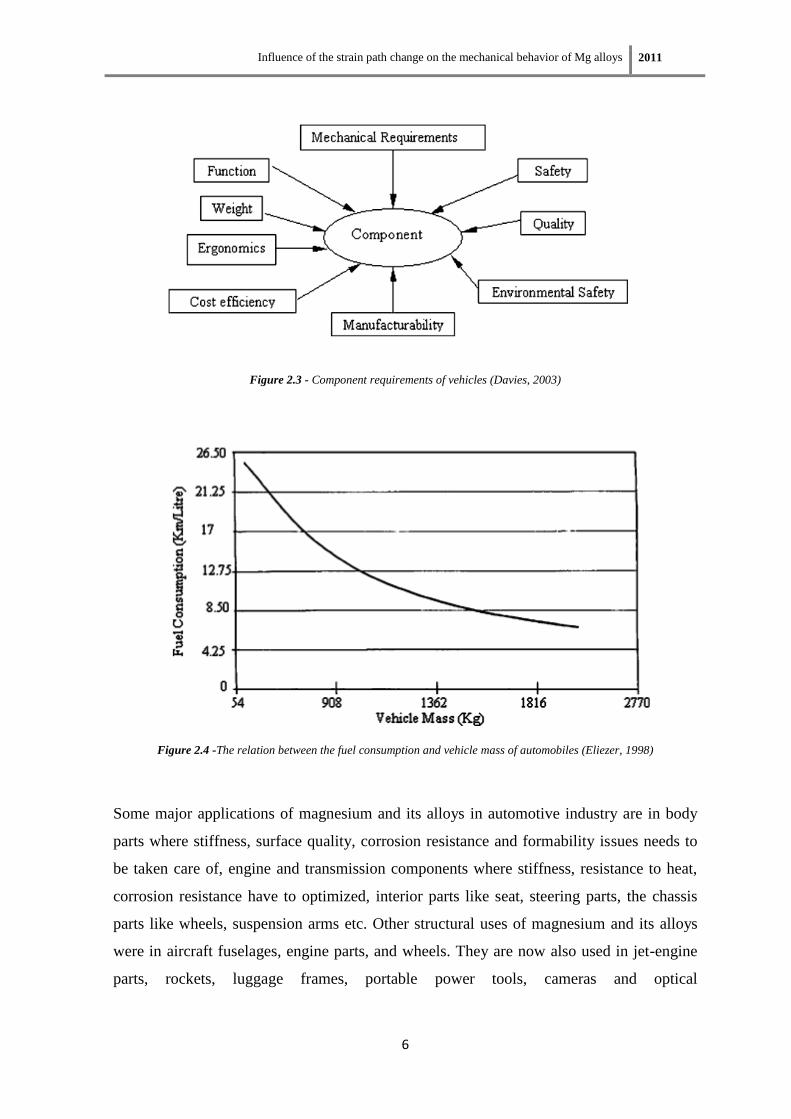
Figure 2.3 - Component requirements of vehicles (Davies, 2003)
Figure 2.4 -The relation between the fuel consumption and vehicle mass of automobiles (Eliezer, 1998)
Some major applications of magnesium and its alloys in automotive industry are in body
parts where stiffness, surface quality, corrosion resistance and formability issues needs to
be taken care of, engine and transmission components where stiffness, resistance to heat,
corrosion resistance have to optimized, interior parts like seat, steering parts, the chassis
parts like wheels, suspension arms etc. Other structural uses of magnesium and its alloys
were in aircraft fuselages, engine parts, and wheels. They are now also used in jet-engine
parts, rockets, luggage frames, portable power tools, cameras and optical

Influence of the strain path change on the mechanical behavior of Mg alloys 2011
7
instruments. Another important use of Mg alloys is in anodic protection of the corrosion of
iron and steel, as in pipelines and ship bottoms. For this purpose a magnesium plate is
connected electrically to the iron. The rapid oxidation of the magnesium prevents the
oxidation and corrosion of the iron. A pie chart for typical commercial usage of Mg is
presented below (fig. 2.5).
Figure 2.5 - Main fields of magnesium application (Friedrich H. E., 2006)
2.1.1 Wrought Mg alloys
Nowadays wrought Mg alloys are gaining remarkable technological importance. Over the
past few years the research was more intense on wrought Mg alloys than to the cast Mg
alloys.
Cast Mg products are typically known to possess structural defects, pores and segregation
which lead to their low strength, ductility and creep resistance (Lee S.-H. C.-Y., 2002).
The process of casting also leads to wastage of material. Wrought Mg alloys, on the other
hand, offers outstanding stiffness, buckling resistance as well as good dimensional stability
in sheet form (Emley, 1966) (Luo, 2007) and that is why wrought Mg alloys are finding
more importance in industrial applications. AZ31, AZ61, AZ80, ZK60, M1A, HK31,

Influence of the strain path change on the mechanical behavior of Mg alloys 2011
8
HM21, ZE41, ZC71 are the members of the wrought Mg alloy group. Among them AZ31
was the most used and investigated alloy in terms of industrial applications in recent years.
Wrought Mg alloys are mainly used as extruded bars, sections, tubes, forging and rolled
sheet with the operating temperature of about 220oC (Mohd Ruzi, 2009). This high
temperature is used in order to increase the formability of the material through the increase
in the number of slip systems available to accommodate the plastic deformation. Light
weight, good high temperature mechanical properties and excellent corrosion resistance
has led to an increasing use of wrought Mg alloys in aerospace and automotive industries
such as gearbox, intermediate compressors, generators, transmissions, engine component
etc. (Duffy, 1996). Table 2.2 summarizes some important wrought magnesium alloys and
their applications.
Table 2.2 - Important wrought magnesium alloys and their applications (Davies, 2003) (Kuo, 2006) (Friedrich, 2001)
(Pekguleryuz M. A., 2003) (Pekguleryuz M. E., 2003)

Influence of the strain path change on the mechanical behavior of Mg alloys 2011
9
2.2 Plastic Deformation of Metals
2.2.1 Plastic deformation mechanisms
The plastic deformation (i.e. the permanent deformation) of most metals at room
temperature occurs by non-diffusive mechanisms such as slip and twinning. In metals with
high stacking fault energy slip is the dominant deformation mechanism whereas in metals
with low stacking fault energy twinning plays the major role (Karaman, 2000).
Slip occurs by movement of dislocations along planes and directions with highest density
of atoms (slip planes and slip directions) by the action of an applied shear stress. For a
single crystal, the shear stress (τs) resolved in the particular slip plane in the slip direction
(defining the slip system s) is given by:
(2.1)
Where σ is the applied stress, is the angle between the applied stress (σ) directions and
normal to the slip plane, λ is the angle between the slip direction and the applied stress
direction (fig. 2.6). The product of cos(ɸs) cos (λ
s) is called the Schmid factor (m)
of the
slip system thereby leading to the following equation
(2.2)
Figure 2.6 - Slip in a single crystal (Dieter, 1988)

Influence of the strain path change on the mechanical behavior of Mg alloys 2011
10
The Schmid law states that the slip on a slip system and thereby the plastic deformation of
the single crystal will occur if the shear stress applied (τs) is equal to a critical value (τc).
i.e.
The value of τc depends on the friction stress for dislocation movement (τo) and the
dislocation density (ρ) through the equation:
τc = τo + α’µb√ (2.3)
Where α’ is the average interaction intensity between dislocations, µ is the shear modulus
and b is the magnitude of Burgers vector of the dislocations.
Twinning, on the other hand, is a unidirectional deformation mode characterized by a
reorientation of the crystal lattice while keeping the crystal structure unaltered (fig. 2.7).
The term mechanical twinning is defined by the activation of twinning during mechanical
loading. The twin planes separate the twinned region from the untwinnied one.
Figure 2.7 - Mechanical twinning and crystal deformation (Graff, 2008)

Influence of the strain path change on the mechanical behavior of Mg alloys 2011
11
2.2.1.1 Dislocation structure
During the plastic deformation dislocations are accommodated inside the grains and, after
certain amount of strain, tend to organize themselves into structures, defining dislocation
cells where their shape depends on the number of activated slip systems. Namely, when
one or two slip systems are activated one or two families of dislocation walls parallel to the
traces of the slip planes with highest activity are developed. When more than two slip
systems are preferentially activated, equiaxial cells are observed (fig. 2.8). With the
increase of the applied strain, the density of accumulated dislocations increase, the size of
dislocation cells decrease and crystallographic misorientations between neighbor cells
increase. However, the organization degree of the dislocations depends on their mobility.
Indeed, well defined intra-granular dislocation structures can be observed in materials with
low friction stress for dislocation movement (τo) i.e. with low lattice friction, low solute
and precipitate content, high stacking fault energy, easy cross-slip and climb of
dislocations. By contrast, materials with high friction stress for dislocation movement tend
to present a homogeneous distribution of dislocations and no cells are defined inside the
grains (Rauch, 2004).
Figure 2.8 - TEM dislocation microstructure of a) one and b) two families of parallel dislocation walls, c) equiaxial
dislocation cells (Lopes A. L., 2001)

Influence of the strain path change on the mechanical behavior of Mg alloys 2011
12
2.2.1.2 Plastic deformation of Mg and its alloys
Although Mg is renowned as one of the most abundant metal in the Earth it did not find
considerable usage in industry. As mentioned before, the most important reason for Mg
and its alloys to have limited industrial applications is poor formability at room
temperature. This is due to a reduced number of slip systems available to accommodate the
plastic deformation in the hexagonal closed packed (HCP) structure of Mg. At higher
temperature, additional slip systems become active providing greater freedom for the
deformation to occur.
Mg can deform both by slip and twinning. The deformation modes are the slip on basal
<a> planes ({0001}<11 >), pyramidal <a> slip ({10 }<11 >), prismatic <a> slip
({10 0}<11 >) and pyramidal <c+a> slip ({11 2}<11 >) (Proust, 2009) (table 2.3 and
fig. 2.9). At room temperature, the basal slip is the dominant deformation mechanism of
Mg (Proust, 2009) (Wang Y. H., 2003) (Choi S. D., 2009) (Choi S. E., 2007) (Al-Samman,
2008) (Barnett, 2009) (Koike, 2005). However, the activation of this slip system does not
allow the deformation of the crystal along the c-axis since it is perpendicular to this axis.
To accommodate the plastic deformation along the c-axis other crystallographic directions
(i.e. the <c+a> directions) needs to be activated. Deformation in the c-axis direction can
occur either by twinning or slip, mostly depending on the temperature (Staroselsky A. ,
2003) (Yoo, 2002). Twinning has been attributed to play the dominant role at room
temperature. At higher temperature pyramidal <c+a> slip is found to be responsible for
deformation in the c-axis direction (Staroselsky A. , 2003). In particular, for AZ31 alloys
basal slip was found to be dominant at temperatures up to 225oC. The activation of non-
basal slip systems at higher temperatures were found to be dependent on the
crystallographic texture developed during thermo-mechanical processes (Yi S. , 2005).

Influence of the strain path change on the mechanical behavior of Mg alloys 2011
13
Table 2.3 - Slip in Mg materials (Wang Y. H., 2003)
Slip type Slip plane Slip
direction
Number
of non-
parallel
planes
Slip
direction
per plane
Number of
geometrical
slip
systems
Number of
independent
slip systems
Basal {0001} <11 > 1 3 3 2
Prismatic
<a> {10 0} <11 > 3 1 3 2
Pyramidal
<a> {10 } <11 > 6 1 6 4
Pyramidal
<c+a> {11 2} <11 > 6 1 6 5
Figure 2.9 - Slip systems in HCP materials (Choi S. E., 2007)
Mg and its alloys generally offer two different kinds of twinning modes i.e. tensile
({10 }< >) and compression twinning ({10 }< >) (Choi S. E., 2007) (fig.
2.10). The deformation twins interact in a complex manner with slip changing the
mechanical behavior and texture evolution of the material. This last effect is evidenced by
the strong changes of texture promoted by the reorientation of c-axis of the grains by 86.6o
due to the activation of tensile twins (Proust, 2009).
The activation of twinning depends on the c/a ratio of the crystal lattice. When the axial
ratio (c/a) is less than 1.73 the tensile twinning can be activated by imposing a tensile
stress parallel to the c-axis (Gehrmann, 2005) (Brown, 2005) (Emley, 1966). If the tensile
stresses are parallel to the basal plane, compression twinning occurs. However, in this case,
the activation twinning requires high stress and/or favorable dislocation structures for
nucleation to occur (Barnett M. N., 2009). Twinning can contribute to primary creep

Influence of the strain path change on the mechanical behavior of Mg alloys 2011
14
(Emley, 1966) and can also be activated both in hot and cold rolled magnesium alloys.
Some studies identified twinning as the prominent deformation mode in rolled AZ31 alloys
and can also be observed after tensile test (Hartig, 2005) (Kim, 2005). The amount of shear
associated with the twinned grains is reported to be dependent on the axial ratio and the
composition of the alloy (Staroselsky A. , 2003).
Figure 2.10 - Tensile and compression twinning (Choi S. E., 2007)
2.2.2 Polycrystalline models of plastic deformation
Polycrystalline materials consist of several crystallites that are usually oriented in different
directions. As there are several grains in the polycrystalline material, mutual interactions
among the grains occur during the deformation. Thus each grain of the polycrystal cannot
deform freely as a monocrystal due to the applied stress. Mutual interaction during the
deformation of the grains leads to an additional local stresses that have to be
accommodated and to a differences between the microscopic and macroscopic imposed
strain/stress states. Different models have been proposed to correlate the mechanical
behavior of polycrystalline materials and their single crystals. Some of these models are
presented during this section.

Influence of the strain path change on the mechanical behavior of Mg alloys 2011
15
2.2.2.1 Sachs Model
The Sachs model (Sachs, 1928) presumes that the interaction stresses between neighboring
grains are null. Therefore, the model considers that, the stress imposed upon each grain is
uniform and equal to the macroscopic stress. In order to accommodate stress, deformation
will take place by activation of the slip systems with the largest Schmid factor (eqn. 2.1).
The stress applied to the crystal should attain the critical resolved shear stress (CRSS) for
deformation to occur.
The entire behavior of the polycrystal can, therefore, be represented by the weighted
average behavior of the individual crystal (Zaoui, 1990).
σ = < M-1
> (2.4)
Here, < M-1
> is the mean value of the inverse Taylor factor and is the average shear
stress acting on the crystallites.
2.2.2.2 Taylor Model
The Taylor model states that, all of the crystallites suffer the same plastic deformation that
has been macroscopically imposed on the entire material (fig. 2.11). The Von Mise’s yield
criterion states that the condition for homogeneous deformation requires activation of at
least five independent slip systems in each grain. The slip systems that are being activated
for the homogeneous deformation are not arbitrary. The model assumes that, the activated
slip systems are the ones that minimize the internal plastic work. This condition can be
represented by the expression below (Taylor, 1938).
(2.5)

Influence of the strain path change on the mechanical behavior of Mg alloys 2011
16
where, (Wint)min represents the minimum internal work that is necessary to plastically
deform the polycrystalline material, the τos
and γs represents the critical resolved shear
stress and the shear stress in the slip system ‘s’, respectively.
This condition can occur for different sets of five independent slip systems, giving rise to
ambiguity in the selection of the activated slip system that limits the application of this
model.
Figure 2.11 - Taylor model prediction of the deformed grain [Schematic] a) Initial Condition, b) after deformation
(Lopes A. L., 2001)
From the macroscopic and microscopic energy conservation law (Kocks, 1970)
(2.6)
Admitting that the critical shear stress value is the same for all slip systems (τ = τcs)
(2.7)
where, the σ and ε are the macroscopic imposed stress and strain. M is the Taylor factor
which is a parameter that takes into account the orientation of the grains with respect to the
applied stress. If all the grains are taken in account, the Taylor factor (M) should be
replaced by the average Taylor factor (<M>) and the previous expression can be rewritten
as:
σ = <M> (2.8)

Influence of the strain path change on the mechanical behavior of Mg alloys 2011
17
2.2.2.3 Self-consistent Model
Self-consistent model considers the grains as an inclusion in a fictitious homogeneous
medium where the property of the entire matrix depends on the weighted average of the
individual grain contribution, taking into account its crystallographic orientation (Kocks,
1998).
E = <ε> (2.9)
and,
Σ = <σ> (2.10)
where, the <ε> and the <σ> represent the average strain and average stress and E and Σ
represent the macroscopic stress and strain, respectively.
One of the most successful equations that relate the above mentioned parameters was
proposed by Hill (Hill, 1965).
σ – Σ = - LH (ε – E) (2.11)
Here the LH is the Hill’s constraint tensor, which depends on the grain shape and the grain
orientations.
2.2.2.4 Visco-plastic Model
In the visco-plastic model the shear strain rates ( s) in each slip system is related with the
resolved shear stress (τs) by a continuous and non-linear power law expression (Molinari,
1987).
(2.12)
In the above equation, the s and the τc
s are, respectively, the reference shear strain rate and
the critical resolved shear stress (CRSS) of the slip system s. The η is the reciprocal strain
rate sensitivity coefficient of the material.

Influence of the strain path change on the mechanical behavior of Mg alloys 2011
18
This model assumes that all slip systems are activated (but with different activity) during
the plastic deformation, removing Taylor’s model ambiguity in the selection of the
activated slip systems (Lopes, 2001).
2.2.3 Crystallographic Texture
Crystallographic texture is defined as the preferred orientation of the grains with respect to
a macroscopic reference frame defined in the sample. In the case of rolled metals the axes
of the external reference frame are commonly defined by the rolling direction (RD),
transverse direction (TD) and normal direction (ND) (fig 2.12).
This preferential orientation of the grains imposes anisotropy of properties (for example,
the strength, electrical conductivity, piezoelectricity, magnetic susceptibility, light
refraction, wave propagation etc.) and can be modified both by plastic deformation and
heat treatment processes.
Crystallographic texture can be represented by different methods. Of them, pole figures are
the most widely used techniques where the crystallographic plane normal density is
represented through stereographic projections. One pole figure alone is not sufficient to
completely define the orientation of the crystallites and it is necessary to measure the pole
figures for at least two different crystallographic planes.
Figure 2.12 - Definition of crystal axis (a, b, c) and macroscopic specimen axis (X, Y, Z) (Aluminium Matter, 2011)

Influence of the strain path change on the mechanical behavior of Mg alloys 2011
19
In the case of sheets, the preferential crystallographic orientation of the grains can also be
identified by the {hkl} plane and <uvw> directions parallel to, respectively, the sheet plane
and RD.
A more complete representation of the grain orientations in the polycrystal is by three
consecutive rotations (Euler angles: ϕ1,Φ, ϕ2) that transform the crystal coordinate system
(a,b,c) to the macroscopic sample coordinate system (X, Y, Z). Fig. 2.13 shows the
sequence of operation for this transformation.
Figure 2.13 - Euler’s angle definition of Bunge showing the rotation sequence from a) to d) (Aluminium Matter, 2011)
The Euler’s angles that characterize the orientation of each crystal in the material can be
represented in the Euler’s (ϕ1,Φ, ϕ2) coordinate system (Euler’s space). As a result, the
orientation of each crystal in a polycrystal can be expressed as a point in the 3D space and
the texture of the polycrystal can be represented by a 3D-iso surface (fig. 2.14 (a)).
However, in the last case, the resulting three dimensional representation is complex and it
is more common to represent the polycrystal texture by 2D sections of Euler space at
constant ϕ2 (fig. 2.14 (b)).

Influence of the strain path change on the mechanical behavior of Mg alloys 2011
20
Figure 2.14 – Crystallographic texture representation in Euler’s space a) three-dimensional representation; b) two-
dimensional representation of sections with constant values of φ2 (Bunge, 1982)
2.2.3.1 Texture in Mg and its alloys
The crystallographic texture of HCP metals has attracted significant interest because
usually play an important role in many mechanical and physical properties of these
materials.
The process conditions play a vital role to the development of texture (Gehrmann, 2005)
(Kim, 2005) (Agnew, 2003) (Azhi, 2008). The texture affects the deformation mode which
in turn promotes changes on the crystallographic orientation of the grains (Wang, 2010).
Texture can develop during processing and solidification and afterwards can be modified
by plastic deformation, phase transformations as well as recrystallization (Kawalla, 2007).
According with the c/a unit cell length ratio, the texture of cold rolled HCP metals can be
classified in three groups (fig. 2.15). Metals with c/a ratio approximately equal to the ideal
value (c/a 1.633), such as Mg (c/a = 1.624), tend to develop basal fiber textures where
most of the basal planes are oriented parallel to the sheet plane and there is no preferential
orientation of the prismatic or pyramidal planes (Wang Y. H., 2003). Some ideal pole
figures of this group of metals are shown in figure 2.16. The dominance of slip in the basal
planes during plastic deformation of Mg sheets was attributed to this kind of texture
development (Wang Y. H., 2003). Metals with c/a ratio above 1.633, such as Zn (c/a

Influence of the strain path change on the mechanical behavior of Mg alloys 2011
21
1.856) and Cd (c/a 1.885), have the propensity to show texture where the basal poles are
tilted ±15o–25
o away from the normal direction towards the rolling direction (fig. 2.15(b)).
The combination of basal slip and large scale twinning give rise to this texture (Wang Y.
H., 2003). Metals with c/a ratio less than the ideal one, such as Zr (c/a 1.589) and Ti (c/a
1.587), typically show texture where the basal poles are tilted ±20o–40
o away from the
normal direction towards the transverse direction (fig. 2.15(c)). The activation of prismatic
plane slip was made responsible for this type of texture (Wang Y. H., 2003).
Figure 2.15 - Simulated {0001}, {10 } rolling texture in HCP metals with c/a ratio: (a) approximately equal to 1.633;
(b) >1.633; and (c) <1.633 (Wang Y. H., 2003).

Influence of the strain path change on the mechanical behavior of Mg alloys 2011
22
Figure 2.16 - Some important ideal pole figures of HCP metals (Wang Y. H., 2003)

Influence of the strain path change on the mechanical behavior of Mg alloys 2011
23
In all the materials of the three groups, the evolution of initial texture during the
deformation depends on the deformation mode and direction (Löffler, 2007). In figure 2.17
is presented an example of AZ31 rolled sheet (fig. a and b) after compression test along
RD (fig. c) and tensile tests along ND (fig. d). It is noted that clear distinct textures were
developed for both tests. For compression along RD the pole figures show a strong
reorientation of the grains giving rise to split of basal poles along the RD direction as a
result of a strong tensile twinning activity. For tension along ND the basal poles of the
twinned regions were randomly orientated on the RD-TD plane (Park, 2010).
Figure 2.17 - Pole figures: (a) (0 0 0 2) and (b) (1 0 0) of the as-rolled material, and (0 0 0 2) of the material (c)
compressed to 6% along the RD and (d) tensioned to 6% along the ND (Park, 2010)
2.2.4 Plastic anisotropy
Anisotropy is defined as the variation of properties (strain, stress, strain hardening etc.)
along different directions. For the strain, the anisotropy can be characterized by the
anisotropy coefficient, or Lankford parameter, (R) defined as the width to thickness
reduction ratio:

Influence of the strain path change on the mechanical behavior of Mg alloys 2011
24
R = ε22/ ε33 (2.13)
Here ε22 is the true strain of the width and ε33 is the true strain of the thickness (fig. 2.18).
Figure 2.18 - Definition of strain tensor components (Vincze, 2007)
The average value and variation of R-values with the test direction are expressed by the
normal anisotropy ( ) and planar anisotropy (ΔR) coefficients respectively (Вanabiс,
2000).
= (R0 + R90 + 2R45)/4 and
ΔR = (R0 + R90 - 2R45)/2 (2.14)
Where R0, R45 and R90 are the R-values for 0o, 45
o and 90
o from the rolling direction of the
sheet.
The normal anisotropy is an important indication of the material deep drawability. Higher
the value of normal anisotropy characterizes higher deep drawing ability and larger strain
can be attained without rupture. The forming limit diagram (fig. 2.19) is usually deployed
in order to represent the effect of anisotropy on the formability of the material. The planar
anisotropy coefficient is associated with the development of earring. When ΔR = 0, the
deformation in sheet plane is isotropic and no earring occurs. For ΔR > 0, earrings form at
0o and 90
o directions. Where ΔR < 0, earrings form at 45
o from RD.

Influence of the strain path change on the mechanical behavior of Mg alloys 2011
25
Figure 2.19 - Forming limit diagram: A pure shear, B uniaxial tension, C plain strain, D stretch forming, E equibiaxial
strain (Bahadirov, 2010)
Anisotropy is a macroscopic effect of crystallographic texture and dislocation
microstructure developed during the plastic deformation of the material. Therefore, a
special attention must be paid to both of these aspects in order to control the mechanical
behavior of the material during the forming processes.
2.2.4.1 Effect of crystallographic texture
For an undeformed metal, the anisotropy is determined by the initial crystallographic
orientation of its grain. This effect has been reported in several works (Brown, 2005) (Choi
S. D., 2009) (Gehrmann, 2005) (Styczynski, 2004). For example, in the study performed
by Yi (Yi, S. B. 2006), the anisotropic mechanical behavior of the AZ31 Mg alloy was
described in relation to the crystallographic texture. Specimens were taken at 0o, 45
o and
90o to the extrusion direction and uniaxially loaded in tension at room temperature. The
results in fig. 2.20 show a strong anisotropic behavior of the material, expressed by
different flow stress evolution and uniform strains. These differences were attributed to the
strong initial texture of Mg bars and to the activation of different deformation modes.

Influence of the strain path change on the mechanical behavior of Mg alloys 2011
26
Figure 2.20 - Flow curves during tensile test at different orientations from extruded direction of Mg bar (Yi S. C., 2006)
2.2.4.2 Effect of dislocation microstructure
Most of the industrial metals forming processes involve a complex deformation history,
during which the material is subjected to successive strain paths that may vary
considerably in their orientation. These changes in strain path have a significant effect on
the mechanical behavior of metals. Macroscopically the effect of a certain prestrain
becomes manifested by a change of work hardening rate as, for example, an increased
reloading yield stress, temporary hardening or softening. In the last case, strain localization
can occur and leads to a premature failure and, therefore, to a decrease of material
formability. This effect is strongly anisotropic and depends on the prestrain value.
The mechanical behavior of the prestrained material during reloading can be grouped into
three different types and is represented schematically in fig. 2.21.

Influence of the strain path change on the mechanical behavior of Mg alloys 2011
27
Figure 2.21 – Stress (σ) – strain (ε) curve showing the consequences of reloading after a pre-deformation comparing
with the initial monotonic test. For a) b) and c) see text. (Vieira, 1994).
The curve (a) represents the case where the yield stress during reloading is lower than the
yield stress exhibited by the undeformed material. The behavior is typical of materials
when are subjected to reversal of applied load (Bauschinger test).
The curves (b) and (c) represent the situations where the yield stress during reloading
shows higher values than that exhibited by the material without pre-deformation. In curve
(c) the material presents similar rupture strain as undeformed material. On the other hand,
curve (b) represents the situation where the material exhibit softening during the early
stage of reloading that leads to its premature failure. Depending on the prestrain value and
the angle between the pre-deformation and reloading, the pre-deformed material can
demonstrate the behavior represented by any of the curves (a), (b) or (c).
2.2.4.2.1 Effect of prestrain value
The prestrain value influences the capability of the material to plastically deform. There
exists a critical prestrain value associated with each material, after which the capability of
the metal to plastically deform reduces significantly. As the value of prestrain gets higher,
the material formability is reduced and subsequently fails at lower reloading strain. This

Influence of the strain path change on the mechanical behavior of Mg alloys 2011
28
effect is due to the interaction between the dislocations activated during the reloading and
the dislocation structure from pre-deformation, which is more pronounced when the
material is deformed up to higher values of prestrain. In the case of mild steel the critical
pre-deformation value is approximately 0.1 (Hutchinson, 1983) for second orthogonal
sequence of uniaxial tension (fig. 2.22) whereas for copper the value is 0.18, for the same
deformation condition (Shen, 1988).
Figure 2.22 - Effect of pre-deformation value on the homogeneous plastic deformation in mild steel deformed in second
orthogonal trajectories (Shen, 1988)
2.2.4.2.2 Effect of the amplitude of strain path change
The amplitude of the strain path change can be characterized by the parameter α defined as
the cosine or the angle defined in the deformation space of the two reactions that represents
the two successive deformations (Schmitt, 1994).
(2.15)
with εp and εr the tensors of prestrain and reloading, respectively.
The value of this parameter lies between 1 and -1. The value of α = 1 corresponds to a
monotonic test where the strain path has not been changed. The same slip systems are

Influence of the strain path change on the mechanical behavior of Mg alloys 2011
29
activated in both the pre-deformation and the reloading and the mechanical behavior after
reloading superimposes to the one obtained during the monotonic test.
The value of α = -1 occurs when the strain path is reversed. In this case, the slip systems
activated during the pre-deformation are reactivated in the opposite direction during
reloading. As previously mentioned this test corresponds to a Bauschinger test and can be
represented by the curve (a) of figure 2.21.
The value of α = 0 corresponds to the situation where the slip systems that were latent
during the pre-deformation are activated during reloading. This requires a higher flow
stress to initiate the movement of dislocations in the new activated slip systems due to the
low mobility of the prestrain dislocations. However, after an initial stage, the dislocation
annihilation process occurs, the prestrain structure is replaced by a structure typical of the
second path and the effect of the prestrain on the flow stress decreases. This give rise to a
temporary softening (curve (b) and (c) in fig. 2.21) that can lead to a flow localization just
in the beginning of the reloading path (curve (c) in figure 2.21.

Influence of the strain path change on the mechanical behavior of Mg alloys 2011
30
3 Experimental Setup and Procedures
The main goal of this work is to study the effect of change of strain path on the mechanical
behavior at room temperature of Mg alloy. The alloy investigated was an AZ31 wrought
Mg alloy, which is the most widely used wrought Mg alloy in terms of industrial
application. The as-received AZ31 alloy sheets were cut in large pieces, some of them
were stored for tensile test and the remaining sheets were subjected to a two-stage
interrupted tensile test (pre-straining followed by reloading) by using the uniaxial tensile
machine. ASTM standard tensile specimens at different angles from the first tensile test
direction were cut from the pre-strained material. Transmission electron microscopy
(TEM) was conducted in order to observe the evolution of dislocation structures and
twinning (if any). Afterwards, texture measurement was also conducted by using the X-ray
diffraction technique. VPSC model code developed by Lebenshon and Tome (Lebensohn
R. A., 1993) (Lebensohn R. A., 1994) was used to assess the effect of the orientation of the
grains on the reloading behavior of the material. In the following sections, details of the
important parameters (i.e. the sample dimensions, the test parameters) and equipment used
are presented.
3.1 Material
In this work, the material studied was a commercial grade AZ31 alloy. The commercial
grade is composed of Al (3 wt pct.), Zn (1 wt pct.) and Mg (balance). The alloy sheets
were received in an annealed condition after subsequent rolling and in the form of large
sheets of 3mm thickness. Typical composition of the alloy is given in table 3.1.
Table 3.1 - Typical composition of AZ31 alloy (Gao, 2009)

Influence of the strain path change on the mechanical behavior of Mg alloys 2011
31
3.2 Mechanical Testing
The prestraining of the sample was carried out by cutting large test pieces (gauge length =
300 mm and width = 60mm) and then subjected to a prestrain value of εp = 0.07. The
prestraining was carried out in the rolling direction (RD) in an Instron 4208 universal
testing machine with a maximum load capacity of 150 KN. The cross-head speed (test
speed) was 20 mm/min, which corresponds to an initial strain rate of =10-3
s-1
. Figure 3.1
presents a view of the prestrain samples.
Figure 3.1 - AZ31 alloy used for pre-straining
Reloading was performed by introducing uniaxial tensile test using samples that were cut
according to the ASTM standard tensile specimen of 10 mm width (fig. 3.2). The samples
were made from the previously prestrained large pieces with variation of angles with
respect to the rolling direction (RD).
ASTM standard tensile specimens were cut at 0o (RD), 15
o, 30
o, 45
o, 60
o, 75
o, and 90
o
(TD) from the RD (fig. 3.3). For each angle, three different samples were tested in order to
validate the reproducibility of the results.
The test was performed in a Shimadzu Autograph (fig. 3.4) universal tensile machine
which has a maximum load capacity of 50 kN. In order to measure the changes in the
length and the width of the samples, a non-contact video extensometer MFA-25 was used.

Influence of the strain path change on the mechanical behavior of Mg alloys 2011
32
From the load and length change data, the true stress (σ)-true strain (ε) curves (σ=f (ε))
were determined by:
(3.1)
(3.2)
Here, ε is the plastic strain, lo and l are the initial and instantaneous length between the
extensometer’s grips, respectively, F is the force and A0 the initial cross area.
Figure 3.2 - Uniaxial Tensile Specimens( ASTM 10 mm width samples)
90o 75o 60o 45o 30o 15o 0o
Figure 3.3 - Sample orientations with respect to the different directions

Influence of the strain path change on the mechanical behavior of Mg alloys 2011
33
Figure 3.4 - Shimadzu Autograph machine, Mechanical Engineering Department, Univ. of Aveiro
3.3 Microscopic Observations
3.3.1 Optical Microscopy (OM)
The samples for optical microscopic observation were grinded with 180, 400, 1000, 2500
and 4000 grit SiC papers. Afterwards, they were polished using 6, 3, 1 µm diamond paste.
The polished samples were etched using a standard solution of 5 ml acetic acid, 6 g picric
acid, 10 ml H2O, and 100 ml ethanol.
3.3.2 Transmission Electron Microscopy (TEM)
The dislocation structures were observed using a Hitachi H-9000 (300KV) transmission
electron microscope (TEM). The TEM samples were prepared from thin foils obtained by
mechanical polishing for the mid-thickness location of the sheet. The polishing was done

Influence of the strain path change on the mechanical behavior of Mg alloys 2011
34
using 180, 400, 1000 grit SiC papers. From this thin foil, 3mm disks were cut and
electropolished using a double jet thinner with a standard electrolytic solution under 10 V
tension, at 20oC until perforation occurred.
1 liter of electrolyte was prepared by adding and mixing 800 ml of ethanol, 100 ml of
propanol and 18.5 ml of water 10 g hydroxyquinoline, 75 g citric acid, 41.5 g sodium
thiocyanate, 15 ml perchloric acid.
3.4 Crystallographic texture analysis
The preferred crystallographic orientation (texture) was measured by the X-ray diffraction
technique for different directions using a Philips X’pert diffractometer equipped with the
texture goniometer (fig. 3.5). The diffraction intensity was measured for crystallographic
planes {0002}, {10 }, {10 } and {10 }.
Figure 3.5 - Texture measurement using Philips X’ pert diffractometer equipped with texture goniometer

Influence of the strain path change on the mechanical behavior of Mg alloys 2011
35
For texture analysis, the samples were polished until the mid-section along the thickness
using 180, 400, 1000 grit SiC papers. Cu Kα radiation was used for X-ray diffraction.
Dedicated software MTEX Matlab quantitative texture analysis toolbox (Hielscher, 2008)
was used to process the X-ray diffraction data and to produce the complete pole figures.
During these calculations no symmetry was imposed to the pole figures.
From the processed data, a discrete set of 2212 grains were weighted, extracted and used
for the input of the Visco-plastic self-consistent model (VPSC) developed by Lebenshon
and Tome (Lebensohn R. A., 1993) (Lebensohn R. A., 1994) in order to simulate the
evolution of crystallographic texture during the plastic deformation and analyze its
influence on the mechanical behavior of the samples. During these calculations, the
extension rate tensor and the critical resolved shear stress of the slip systems were kept
constant (strain imposed and no hardening conditions). The experimental -values
measured during the tensile test were used to define the extension rate tensor values.

Influence of the strain path change on the mechanical behavior of Mg alloys 2011
36
4 Results and Discusion
4.1 Initial Material
In figure 4.1, the uniaxial true stress (σ)-true strain (ε) curves of as-received material
loaded at θ =0o, 45
o, and 90
o from RD are presented. The initial sheet shows an anisotropic
behavior characterized by higher flow stress when the sample is loaded at 0o than in the
other two tested directions. The anisotropy has also expression on the higher uniform strain
and R-value presented by the sample when is loaded at 0o from RD (Table 4.1). The high R
values measured for all the tests (expressed by = 1.59) are consistent with the values
reported by Choi (Choi S. D., 2009) and shows that the strain along the width (ε22) of the
sample is significantly higher than along its thickness (ε33). This corresponds to higher
capability of the sheet to deform before failing due to excessive thickness reduction. The
values of yield stress (σo) and the maximum tensile stress (σmax) are consistent with the
findings of several previous studies (Czerwinski, 2008) (Sekas, 2008) (Yang, 2008).
Figure 4.1 - Tensile true stress - true Strain curves of the as-received AZ31 alloy tested at 0o, 45o and 90o from RD

Influence of the strain path change on the mechanical behavior of Mg alloys 2011
37
Table 4.1 - Yield stress (σo), maximum stress (σmax), uniform strain (εu), R-value, , and R of the initial material tested
in three different directions
Test
Yield
stress (σo)
[MPa]
Max.
Stress
(σmax)
[MPa]
Uniform
strain (εu) R-value
Normal
Anisotropy
Planar
Anisotropy
R
0o 228 312 0.143 1.79
1.59
0.07
45
o 205 295 0.135 1.56
90o 205 302 0.130 1.47
In figure 4.2 are presented the microstructural observations performed by optical
microscopy of the material before and after tensile test up to the maximum uniform strain
value 0.14. The microstructure of the material is characterized by the presence of grains
almost equiaxial and with an average size of around 8µm. In all the analyzed samples the
grains were almost free of twins. Indeed, it is possible that the procedure used for sample
preparation for optical microscopy produced some twins. However, the number of grains
with these defects is very low and can be considered that the deformation of the AZ31
sheet occurs essentially by slip.

Influence of the strain path change on the mechanical behavior of Mg alloys 2011
38
(a) (b)
(c)
Figure 4.2 - Microstructural observations by optical microscopy of the material after tensile test up to a strain value
ε 0.14 at (a) 0o, (b) 45o, (c) 90o.
The microstructural characterization of the material was complemented with TEM
observations performed in the RD-TD (sheet plane), RD-ND (longitudinal plane), and TD-
ND (transverse plane) planes of the sheet, before and after tensile tests. The results are
presented in figures 4.3 and 4.4 and show that the initial material presents a very low
dislocation density, which confirms that the material was supplied in the recrystallized
state. In contrast, the deformed samples present a high dislocation density, homogeneously
distributed through the grains without defining dislocation cells. This dislocation structure,
that is similar in all samples and analyzed planes, is characteristic of the Mg alloys (Bryla,
2009) and reflects the low mobility of the dislocations in the structure of AZ31 due to their

Influence of the strain path change on the mechanical behavior of Mg alloys 2011
39
low stacking fault energy (25mJ/m2) (Lawrence, 1975) and the presence of solutes. During
this analysis twins inside the grains were not observed. It is worth mentioning that the high
elastic strain field associated with each dislocation made TEM analysis difficult, especially
when these strain fields overlapped due to the high density of dislocations.
Figure 4.3 - TEM image of the as-received material

Influence of the strain path change on the mechanical behavior of Mg alloys 2011
40
Figure 4.4 - TEM image of the typical dislocation microstructure developed in the AZ31 after tensile test up to maximum
uniform strain (sample loaded at 90o).
Figures 4.5 to 4.8 and in A.1 to A.4 present the crystallographic texture of the initial
material and after the tensile test. The {0001},{ } pole figures and υ2 = 0o, 30
o, 60
o
sections of Euler space shows that the as-received material has a strong {0001} <uvtw>
fiber crystallographic texture component, typical of hot-rolled and annealed Mg sheets
(Park, 2010) (Wang Y. H., 2003). During the tensile test the Mg grains rotates around the
crystallographic c-axis giving rise to a strong {0001}< > texture component,
regardless the direction of the tensile tests. However, it is possible to verify that the
{0001}< > texture component is stronger for the samples loaded at 0o than for 45
o and
90o. In order to evaluate the influence of these differences on the mechanical behavior of
the material, the evolution of the average Taylor factor (<M>) and the activity of the slip
systems during the uniaxial tensile strain were computed using the VPSC code. In these
calculations, it was assumed that the plastic deformation occurs by slip on the basal <a>,
prismatic <a> and pyramidal <c+a> slip systems with normalized critical resolved shear
stresses (CRSS) reported by (Proust, 2009) and presented in the table 4.2. It was also
considered that twinning did not contribute to the plastic deformation of the material. This
approximation is justified by the twinning-free microstructures observed by optical
microscopy and TEM performed on the material and the absence of intensity reinforcement

Influence of the strain path change on the mechanical behavior of Mg alloys 2011
41
of {0001} pole figures in the direction almost perpendicular (86.6o) to the ND direction
of the sheet, typical when the tensile twinning is activated.
Figure 4.5 - Experimental (a) {0001},{ } pole figures for the as-received material. RD - rolling direction, TD -
transverse direction.
Figure 4.6 - Experimental (a) {0001},{ } pole figures for the material after tensile test up to the maximum uniform
strain at 0o. RD - rolling direction, TA - tensile axis, TD – transverse direction.

Influence of the strain path change on the mechanical behavior of Mg alloys 2011
42
Figure 4.7 - Experimental (a) {0001},{ } pole figures for the material after tensile test up to the maximum uniform
strain at 45o. RD - rolling direction, TA - tensile axis.
Figure 4.8 - Experimental (a) {0001},{ } pole figures for the material after tensile test up to the maximum uniform
strain at 90o. RD - rolling direction, TA - tensile axis.

Influence of the strain path change on the mechanical behavior of Mg alloys 2011
43
Table 4.2 - Normalized critical resolved shear stress (CRSS) of the slip systems used in the VPSC calculations (Proust,
2009)
Slip system Normalized CRSS
Basal <a> ({0001}<10 >) 1.0
Prismatic <a> ({10 0}<11 >) 2.9
Pyramidal <c+a> ({11 2} <11 >) 5.2
The results of polycrystal plasticity code are presented in figures 4.9 to 4.12 and table 4.3.
The textures predicted by the model for the analyzed samples (figures 4.9 to 4.11 and A.5
to A.7 in appendix) present good qualitative agreement with the experimental textures
showing that VPSC model can be used to analyze the influence of the crystallographic
texture on the mechanical behavior of Mg sheet. Indeed, from a quantitative point of view,
the predicted textures are, as usual (Kocks, 1998), sharper than the experimental ones due
to the discrete nature of the model but all the simulated pole figures present the strong
{0001}<10 > component that, for θ = 0o, is a little more intense than for θ = 45
o and 90
o.
These differences give rise to a higher Taylor factor for 0o than for the other two directions
(fig. 4.12). In fact, all the samples present a continuous increase of <M> value with the
strain that correspond to a stronger contribution of the crystallographic texture evolution
for the strain hardening during the tensile test (textural hardening) but for each strain value
the orientation assumed by the grains in the sample deformed at 0o opposes more
efficiently to the plastic deformation. Quantitatively these results reflect the hierarchy of
the experimental σ-ε curves of figure 4.1 strongly suggesting that the crystallographic
texture has an important role on the anisotropic flow stress observed during the tensile tests
performed to the initial material.

Influence of the strain path change on the mechanical behavior of Mg alloys 2011
44
Figure 4.9 - Simulated (using VPSC code) (a) {0001},{ } pole figures for the material after tensile test up to the
maximum uniform strain at 0o. RD - rolling direction, TA - tensile axis, TD – transverse direction.
Figure 4.10 - Simulated (using VPSC code) (a) {0001},{ } pole figures for the material after tensile test up to the
maximum uniform strain at45o. RD - rolling direction, TA - tensile axis.

Influence of the strain path change on the mechanical behavior of Mg alloys 2011
45
Figure 4.11 - Simulated (using VPSC code) (a) {0001},{ } pole figures for the material after tensile test up to the
maximum uniform strain at 90o. RD - rolling direction, TA - tensile axis.
Figure 4.12 - Taylor factor - strain curves predicted by the VPSC model for initial material deformed in tensile test in
three different test directions.
In table 4.3 is presented the activity of the slip systems computed by VPSC code for the
three analyzed directions at different tensile strain values. It is possible to verify that the

Influence of the strain path change on the mechanical behavior of Mg alloys 2011
46
accommodation of the plastic deformation occurs essentially through the activation of the
basal and prismatic slip systems as reported by several authors (Choi S. D., 2009) (Proust,
2009) (Wang Y. H., 2003). More specifically, for all the directions and strain values, the
basal <a> is the most activated slip systems but its contribution to the plastic deformation
of the grains decreases with the strain and is lower for 0o than for the other two tensile
directions. This evolution can justify the <M> - ε curves computed by the polycrystal
model. Indeed, by comparing figure 4.12 and the values in the table 4.3 one may verify that
the increase of the Taylor factor is associated with a decrease of activity in the basal slip
planes and an increase of activity in the prismatic slip plane. This shows that the
orientation of the basal and the prismatic planes with respect to the tensile direction has a
strong influence on the flow stress during the tensile test. Taking into account that the basal
plane contains the slip systems with lower critically resolved shear stress, is expected that
the changes of activity in this plane have higher impact on the flow stress than the changes
of activity in other slip planes. In this case, the increase of the fraction of Mg grains with c-
axis parallel to ND of the sheet corresponds to a decrease of resolved shear stress in the
basal planes and, therefore, should be decisive for the increase of tensile flow stress. This
hypothesis is consistent with the distortion (contraction) of maximum of intensity on the
center of {0001} pole figures experimentally observed for samples loaded at 0o and 45
o
and in all simulated pole figures. However, this effect is not clear for 90o experimental pole
figures and should be confirmed in the future work.

Influence of the strain path change on the mechanical behavior of Mg alloys 2011
47
Table 4.3 - Activity of the slip systems computed by VPSC code for the three analyzed directions
Strain
Activity
0º 45º 90º
Basal Prismatic Pyramidal Basal Prismatic Pyramidal Basal Prismatic Pyramidal
0.005 0.80 0.20 0.00002 0.83 0.18 0.00001 0.82 0.17 0.00001
0.025 0.78 0.22 0.00002 0.80 0.19 0.00002 0.81 0.19 0.00002
0.045 0.77 0.23 0.00002 0.80 0.21 0.00002 0.79 0.21 0.00002
0.065 0.75 0.25 0.00003 0.77 0.23 0.00003 0.77 0.23 0.00003
0.085 0.72 0.28 0.00005 0.75 0.25 0.00004 0.74 0.25 0.00004
0.105 0.70 0.30 0.00007 0.72 0.28 0.00006 0.72 0.28 0.00006
0.125 0.67 0.33 0.00011 0.69 0.31 0.00010 0.69 0.31 0.00009
0.13 0.66 0.34 0.00011 0.68 0.32 0.00010 0.68 0.31 0.00009
0.135 0.65 0.35 0.00013 0.67 0.33 0.00012 --- --- ---
0.14 0.64 0.35 0.00014 --- --- --- --- --- ---
4.2 Material after pre-deformation
The true stress (σ) - true strain (ε) curves of AZ31 alloy sheet obtained by tensile test
performed at different angles (θ) from RD after pre-deformation up to 0.07 tensile strain in
the rolling direction are presented in figure 4.13. For comparison, it is also presented the σ
– ε curve of material during the pre-deformation at 0o from RD. The predominant feature
of these curves is the decrease of the flow stress with increase of the reloading angle.
Indeed, when the reloading direction is parallel to the prestrain direction (θ = 0o), which
corresponds to a monotonic interrupted test, the flow stress in both tests are similar and the
respective σ – ε curves superimpose. However, when the angle between the pre-
deformation and the reloading increases, the flow stress in the second strain path decreases,
especially in the beginning of the test.

Influence of the strain path change on the mechanical behavior of Mg alloys 2011
48
Figure 4.13 – Tensile true stress (σ) - true strain (ε) curves at 0o, 15o, 30o, 45o, 60o, 75o and 90o of AZ31 after pre-
deformation up to 0.07. The curve for as-received material is also presented.
Another trend in figure 4.13 is the increase of the total uniform strain of the reloaded
sample when compared with the prestrained one (table 4.4). These differences can be
justified by the higher R-values (and ) measured for the pre-deformed samples that reflect
lower sample thickness reduction during the tensile tests.
Table 4.4 - Yield stress (σo), maximum stress (σmax), uniform strain (εu), R-value, and ΔR of the pre-deformed material
reloaded in different directions
Test
Yield
stress
(σo)
[MPa]
Max.
Stress
(σmax)
[MPa]
Uniform
strain (εu) R-value
Normal
anisotropy
Planar
anisotropy ΔR
0o 290 332 0.159 1.81
2.20 -0.78
15o 282 320 0.170 2.45
30o 270 320 0.185 1.93
45o 250 312 0.189 2.57
60o 241 311 0.219 1.94
75o 232 305 0.188 1.86
90o 231 308 0.171 1.78

Influence of the strain path change on the mechanical behavior of Mg alloys 2011
49
As mentioned before in chapter 2, the change of strain path promotes changes in the
activity of the available slip systems that, depending of the amplitude of the applied
changes (which can be characterized by α-parameter value), can strongly influence the
mechanical response of the material. For α = 1, that corresponds to monotonic test, i.e.
when the sample is unloaded and reloaded in the same tensile direction, the same slip
systems are activated before and after reloading. For α = -1, the strain is reversed
(corresponding to a Bauschinger type test), and the slip systems are reactivated in opposite
directions during the two loadings. The intermediate situation (α = 0) corresponds to an
amplitude of strain path change which activates different slip systems during the prestrain
and reloading. For an isotropic material (with R = 1) and the tensile-tensile test sequence,
α covers the range of values from 1 to -0.5 ( curve (a) of fig. 4.14). More specifically, α =
1, 0 and -0.5 corresponds to the test performed at θ = 0o, 55
o and 90
o. For materials with R
≠ 1, as the AZ31 investigated sheet, these α-values occur for different loading angle.
Namely, for R = 2.2 (table 4.4), the reloading at 0o, 47
o and 90
o correspond to a α-value
equal to 1, 0, and -0.83, respectively ( curve (b) of fig. 4.14).
Figure 4.14 - Evolution of α parameter with the reloading angle for (a) isotropic (R =1) and (b) anisotropic (R = 2.2)
material deformed in tensile-tensile test.
-1
-0,5
0
0,5
1
1,5
0 30 60 90 120 150 180 210 240 270 300 330 360
α-v
alu
e
Reloading Angle (θ)
(b)
(a)

Influence of the strain path change on the mechanical behavior of Mg alloys 2011
50
The results of the previous figure show that the reloading at 0o to 47
o requires the
progressive activation of new slip systems that were latent during the prestrain and should
be responsible for an increase of reloading yield stress. By contrast, for the reloading
angles between 47o and 90
o an increased number of slip systems are reactivated in the
reverse direction during the reloading that should promote a progressive decrease of the
reloading yield stress. For dislocation cell-forming materials (as Al, Cu, low carbon steels
etc.) these changes in activity of the slip systems occurs with the replacement of the
dislocation structures developed during the prestrain by a typical dislocation structure of
the new strain path. For no cell-forming materials, as the one investigated in this work, the
effect of these changes in the activity of the slip systems during the strain path change give
rise to similar dislocation structure after the reloading at different angles. Indeed, all the
reloaded samples present similar dislocation microstructure (fig. 4.15), characterized by
homogeneous distribution of dislocations and no specific feature that can justify the
differences in mechanical behavior during the reloading was observed.
Figure 4.15 - TEM image of the typical dislocation microstructure developed in the AZ31 after reloading up to maximum
uniform strain (left: sample reloaded at 45o and right: sample reloaded at 90o).

Influence of the strain path change on the mechanical behavior of Mg alloys 2011
51
By contrast, the crystallographic textures presented by the material reloaded at 0o, 45
o and
90o are different (fig. 4.16 to 4.18 and A.8 to A.10). For θ = 0
o, the final texture presents
the strong {0001}< > component, similar to the one observed in as-received material
after tensile test. For θ = 45o, the pole figures show the superposition of the
{0001}< > component developed during reloading (that appears as a reinforcement
along the tensile direction) with the one developed during prestrain (that appears as a
reinforcement along 45o from tensile direction). For θ = 90
o, the reactivation of slip
systems during the second path is in the opposite direction and gives rise to reverse grain
rotations and to a final texture that is similar to the one observed in as-received material
({0001}< > fiber texture).
Figure 4.16 - Experimental (a) {0001},{ } pole figures for the material after reloading at 0o. RD - rolling direction,
TA1 - tensile axis for the 1st path, TA – Tensile axis for the 2nd path TD – transverse direction.

Influence of the strain path change on the mechanical behavior of Mg alloys 2011
52
Figure 4.17 - Experimental (a) {0001},{ } pole figures for the material after reloading at 45o. TA1 - tensile axis for
the 1st path, TA2 – Tensile axis for the 2nd path TD.
Figure 4.18 - Experimental (a) {0001},{ } pole for the material after reloading at 90o. RD - rolling direction, TA -
tensile axis, TD – transverse direction.
The contribution of these differences in crystallographic texture on the mechanical
behavior during the reloading were analyzed (as in previous section) through simulations
using VPSC model. The simulated textures are presented in figures 4.19 to 4.21 and A.11
to A.13, in appendix. For all the samples good qualitative agreement was obtained between

Influence of the strain path change on the mechanical behavior of Mg alloys 2011
53
the simulated and experimental textures, showing that VPSC captures the main changes of
texture during the reloading and, as for the as-received material, can be used to analyze the
mechanical behavior of Mg sheet during the reloading.
Figure 4.19 – Simulated (using VPSC) (a) {0001},{ } pole figures for the material after reloading at 0o. TA1 - tensile
axis for the 1st path, TA – Tensile axis for the 2nd path TD – transverse direction.
Figure 4.20 - Simulated (a) {0001},{ } pole figures for the material after reloading at 45o. TA1 - tensile axis for the
1st path, TA2 – Tensile axis for the 2nd path TD.

Influence of the strain path change on the mechanical behavior of Mg alloys 2011
54
Figure 4.21 - Simulated (a) {0001},{ } pole for the material after reloading at 90o. RD - rolling direction, TA -
tensile axis, TD – transverse direction.
Also, the comparison of the <M> - ε curves (fig. 4.22) with the evolution of the flow stress
during the reloading (fig. 4.13) shows a good qualitative agreement. Namely, higher values
of Taylor factor corresponds to a higher flow stress in the beginning of the second path, for
all the analyzed directions. This is a strong indication that the crystallographic texture has a
major influence on the differences in the mechanical behavior observed during the
reloading of Mg alloy sheet.
Figure 4.22 - The <M> - ε curves after reloading at different test directions predicted by the VPSC model in the strain
imposed condition

Influence of the strain path change on the mechanical behavior of Mg alloys 2011
55
Another analysis that can be performed is about the influence of the activity of slip systems
on the evolution of the Taylor factor during the second strain path. The results of VPSC
model in table 4.6 to 4.8 shows that, as observed for as-received material, the plastic
deformation during reloading of Mg sheet occurs mainly by activation of basal <a> and
prismatic <a> slip systems and the increase of the <M> value occurs when the activity of
the basal <a> system decreases. This is in agreement with the proposed hypothesis that the
orientations of the c-axis of the grains relatively to the normal direction of the sheet has a
strong influence on the activity of the basal slip systems and, therefore, on the flow stress
during tensile test of Mg sheet.
Table 4.5 - Activity of the slip systems computed by VPSC code for samples reloaded at 0o, 15o and 30o.
Strain
Activity
0º 15º 30º
Basal Prismatic Pyramidal Basal Prismatic Pyramidal Basal Prismatic Pyramidal
0.005 0.77 0.22 0.00003 0.78 0.22 0.00002 0.80 0.20 0.00001
0.020 0.76 0.24 0.00003 0.77 0.23 0.00003 0.79 0.21 0.00002
0.035 0.74 0.26 0.00004 0.75 0.25 0.00003 0.77 0.22 0.00002
0.050 0.72 0.28 0.00004 0.73 0.26 0.00004 0.75 0.24 0.00003
0.065 0.70 0.30 0.00005 0.72 0.28 0.00005 0.74 0.26 0.00003
0.080 0.69 0.31 0.00006 0.70 0.30 0.00006 0.72 0.28 0.00004
0.095 --- --- --- --- --- --- 0.70 0.30 0.00005
0.11 --- --- --- --- --- --- 0.68 0.32 0.00006
Table 4.6 - Activity of the slip systems computed by VPSC code for samples reloaded at 45o and 60o.
Strain
Activity
45º 60º
Basal Prismatic Pyramidal Basal Prismatic Pyramidal
0.005 0.80 0.19 0.00001 0.81 0.19 0.00001
0.020 0.80 0.21 0.00002 0.80 0.19 0.00001
0.035 0.78 0.22 0.00002 0.79 0.20 0.00001
0.050 0.77 0.23 0.00002 0.78 0.22 0.00002
0.065 0.75 0.25 0.00003 0.77 0.23 0.00002
0.080 0.74 0.26 0.00003 0.75 0.25 0.00003
0.095 0.72 0.28 0.00004 0.74 0.26 0.00003
0.11 0.70 0.29 0.00005 0.72 0.28 0.00004

Influence of the strain path change on the mechanical behavior of Mg alloys 2011
56
Table 4.7 - Activity of the slip systems computed by VPSC code for samples reloaded at 75o and 90o.
Strain
Activity
75º 90º
Basal Prismatic Pyramidal Basal Prismatic Pyramidal
0.005 0.81 0.18 0.00001 0.82 0.17 0.00001
0.020 0.80 0.19 0.00001 0.82 0.18 0.00001
0.035 0.79 0.21 0.00001 0.81 0.29 0.00001
0.050 0.78 0.22 0.00002 0.80 0.20 0.00002
0.065 0.77 0.23 0.00002 0.79 0.21 0.00002
0.080 0.76 0.24 0.00003 0.77 0.23 0.00003
0.095 0.74 0.25 0.00003 --- --- ---
0.11 0.73 0.27 0.00004 --- --- ---

Influence of the strain path change on the mechanical behavior of Mg alloys 2011
57
5 Conclusions
The influence of the strain path change on the mechanical behavior of AZ31 alloy was
studied. For that, AZ31 sheets were pre-strained and afterwards eight different orientations
(with respect to the RD) were selected to conduct the tensile test. The influence of the
dislocation structure and crystallographic texture during the plastic deformation on the
mechanical behavior of the material during both the uniaxial tensile tests was analyzed
using transmission electron microscopy (TEM) and X-ray diffraction. The visco-plastic
self-consistent (VPSC) model was used to quantify the effect of crystallographic texture on
the stress-strain curves obtained by tensile tests performed.
Based on the results, the following conclusions can be drawn:
I. The as-received material showed anisotropic properties in different test directions
characterized by anisotropy in flow stress, uniform strain and R-value. For all the
investigated directions (0o, 45
o, 90
o), the material loaded at 0
o showed higher values
for each of them. The high R value measured for all the tests ( = 1.59)
corresponds to a higher capability of the sheet to deform before failing due to
excessive thickness reduction.
II. Optical microscopic observations of the material before and after tensile test depict
that, the microstructure of the material comprised of almost equiaxial grains. The
volume fraction of twins observed in the grains was insignificant suggesting that,
the deformation process was essentially governed by slip.
III. TEM observations of the as-received material before and after the tensile test
showed that, the initial material was characterized by a low dislocation density
whereas the deformed material presented a high dislocation density without
defining dislocation cells. This reflects the low mobility of the dislocation in the
material essentially due to their low stacking fault energy and presence of solute.
The analysis also confirmed the presence of twins in the grains was insignificant.
IV. Texture analysis on the as-received material before tensile test showed that, the as-
received material has a strong {0001} <uvtw> fiber crystallographic texture

Influence of the strain path change on the mechanical behavior of Mg alloys 2011
58
component. After tensile test, {0001}< > texture component was observed to
be predominant for all analyzed test direction where it was stronger for material
loaded at 0o than the other two test directions. The results were qualitatively
complemented using polycrystal model (VPSC code) suggesting that VPSC model
can be used to compute the influence of the crystallographic texture on the
mechanical behavior of Mg sheet. The stronger {0001}< > texture component
for material loaded at 0o contributed to its higher <M> value than the other two test
directions. Quantitatively these results reflected the hierarchy of the experimental
σ-ε curves strongly suggesting that the crystallographic texture has an important
role on the anisotropic flow stress observed during the tensile tests performed to the
initial material.
V. Calculation of activity of slip system (using VPSC) for as-received material before
and after tensile test revealed that, plastic deformation occurs essentially through
the activation of the basal and prismatic slip systems. However, the contribution to
the plastic deformation of basal slip decreases with the strain and is lower for 0o
than for the other two tensile directions strongly justifying the <M> - ε curves
computed by the polycrystal model. This shows that the orientation of the basal and
the prismatic planes with respect to the tensile direction has a strong influence on
the flow stress during the tensile test. The effect was observed for samples loaded
at 0o and 45
o and in all simulated pole figures. However, this effect was not clear
for 90o experimental pole figures.
VI. The material pre-deformed and reloaded at different angles from RD presented
anisotropy in flow stress, uniform deformation and R-value. The predominant
feature of true stress – true strain curves was the decrease of the flow stress with
increase of the reloading angle. The material after reloading presented higher
uniform strain than the prestrained one justified by their higher R-value ( = 2.20)
that reflects a decrease of the sheet thickness reduction during loading.
VII. The changes in the activity of slip systems promoted by strain path change (where
the amplitude of the change is characterized by α parameter) for the material (pre-
deformed and reloaded at different angles) did not show any effect on the
dislocation structure observed by TEM. The structure was characterized by a
homogeneous distribution of dislocations (similar to the initial material) and no

Influence of the strain path change on the mechanical behavior of Mg alloys 2011
59
specific feature that can justify the differences in mechanical behavior during the
reloading was observed. However, as observed for as-received material, the plastic
deformation during reloading of Mg sheet occurs mainly by activation of basal <a>
and prismatic <a> slip systems and the increase of the <M> value occurs when the
activity of the basal <a> system decreases.
VIII. The <M> - ε curves for material after reloading at different test directions predicted
by the VPSC model showed that, higher values of Taylor factor corresponds to a
higher flow stress in the beginning of the second path, for all the analyzed
directions. That strongly suggests that the crystallographic texture has a major
influence on the differences in the mechanical behavior observed during the
reloading of Mg alloy sheet (as concluded for initial material).

Influence of the strain path change on the mechanical behavior of Mg alloys 2011
60
6 Proposals for further study
Based on the results obtained, a proposal is given below which may improve the
understanding of the behavior of these alloys:
Similar studies should be conducted on AZ31 alloys with different prestrain value
and varying temperatures. The increase of the prestrain value increases the
population of dislocations, mutual interactions whereas the temperature has the
opposite effect. Moreover, the increase of temperature promotes the activity of non-
basal slip systems. So change of prestrain value at different temperature can be an
interesting aspect to explore in order to improve the understanding of the
deformation mechanism (essentially the contribution of dislocations relative to the
crystallographic texture) of Mg alloys.

Influence of the strain path change on the mechanical behavior of Mg alloys 2011
61
7 Bibliography
Agnew, S. C., C. N. Tome., D. W. Brown., T. M. Holden., S. C. Vogel (2003). Study of
slip mechanisms in magnesium alloy by neutron diffraction and modelling. Scripta
Materialia, 48, 1003-1008.
Ahzi, S., S. M'Guil. (2008). A new intermediate model for polycrystalline viscoplastic
deformation and texture evolution. Acta Materialia, 56(19), 5359-5369.
Alan, A. L. (2003). Recent magnesium alloy development for automotive powertrain
applications. Material Science Forum, 419-422, 57-66.
Aluminium Matter. (5. October 2011). Abgerufen am 5. October 2011 von
http://aluminium.matter.org.uk/, http://aluminium.matter.org.uk/
Al-Samman, T. G., G. Gottstein. (2008). Room temperature formability of a magnesium
AZ31 alloy: Examining the role of texture on the deformation mechanisms.
Materials Science and Engineering A, 488, 406–414.
Avedesian, M. (1999). ASM Speicality Handbook Magnesium and Magnesium Alloys.
Ohio: ASM International.
Bahadirov, K. (2010). Asymmetric Rolling of Aluminium 1050, M.Sc thesis. Aveiro:
University of Aveiro.
Вanabiс, D. (2000). Formability of Metallic Materials. Springer-Verlag Berlin.
Barnett, M. N., N. Stanford., P. Cizek., A. Beer., Z. Xuebin (2009). Deformation
mechanisms in Mg alloys and the challenge of extending room-temperature
plsticity. Journal of Materials, 61, 19-23.
Barnett, M. R., Z. Keshavarz., X. Ma (2006). A semianalytical Sachs model for the flow
stress of a magnesium alloy. Metallurgical and Materials Transactions A, 37A,
2283-2293.
Brown, D. S., S. R. Agnew., M. Bourke., T. Holden., S. Vogel., C. Tome (2005). Internal
strain and texture evolution during deformation twinning in magnesium. Materials
Science and Engineering A, 399, 1-12.
Bryla, K., J. Dutkiewicz., P. Malczewski (2009). Grain refinement in AZ31 alloy
processed by equal channel angular pressing. Archives of Materials science and
Engineering, 40, 17-22.
Bunge, H. (1982). Texture analysis in materials science: mathematical methods. London:
Butterworth publishers.

Influence of the strain path change on the mechanical behavior of Mg alloys 2011
62
Cahn, R. W., C. X. Shi., J. Ke (1999). Structure and Properties of Nonferrous Alloys.
Beijing: Beijing, Science Press.
Choi, S. H., D. H. Kim., H. W. Lee., B. S. Seong., K. Piao., R. Wagoner (2009). Evolution
of the deformation texture and yield locus shape in an AZ31 Mg alloy sheet under
uniaxial laoding. Materials Science and Engineering A, 526, 38-49.
Choi, S. E., E. J. Shin., B. S. Seong (2007). Simulation of deformation twins and
deformation texture in an AZ31 Mg alloy under uniaxial compression. Acta
Materialia, 55, 4181–4192.
Cole, G. (2007). Magnesium vision 2020: A North American Automotive Strategic Vision
of Magnesium. USAMP report.
Czerwinski, F. (2008). Magnesium Injection Molding. Springer.
Davies, G. (2003). Magnesium. Materials for Automotive Bodies. Oxford: Butterworth-
Heinemann, 91, 158, 159.
Dieter, G. (1988). Mechanical Metallurgy. London: McGraw-Hill.
Duffy, L. (1996). Magnesium Alloys: The light choice for Aerospace. Materials World, 4,
127-130.
Eliezer, D., E. Aghion., F. H. Froes (1998). Magnesium science and technology. Advanced
Performance Materials, 5, 201-212.
Emley, E. (1966). Principles of Magnesium Technology. Pergamon Press.
Engler, O. V. (2010). Introduction to Texture Analysis. CRC press.
Friedrich, H., S. Schumann (2001). New age of magnesium. Journal of Materials
Processing Technology, 117, 276-281.
Friederich, H., E. Horst., B. L. Mordike (2006). Technology of magnesium and magnesium
alloys. Magnesium Technology: Metallurgy, Design Data, Applications. Berlin:
Springer.
Gao, Z. (2009). Microstuctural stability of Magnesium alloys during high temperature
deformation, MASc. thesis. McMaster University, Mat Sci and Eng. Ontario,
Canada: McMaster University.
Gehrmann, R., M. M. Frommert., G. Gottstein (2005). Texture effects on plastic
deformation of magnesium. Materials Science and Engineering, A 395, 338-349.
Gerald, G. S. (2003). Issues that influence magnesium’s use in the automotive industry.
Material Science. Forum, 419-422, 43-50.
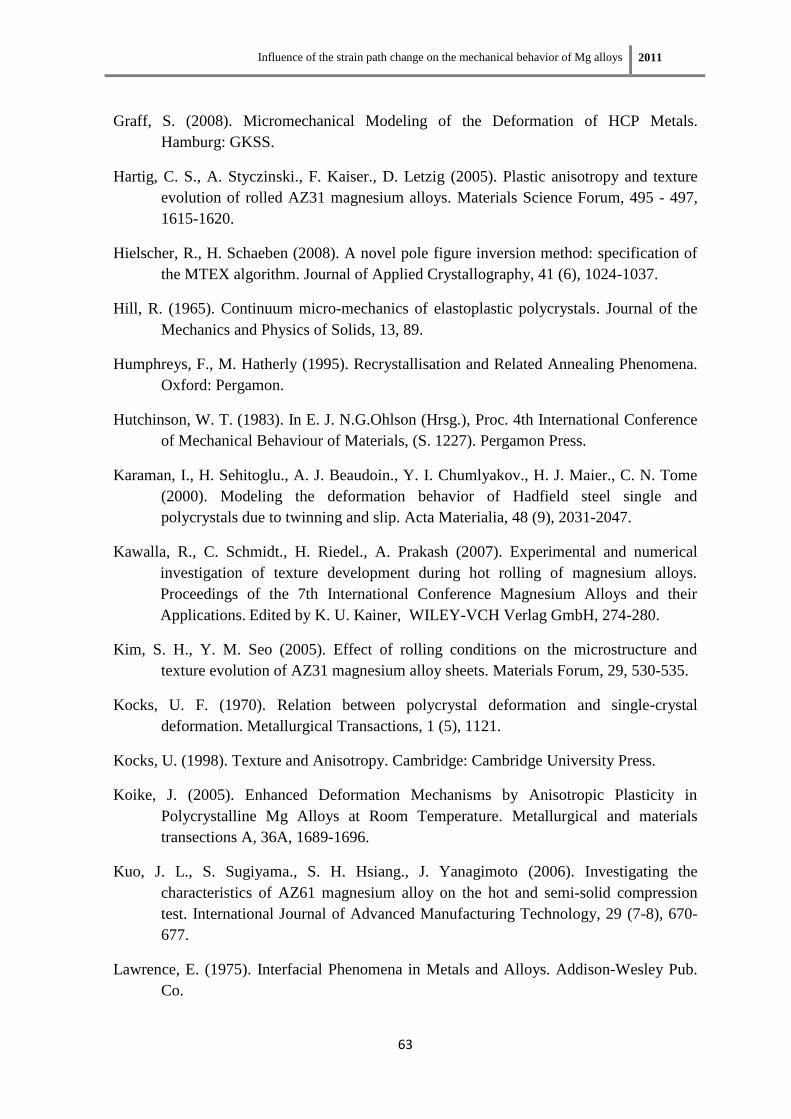
Influence of the strain path change on the mechanical behavior of Mg alloys 2011
63
Graff, S. (2008). Micromechanical Modeling of the Deformation of HCP Metals.
Hamburg: GKSS.
Hartig, C. S., A. Styczinski., F. Kaiser., D. Letzig (2005). Plastic anisotropy and texture
evolution of rolled AZ31 magnesium alloys. Materials Science Forum, 495 - 497,
1615-1620.
Hielscher, R., H. Schaeben (2008). A novel pole figure inversion method: specification of
the MTEX algorithm. Journal of Applied Crystallography, 41 (6), 1024-1037.
Hill, R. (1965). Continuum micro-mechanics of elastoplastic polycrystals. Journal of the
Mechanics and Physics of Solids, 13, 89.
Humphreys, F., M. Hatherly (1995). Recrystallisation and Related Annealing Phenomena.
Oxford: Pergamon.
Hutchinson, W. T. (1983). In E. J. N.G.Ohlson (Hrsg.), Proc. 4th International Conference
of Mechanical Behaviour of Materials, (S. 1227). Pergamon Press.
Karaman, I., H. Sehitoglu., A. J. Beaudoin., Y. I. Chumlyakov., H. J. Maier., C. N. Tome
(2000). Modeling the deformation behavior of Hadfield steel single and
polycrystals due to twinning and slip. Acta Materialia, 48 (9), 2031-2047.
Kawalla, R., C. Schmidt., H. Riedel., A. Prakash (2007). Experimental and numerical
investigation of texture development during hot rolling of magnesium alloys.
Proceedings of the 7th International Conference Magnesium Alloys and their
Applications. Edited by K. U. Kainer, WILEY-VCH Verlag GmbH, 274-280.
Kim, S. H., Y. M. Seo (2005). Effect of rolling conditions on the microstructure and
texture evolution of AZ31 magnesium alloy sheets. Materials Forum, 29, 530-535.
Kocks, U. F. (1970). Relation between polycrystal deformation and single-crystal
deformation. Metallurgical Transactions, 1 (5), 1121.
Kocks, U. (1998). Texture and Anisotropy. Cambridge: Cambridge University Press.
Koike, J. (2005). Enhanced Deformation Mechanisms by Anisotropic Plasticity in
Polycrystalline Mg Alloys at Room Temperature. Metallurgical and materials
transections A, 36A, 1689-1696.
Kuo, J. L., S. Sugiyama., S. H. Hsiang., J. Yanagimoto (2006). Investigating the
characteristics of AZ61 magnesium alloy on the hot and semi-solid compression
test. International Journal of Advanced Manufacturing Technology, 29 (7-8), 670-
677.
Lawrence, E. (1975). Interfacial Phenomena in Metals and Alloys. Addison-Wesley Pub.
Co.

Influence of the strain path change on the mechanical behavior of Mg alloys 2011
64
Lebensohn, R. A., C. N. Tome (1993). A self-consistent anisotropic approach for the
simulation of plastic deformation and texture development of polycrystals:
Application to zirconium alloys. Acta Metallurgica et Materialia, 41 (9), 2611-
2624.
Lebensohn, R. A., C. N. Tome (1994). A self-consistent viscoplastic model: prediction of
rolling textures of anisotropic polycrystals. Materials Science and Engineering A,
175 (1-2), 71-82.
Lebensohn, R. A. (1997). A self-consistent approach for modelling texture development of
two-phase polycrystals: Application to titanium alloys. Acta Materialia, 45 (9),
3687-3694.
Lee, B. H., S. H. Park., S. G. Hong., K. T. Park., C. S. Lee (2011). Role of initial texture
on the plastic anisotropy of Mg-3Al-1Zn alloy at various temperatures. Materials
Science and Engineering A, 528, 1162-1172.
Lee, S., Y. H. Chen., J. Y. Wang (2002). Isothermal formability of magnesium alloys
AZ31 and AZ61. Journal of Materials Processing Technology, 124, 19-24.
Löffler, A., S. Schumann., K. U. Kainer., B. Bronfirr (2007). Examination of the forming
properties of magnesium wrought alloys MRI-301F and AZ80A. 7th International
Conference Magnesium and their Applications. Edited by K. U. Kainer, WILEY-
VCH Verlag GmbH, 336-343.
Lopes, A. B. (2001). Análise Microestrutural das Instabilidades Plásticas em Materiais
Metálicos. Aveiro, PhD Thesis: 227: University of Aveiro.
Luo, A., A. K. Sachdev (2007). Development of a new wrought magnesium-aluminum-
manganese alloy AM30. Metallurgical and Materials Transactions A, 38A (6),
1184-1192.
Magnesium. http://en.wikipedia.org/wiki/Magnesium. (17. May 2011). Von
www.wikipedia.com: http://en.wikipedia.org/wiki/Magnesium abgerufen
Mikroskope. www.wie-tec.de. (31. July 2011). (Metaserv) Von www.wie-tec.de:
http://www.wie-tec.de/ abgerufen
Mohd Ruzi, H., M. Norhamidi., S. A. Baker., R. J. Khairul., M. N. N. Hafiez., A. Sufizar.,
M. I. I. Halim., Murtadhahadi (2009). A Review of workability of wrought
magnesium alloys. Universiti Kebangsaan Malaysia, Department of Mechanical
and Material Engineering. Bangi, Selangor: Advanced Manufacturing Research
Group.
Molinari, A., G. R. Canova., S. Azhi (1987). A self-consistent approach of the large
deformation polycrystal viscoplasticity. Acta Metallurgica, 12, 2983-2994.

Influence of the strain path change on the mechanical behavior of Mg alloys 2011
65
Mordike, B. L., T. Ebert (2001). Magnesium – applications – potential. Journal of Material
Science Engineering, A 302, 37-45.
Park, S. H., S. G. Hong., C. S. Lee (2010). Activation mode dependent {1 0 -1 2} twinning
characteristics in a polycrystalline magnesium alloy. Scripta Materialia, 62, 202-
205.
Pekguleryuz, M. O., A. A. Kaya (2003). Creep resistant magnesium alloys for powertrain
applications. Advanced Engineering Materials, 5 (12), 866-878.
Pekguleryuz, M. O., E. Baril., P. Labelle (2003). Creep resistant Mg-Al-Sr alloys. Journal
of Advanced Materials, 35 (3), 32-38.
Proust, G. C., C. N. Tome., A. Jain., S. R. Agnew (2009). Modeling the effect of twinning
and detwinning during strain-path changes of magnesium alloy AZ31. International
Journal of Plasticity, 25, 861-880.
Rauch, E. (2004). Effects of metal charateristics and experimental conditions on
dislocation self-organization. La Revue de Métallurgie-CIT/Science et Génie des
Matériaux , 1007-1019.
Sachs, G. (1928). Zur Ableitung einer Fleissbedingung. Zeichschrift der Verein Deutscher
Ingenieur, 72, 734.
Schmitt, J. H., E. L. Shen., J. L. Raphanel (1994). A parameter for measuring the
magnitude of a change of strain path: Validation and comparison with experiments
on low carbon steel. International Journal of Plasticity, 10 (5), 535-551.
Schumann, S., H. Friedrich., Y. Kojima., T. Aizawa., K. Higashi., S. Kamado (2003).
Current and future use of magnesium in the automobile industry. Material Science.
Forum, 419-422, 51-56.
Serkan, T., F. Ozturk., I. Kacar (2008). Review of warm forming of aluminum-magnesium
alloys. Journal of Materials Processing Technology, 207, 1-12.
Shen, E. (1988). PhD Thesis. Instituto Nacional Politécnico de Grenoble. Grenoble,
France: Instituto Nacional Politécnico de Grenoble.
Staroselsky, A., L. Anand (2003). A constitutive model for HCP materials deforming by
slip and twinning: application to magnesium alloy AZ31B. International Journal of
Plasticity, 19, 1843-1864.
Styczynski, A., Ch. Hartig., J. Bohlen., D. Letzig ( 2004). Cold rolling textures in AZ31
wrought magnesium alloy. Scripta Materialia, 50 (7), 943-947.
Taylor, G. I. (1938). Plastic strain in metals, J. Int. Met. 62, 307.

Influence of the strain path change on the mechanical behavior of Mg alloys 2011
66
Vieira, M. F. (1994). Solicitações Sequenciais em Cobre Policristalino: Comportamento
após Pré-deformação. Tese de Doutoramento. Faculdade de Engenharia. Porto.
Porto: Universidade do Porto.
Vincze, G. (2007). Investigation methodologies for metals used in forming process, PhD
thesis. University of Aveiro, Department of Mechanical Engineering. Aveiro:
University of Aveiro.
Wang, H., P. D. Wu., M. A. Gharghouri (2010). Effects of basal texture on mechanical
behaviour of magnesium alloy AZ31B sheet. Materials Science and Engineering A,
527, 3588–3594.
Wang, Y. N., J. C. Huang (2003). Texture analysis in hexagonal materials. Materials
Chemistry and Physics, 81, 11-26.
Watarai, H. (2005). Trend of research and development of Mg alloys. Science and
Technology Trends, 7, 84-97.
Wei, S. C. (2006). Mechanical properties and microstructure of magnesium alloy from
severe plastic deformation. Singapore: National University of Singapore.
Yang, Z., J. P. li., J. X. Zhang., G. W. Lorimer., J. Robson (2008). Review on research and
development of magnesium alloys. Acta Metallurgica Sinica. (English Letters), 21
(5), 313-328.
Yi, S. (2005). Texture development in magnesium and its alloys. Investigation on the
Deformation Behavior and the Texture Evolution in Magnesium Wrought Alloy
AZ31. PhD thesis. Technischen Universität Clausthal.
Yi, S. B., C. H. J. Davis., H. G. Brokmeier., R. E. Bolmaro., K. U. Kainer., J. Homeyer
(2006). Deformation and texture evolution in AZ31 magnesium alloy during
uniaxial loading. Acta Materialia, 54 (2), 549-562.
Yoo, M. H., J. R. Morris., K. M. Ho., S. R. Agnew (2002). Non-basal deformation modes
of HCP metals and alloys: Role of dislocation source mobility. Metallurgical and
Materials Transactions A, 33A, 813-822.
Zaoui, A. Physique et Mécanique de la Mise en Forme des Mataux, Eds. F. Moussy and
P. Franciosi, Press du CNRS, Paris, 1990, Cap. VI.4.

Influence of the strain path change on the mechanical behavior of Mg alloys 2011
67
Appendix 1
(Crystallographic Textures – Euler space representation)

Influence of the strain path change on the mechanical behavior of Mg alloys 2011
68
Figure A.1 – υ2 = 0o, 30o, 60o sections of Euler space for experimental texture of the as-received material (pole figure in
fig. 4.5 )
Figure A.2 - υ2 = 0o, 30o, 60o sections of Euler space for the material after tensile test up to the maximum uniform strain
at 0o (pole figure in fig. 4.6).

Influence of the strain path change on the mechanical behavior of Mg alloys 2011
69
Figure A.3 - υ2 = 0o, 30o, 60o sections of Euler space for the material after tensile test up to the maximum uniform strain
at 45o (pole figure in fig. 4.7).
Figure A.4 - υ2 = 0o, 30o, 60o sections of Euler space for the material after tensile test up to the maximum uniform strain
at 90o (pole figure in 4.8)

Influence of the strain path change on the mechanical behavior of Mg alloys 2011
70
Figure A.5 - Simulated (using VPSC code) υ2 = 0o, 30o, 60o sections of Euler space for the material after tensile test up
to the maximum uniform strain at 0o (pole figure 4.9).
Figure A.6 - Simulated (using VPSC code) υ2 = 0o, 30o, 60o sections of Euler space for the material after tensile test up
to the maximum uniform strain at 45o (pole figure 4.10).

Influence of the strain path change on the mechanical behavior of Mg alloys 2011
71
Figure A.7 – Simulated (using VPSC code) υ2 = 0o, 30o, 60o sections of Euler space for the material after tensile test up
to the maximum uniform strain at 90o (pole figure 4.11).
Figure A.8 - Experimental υ2 = 0o, 30o, 60o sections of Euler space for the material after reloading at 0o (pole figure 4.16)

Influence of the strain path change on the mechanical behavior of Mg alloys 2011
72
Figure A.9 - Experimental υ2 = 0o, 30o, 60o sections of Euler space for the material after reloading at 45o (pole figure in
4.17).
Figure A.10 - Experimental υ2 = 0o, 30o, 60o sections of Euler space for the material after reloading at 90o (pole figure
4.18).

Influence of the strain path change on the mechanical behavior of Mg alloys 2011
73
Figure A.11 - Simulated (using VPSC code) υ2 = 0o, 30o, 60o sections of Euler space for pre-deformed (up to around
0.07) and reloaded at 0o (pole figure 4.19)
Figure A.12 - Simulated (using VPSC code) υ2 = 0o, 30o, 60o sections of Euler space for pre-deformed (up to around
0.07) and reloaded at 45o (pole figure 4.20)

Influence of the strain path change on the mechanical behavior of Mg alloys 2011
74
Figure A.13 - Simulated (using VPSC code) υ2 = 0o, 30o, 60o sections of Euler space for pre-deformed (up to around
0.07) and reloaded at 90o (pole figure 4.21)

Influence of the strain path change on the mechanical behavior of Mg alloys 2011
75
Appendix 2
(Calculation of α-parameter)

Influence of the strain path change on the mechanical behavior of Mg alloys 2011
76
The α-value was calculated from the following equation
(A.1)
In the above equation the εp and εr are the pre-deformation and the reloading strain tensors
respectively.
For tensile test εij = 0 when i ≠ j and, therefore:
εp = [
] (A.2)
For a reloading tensile test at an angle θ away from the pre-deformation tensile direction,
the reloading strain tensor is given by:
(A.3)
and
(A.4)
(A.5)
(A.6)