sustainability workbook v12 cg - nielsen
TRANSCRIPT
Copyright ©2016 The Nielsen Company. Confidential and proprietary.
SUSTAINABILITYWORKBOOKSELF EVALUATION TOOL

Consumers are trying to be responsible citizens of the world, and they expect the same from corporations. So when it comes to purchasing, they are doing their homework.
How are you currently capitalizing on the sustainability imperative from consumers? What does it mean to be a sustainable consumer brand? Many companies are using their vast resources to support non-profits and civic organizations dedicated to sustainability. Others are sourcing materials in a manner that is more environmentally safe. Still others are taking smaller steps, such as recycling or installing energy efficient lighting.
To rise above the competition, companies should fully understand consumer expectations and learn what it means to position their brand as sustainable in the markets they care about most. This workbook walks you through some key trends in successfully marketed sustainable companies to help guide your thinking.
THE SUCCESS OF YOUR BUSINESS IS DIRECTLY RELATED TO THE HEALTH OF THE COMMUNITIES IN WHICH YOU OPERATE
By integrating sustainability into their business models, companies can both help society and increase goodwill toward their brands. Overall, the Global Survey of Corporate Social Responsibility and Sustainability confirms conventional wisdom that the market for sustainable goods continues to expand. There are of course variations by region, demographics and category. But what’s most clear is the opportunity for significant brand growth, on a global scale, for those willing to listen and respond to a new kind of consumer.
ABOUT THE GLOBALSURVEY METHODOLOGY The findings in this survey are based on respondents with online access in 60 countries (unless otherwise noted). While an online survey methodology allows for tremendous scale and global reach, it provides a perspective on the habits of only existing internet users, not total populations. In developing markets where online penetration is still growing, respondents may be younger and more affluent than the general population of that country. In addition, survey responses are based on claimed behavior, rather than actual metered data. Cultural differences in reporting sentiment are likely factors in the outlook across countries. The reported results do not attempt to control or correct for these differences; therefore, caution should be exercised when comparing across countries and regions, particularly across regional boundaries.
Copyright ©2016 The 2 Nielsen Company. Confidential and proprietary.

SUSTAINABILITY INFLUENCESPURCHASE INTENTWhen it comes to sales intent, commitment to the environment has the power to sway product purchase for 45% of global respondents surveyed. Commitment to either social value or the consumer’s community are also important (each influencing 43% and 41% of global respondents, respectively).
Every good project begins with a bit of a gut check. Below are the key purchase drivers that Nielsen‘s 2015 Sustainability Report uncovered.
Circle, honestly, how you feel about your own company, from a scale of: Strongly Disagree 1 - Strongly Agree 5
My product is made by a company that consumers trust 1 2 3 4 5
My product is known for its health & wellness benefits 1 2 3 4 5
My product is made from fresh, naturaland/or organic ingredients 1 2 3 4 5
My product is from a company known for being environmentally friendly 1 2 3 4 5
My product is from a company known for its commitment to social value 1 2 3 4 5
My product’s packaging is environmentally friendly 1 2 3 4 5
My product is from a company known for its commitment to the community 1 2 3 4 5
If your total score was:30-35: Congrats, you're really capitalizing on the sustainability trend. Read on to find new ways to enhance your already robust plans.20-29: You're on the right path to thinking about what consumers want in a sustainable product. What more could you be doing?19 and below: While you may have touched on themes of sustainability, you've still got a ways to go to really maximize your return on this trend. Make sure to pay special attention to page seven, which outlines ways to convey your sustainability efforts to consumers.
Copyright ©2016 The 3 Nielsen Company. Confidential and proprietary.
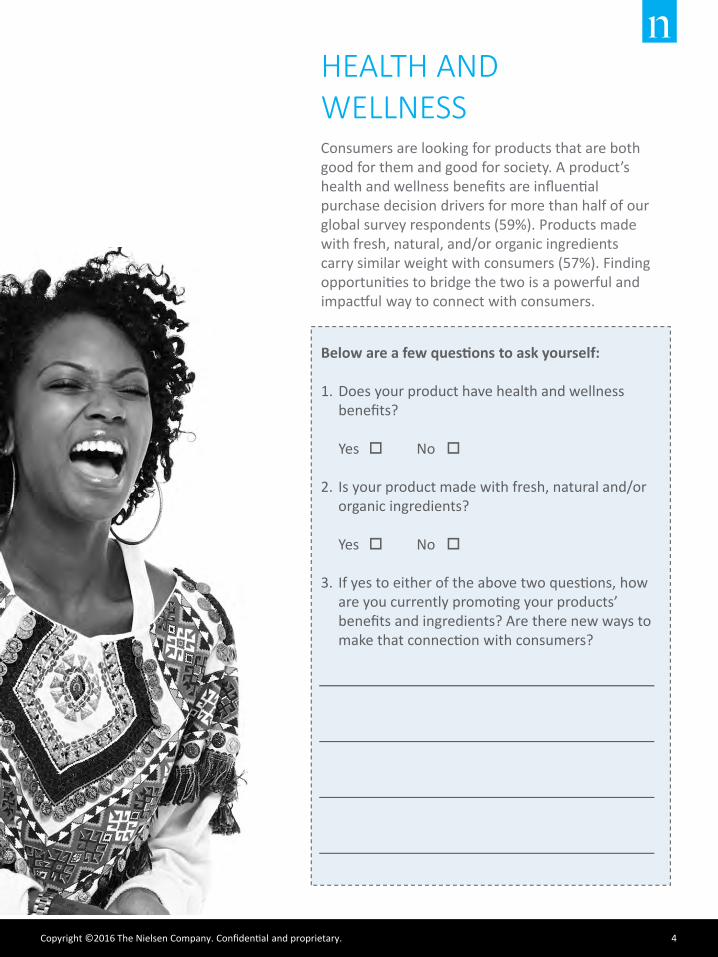
HEALTH AND WELLNESSConsumers are looking for products that are both good for them and good for society. A product’s health and wellness benefits are influential purchase decision drivers for more than half of our global survey respondents (59%). Products made with fresh, natural, and/or organic ingredients carry similar weight with consumers (57%). Finding opportunities to bridge the two is a powerful and impactful way to connect with consumers.
Below are a few questions to ask yourself:
1. Does your product have health and wellness benefits?
Yes No
2. Is your product made with fresh, natural and/or organic ingredients?
Yes No
3. If yes to either of the above two questions, how are you currently promoting your products’ benefits and ingredients? Are there new ways to make that connection with consumers?
Copyright ©2016 The 4 Nielsen Company. Confidential and proprietary.

It’s no longer just wealthy suburbanites in major markets willing to open their wallets for sustainable offerings. Consumers across regions, income level and categories are willing to pay more. Sixty-six percent of global respondents say they are willing to pay more for sustainable goods, up from 55% in 2014.
Sustainability sentiment is particularly consistent across income levels. Those earning $20,000 or less are actually 5% more willing than those with incomes greater than $50,000 to pay more for products and services that come from companies who are committed to positive social and environmental impact.
CONSUMERS WILLING TO PAY MORE FOR SUSTAINABLE GOODS
Who is your product’s core demographic?
What is that demographics’ income?
What are their purchase drivers?
Is there any opportunity to build your brand’s equity as a healthy, wellness-supporting tool?
How old are they?
Where do they live?
Ask yourself a few specific questions:
Sustainability is a leading factor in the relevance, viability and growth of your organization
DID YOU KNOW?
Copyright ©2016 The 5 Nielsen Company. Confidential and proprietary.
2015
2014
2013
50%
55%66%
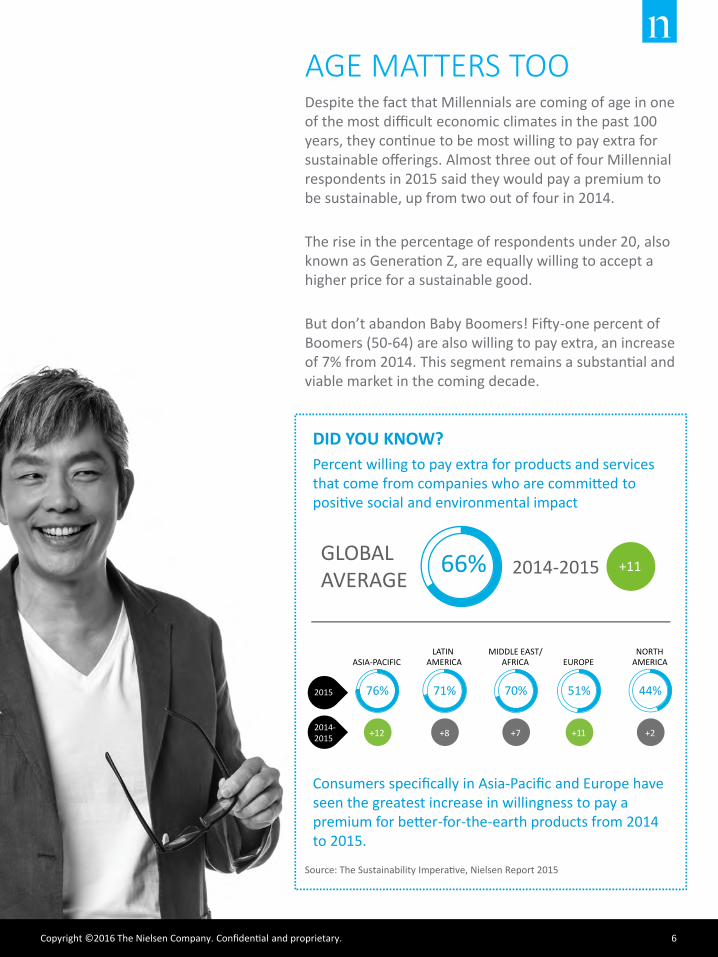
AGE MATTERS TOO
Percent willing to pay extra for products and services that come from companies who are commi ed to
ve social and environmental impact
DID YOU KNOW?
Source: The Sustainability Impera , Nielsen Report 2015
GLOBALAVERAGE 2014-2015
Consumers specifically in Asia-Pacific and Europe have seen the greatest increase in willingness to pay a premium for be er-for-the-earth products from 2014 to 2015.
+11
Despite the fact that Millennials are coming of age in one of the most difficult economic climates in the past 100 years, they con to be most willing to pay extra for sustainable offerings. Almost three out of four Millennial respondents in 2015 said they would pay a premium to be sustainable, up from two out of four in 2014.
The rise in the percentage of respondents under 20, also known as Genera Z, are equally willing to accept a higher price for a sustainable good.
But don’t abandon Baby Boomers! -one percent of Boomers (50-64) are also willing to pay extra, an increase of 7% from 2014. This segment remains a substan al and viable market in the coming decade.
Copyright ©2016 The 6 Nielsen Company. Confide l and proprietary.
ASIA-PACIFIC
76% 71%
MIDDLE EAST/AFRICA
70%
EUROPE
51%
NORTH AMERICA
44%2015
+12 +8 +7 +11 +2 2014-2015
LATIN AMERICA
66%

Demonstrating commitment to sustainability has become a basic cost of entry. Regardless of their degree of commitment, companies across the globe are finding ways to leverage sustainability as part of their marketing strategy.
Which strategy applies the most to you?
1. CLAIM ONLY: brand directly indicates a connection to sustainability on a product’s label or packaging
2. MARKETING ONLY: brand uses websites, news coverage, and other messaging vehicles to promote positive social and/or environmental impact in the local or global community
3. CLAIM + MARKETING: brand uses a product claim and also integrates sustainability into its marketing promotion
REACHING CUSTOMERS WHO CARE
Marketing social and environmental impact initiatives is the predominant strategy used to reach consumers. In 2014, 65% of total sales measured globally were from brands that used a “Marketing Only” tactic.
Integrating sustainability into your strategy enables responsible growth
DID YOU KNOW?
SOCIAL RESPONSIBILITY IS ONE OF THE MOST INFLUENTIAL FACTORS FOR CORPORATE REPUTATION FOR CONSUMER GOODS COMPANIES
Copyright ©2016 The 7 Nielsen Company. Confidential and proprietary.
29%
4%
65%
MARKETING ONLY
CLAIM + MARKETING
NONE
CLAIM ONLY 2%

However, claims are important to Millennials. In 2014, 51% of Millennials reported checking the product packaging for sustainability claims before making a purchase. And yet only 31% of total sales measured were from brands that provide those claims (either alone or supplemented with marketing). This indicates an opportunity to increase brand recognition among this key demographic at the point of purchase.
Causes global consumers care aboutDID YOU KNOW?
Note: Percent that indicate extreme concern among global respondents willing to pay extra for products from companies committed to positive social and environmental impact.
Source: Nielsen Global Survey of Corporate Social Responsibility, Q1 2014
Copyright ©2016 The 8 Nielsen Company. Confidential and proprietary.
Increasing Accessto Clean Water 67%
63% Improving Accessto Sanitation
63% Ensuring Environmental Sustainability
62% Eradicating Extreme Poverty and Hunger
52% Providing Greater Access to Immunizations
49%Promoting GenderEquality and Empowering Women
43%Increasing Access to Cultural Institutions (Such as the Arts, Museums and Performances)
58% Combating Non-Communicable Diseases
58% Reducing Child Mortality
56% Improving Maternal Health
56%Combating Hiv/Aids, Malaria and Other Diseases
51%Improving Accessto Science, Technology,Engineering and Math Training and Education
47% Increasing Access to Technology
42%Undertaking Development Projects That Benefit the Communities Around Their O�ces or Manufacturing Units
56% Providing Relief Following Natural Disasters
55% Achieving Universal Primary Education
54% Protecting Animals
54%Increasing the Focus of Sourcing ProductsWe Consume Sustainably
49% Promoting Racial, Ethnicand Cultural Inclusiveness
46% Support Small Business and Entrepreneurship
Copyright ©2016 The Nielsen Company. Confidential and proprietary.
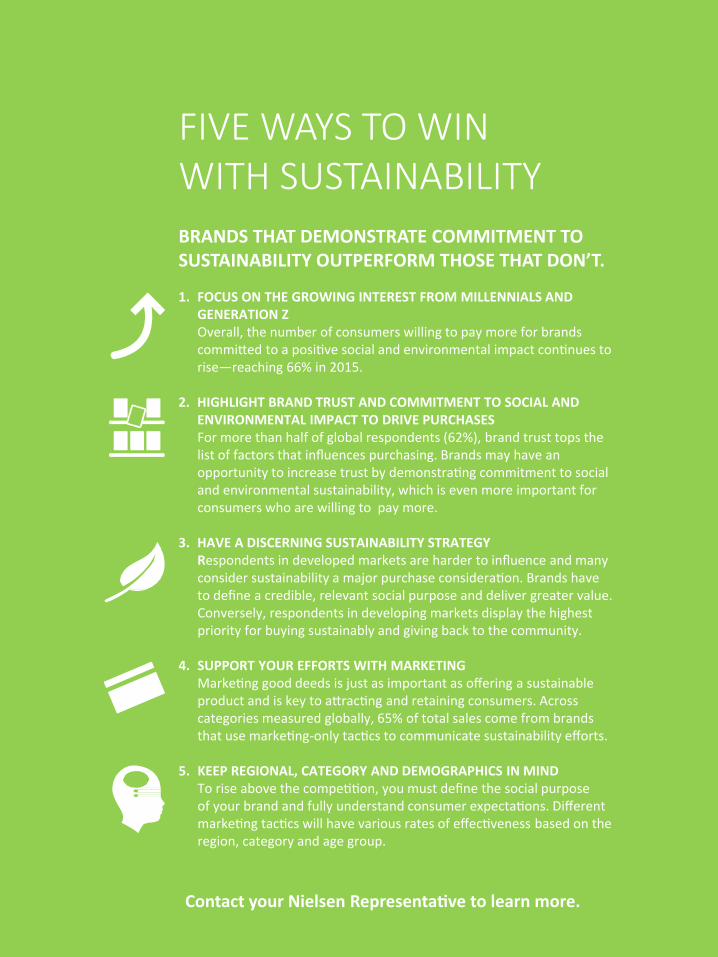
FIVE WAYS TO WINWITH SUSTAINABILITYBRANDS THAT DEMONSTRATE COMMITMENT TO SUSTAINABILITY OUTPERFORM THOSE THAT DON’T.
1. FOCUS ON THE GROWING INTEREST FROM MILLENNIALS AND GENERATION ZOverall, the number of consumers willing to pay more for brands committed to a positive social and environmental impact continues to rise—reaching 66% in 2015.
2. HIGHLIGHT BRAND TRUST AND COMMITMENT TO SOCIAL AND ENVIRONMENTAL IMPACT TO DRIVE PURCHASESFor more than half of global respondents (62%), brand trust tops the list of factors that influences purchasing. Brands may have an opportunity to increase trust by demonstrating commitment to social and environmental sustainability, which is even more important for consumers who are willing to pay more.
3. HAVE A DISCERNING SUSTAINABILITY STRATEGYRespondents in developed markets are harder to influence and many consider sustainability a major purchase consideration. Brands have to define a credible, relevant social purpose and deliver greater value. Conversely, respondents in developing markets display the highest priority for buying sustainably and giving back to the community.
4. SUPPORT YOUR EFFORTS WITH MARKETINGMarketing good deeds is just as important as offering a sustainable product and is key to attracting and retaining consumers. Across categories measured globally, 65% of total sales come from brands that use marketing-only tactics to communicate sustainability efforts.
5. KEEP REGIONAL, CATEGORY AND DEMOGRAPHICS IN MINDTo rise above the competition, you must define the social purposeof your brand and fully understand consumer expectations. Differentmarketing tactics will have various rates of effectiveness based on the region, category and age group.
Contact your Nielsen Representative to learn more.

*Argentina, Australia, Brazil, Chile, China, Colombia, Germany, India, Italy, Philippines, Russia, Singapore, South Korea, Thailand, UK, U.S. [1]
ABOUT THE NIELSEN GLOBAL STUDY
NIELSEN GLOBAL SURVEYThe Nielsen Global Survey of Corporate Social Responsibility and Sustainability was conducted between February 23-March 13, 2015, and polled more than 30,000 consumers in 60 countries throughout Asia-Pacific, Europe, Latin America, the Middle East, Africa, and North America. The sample has quotas based on age and sex for each country based on its Internet users, and is weighted to be representative of Internet consumers. It has a margin of error of ±0.6 percent. This Nielsen survey is based on the behavior of respondents with online access. Internet penetration rates vary by country. Nielsen uses a minimum reporting standard of 60 percent Internet penetration or an online population of 10 million for survey inclusion. The Nielsen Global Survey, which includes the Global Consumer Confidence Index, was established in 2005.
RETAIL SALES ANALYSISThe findings from the retail sales information included in this report are collected from stores using electronic point-of-sale technology and/or teams of local field auditors. The data represents a cross-section of 1,319 brands among 13 categories (both consumable and non-consumable categories) across an average of 13 countries* for the 12-month period ending December 2014. On average, the brands measured in this study represent 73% of 2014 value sales (USD) in each country-category analyzed (private label brands were not included). Stores within Nielsen’s worldwide retail network include grocery, drug, convenience and discount retailers, who, through various cooperation arrangements, share their sales data with Nielsen.
Copyright ©2016 The 10 Nielsen Company. Confidential and proprietary.

ABOUT NIELSENNielsen Holdings plc (NYSE: NLSN) is a global performance management company that provides a comprehensive understanding of what consumers watch and buy. Nielsen’s Watch segment provides media and advertising clients with Total Audience measurement services for all devices on which content – video, audio and text is consumed. The Buy segment offers consumer packaged goods manufacturers and retailers the industry ‘s only global view of retail performance measurement. By integrating information from its Watch and Buy segments and other data sources, Nielsen also provides its clients with analytics that help improve performance. Nielsen, an S&P 500 company, has operations in over 100 countries, covering more than 90% of the world’s population.
For more information, visit www.nielsen.com
Copyright © 2016 The Nielsen Company. All rights reserved. Nielsen and the Nielsen logo are trademarks or registered trademarks of CZT/ACN Trademarks, L.L.C. Other product and service names are trademarks or registered trademarks of their respective companies. 16/9523
Copyright ©2016 The 11 Nielsen Company. Confidential and proprietary.