superior & profitable growth in a fast-changing world
TRANSCRIPT
1
Superior & profitable growth in a fast-changing worldFebruary 2021

2
Disclaimer
This presentation contains forward-looking statements with regard to the financial position and results of HEINEKEN’s activities.
These forward-looking statements are subject to risks and uncertainties that could cause actual results to differ materially from those
expressed in the forward-looking statements.
Many of these risks and uncertainties relate to factors that are beyond HEINEKEN’s ability to control or estimate precisely, such as
future market and economic conditions, developments in the ongoing COVID-19 pandemic and related government measures, the
behaviour of other market participants, changes in consumer preferences, the ability to successfully integrate acquired businesses
and achieve anticipated synergies, costs of raw materials, interest-rate and exchange-rate fluctuations, changes in tax rates, changes
in law, change in pension costs, the actions of government regulators and weather conditions. These and other risk factors are
detailed in HEINEKEN’s publicly filed annual reports. You are cautioned not to place undue reliance on these forward-looking
statements, which speak only of the date of this presentation.
HEINEKEN does not undertake any obligation to update these forward-looking statements contained in this presentation. Market
share estimates contained in this press release are based on outside sources, such as specialised research institutes, in combination
with management estimates.

3
FY 2020 performance Strategic review
Agenda

4
FY 2020 performance Strategic review
Agenda

5
A year of profound impact and transition
People at the heart of our response
Our People
Our Customers
Our Consumers
Our Communities
Top decile employee engagement #SocialiseResponsibly campaigns
c. €50m rental waivers for bars >€23m donations
6
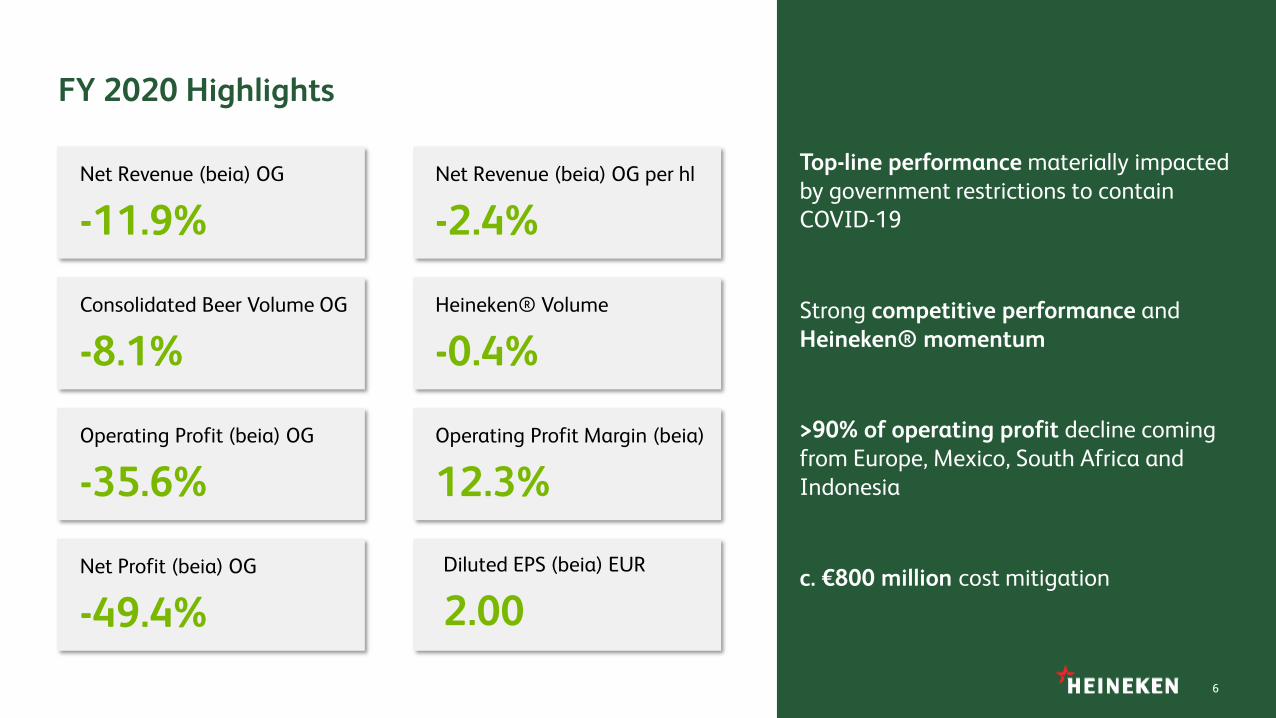
FY 2020 Highlights
Consolidated Beer Volume OG
-8.1%
Heineken® Volume
-0.4%
Net Revenue (beia) OG
-11.9%
Net Revenue (beia) OG per hl
-2.4%
Operating Profit (beia) OG
-35.6%
Operating Profit Margin (beia)
12.3%
Net Profit (beia) OG
-49.4%
6
Top-line performance materially impacted by government restrictions to contain COVID-19
>90% of operating profit decline coming from Europe, Mexico, South Africa and Indonesia
c. €800 million cost mitigationDiluted EPS (beia) EUR
2.00
Strong competitive performance andHeineken® momentum

7
AMEE Region
Strong recovery in NIGERIA in second half, growing volume FY and winning
market share. Double-digit growth in premium, led by Heineken® and Tiger
SOUTH AFRICA strong momentum disrupted by alcohol bans and capacity
constraints. Heineken® 0.0 grew double-digits
PREMIUM PORTFOLIO outperformed broader portfolio in most key markets
like Nigeria, Ethiopia, Russia, the DRC, Ivory Coast, Burundi and Mozambique
Net Revenue (beia) OG
-9.5%
Operating Profit (beia) OG
-33.8%
Price Mix on constant geographic
basis
+2.2%
Beer Volume OG
-9.2%
7

8
Americas Region
MEXICO government restrictions and dry laws eased in second half. Strong
price mix c. 2x inflation. Amstel Ultra, Heineken® 0.0 and cider grew strongly
BRAZIL volume flat while hitting maximum capacity in Q4. Rev per hl growth in
the low teens. Premium and mainstream grew double-digits, now 50% of the
beer portfolio led by Heineken® with >40% growth
USA impacted by supply disruptions and on-premise closures. Heineken® grew
low single-digit, the best performance in a decade. Heineken® 0.0 is #1 in
non-alcohol8
Net Revenue (beia) OG
-2.9%
Operating Profit (beia) OG
-4.8%
Price Mix on constant geographic
basis
+6.8%
Beer Volume OG
-7.5%

9
APAC Region
VIETNAM volume was stable, significantly outperforming the market and
confirming our market leadership. Mainstream grew double-digits with Larue
and Bia Viet. Heineken® Silver doubled its volume.
CHINA strong double-digit Heineken® growth. Now in the top five markets
for the brand globally
INDONESIA heavily impacted by absence of tourism and on-trade
restrictions. Outperformed the market in all regions, except Bali
Net Revenue (beia) OG
-11.5%
Operating Profit (beia) OG
-16.4%
Price Mix on constant geographic
basis
-2.4%
Beer Volume OG
-7.9%
9

10
Europe Region
High exposure to ON-TRADE heavily impacted results, particularly in Q2
and Q4
OFF-TRADE continued to grow, driven by premium with strong performance
of Desperados, Birra Moretti and Sol. Outperformed the market in UK, Italy,
France, Spain, Poland and the Netherlands
NON-ALCOHOL portfolio outperformed the market led by Heineken® 0.0,
strengthening our leadership in the segment
Net Revenue (beia) OG
-18.8%
Operating Profit (beia) OG
-68.6%
Price Mix on constant geographic
basis
-5.4%
Beer Volume OG
-8.2%
10

11
Double-digit growth markets
25
Heineken® volume
-0.4%
Heineken® 0.0 markets
84
11
Heineken®: The most trusted international brand
More than 40% growth in Brazil and impressive start of Heineken® 0.0, now #3 globally
Heineken® 0.0 grew double-digits and was launched in 27 new markets
Heineken® Silver more than doubled its volume in Vietnam and was launched in China
Excluding South Africa, Heineken® volume grew 2.8%

12
E-Commerce acceleration @ Beerwulf
Nearly doubled revenue versus last year
FebJan Mar JunMayApr AugJul Sep Oct Nov DecDec
Beerwulf Net Revenue (beia)per month
Tripled # of orders across all platforms
2020
5x

13
Financial Overview
13
Key Financials€m unless otherwise stated FY 2020
Total Growth
Organic Growth
Revenue 23,770 -16.7%
Net revenue (beia) 19,724 -11.9%
Operating profit (beia) 2,421 -35.6%
Operating profit (beia) margin 12.3% -455 bps
Net profit (beia) 1,154 -49.4%
Net loss -204 -109.4%
Diluted EPS (beia) in € 2.00 -54.3%
Free operating cash flow 1,513
Net Debt/EBITDA (beia) ratio 3.4x

1414
Top-line impacted by COVID-19Net Revenue (beia): 11.9% organic decline
€m23,894
FY 2019 Net Revenue
(beia)
Total Volume Net rev/hl
5.3%
CurrencyTranslation
0.2%
ConsolidationImpact
19,724
FY 2020 Net Revenue
(beia)
€m
Organic decline
€2,853m
-9.8%Volume OG1
-2.4%Net rev/hl OG1

1515
1. ‘Variable expenses’ include input costs, goods for resale, transportation and other variable expenses2. ‘Cost mitigation’ includes selling & marketing expenses, repair & maintenance, personnel expenses, energy & water, other fixed expenses3. ‘Other’ includes other P&L items of which Depreciation & Amortization represent >90% of this effect
Diligent action on costs to mitigate the impactOperating Profit (beia): 35.6% organic decline
4,020
2,421
FY 2020 Operating
Profit (beia)
Currency Translation
Others3Net Revenue less Variable
Expenses1
c. 2,055
FY 2019 Operating
Profit (beia)
c. 800
CostMitigation2
c. 175129 40
Consolidation Impact
€m
€m
Organic decline €1,430m
>90% - EUR, MX, SA & ID

16
c. €800m
38%Personnelcosts
57%Marketing & Sales spend
5%Other
1. Excludes the effects on input costs, goods for resale, transport and depreciation
Cost mitigation represented net reduction of c. 9% of addressable fixed cost base1
Sharp resource allocation towards growth brands, D&T foundational platforms and selected routes to market
Most cost mitigations are non-repeating benefits
Balanced reduction of discretionary expenses

17
Total EIAs
€1,643m
€331mRestructuring
€273mAmortisation
€963mImpairment
€76mOther
Impairments driven by COVID
Amortisation comparable to previous years
Restructuring charges mainly associated with organisational redesign
Exceptional items and amortisation of acquisition-related intangible assets on operating profit

18
2,228
1,513
1,663
339
486
123
Cash flow from operations1
FY 2019 FOCF
Working Capital Capex2 Interest, dividend & income tax
FY 2020 FOCF
€m
€m
FOCF impact mitigated by reduction of non-committed CAPEXFree Operating Cash Flow: €1,513 million
1. Cash flow from operations before changes in working capital and after provisions and post-retirement obligations2. Cash flow (used in/)from operational investing activities

19
Committed to long term target <2.5xNet Debt/EBITDA (beia)
19
3.3
2.6
2.2 2.2
2.82.6 2.5 2.4 2.3
2.52.3
2.6
3.4
112008 14 202009 1510 12 13 16 17 18 19
Long term target
20
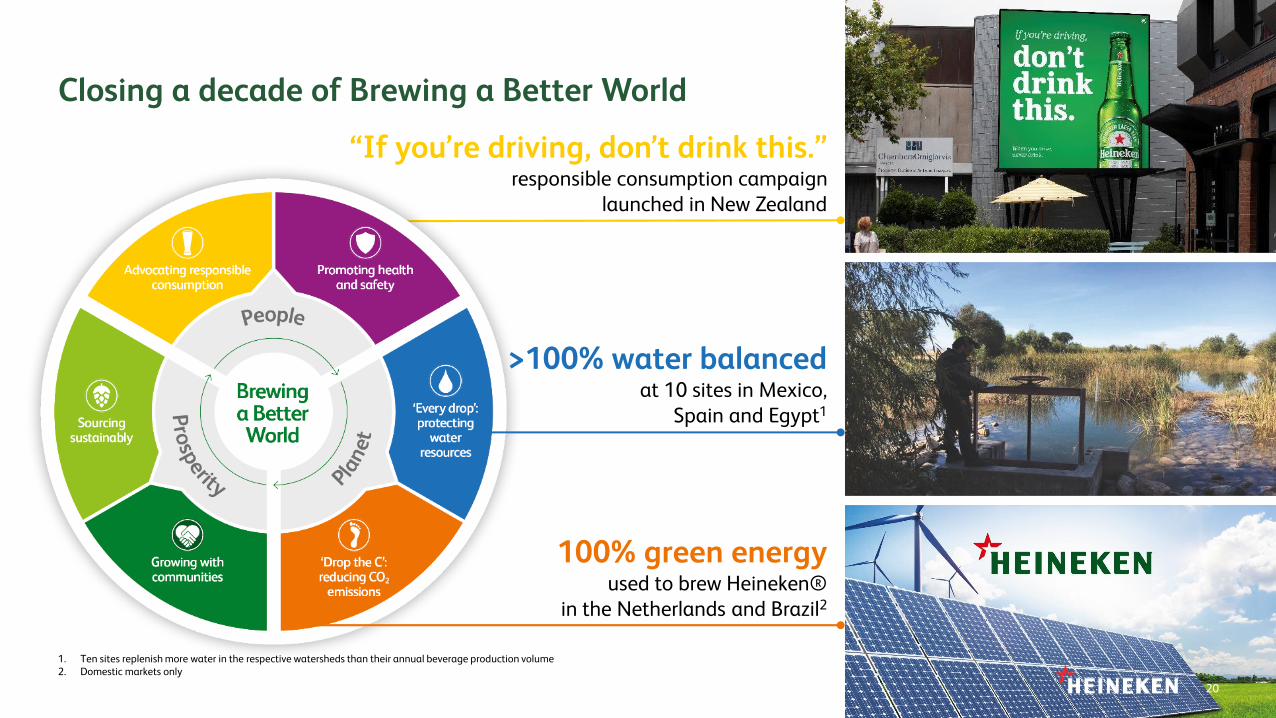
Closing a decade of Brewing a Better World
“If you’re driving, don’t drink this.”responsible consumption campaign
launched in New Zealand
>100% water balancedat 10 sites in Mexico,
Spain and Egypt1
100% green energyused to brew Heineken®
in the Netherlands and Brazil2
20
1. Ten sites replenish more water in the respective watersheds than their annual beverage production volume2. Domestic markets only

21
Product & channel mix to continue to adversely impact results
For 2021, we expect
Pandemic to continue to impact first half of 2021
Conditions to gradually improve in second half 2021
Revenue, operating profits and margin to stay below 2019 level
A higher negative transactional currency impact on input costs
21

22
A year of profound impact and transition
Impact of COVID-19, amplified by on-trade and geography
Strong balance sheet and dividend in line with policy
22
Sharp mitigating actions while continuing to invest for the future
Strong competitive performance and Heineken® momentum
Solid results of Brewing a Better World 2020

23
FY 2020 performance Strategic review
Agenda

24
Navigate the crisis,
while BUILDING THE FUTURE
24

25
Future proof HEINEKEN
Invest in new sources of growth & restore operating leverage
NURTURING OUR
CULTURE WHILE
BOOSTING
ADAPTABILITY
BUILDING ON
STRENGTHS, ADDRESSING
VULNERABILITIES
A MULTI-YEAR,
MULTI-DIMENSIONAL
JOURNEY
SUPERIOR & PROFITABLE
GROWTH IN A FAST-
CHANGING WORLD
25

26
Framing our way forward: HEINEKEN growth algorithm
Our unique strengths & opportunities Continuous
productivity improvements
Superior growth
Raise the bar on Sustainability &
Responsibility and People strategy
Long-term value creation Acceleratedinvestments
& sharper resource
allocation
27
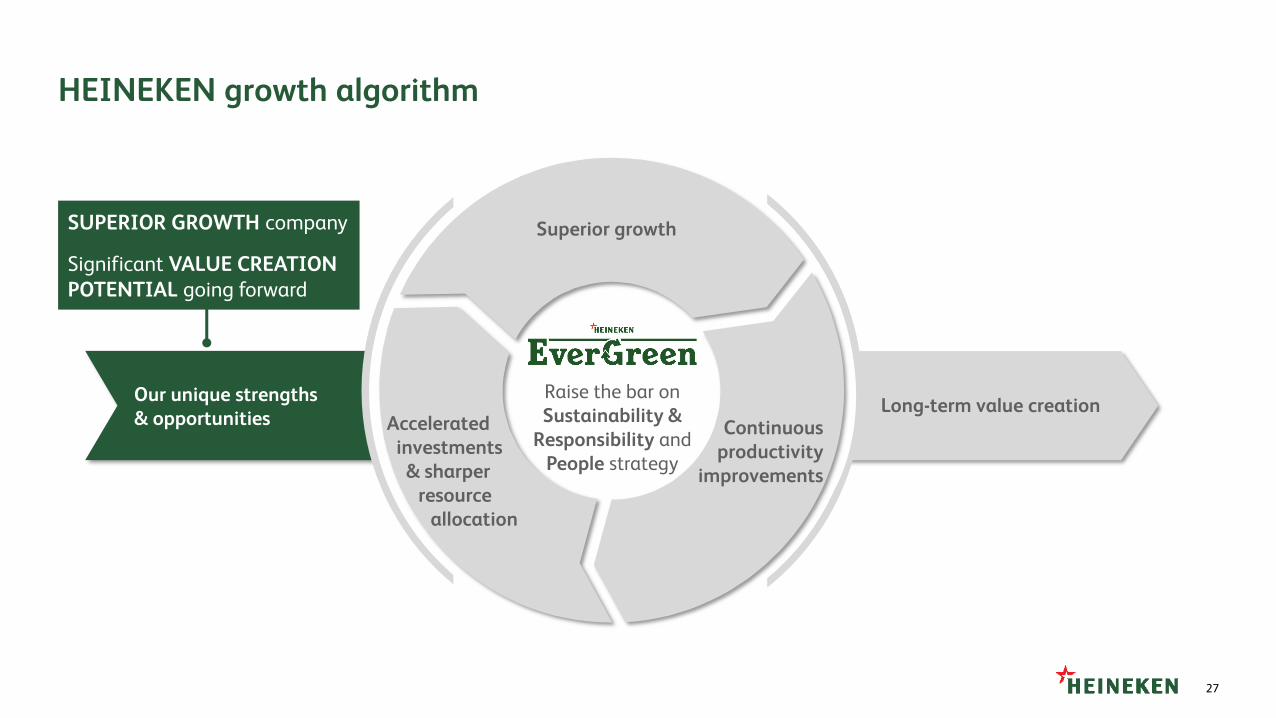
HEINEKEN growth algorithm
Our unique strengths & opportunities Continuous
productivity improvements
Superior growth
Raise the bar on Sustainability &
Responsibility and People strategy
Long-term value creation
SUPERIOR GROWTH company
Significant VALUE CREATION POTENTIAL going forward
Acceleratedinvestments
& sharper resource
allocation

28
Building on a strong foundation
A growth company, innovating and pioneering in the beer industry
Our long-term focus rooted in our 156-year history
OpCo centric, entrepreneurial model driven by 80+ OpCos
HEINEKEN values, quality and people centric culture
Heineken® brand present in over 190 markets
28
29
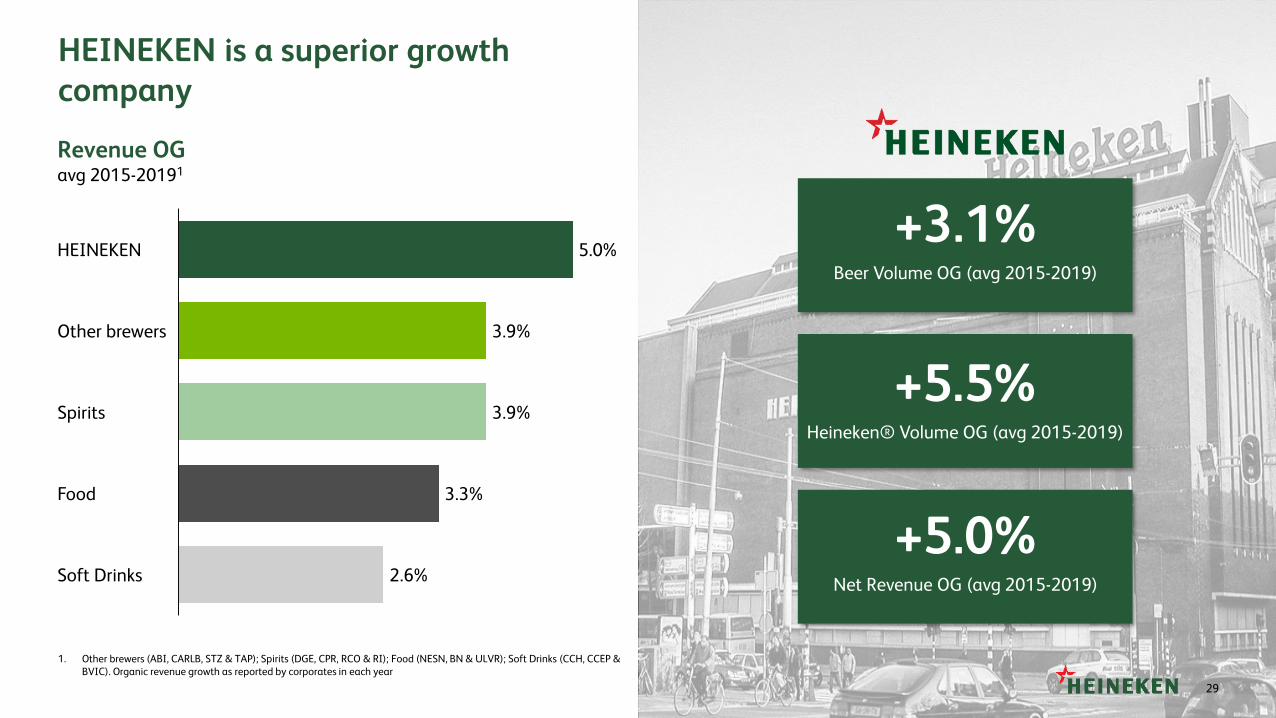
3.9%
3.3%
Soft Drinks
HEINEKEN
Other brewers
Spirits
3.9%
Food
5.0%
2.6%
Revenue OGavg 2015-20191
+5.5%Heineken® Volume OG (avg 2015-2019)
HEINEKEN is a superior growth company
+3.1%Beer Volume OG (avg 2015-2019)
+5.0%Net Revenue OG (avg 2015-2019)
29
1. Other brewers (ABI, CARLB, STZ & TAP); Spirits (DGE, CPR, RCO & RI); Food (NESN, BN & ULVR); Soft Drinks (CCH, CCEP & BVIC). Organic revenue growth as reported by corporates in each year

30
Diversified global footprint geared for growth… …with known challenges to address
Value dilutive operations
Exposure to FX volatility
Significant deals
Operating Companies
Joint Ventures / Associates
Licences
Export
Reduced inorganic headroom

31
Winning premium brand portfolio…
5.5% 20.8%
Heineken® International brands
Tiger
18.2%
Local premium champions
+60bps
Expected volume growth of HEINEKEN premium vs. 3.6% overall premium beer market1
…to capture the growing opportunity in premium
Source: Global Data, Statista
Volume OG (avg 2015-2019)
>100m People entering the middle class each year
Volume OG (avg 2015-2019)2 Volume OG (avg 2015-2019)3
>40% of total beer revenue from premium in 2019
1. Expected 2021-2025. Methodology: HEINEKEN 2019 footprint and stable market share in each country going forward2. Organic volume growth of Tiger3. Organic volume growth of Ichnusa

32
Global market leader in 0.0…
New consumer segments & occasions
Penetration uplift potentialin the medium / long term1
1.2x
Blurring beverage landscape
Flavoured alcoholic beverages volume growth potential1
5.5x
0.0 flourishing
Non-alcoholic beer long term volume growth potential1
5.2x
1. Assumes closing the penetration gap vs. the benchmark; for FAB the US market is used as benchmark, for Low Alcohol Spain and for underserved segments gaps in consumption looking at gender, age and affluency
…and substantial market opportunity to expand beer and move beyond
Women, affluent, older and young generation
~1.4x Total market share 0.0 versus fair share
16
38
57
84
2017 18 19 2020
Heineken® 0.0 # of markets
Source: Global Data
replace

33
Our OpCo-centric model is a competitive advantage…
33
...with value creation opportunity by leveraging our scale
CONTINUOUS PRODUCTIVITY improvement
More focused PORTFOLIO STRATEGY
Foster CROSS-OPCO learnings
High PROXIMITY resulting in deep UNDERSTANDING of local customers and consumers
LOCAL accountability, entrepreneurship, adaptability and agility
Faster COMMON PLATFORMS adoption

34
Pre-COVID margin stagnation…
0
10
20
162015 17 18 2019
Marketing & Sales spend% of revenue2
Operating profit margin% of revenue2
Gross profit margin1
% of revenue2
…with slipping Marketing & Sales spend
1. GP Margin is calculated as Net Revenue minus Raw Materials, Non-Returnable Packaging, Goods for Resale, Inventory Movements, Transport Expenses and Energy & Water
2. 2015 & 2016 restated based on pro-rata (of revenue) of 2017 restatement adjustments for IFRS 15
16
0
20
172015 16 18 20190
50
65
182015 16 17 2019

35
16.8%
12.3%
2019 2020
Continued COST PRESSURE from inflation, commodities
and significant transactional currency effects
Steep DROP IN REVENUE with VARIABLE RECOVERY
OPERATIONAL DELEVERAGE amplified by impact in
Europe on-trade, which will take time to fully recover
Operating profit margin development% of revenues
Deep COVID impact… …stretching beyond 2020

36
A foundation in Digital & Technology…
27% ERP standardisation completed since 2017
>€1bn Net revenue from B2B platforms
Kick-started standardisation
Strong eCommerce momentum
Remaining IT backlog
8 BASE go-lives in 2020, all done remotely
35 ERP systems
Limited re-use of applications across OpCos
Limited current scale of B2B and B2C platforms
Potential disruption of fragmented trade channels
>3x Number of orders in D2C in 2020 vs. 2019
…and opportunity to further unify IT & capture full eCommerce potential

37
Employees
Society
Industry
Institutions
Communities
Consumers
Source: Nielsen 2018, Edelman Trust Barometer 2020
…ready to raise our ambition towards 2030
Solid results on Brewing a Better World1 2020 targets…
33% REDUCTION VERSUS 2008 of average water consumption to 3.4 hl/hl in all breweries, and to 3.1 hl/hl in water-stressed areas
ACCIDENT FREQUENCY REDUCED BY 58% versus 2015 to 0.58 accidents per 100 FTE
58% of our main agricultural raw materials came
FROM SUSTAINABLE SOURCES
55% OF MARKETS in scope invested >10% OF HEINEKEN® MEDIA SPEND in responsible consumption campaigns2
51% REDUCTION IN CO2 EMISSIONS in our breweries since 2008, down to 5.1 kg CO2-eq/hl
Our operating companies contributed >€36M TO LOCAL COMMUNITIES in 20203
1. More comprehensive details in Annual Report2. Due to COVID-19, we expanded the scope of our commitment with Heineken® “Back to the bars #socialiseresponsibly”
campaign. Including this campaign, 98% of markets in scope invested at least 10% of Heineken® media spend3. Including cash and in-kind donations, employee time and management costs

38
Strong culture and healthy organisation climate…
…with opportunities to boost external orientation and capability building
OUTSTANDING employee engagement
Strong values built on TRANSPARENCY, TRUST and RESPECT
NO-NONSENSE ‘Deliver the Goods’ MENTALITY
SPEED, AGILITY & EXTERNAL orientation
TALENT and CAPABILITY management
Networked ORGANISATION
Source: Employee survey

39
IN A NUTSHELL: HEINEKEN is a superior growth company, with significant value creation potential going forward
Accelerate IT SIMPLIFICATION and capture full E-COMMERCE potential
Raise our BREWING A BETTER WORLD AMBITION towards 2030
Enhance our PORTFOLIO and strengthen our DIGITAL ROUTE TO CONSUMER, with CONSUMERS and CUSTOMERS at the core
Drive SPEED, AGILITY & EXTERNAL ORIENTATION in our organisation
Complement GROWTH with increased PRODUCTIVITY FOCUS

40
Our unique strengths & opportunities
Long-term value creation Continuous
productivity improvements
Superior growth
Raise the bar on Sustainability &
Responsibility and People strategy
HEINEKEN growth algorithm Recover TOP-LINE post pandemic
Drive SUPERIOR GROWTH with CONSUMERS & CUSTOMERS at the core
Acceleratedinvestments
& sharper resource
allocation

41
HEINEKEN is first and foremost a growth company
Strengthen and optimise our footprint to maintain a growth advantage
Focus and expand our portfolio to better serve consumers
Drive intentional resource allocation towards growth
Footprint Portfolio
Scale execution excellence through commercial capability building
Commercial execution
Shape and strengthen our route to consumer digitally
Route to consumer Resource allocation
Our 5 pillar growth strategy has consumers and customers at its core

42
Strengthen and optimise our global footprint to maintain our growth advantage
Strengthen our #1 and #2
positions
Resolve value dilutive
operations
Greenfield expansion into new
growth markets
Myanmar
Ethiopia
Colombia
Ivory Coast
Mozambique
Markets with #1 or #2 positions HEINEKEN and JV partners Other markets White spaces Greenfield / acquisition market entry
Ecuador2019
Peru2020
2019
2016
2017
2015
2014
Philippines2016
Australia2021

43
International brandsHeineken® Local premium champions
Win value share, everywhere Scale and replicate success Fewer, bigger bets
Amplify our strong premium position

44
Expand our portfolio and innovate to better serve consumers
Make 0.0% beer available everywhere, always
Scale Heineken® 0.0 leadership
Extend 0.0 options across entire portfolio
Move beyond beer to serve consumers better
Expand leadership in Cider
Speed up to take above fair share in Hard Seltzers globally
Expand beer to new consumer needs & occasions
Step-up to meet the growing demand for easy to drink and refreshing beer

45
Become the best-connected brewerStrengthening our Route to Consumer, digitally enabled
Digitally connect all our customers via B2B, with €10Bn revenue in 2025
1
Full sales force digitally empowered by 2023
2
Shaping our “Connected Bar” strategy, which includes ePOS deployments in key markets
3
4 Invest selectively in D2C, with focus on Beerwulf, SIX to Go and Drinkies
Channels Consumers
Distributor / Wholesalers Fragmented
Trade
Modern TradeDigitally Empowered Salesforce
B2B platforms
1 2
Distributors / Wholesalers
eRetail
Connected Bar
D2C
B2B
iDDM5 Touch all consumers with Individual
Data Driven Marketing
1
3
4
5

46
Continuous productivity
improvements
Superior growth
Raise the bar on Sustainability &
Responsibility and People strategy
HEINEKEN growth algorithm
Launch ambitious PRODUCTIVITY PROGRAMME
Embed a COST-CONSCIOUS culture
Our unique strengths & opportunities
Long-term value creation Acceleratedinvestments
& sharper resource
allocation
47
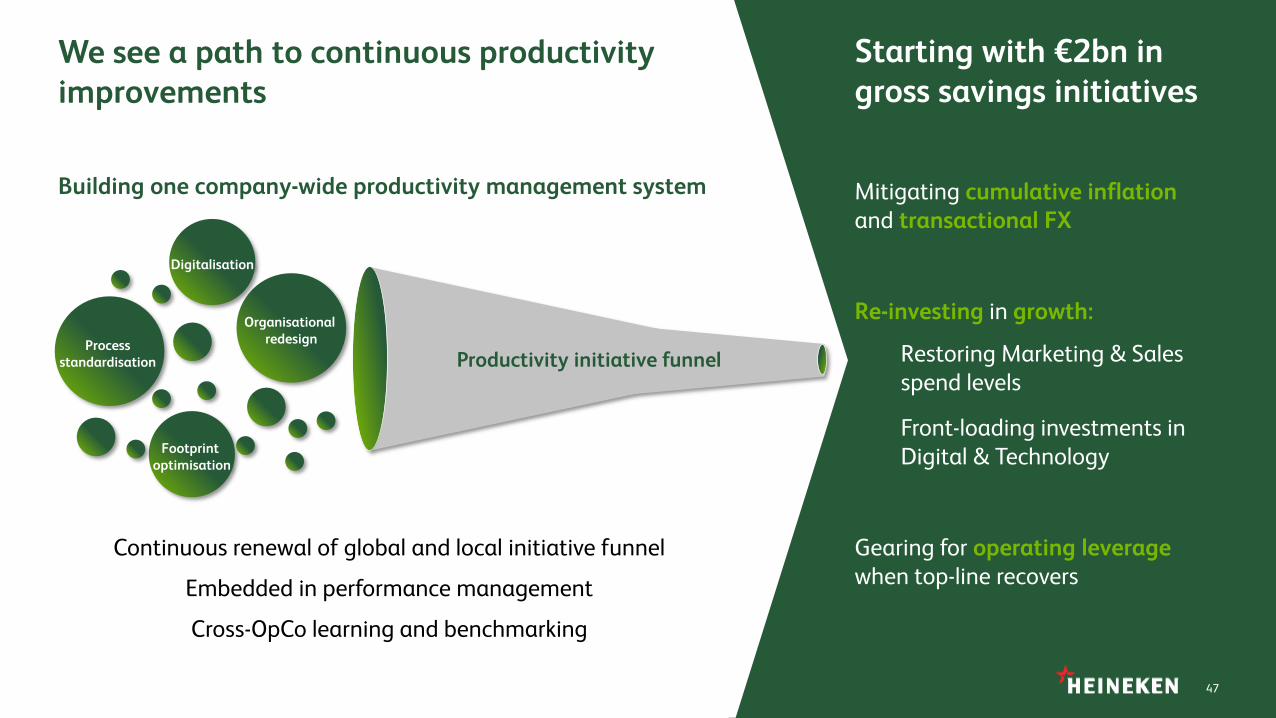
Footprint optimisation
Process standardisation
Digitalisation
Organisational redesign
We see a path to continuous productivity improvements
47
Mitigating cumulative inflation and transactional FX
Gearing for operating leverage when top-line recovers
Restoring Marketing & Sales spend levels
Front-loading investments in Digital & Technology
Re-investing in growth:
Continuous renewal of global and local initiative funnel
Embedded in performance management
Cross-OpCo learning and benchmarking
Starting with €2bn in gross savings initiatives
Building one company-wide productivity management system
Productivity initiative funnel

48
Three key productivity areas to deliver the €2bn gross savings
1. Excluding savings on other fixed costs (e.g. travel, infrastructure)2. In 2020 restructuring costs amounted to €331 million, mainly related to this programme
Organisational redesign
€350mdirect personnel cost savings1
~8,000 FTE impacted
Three year programme: implemented over 2021-2023
Commercial effectiveness
Media ROI
Digital-enabled sales excellence
COGS efficiency
Complexity reduction (SKUs)
Conversion excellence
€420m restructuring costs2 Non-consumer facing spendLogistics optimisation
Total cost to achieve: ~€500m OPEX and ~€400m CAPEX

49
16.8%
Operating Margin2019
12.3%
Operating Margin 2020
Topline Growth Cumulative inflation
Productivity Savings1
Reinvestments
Margin recovery
to +/-17%
Operating Margin2023
Recover operating margin by 2023 and gear for operating leverage beyond
COVID recovery
Gradual on-trade recovery
Accelerated premiumisation
€2bn gross savings Restore Marketing & Sales spend levels
Front-load D&T investments
Includes transactional FX
INDICATIVE
Commercial productivity
savingsCommercial productivity
reinvestments
1. Excludes 2020 cost mitigations

50
HEINEKEN growth algorithm
Continuous productivity
improvements
Superior growth
Raise the bar on Sustainability &
Responsibility and People strategy
Our unique strengths & opportunities
Long-term value creation
Restore and sharpen CONSUMER & CUSTOMER FACING INVESTMENTS
Frontload DIGITAL & TECHNOLOGY
DISCIPLINED use of CAPITAL
Acceleratedinvestments
& sharper resource
allocation

51
Accelerate our investments and make them work harder
Marketing & Sales
New consumer propositions & occasions
Fewer, bigger brands
Growing customers and channels
Restore 2019 spend % by 2023 Fully reinvest commercial productivity gains
Digital & Technology
Digital core & backbone
Advanced analytics & BI
Digital route to consumer
Front-load investments to accelerate transformation & build a future-proof HEINEKEN

52
Sharper and more deliberate marketing and sales spend allocation
Optimise spend within OpCos Focus spend between OpCos
APAC example1
~25BRANDS SELECTED focusing on premium
Up to 4xINCREMENTAL
marketing spend in each
Europe example
60DEPRIORITIZED BRANDS
+90bpsQUICK RECOVERY markets,
2021 vs 2020
-110bpsDELAYED RECOVERY markets,
2021 vs 2020
52
1. Marketing & sales spend as % of revenue

53
Disciplined use of capital
Improve operating capital efficiency and cash flow conversion
Rigorous financial discipline towards investments
Committed to Net Debt to EBITDA ratio <2.5
Sustain healthy dividend pay-out of 30-40% of Net Profit (beia)
1
2
3
4
53

54
HEINEKEN growth algorithm
Continuous productivity
improvements
Superior growth
Our unique strengths & opportunities
Long-term value creation Raise the bar on Sustainability &
Responsibility andPeople strategy
LAUNCH OF S&R 2030 ambition later in 2021
LEVERAGE OUR PEOPLE STRENGTHS to evolve our CULTURE, CAPABILITIES and OPERATING MODEL
Acceleratedinvestments
& sharper resource
allocation

55
Sustainability & Responsibility focus areas in the next decade
Social sustainabilityEnvironmental sustainability Responsible consumption
Carbon
Water
Circularity
Always a Choice
Moderation
Transparency
Inclusion & Diversity
Fairness & Safety
Community
Launch of S&R 2030 ambition and programme later in 2021

56
Raise the bar on our people strategy
Boost capability buildingStrengthen culture Enhance OpCo centric model
High speed and agility
Consumer & external orientation
Cost conscious culture
Disciplined entrepreneurship
Common ways of working
Cross-silo learning culture
Inclusion & diversity
Strong local talent pipeline
Foundational & spiky capabilities

57
“Disciplined entrepreneurship”: getting the balance right
Framework
Alignment
Focus
Common process
Internally collaborative
Freedom
Empowerment
Explore
Local relevance
Externally competitive

58
Stacey TankChief Corporate Affairs & Transformation Officer
ET member since: June 2020Years in company: 41
Renewed Executive Team
Dolf van den Brink
Chief Executive Officer &Chairman of the Executive Board
ET member since: April 2018Years in company: 23
Laurence Debroux
Chief Financial Officer &Member of the Executive Board
ET member since: April 2015Years in company: 6
Jacco van der LindenPresident Asia Pacific
ET member since: June 2020Years in company: 21
Søren HaghPresident Europe
ET member since: June 2020Years in company: 7
Marc BusainPresident Americas
ET member since: July 2015Years in company: 25
Ronald den Elzen Chief Digital & Technology Officer
ET member since: March 2020Years in company: 26
Roland PirmezPresident AMEE
ET member since: July 2015Years in company: 26
Yolanda TalamoChief People Officer
ET member since: January 2021Years in company: 4
Magne SetnesChief Supply Chain Officer
ET member since: May 2020Years in company: 20
James ThompsonChief Commercial Officer
ET member from: March 2021Years in company: -
1. Previous experience in HEINEKEN 2012-2015

59
HEINEKEN growth algorithm
Continuous productivity
improvements
Superior growth
Raise the bar on Sustainability &
Responsibility and People strategy
Our unique strengths & opportunities
Long-term value creation
Deliver SUPERIOR top-line growth
RECOVERY to +/-17% operating margin by 2023
Gear for OPERATING LEVERAGE beyond
Acceleratedinvestments
& sharper resource
allocation

60
Phasing
Mitigate Grow & ExpandRecover & Build
2020-2021H1 2021H2 - 2023 2024 and beyond
Post pandemic top-line recoveryGrowth Pandemic revenue impact Superior growth
Productivity €2bn productivity programmeShort-term mitigation Operating leverage
Cost-conscious culture
Investments Restore M&S spend levels
Frontload D&T investment
Reduce all discretionary spend
Selective capex investments
Scale brand investment
Leverage D&T investment
S&R and People
Launch next level S&R programme
Build spiky capabilities
Health & safety focus
New team
S&R delivery
Networked organisation

61
Expand our aspiration
RONAReturn on Sales
HEINEKEN Golden Triangle
Green diamond
Growth
Sustainability & Responsibility
ProfitabilityCapital
efficiency
Revenue & Market
Share Growth
62
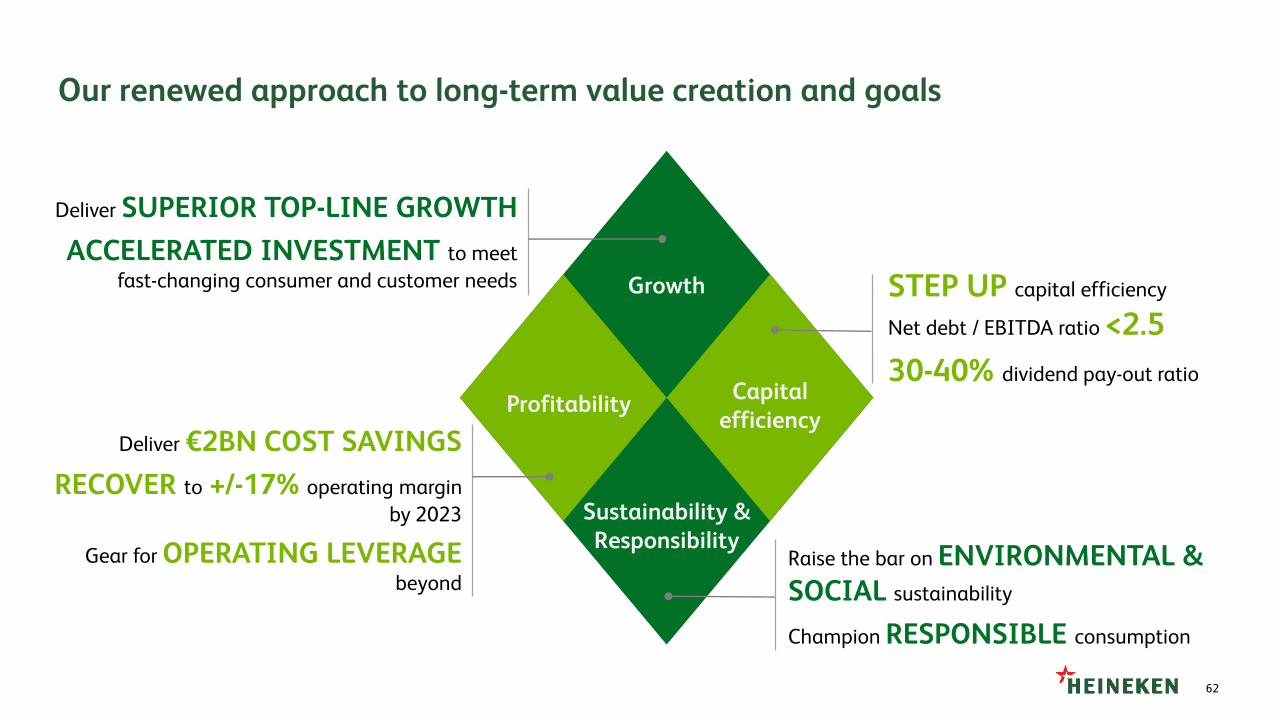
Our renewed approach to long-term value creation and goals
STEP UP capital efficiency
Net debt / EBITDA ratio <2.5
30-40% dividend pay-out ratio
Raise the bar on ENVIRONMENTAL & SOCIAL sustainability
Champion RESPONSIBLE consumption
Deliver €2BN COST SAVINGS
RECOVER to +/-17% operating margin
by 2023
Gear for OPERATING LEVERAGE beyond
Growth
Sustainability & Responsibility
ProfitabilityCapital
efficiency
Deliver SUPERIOR TOP-LINE GROWTH
ACCELERATED INVESTMENT to meet
fast-changing consumer and customer needs

63
Q&A
